1
raytest
AIDA 2D Thin Layer
Chromatography
User’s Manual
Part Number 2004 04 1.1
raytest
© 2004 r a y t e s t Isotopenmeßgeräte GmbH, Benzstr. 4, D-75334 Straubenhardt, Germany.
All rights reserved. This product or document is protected by copyright and distributed under licenses
restricting its use, copying, distribution and decompilation. No part of this product or document may be
reproduced in any form by any means without prior written authorization of r a y t e s t and its licensors, if
any.
RESTRICTED RIGHTS LEGEND: Use, duplication, or disclosure by the government is subject to restrictions
as set forth in subparagraph (c)(1)(ii) of the Rights in Technical Data and Computer Software clause at DFARS
252.227-7013 and FAR 52.227-19.
The product described in this manual may be protected by one or more U.S. patents, foreign patents, or pending
applications.
TRADEMARKS
AIDA, AIDA Image Analyzer,AIDA Annotation, AIDA AIDA Array Metrix, AIDA Array Compare, AIDA Multi
Labeling, AIDA 1D Evaluation, AIDA 1D Densitometry, AIDA 2D Densitometry, AIDA Easy Array, AIDA
Whole Body Autoradiography, AIDA 1D Thin Layer Chromatography and AIDA 2D Thin Layer
Chromatography are trademarks or registered trademarks of r a y t e s t in the United States and may be
protected as trademark in other countries.
All other product, service, or company names mentioned herein are claimed as trademarks and trade names by
their respective companies.
THIS PUBLICATION IS PROVIDED “AS IS” WITHOUT WARRANTY OF ANY KIND, EITHER
EXPRESS OR IMPLIED, INCLUDING, BUT NOT LIMITED TO, THE IMPLIED WARRANTIES OF
MERCHANTABILITY, FITNESS FOR A PARTICULAR PURPOSE, OR NON-INFRINGEMENT.
THIS PUBLICATION COULD INCLUDE TECHNICAL INACCURACIES OR TYPOGRAPHICAL
ERRORS. CHANGES ARE PERIODICALLY ADDED TO THE INFORMATION HEREIN, THESE
CHANGES WILL BE INCORPORATED IN NEW EDITIONS OF THE PUBLICATION.
r a y t e s t MAY MAKE IMPROVEMENTS AND/OR CHANGES IN THE PRODUCT(S) AND/OR
THE PROGRAMS(S) DESCRIBED IN THIS PUBLICATION AT ANY TIME.
Contents
raytest
1
Introduction
5
Overview . . . . . . . . . . . . . . . . . . . . . . . . . . . . . . . . . . . . . . . . . . . . . . . . . . . . . . . . . . . . 5
Starting 2D TLC . . . . . . . . . . . . . . . . . . . . . . . . . . . . . . . . . . . . . . . . . . . . . . . . . . . . . . 6
Create User Registration . . . . . . . . . . . . . . . . . . . . . . . . . . . . . . . . . . . . . . . . . . . . . . . . 7
2
Using 2D TLC
Data Windows in 2D TLC. . . . . . . . . . . . . . . . . . . . . . . . . . . . . . . . . . . . . . . . . . . . . .
Image Window in 2D TLC . . . . . . . . . . . . . . . . . . . . . . . . . . . . . . . . . . . . . . . . . . .
Contextual Menu of the Image Window . . . . . . . . . . . . . . . . . . . . . . . . . . . . .
Image Overlays . . . . . . . . . . . . . . . . . . . . . . . . . . . . . . . . . . . . . . . . . . . . . . . .
Region Report Window . . . . . . . . . . . . . . . . . . . . . . . . . . . . . . . . . . . . . . . . . . . . .
Data Description . . . . . . . . . . . . . . . . . . . . . . . . . . . . . . . . . . . . . . . . . . . . . . .
Contextual Menu of the Region Report Window . . . . . . . . . . . . . . . . . . . . . .
Region Calibration Window . . . . . . . . . . . . . . . . . . . . . . . . . . . . . . . . . . . . . . . . . .
Graphics Pane of the Regions Calibration Window . . . . . . . . . . . . . . . . . . . .
Contextual Menu of the Region Calibration Window. . . . . . . . . . . . . . . . . . .
Audit Trail Window . . . . . . . . . . . . . . . . . . . . . . . . . . . . . . . . . . . . . . . . . . . . . . . .
Additional Toolboxes in 2D TLC . . . . . . . . . . . . . . . . . . . . . . . . . . . . . . . . . . . . . . . .
2D TLC Calibration Toolbox . . . . . . . . . . . . . . . . . . . . . . . . . . . . . . . . . . . . . . . . .
Run Direction Panel. . . . . . . . . . . . . . . . . . . . . . . . . . . . . . . . . . . . . . . . . . . . .
Sample Definition Panel . . . . . . . . . . . . . . . . . . . . . . . . . . . . . . . . . . . . . . . . .
TLC Plate Definition Panel . . . . . . . . . . . . . . . . . . . . . . . . . . . . . . . . . . . . . . .
Origin/Front Panel . . . . . . . . . . . . . . . . . . . . . . . . . . . . . . . . . . . . . . . . . . . . . .
Region Determination Toolbox . . . . . . . . . . . . . . . . . . . . . . . . . . . . . . . . . . . . . . .
Region Creation Pane . . . . . . . . . . . . . . . . . . . . . . . . . . . . . . . . . . . . . . . . . . .
Integration Pane . . . . . . . . . . . . . . . . . . . . . . . . . . . . . . . . . . . . . . . . . . . . . . . .
Report Pane . . . . . . . . . . . . . . . . . . . . . . . . . . . . . . . . . . . . . . . . . . . . . . . . . . .
Region Label and Name Pane . . . . . . . . . . . . . . . . . . . . . . . . . . . . . . . . . . . . .
Actual Region Pane . . . . . . . . . . . . . . . . . . . . . . . . . . . . . . . . . . . . . . . . . . . . .
Region Calibration Toolbox . . . . . . . . . . . . . . . . . . . . . . . . . . . . . . . . . . . . . . . . . .
Method Pane . . . . . . . . . . . . . . . . . . . . . . . . . . . . . . . . . . . . . . . . . . . . . . . . . .
Standard Pane . . . . . . . . . . . . . . . . . . . . . . . . . . . . . . . . . . . . . . . . . . . . . . . . .
13
13
14
15
16
19
19
24
30
31
33
37
38
38
39
40
40
41
42
43
45
47
48
55
55
56
56
iii
raytest
Calibration Curve Pane . . . . . . . . . . . . . . . . . . . . . . . . . . . . . . . . . . . . . . . . . . 58
GLP Supporting Tools Toolbox . . . . . . . . . . . . . . . . . . . . . . . . . . . . . . . . . . . . . . . 60
Administration Pane. . . . . . . . . . . . . . . . . . . . . . . . . . . . . . . . . . . . . . . . . . . . . 61
Data Trail Settings Pane. . . . . . . . . . . . . . . . . . . . . . . . . . . . . . . . . . . . . . . . . . 62
Finish Evaluation Pane. . . . . . . . . . . . . . . . . . . . . . . . . . . . . . . . . . . . . . . . . . . 65
Region Names Pane . . . . . . . . . . . . . . . . . . . . . . . . . . . . . . . . . . . . . . . . . . . . . 66
Automatic Export Pane . . . . . . . . . . . . . . . . . . . . . . . . . . . . . . . . . . . . . . . . . . 66
Data Trailing Pane . . . . . . . . . . . . . . . . . . . . . . . . . . . . . . . . . . . . . . . . . . . . . . 67
Publishing Layout Toolbox in 2D TLC . . . . . . . . . . . . . . . . . . . . . . . . . . . . . . . . . . . . 68
Print Options for Region Report . . . . . . . . . . . . . . . . . . . . . . . . . . . . . . . . . . . . . . . 69
Print Options for Region Calibration . . . . . . . . . . . . . . . . . . . . . . . . . . . . . . . . . . . 69
Print Options for Audit Trail . . . . . . . . . . . . . . . . . . . . . . . . . . . . . . . . . . . . . . . . . . 70
Print . . . . . . . . . . . . . . . . . . . . . . . . . . . . . . . . . . . . . . . . . . . . . . . . . . . . . . . . . . . . . . . 71
Preview. . . . . . . . . . . . . . . . . . . . . . . . . . . . . . . . . . . . . . . . . . . . . . . . . . . . . . . . . . . . . 73
Export and Import . . . . . . . . . . . . . . . . . . . . . . . . . . . . . . . . . . . . . . . . . . . . . . . . . . . . 74
Exporting Templates . . . . . . . . . . . . . . . . . . . . . . . . . . . . . . . . . . . . . . . . . . . . . . . . 74
Exporting Region Report . . . . . . . . . . . . . . . . . . . . . . . . . . . . . . . . . . . . . . . . . . . . 75
Exporting Region Calibration . . . . . . . . . . . . . . . . . . . . . . . . . . . . . . . . . . . . . . . . . 78
Exporting Audit Trail . . . . . . . . . . . . . . . . . . . . . . . . . . . . . . . . . . . . . . . . . . . . . . . 80
Automatic Export of the Region Reports/Region Calibrations. . . . . . . . . . . . . . . . 81
Importing Region Calibration . . . . . . . . . . . . . . . . . . . . . . . . . . . . . . . . . . . . . . . . . 85
3
Performing 2D TLC Evaluations
87
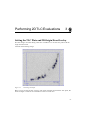
Setting the TLC Plate and 2D Origin/Fron Overlay . . . . . . . . . . . . . . . . . . . . . . . . . . 87
Assigning Regions . . . . . . . . . . . . . . . . . . . . . . . . . . . . . . . . . . . . . . . . . . . . . . . . . . . . 92
Using Arrays (Matrices). . . . . . . . . . . . . . . . . . . . . . . . . . . . . . . . . . . . . . . . . . . . . . . . 97
Defining a Background Signal . . . . . . . . . . . . . . . . . . . . . . . . . . . . . . . . . . . . . . . . . . 100
Performing Calibrations . . . . . . . . . . . . . . . . . . . . . . . . . . . . . . . . . . . . . . . . . . . . . . . 105
Using Nametables . . . . . . . . . . . . . . . . . . . . . . . . . . . . . . . . . . . . . . . . . . . . . . . . . . . 108
Creating and Editing Master Nametables . . . . . . . . . . . . . . . . . . . . . . . . . . . . . . . 109
Activating Master Nametables . . . . . . . . . . . . . . . . . . . . . . . . . . . . . . . . . . . . . . . 111
Exporting Master Nametables. . . . . . . . . . . . . . . . . . . . . . . . . . . . . . . . . . . . . . . . 112
Creating and Editing Work Nametables . . . . . . . . . . . . . . . . . . . . . . . . . . . . . . . . 114
Assigning Names to Regions . . . . . . . . . . . . . . . . . . . . . . . . . . . . . . . . . . . . . . . . 118
Audit Trail Logging . . . . . . . . . . . . . . . . . . . . . . . . . . . . . . . . . . . . . . . . . . . . . . . . . . 123
iv
AIDA 2D TLC User’s Manual
Introduction
1
raytest
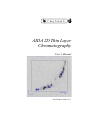
Overview
The AIDA 2D Thin Layer Chromatography module (henceforth „2D TLC“) was designed
for fast and efficient evaluation of signal images obtained from TLC plates, which have
been developed in one direction in a first step and in a direction perpendicular to that in a
subsequent step. At the beginning, the direction of the development is set for both steps.
Then the TLC plate is defined on the image and the origin and front line are defined. All
these steps can be performed using the mouse. However, these positions can also be
defined using the preferences settings or by entering the appropriate values with the
keyboard, which can be helpful for reproducible evaluations or to fasten the procedure for
similar samples.
Following this procedure, regions are defined around the signals from the various
compounds, which have been separated by the chromatography. The software provides
several region types like rectangle, ellipsis or polygon. You can also draw a line by hand
using the mouse to mark a region or get the region marked automatically by the software.
Regions at suitable positions are defined as background. If an absolute calibration is
needed, standards have to be measured for calculation of a calibration curve.
The results can be documented by a result report, which includes RF values for both
directions and activities, if a calibration of the measured image has been performed.
Additionally, all parts of the measured data and the evaluation can be printed out. It is
also possible to export the images and the result report to other software packages for
further data reduction.
5
1
raytest
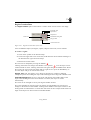
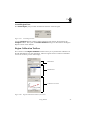
Starting 2D TLC
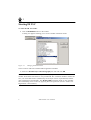
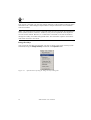
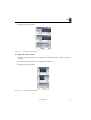
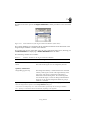
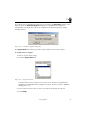
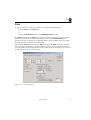
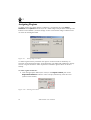
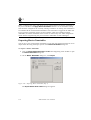
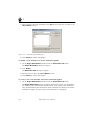
To select the 2D TLC mode:
1 Click the Evaluation button in the toolbar.
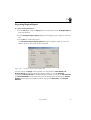
A dialog box appears offering you a list of available evaluation modes.
Figure 1-1
Changing Evaluation Mode
The list entries reflect the installed AIDA application modules.
2 Select the 2D Thin Layer Chromatography list item und click OK.
Note – This evaluation mode is only available if you purchased the AIDA 2D TLC
module. Note further that there are two possible 2D TLC evaluation modes in AIDA 2D
TLC, one with GLP features (indicated by the acronym “GLP” in parentheses) and the
other without those functionality. The 2D TLC (GLP) evaluation mode is only available
after establishing access control by applying the user registration (see the “Create User
Registration” section below).
6
AIDA 2D TLC User’s Manual
1
raytest
Create User Registration
Access control to AIDA might be required when working under Good Laboratory Practice
(GLP) conditions. AIDA provides three different types of users, a System Administrator,
Administrators and normal Users.
The System Administrator is a fixed account in AIDA which cannot be changed or
deleted. When no password is set for the System Administrator, the user registration in
AIDA is deactivated.
Administrators have the permission to create, modify and delete users or administrators.
For GLP relevant modifications of the program settings, general administrator rights are
required in AIDA.
Users can modify their own password. They have access to the normal functionality of
AIDA.
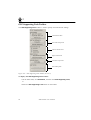
When the user registration is activated, you must type your user name and password
before you get access to the program.
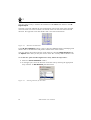
Figure 1-2
AIDA Registration Login Dialog Box
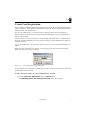
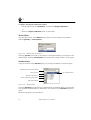
To activate the user registration in AIDA the first time, you must enter a password for the
system administrator account.
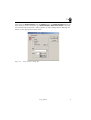
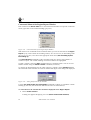
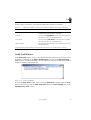
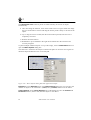
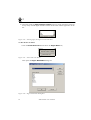
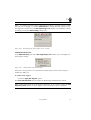
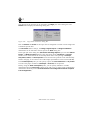
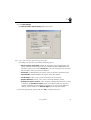
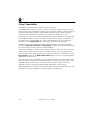
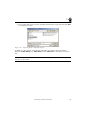
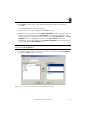
To enter the password for the system administrator account:
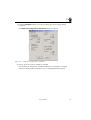
1 Choose Create User Registration from the Options menu.
The AIDA Registration User Management Setup dialog box appears.
Introduction
7
1
raytest
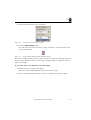
2 Type a password for the system administrator account in the Password text field of
the Aida Registration User Management Setup dialog box and confirm the new
password by retyping it in the Confirm Password field.
Figure 1-3
Entering Administrator Password
3 Click OK to apply the changes.
Now the user registration is activated and only registered operators have access to
the program.
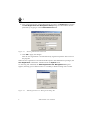
When the user registration is activated and the operator has administrator privileges, the
User Registration command is selectable from the Options menu.
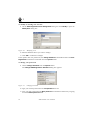
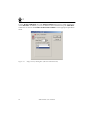
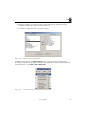
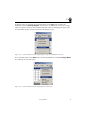
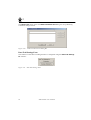
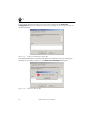
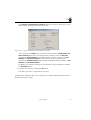
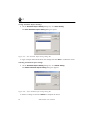
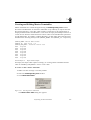
On choosing this command, the AIDA Registration User Management dialog box
appears, allowing you to add new users or to modify or delete existing user accounts.
Figure 1-4
8
AIDA Registration User Management Dialog Box
AIDA 2D TLC User’s Manual
1
raytest
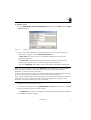
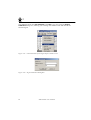
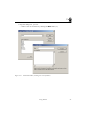
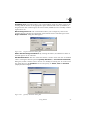
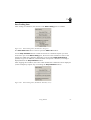
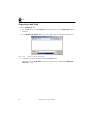
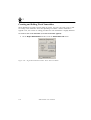
To add new users:
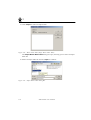
1 On the AIDA Registration User Management dialog box click Add to open the Add
User dialog box.
Figure 1-5
Adding Users
2 Type a user name, full name, and password for the new user, and confirm the
password by retyping it in the Confirm password field.
A User name can consist of up to 31 characters and must be unique in the
registration database.
The Full name is used whenever the program has to display the name of the
operator (e.g. on print outs). It cannot be longer than 63 characters.
The user’s Password must contain at least 4 characters (maximum 8 characters).
Note – In previous AIDA releases, the Password text field allowed to enter passwords
with more than 8 characters without warning you, that internally only the first 8
characters of the password are processed.
In this release, the behavior of the text field has been adjusted to reflect this fact properly
by restricting the input of password to at least 4 and at most 8 characters.
Users, whose old password exceeds 8 characters can use the first 8 characters of the old
password as a valid new password without changing anything else (just type in the
characters until the text field warns you with a beep).
3 Specify the user’s permission level.
Currently two permission levels, Administrator and User (see above), are available.
4 Enter an optional comment for the account.
The Comment for a user account appears only within the user registration database.
5 Click OK to apply the changes.
Introduction
9
1
raytest
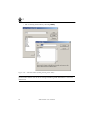
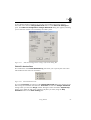
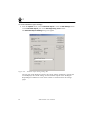
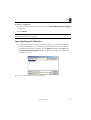
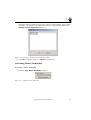
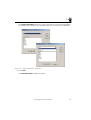
To modify an existing user account:
1 On the AIDA Registration User Management dialog box click Modify to open the
Modify User dialog box.
Figure 1-6
Modifying Users
2 Edit the database entries you want to change.
3 Click OK to confirm the changes.
If the operator has user permission, the Change Password command instead of the User
Registration command is selectable from the Options menu.
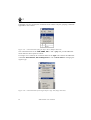
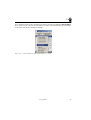
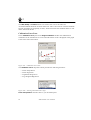
To change your password:
1 Choose Change Password from the Options menu.
The Change AIDA Registration Password dialog box appears.
Figure 1-7
Changing Password
2 Type your current password in the Old password text box.
3 Type your new password in the New password text field and confirm it by retyping
it in the Confirm password field.
10
AIDA 2D TLC User’s Manual
1
raytest
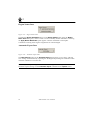
4 Click OK to apply the changes.
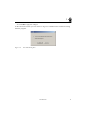
At the end of the session you can choose to log on as a different user instead of exiting
from the program.
Figure 1-8
Exit Aida Dialog Box
Introduction
11
1
raytest
12
AIDA 2D TLC User’s Manual
Using 2D TLC
2
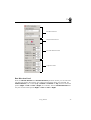
raytest
Data Windows in 2D TLC
In addition to the AIDA standard data windows Image and Histogram the following data
windows are available in the 2D TLC mode:
• Region Report
• Region Calibration
• Audit Trail
You can access these data windows by choosing the appropriate entry (2D Region
Report, Region Calibration or Audit Trail respectively) from the View menu.
Figure 2-1
View Menu
13
2
raytest
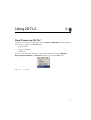
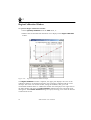
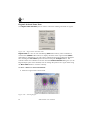
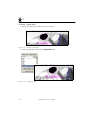
Image Window in 2D TLC
All data are evaluated from the Image window. Although it might not always be on top,
it is always open. The title bar of the Image window shows the full file path of the image.
Figure 2-2
Image Window Example
You can copy the content of the Image window to the clipboard using the Copy Content
command of the Edit menu. See the “Export Image” section in the “AIDA Image
Analyzer Basic Concepts and Features User's Manual” for further explanation.
14
AIDA 2D TLC User’s Manual
2
raytest
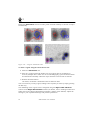
Contextual Menu of the Image Window
In 2D TLC, the contextual menu of the Image window looks slightly different depending
on the type of overlay, you have chosen:
Single Selection:
If you have selected a single overlay
(region) only, the contextual menu, that
opens after right-clicking the respective
object, provides you with the possible
commands for this specific selection
mode in addition to the standard editing
functions like Cut, Copy, Paste, Delete
and Duplicate. These include commands
for labeling regions and setting
integration limits.
Multiple Selection:
If you have selected multiple overlays
(regions), the resulting contextual menu
is considerably reduced (compared with
the single selection contextual menu),
showing only those commands
available in this selection mode. The
provided menu items form a subset of
the functions available in the single
selection mode.
Figure 2-3
Figure 2-4
Contextual Menu
(Single Object Selected)
Using 2D TLC
Contextual Menu
(Multiple Objects Selected)
15
2
raytest
If no region is selected, only the basic editing functions of the standard contextual menu
described in the “AIDA Image Analyzer Basic Concepts and Features User's Manual”
will be accessible.
Note – All of the functions in these contextual menus are also accessible through different
means (menus, buttons, toolboxes, windows). They will be explained in the respective
sections of this manual. However, it is often more convenient to activate the function
through the readily accessible background menu. This will make repetitive and routine
tasks faster and more convenient.
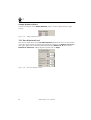
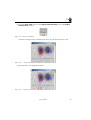
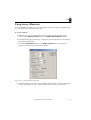
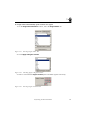
Image Overlays
You can specify the label type and font you want to apply to the region overlays (lanes
and bands) using the Image Overlays command of the Options menu.
Figure 2-5
16
Options Menu: Opening the Image Overlays Dialog Box
AIDA 2D TLC User’s Manual
2
raytest
After choosing Image Overlays from the Options menu, the Image Overlays dialog box
opens allowing you to specify the type (None, Number, Name, Free Choice), font, font
size, and font style (bold, italic, roman typeface on white background) for labeling. For
details, see the appropriate sections below.
Figure 2-6
Image Overlays Dialog Box
Using 2D TLC
17
2
raytest
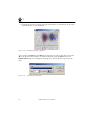
Use the 2D TLC Calibration tab of the Image Overlays dialog box to enable the drawing
of the Rf Fronts. In addition, you can set the font size of the label using the Label Size
combo box as well as the Location of the Corner's Labels via the appropriate pull-down
menu.
Figure 2-7
18
Image Overlays Dialog Box (2D TLC Calibration Tab)
AIDA 2D TLC User’s Manual
2
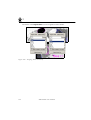
raytest
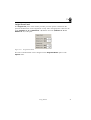
Region Report Window
All information about the evaluation of the assigned regions can be found and configured
to the specific needs in the Region Report.
The Region Report window is shown by clicking this button
in the Region
Determination toolbox or by choosing 2D Region Report from the View menu.
Figure 2-8
Region Report Window
Data Description
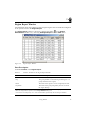
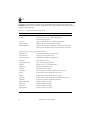
Available Columns in the Region Report:
Table 2-1
Columns Available in the Region Report Window
Column
Short Description
No
The number of the region.
Grp
The group number to which the region belongs (0 = no
group selected for this region).
Name
The name of the region as it was assigned by the user.
Grp Name
The name of the group assigned by the user to which
the region belongs.
signal unit and length unit = units of measurement, depending on the type of the imaging device used to
obtain the image and the options set in the Image Attributes dialog box.
concentration unit and quantity unit = unit of measurement, specified by the user through calibration.
Using 2D TLC
19
2
raytest
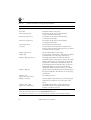
Table 2-1
Columns Available in the Region Report Window
Column
Short Description
Type
The type of the region (e. g. bkg – background)
Int. Limits
Integration limits for the region.
Position [length unit]
The position of the region as determined by
x and y coordinates in the image.
Position X [length unit]
The position of the region as determined by
x coordinate in the image
Position Y [length unit]
The position of the region as determined by
y coordinate in the image
Area [length unit 2]
The calculated area of the region .
Area [%]
The percentage of the region area compared to the
reference row in the group of the region (e. g. the sum of
all evaluated areas in a group).
Integral [signal unit]
The calculated intensity of the region .
Integral [%]
The percentage of the intensity of the region compared
to the reference row in the group of the region.
Integral – Bkg [signal unit]
The background intensity is subtracted from the
calculated intensity of the region to result in the signal
intensity of the region. For each group of regions the
background is determined in the following order: the
local background area around the region, or the local
background defined for the group, or the general
background defined in group 0, whatever is available.
Integral – Bkg [%]
The percentage of the background corrected intensity of
the region compared to the reference row in the group
of the region.
Integral / Area
[signal unit / length unit 2]
The intensity per area.
Integral / Area [%]
The percentage of the intensity per pixel of the region
compared to the reference row in the group of the
region.
Integral / Area – Bkg
[signal unit / length unit 2]
The background intensity is subtracted from the
calculated intensity of the region and this signal
intensity is divided by the area.
signal unit and length unit = units of measurement, depending on the type of the imaging device used to
obtain the image and the options set in the Image Attributes dialog box.
concentration unit and quantity unit = unit of measurement, specified by the user through calibration.
20
AIDA 2D TLC User’s Manual
2
raytest
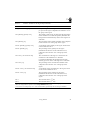
Table 2-1
Columns Available in the Region Report Window
Column
Short Description
Integral / Area – Bkg [%]
The percentage of the background-corrected intensity
per pixel of the region compared to the reference row in
the group of the region.
Std. Quantity [quantity unit]
The quantity of the region, as entered for the calculation
of the standard curve. With the Quantity Standards the
background corrected Intensity values of the regions are
calibrated.
Std. Quantity [%]
The percentage of the quantity standard value compared
to the reference row in the group of the region.
Recalc. Quantity [quantity unit]
A calculation of the quantity in the region, based on the
current calibration curve.
Recalc. Quantity [%]
The percentage of the quantity for the region
(determined on the basis of the calibration curve)
compared to the reference row in the group of the
region.
Std. Conc. [concentration unit]
The concentration of the region, as entered for the
calculation of the standard curve. With the
Concentration Standards the background corrected
Intensity per Area values of the regions are calibrated.
Std. Conc. [%]
The percentage of the concentration standard value
compared to the reference row in the group of the
region.
Recalc. Conc. [concentration unit]
A calculation of the concentration in the region, based
on the current calibration curve.
Recalc. Conc. [%]
The percentage of the quantity for the region
(determined on the basis of the calibration curve)
compared to the reference row in the group of the
region .
RF-1
The retention factor (1st run)
RF-2
The retention factor (2nd run)
signal unit and length unit = units of measurement, depending on the type of the imaging device used to
obtain the image and the options set in the Image Attributes dialog box.
concentration unit and quantity unit = unit of measurement, specified by the user through calibration.
Using 2D TLC
21
2
raytest
If GLP support is turned on, the following additional columns are available:
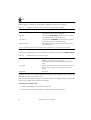
Table 2-2
Additional Columns in the Region Report (GLP Support Enabled)
Column
Short Description
Name ID
The (unique) identifier for the Name of the region as
defined in the general master nametable.
User ID
The user ID (Login Name) of the user who recorded
the region (creation or last modification)
User Name
The user name (Full Name) of the user who recorded
the region (creation or last modification)
Date and Time
Date and time when the region was recorded (creation or
last modification)
The date and time format complies with the ISO 8601 specification (yyy-mm-dd hh:mm:ss+/-hh:mm).
The following additional rows can be found or created exclusively in the Region Report:
Table 2-3
Additional Rows in the Region Report
Sum
Displays the scientifically correct sum for the selected
column (e. g. Σ (Intensity / Area), means
Σ Intensities / Σ Areas). Different groups get individual
sums.
Ttl (Total)
Displays the values of the selected column of Ttl region
in the group. For group 0 the Ttl region is the entire
image.
Remainder
Ttl − Sum
Quantity results in italics indicate that they lay outside of the calibration curve values and
therefore are prone to significant error.
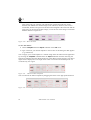
You can select the number and type of columns you want to display using the contextual
menu of any column in the window (see below).
To change the column order:
1 Click the heading of the column to be moved.
2 Press the mouse button and drag to the desired position in the table.
22
AIDA 2D TLC User’s Manual
2
raytest
3 Release the mouse button.
Figure 2-9
Changing Column Order
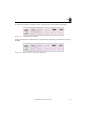
To change the column width:
1 Position the mouse pointer over the border of the column whose width you want to
change.
2 Click and drag the border in the appropriate direction.
3 Release the mouse button:
Figure 2-10
Changing Column Width
Using 2D TLC
23
2
raytest
Contextual Menu of the Region Report Window
Each column in the Result Table has a contextual menu attached. To open the contextual
menu, right-click on the column heading (gray area).
Figure 2-11
Contextual Menu of the Region Report Window
With the first two commands of the contextual menu, you can sort the table of the Region
Report by any value column in ascending order (A to Z or zero to 9) or descending order
(Z to A or 9 to zero). Just choose the appropriate menu item (Sort Ascending by/Sort
Descending by).
The Select/Unselect commands of the contextual menu are used to select/deselect a
column to export. The column heading of selected columns are highlighted.
To hide a column, select the Hide command from its contextual menu. You can recover
hidden columns using the Select Columns command (see below).
To specify the decimal digits for the value output in a column, choose Settings of from
the contextual menu and enter the value for the decimal digits in the dialog box displayed.
Figure 2-12
Setting Output Format for Columns
Use the One-lined Header/Two-lined Header command to reduce or expand the column
heading by one line (the second line indicates the units of measurement).
To select/deselect the columns that should be displayed in the Region Report:
1 Choose Select Columns.
A dialog box appears displaying two lists (Show Columns/Hide Columns).
24
AIDA 2D TLC User’s Manual
2
raytest
2 Select the columns you want to show or hide and click the appropriate arrow
symbol to transfer the items between the two lists.
3 To deselect a particular item, just click it again.
Figure 2-13
Columns Selection Dialog Box
In addition, each cell of the Region Report has its own contextual menu attached,
providing commands for grouping of regions and standards as well as displaying/hiding
of the special row types Sum, Total, Remainder.
Figure 2-14
Contextual Menu of a Single Region Report Row
Using 2D TLC
25
2
raytest
If multiple rows are selected, the contextual menu contains only the grouping commands
applicable in this context.
Figure 2-15
Contextual Menu of Region Report Rows (Multiple Selection)
The contextual menus of the TYPE, NAME, STD. ~ and ~ [%] cells provide additional
menu items for their respective context:
If a single row is selected, the contextual menu of the Type cells contains the additional
commands Set as Normal, Set as Background as well as Set as Total for changing the
region's type.
Figure 2-16
26
Contextual Menu of the Region Report’s Type Cell (Single Selection)
AIDA 2D TLC User’s Manual
2
raytest
If multiple rows are selected, the contextual menu of the Type cells contains the
additional command Average Regions, which inserts an additional row for the average
values of regions. The three above-mentioned menu items for changing the region type
are unavailable in this context and therefore displayed in gray.
Figure 2-17
Contextual Menu of the Region Report’s Type Cell (Multiple Selection)
The contextual menu of the Name cells contains the additional command Change Name
for renaming the selected region.
Figure 2-18
Contextual Menu of the Region Report’s Name Cell
Using 2D TLC
27
2
raytest
The additional menu item Set Standard of the Std.~ row cells opens the Region
Calibration dialog box, allowing you to change the standard value and unit for the
selected region.
Figure 2-19
Contextual Menu of the Region Report’s Std. Row Cell
Figure 2-20
Region Calibration Dialog Box
28
AIDA 2D TLC User’s Manual
2
raytest
The contextual menu of cells containing percentages provides an additional Set to 100 %
item, used to set the value of the selected cell to 100 % and recalculating the percentages
of all other rows in this column accordingly.
Figure 2-21
Contextual Menu of the Region Report’s %. Cells
Using 2D TLC
29
2
raytest
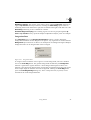
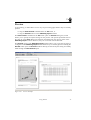
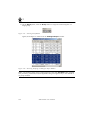
Region Calibration Window
To open the Region Calibration window:
• Choose Quantity Calibration from the View menu, or
• Double-click the miniaturized calibration curve display on the Region Calibration
toolbox.
Figure 2-22
Region Calibration Window Example
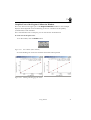
The Region Calibration window is bipartite, the upper pane displays the curve of the
calibration function, the underlying function, the correlation coefficient and the x-axis
intercept. The lower one contains a table, listing the standards, their given and
recalculated standard values etc. Additional columns can be displayed. Just right-click on
the table heading and choose the Select Columns command from the contextual menu,
that appears. The Columns Selection dialog box opens, allowing you to select the desired
columns from the list.
30
AIDA 2D TLC User’s Manual
2
raytest
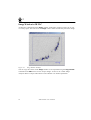
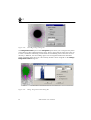
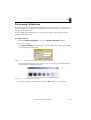
Graphics Pane of the Regions Calibration Window
The curve shown in the upper part of the Region Calibration window in this example
displays the background-corrected intensity per area as a function of the quantity
(concentration) of the standard.
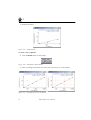
For a more detailed view of the plot, you can activate the zoom function:
To zoom one of the plot’s axis:
1 On the toolbar, click the Select button.
Figure 2-23
Select Button (Main Toolbar)
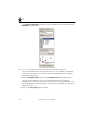
2 Click and drag one of the axis with the left mouse button pressed.
Figure 2-24
Clicking and Dragging the X-Axis
Using 2D TLC
31
2
raytest
3 Release the button
Figure 2-25
Zoomed Graph
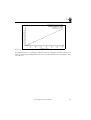
To zoom a curve segment:
1 Click the Zoom button on the toolbar.
Figure 2-26
Zoom Button (Main Toolbar)
2 Draw a rectangle around the area of the plot you want to see in more detail.
Figure 2-27
32
Specifying the Area to be Zoomed
AIDA 2D TLC User’s Manual
2
raytest
3 Release the button.
Figure 2-28
Zoomed Curve Segment
Contextual Menu of the Region Calibration Window
The contextual menu of the upper pane of the Region Calibration window contains two
commands: Scales and Grid.
Figure 2-29
Contextual menu of the Region Calibration Window (Graphics Pane)
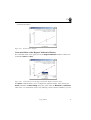
The Scales command allows you to configure the graphical output. After clicking the
Scales command, the Data Scaling dialog box opens. Here the Minimum and Maximum
value of the x- (Concentration) and y-axis (Intensity) can be selected. In addition, you can
Using 2D TLC
33
2
raytest
turn on logarithmic representation and automatic scaling of either axis separately by
clicking the appropriate option (Logarithmic and Automatic) below the Minimum and
Maximum spin boxes.
Figure 2-30
Data Scaling Dialog Box (Region Calibration Window)
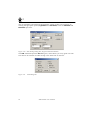
The Grid command opens the Grid dialog box, which allows you to lay grids over both
axis that are an extension of either the big or the small ticks on the axes.
Figure 2-31
34
Grid Dialog Box
AIDA 2D TLC User’s Manual
2
raytest
The table in the lower part of the Region Calibration window provides its own contextual
menu:
Figure 2-32
Contextual Menu of the Region Calibration Window (Table Pane)
The column headings are equipped with the standard contextual menus described in the
“Region Report Window” section of this manual.
If you right-click on any of the table rows, the row's contextual menu opens, allowing you
to Select Columns for displaying or Delete Standards from the table.
The following columns are available:
Table 2-4
Columns Available in the Region Calibration Window
Columns
Short Description
No
The number of the region
Name
The name of the region as it was assigned by the user.
Quantity Calibration
Integral-Bkg [signal unit]
The background intensity is subtracted from the calculated
intensity of the region to result in the signal intensity of the
region. For each group of regions the background is
determined in the following order: the local background
area around the region, or the local background defined for
the group, or the general background defined in group 0,
whatever is available.
signal unit and length unit = units of measurement, depending on the type of the imaging device used to
obtain the image and the options set in the Image Attributes dialog box.
concentration unit and quantity unit = unit of measurement, specified by the user through calibration
unit = quantity or concentration unit of measurement, depending on the argument
Using 2D TLC
35
2
raytest
Table 2-4
Columns Available in the Region Calibration Window
Columns
Short Description
Std. Quantity [quantity unit]
The quantity of the region, as entered for the calculation of
the standard curve. With the Quantity Standards the
background corrected Intensity values of the regions are
calibrated.
Recalc. Quantity [quantity unit]
A calculation of the quantity in the region, based on the
current calibration curve.
Concentration Calibration
Integral / Area – Bkg
[signal unit / length unit 2]
The background intensity is subtracted from the calculated
intensity of the region and this signal intensity is divided
by the area.
Std. Conc. [concentration unit]
The concentration of the region, as entered for the
calculation of the standard curve. With the Concentration
Standards the background-corrected Intensity per Area
values of the regions are calibrated
Recalc. Conc.
[concentration unit]
A calculation of the concentration in the region, based on
the current calibration curve.
Difference [unit]
The difference without sign between the entered standard
and the recalculated value.
Rel. Deviation [%]
The relative difference with sign of the entered standard
and the recalculated value compared to the standard value
(= Deviation / Std. Conc. [Std. Quantity]).
Deviation [unit]
The difference with sign between the entered standard and
the recalculated value (Recalc. Conc. [Recalc. Quantity] –
Std. Conc. [Std. Quantity]).
Rel. Error [%]
The relative difference without sign of the entered standard
and the recalculated value compared to the standard value
(= Difference / Std. Conc. [Std. Quantity]).
signal unit and length unit = units of measurement, depending on the type of the imaging device used to
obtain the image and the options set in the Image Attributes dialog box.
concentration unit and quantity unit = unit of measurement, specified by the user through calibration
unit = quantity or concentration unit of measurement, depending on the argument
36
AIDA 2D TLC User’s Manual
2
raytest
If GLP support is turned on, the following additional columns are available:
Table 2-5
Additional Columns in the Region Calibration Window (GLP Support Enabled)
Column
Short Description
Name ID
The (unique) identifier for the Name of the region as
defined in the general master nametable.
User ID
The user ID (Login Name) of the user who recorded
the region (creation or last modification)
User Name
The user name (Full Name) of the user who recorded
the region (creation or last modification)
Date and Time
Date and time when the region was recorded (creation or
last modification)
The date and time format complies with the ISO 8601 specification (yyy-mm-dd hh:mm:ss+/-hh:mm).
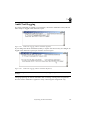
Audit Trail Window
In the Audit Trail window you can view all GLP relevant changes to the currently active
evaluation (as defined via the Data Trail Settings for controls of the GLP Supporting
Tools toolbox), including timestamp, user-id, evaluation status and reasons for evaluation
changes indicated by the current user.
Figure 2-33
Audit Trail Window
To open the Audit Trail window, either choose the Audit Trail command from the View
menu, or alternatively click the View Audit Trail button in the Data Trailing pane of the
GLP Supporting Tools toolbox.
Using 2D TLC
37
2
raytest
Additional Toolboxes in 2D TLC
In addition to the standard AIDA toolboxes Display Control and Publishing Layout, the
following toolboxes become available after selecting the 2D TLC mode.
• TLC Calibration
• Region Determination
• Region Calibration
• GLP Supporting Tools
You can access these additional toolboxes from the Evaluation menu or by clicking the
appropriate button on the toolbar.
Figure 2-34
Mapping between Evaluation Menu Entries and Toolbar Buttons
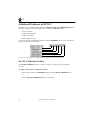
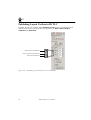
2D TLC Calibration Toolbox
The 2D TLC Calibration toolbox is used to set the TLC plate and the origin/front
overlays.
To display the 2D TLC Calibration toolbox:
• On the main menu, click Evaluation and choose the 2D TLC Calibration entry.
or
• Click the 2D TLC Calibration button on the toolbar.
38
AIDA 2D TLC User’s Manual
2
raytest
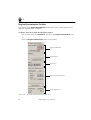
Run Direction Panel
Sample Definition Panel
TLC Plate Definition Panel
Origin/Front Panel
Run Direction Panel
From the 1st Run Direction and 2nd Run Direction pull-down menus you can select the
run directions used to develop the TLC plate from which the image was obtained. For
1st Run Direction, two vertical (Top -> Bottom and Bottom -> Top) and two horizontal
options (Right -> Left and Left -> Right) are available, whereas 2nd Run Direction has
only the two horizontal options Right -> Left and Left -> Right.
Using 2D TLC
39
2
raytest
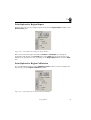
Sample Definition Panel
Use the two buttons of the Sample Defintion panel to create or delete the TLC plate
overlay.
Figure 2-35
Sample Definition Panel
TLC Plate Definition Panel
The various combo boxes of the TLC Plate Definition panel allow you to set the position
of the TLC plate overlay by entering the appropriate values for the Position of Corner A
(the upper right corner of the plate) and the horizontal (Distance A - B) and vertical
Dimensions (Distance A - D) of the plate together with its Angle.
Figure 2-36
40
TLC Plate Definition Panel
AIDA 2D TLC User’s Manual
2
raytest
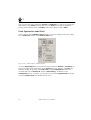
Origin/Front Panel
The Origin/Front panel of the toolbox provides you with options to determine the
position and dimension of the origin/front overlay. Enter the appropriate values for the
origin (Distance A - E and Distance A - G) and the front line (Distance G - H and
Distance E - F) of the plate.
Figure 2-37
Origin/Front Panel
The units of measurement can be changed via the Image Attributes option of the
Options menu.
Using 2D TLC
41
2
raytest
Region Determination Toolbox
The controls of the Region Determination toolbox allow you to define regions in the
image for signal intensity evaluation.
To display the Lane & Peak Determination toolbox:
• On the main menu, click Evaluation and choose the Region Determination entry.
or
• Click the Region Determination button on the toolbar.
Region Creation Pane
Integration Pane
Report Pane
Region Label and Name Pane
Actual Region Pane
Figure 2-38
42
Region Determination Toolbox (Overview)
AIDA 2D TLC User’s Manual
2
raytest
Region Creation Pane
The Region Creation pane of the toolbox is used to mark various areas in the image.
Rectangle Tool
Square Tool
Ellipse Tool
Circle Tool
Freehand Drawing Tool
Polygon Tool
AutoContour Tool
Figure 2-39
Region Creation Pane (Overview)
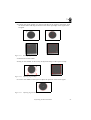
Areas of different shapes (rectangles, squares, ellipses and circles) can be marked.
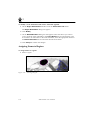
To create a region:
1 Click on the symbol of the desired shape.
2 Click at the upper left corner of the area, hold down the mouse button and drag it to
the desired lower right end of the shape.
3 Release the mouse button.
The area can be reshaped by moving the handles
.
Clicking within the area changes the handles to this symbol
, now the object can be
rotated around its center. Clicking within the area again changes the handles back. When
the overlay has received its final shape and tilt, right-click or press the ENTER key to
save the object and go on with the next action.
Polygon Tool: This Tool allows you to draw an enclosure by clicking at multiple
subsequent points surrounding the object and finalizing the encircling with a double-click.
Freehand Drawing Tool: Click at a start point and drawing the outside shape of the
object while holding down the mouse button. On release, the object is closed
automatically.
The areas can be changed in size by moving the handles around.
The corner handles are used for total size change, the side handles are used for size
changes in the direction of the handle. Clicking in the middle of the object switches to the
turning mode as outlined above. A third click will switch to the re-shape modus where all
edges of the object are shown with an individual handle.
Using 2D TLC
43
2
raytest
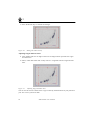
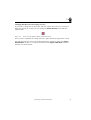
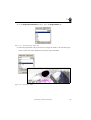
The AutoContour Tool connects pixels of similar intensity to encircle an object
automatically:
1 After activating the function, click on the border area of a region within the image
that you would like to encircle and drag the mouse pointer slowly to the side of the
object.
2 Try to drag the cursor around (with the mouse button pressed) until the area is
completely encircled.
3 Release the mouse button.
4 Remember to press ENTER or the right mouse button after the area has been
correctly assigned.
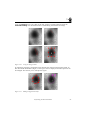
To place multiple identical objects on top of the image, use the Create Matrix button to
open the Matrix Options dialog box.
This function is useful for the analysis of multi-well plates or dot blots were signals of
identical shape and distance have to be analyzed.
Figure 2-40
Matrix Options Dialog Box With Application Example
Dimension: In the Dimension pane of the Matrix Options dialog box you can enter the
number of objects to be created in x- (Lines) and y-(Column) direction of the matrix.
Center Distance: In the Center Distance part of the dialog box enter the Vertical and
Horizontal distance (mid to mid) between objects in the matrix.
44
AIDA 2D TLC User’s Manual
2
raytest
Numbering Options: The regions in the matrix can be numbered By Lines (from left to
right) or By Column (from top to bottom). Clicking the Alternating option results in
numbering the first line from left to right, the second line from right to left and so on. The
Alternating numbering is also available for columns.
Automatic Region Grouping: The resulting regions can also be grouped together By
Lines or By Columns if they represent multiple independent analysis points for example.
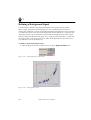
Integration Pane
The Integration pane of the Region Determination toolbox is used to define the
background calculation for the integration of regions. Any region that is marked with the
Background option turned on is taken as an example for the background signal. Multiple
background areas can be assigned and will be averaged.
Figure 2-41
Integration Pane
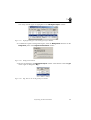
To assign a frame around the active region as a local background, select the checkbox
next to the Local Bkg button. The general background calculated by the Background
function is ignored for regions that have a local background assigned to them. This
function is not advised for blurred spots of usual 2D gel applications because part of the
actual sample might be mistaken for local background. Clicking the Local Bkg button
opens the Local Bkg Settings dialog box, where a shape and size (in pixels) can be
selected for the local background frame.
Using 2D TLC
45
2
raytest
Figure 2-42
Local Bkg Settings Dialog Box
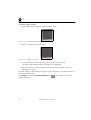
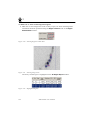
The Integration Limits option of the Integration pane allows you to integrate only those
pixels that lie within a defined intensity range. Thus a region that has some noise (dirt) on
it. This is useful for eliminating cavities from the surrounding tissue. Since the level of
intensity is different, the surrounding region can be integrated without the unwanted
signal originating from the cavity. The intensity borders can be assigned via the Change
Integration Limits dialog box.
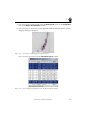
Figure 2-43
46
Change Integration Limits Dialog Box
AIDA 2D TLC User’s Manual
2
raytest
The intensity histogram is used to set the lower (left) and upper (right) intensity levels
that will be used for the integration. This is done by dragging the vertical black lines from
the right and left end of the histogram to the desired position, or by entering the
appropriate values in the designated fields (Lower Limit, Upper Limit). As a consequence
the pixels that have a lower intensity or a higher intensity than the designated integration
area (peaks on the left or right of the margins shown in the example) will not be used for
integration. The choice of coloring the Integrated Area or the Non-integrated area to
visualize the effect can be selected in the Use Colors for field.
Report Pane
The Report pane of the Region Determination toolbox is used to activate and configure
the report that summarizes the integration results.
Region Report Button
Renumbering Tool
Ungroup Button
Config Table Header Button
Figure 2-44
Group Button
Report Pane
Clicking the Region Report button activates the display of the report (same as the Region
Report function in the View menu).
With the Config Table Header button the table header name for the columns Integral,
Integral/Area, Quantity can be configured.
The following three buttons are used to group, ungroup and renumber (in this order)
groups and regions. Every area can only belong to one group. Grouped areas will get a
common summary line at the end of all integrated regions in the region report:
Groups can be formed by selecting multiple regions and clicking the Group button.
Selected regions can be removed from their group by selecting the Ungroup button.
Using the Renumbering Tool, all groups are renumbered in sequential order. This avoids
gaps in numbers which are caused by ungroup processes.
Using 2D TLC
47
2
raytest
Region Label and Name Pane
The Region Label and Name pane is used to control the labeling and name of regions.
Figure 2-45
Region Label and Name Pane
Region Label tab: You can turn off labeling (None radio button), select a number as
current label (Number radio button) or display the name of the region instead (Name
radio button). Alternatively you can select a label freely from the column list displayed
after clicking the Free Choice option and then clicking the Configure button. The
contents of this list is identical to the one from the Columns Selection dialog box (cf. the
Region Report pane of this manual).You can change the position of a region label using
the Move Label button to increase visibility:
To move a label to a desired destination:
1 Select the region with a mouse click.
Figure 2-46
48
Selecting Region
AIDA 2D TLC User’s Manual
2
raytest
2 Click the Move Label button on the Region Label and Name pane of the Region
Determination toolbox.
Figure 2-47
Move Label Button
The label of the previously selected region turns its color from magenta to red.
Figure 2-48
Activated Label
3 Drag the label to its designated location.
Figure 2-49
Moving Label
Using 2D TLC
49
2
raytest
4 Confirm the action by clicking the right mouse button, or alternatively by pressing
the ENTER key on your keyboard.
Figure 2-50
Label Repositioning Confirmed
You can select the Font type and Size of the characters as well as their font style (bold
(B), italic (I) and roman typeface on white background) using the Font button. The
Choose Font dialog box is displayed, allowing you to specify the font options for the
label.
Figure 2-51
50
Choosing Font Properties
AIDA 2D TLC User’s Manual
2
raytest
The regions can be renumbered if necessary by activating the Renumber function. This
function opens the Renumber Regions dialog box. The numbers are displayed
subsequently in a combo box and can be assigned to the desired regions by simply
clicking on them.
Figure 2-52
Renumber Regions Dialog Box
The Region Name tab controls are used to assign names to the various regions.
To assign names to regions:
1 Select a region on the image.
2 Click the Region Name tab.
Figure 2-53
Region Name Tab
Common names can be entered via a text box into a list that can facilitate the
designation of redundant names ('Negative Control', 'Positive Control', 'Standard',
'Background', etc.).
3 Type a name in the text box or select one from the list below the text box.
4 Click Assign.
Using 2D TLC
51
2
raytest
5 (Optional) Click the Apply at Region Creation option to assign the names in the list
to any newly created region one after another in the order of their appearance in the
list.
Figure 2-54
Selecting Apply at Region Creation Checkbox
To edit the list of names:
• Click the Select Name List button below the Region Name tab,
Figure 2-55
Select Name List Button
This opens the Region Nametables dialog box.
Figure 2-56
52
Region Nametables Dialog Box
AIDA 2D TLC User’s Manual
2
raytest
Using this dialog box, you can:
• create a new list of names by clicking the New button, or,
Figure 2-57
Nametable Editor (Creating New List of Names)
Using 2D TLC
53
2
raytest
• edit an existing name table by choosing Modify.
Figure 2-58
Nametable Editor (Editing Existing Name Table)
Note – If a master nametable is applied, the procedure is slightly different from the one
just described. Please refer to the “Creating and Editing Work Nametables” section for
instructions.
54
AIDA 2D TLC User’s Manual
2
raytest
Actual Region Pane
The Actual Region pane provides information about the selected region.
Figure 2-59
Actual Region Pane
Use the Configure button to add or delete categories from the list shown below the
Configure button. This opens the Column Selection dialog box described in the Region
Report section of this manual.
Region Calibration Toolbox
The controls of the Region Calibration toolbox allow you to perform the calibration of
the 2D densitometer. For the calibration, reference regions for the creation of standard
curves are necessary on the same image..
Method Pane
Standard Pane
Calibration Curve Pane
Figure 2-60
Region Calibration Toolbox (Overview)
Using 2D TLC
55
2
raytest
To display the Region Calibration toolbox:
• On the main menu, click Evaluation, and then click Region Calibration,
or
• Select the Region Calibration button on the toolbar.
Method Pane
The drop-down menu of the Method control pane is used to specify the calibration
method (Quantity or Concentration).
Figure 2-61
Method Drop-Down Menu
Selecting Quantity will result in the analysis of integrated intensities of all pixels in the
defined region whereas Concentration will compare the average intensity in the regions.
Standard Pane
Using the controls of the Standard pane you can assign standards to selected regions.
Standard Selection Drop-Down Menu
List of Standard Values
AutoAssign Tool
Manual Assignment Tool
Delete Standard Assignment Button
Edit Standard Button
Figure 2-62
Standard Pane
From the Standard drop-down menu a predefined list of standard values can be selected.
The specified standard values are displayed in the pane below the Standard drop-down
menu.
Beside this pane there are four buttons:
56
AIDA 2D TLC User’s Manual
2
raytest
AutoAssign Tool: This button allows you to subsequently assign all values in the list by
clicking with the mouse on the appropriate region. Thus the first value (1107000.0) is
assigned to the first clicked region, the second value (424000.0) to the secondly clicked
region and so on.
Manual Assignment Tool: The second button allows you to assign any value to the
clicked region by entering the appropriate value and unit for the selected region in the
Region Calibration dialog box that appears.
Figure 2-63
Region Calibration Dialog Box
Delete Standard Assignment Button: By clicking this button, all calibration values of
selected regions can be canceled.
Edit Standard Button: The last of the four buttons is used to enter new lists of standard
values. Clicking this button opens the Quantity Standards (or Concentration Standards)
dialog box, which is used to enter a new list or to modify an existing one. To create a new
list, name the list in the Standard text box and specify its Values, Unit and Precision
(displayed fraction digits).
Figure 2-64
Quantity Standards Dialog Box
Using 2D TLC
57
2
raytest
The Add, Modify and Delete buttons are used to alter lists in the same box.
All used standards should be saved for future use. This is also true for one-time standards
because evaluation get frequently re-done, which means that the standard values are lost
unless entered in the list.
Calibration Curve Pane
In the Calibration Curve pane of the Region Calibration toolbox the mathematical
calculation of the standard curve can be selected and the result is displayed in the graph
at the lower end of the toolbox.
Figure 2-65
Calibration Curve Pane
The Calibration Curve drop-down menu provides the following functions:
• Linear Interpolation
• Linear Regression
• Logarithmic Regression
• Log. Weighted Regression
Figure 2-66
Selecting Calibration Curve Type
Linear Interpolation calculates lines to join each data point.
58
AIDA 2D TLC User’s Manual
2
raytest
Linear Regression optimizes a linear graph so that the deviation of the actual points from
the curve is minimized.
Logarithmic Regression is used to determine the standard curve with logarithmic
characteristics, which is found in many saturating effects (e. g. absorption).
Log. Weighted Regression can be described as linear regression using a double
logarithmic scaling. The result is a better optimization of the curve fit for the smaller
values, instead of a better fit for the higher values (Linear Regression).
If you choose Linear Interpolation, Linear Regression or Logorithmic Regression, you
can select the (0,0) Origin option to force the curve through the origin. For Log.
Weighted Regression select the Linear fit option to force the curve to a linear function.
The correlation coefficient (Corr. Coeff.) of the estimation is shown below the curve. A
value of 1 identifies a perfect correlation, a value of 0 indicates full independence of
values. Good standard curves should have value very near to 1.
Double-clicking on the graphics pane opens the Region Calibration window (see the
“Region Calibration Window” section of this manual for details).
Sometimes a warning will be displayed below the graphics pane, stating 'bkg not
determined', to indicate that no background region has been assigned yet. It can also
indicate the lack of a local background for some regions.
Using 2D TLC
59
2
raytest
GLP Supporting Tools Toolbox
The GLP Supporting Tools toolbox is used to specify all GLP relevant settings.
Administration Pane
Data Trail Settings Pane
Finish Evaluation Pane
Region Names Pane
Automatic Export Pane
Data Trailing Pane
Figure 2-67
GLP Supporting Tools Toolbox (Overview)
To display the GLP Supporting Tools toolbox:
• On the main menu, click Evaluation, and then click GLP Supporting Tools,
or
• Select the GLP Supporting Tools button on the toolbar.
60
AIDA 2D TLC User’s Manual
2
raytest
Note – To configure the GLP support, administrator rights are required. Therefore make
sure that you are logged in as system Administrator to change the GLP settings. If you
are logged in as normal user, the GLP Supporting Tools toolbox is considerably reduced,
providing you with the Data Trailing controls only.
Figure 2-68
GLP Supporting Tools Toolbox (User Account)
Administration Pane
In the Administration pane of the GLP Supporting Tools toolbox you can configure all
GLP support settings.
Figure 2-69
Administration Pane (Initial State)
Since this is only possible, if no evaluation has been started, ensure that no image is
loaded into AIDA yet.
To enable GLP support:
• Click the Apply GLP Support option.
The Proof PCB Checksum option enables the PCB image authentification feature.
Note – Older PCB images do not incorporate checksums. So if you want to apply the GLP
Supporting Tools controls to those images, make sure that this option is disabled.
Using 2D TLC
61
2
raytest
The Reason List button opens the Audit Trail Reason List dialog box for predefining
evaluation change reasons.
Figure 2-70
Audit Trail Reason List Dialog Box
Data Trail Settings Pane
The behavior of the GLP recording function is configured using the Data Trail Settings
for controls:
Figure 2-71
62
Data Trail Settings Pane
AIDA 2D TLC User’s Manual
2
raytest
1 Click the Evaluation button to set the recording options for changes during
evaluation.
The Audit Trail Configuration: Evaluation dialog box appears.
Figure 2-72
Audit Trail Configuration: Evaluation
2 Specify which user actions should be recorded.
This includes for example the modification/deletion of annotations, changing
calibration method and/or calibration curve or modifying/deleting regions.
Using 2D TLC
63
2
raytest
If the working operator performs one of the actions checked in the Audit Trail
Configuration dialog box, a dialog box pops up, prompting the user to give reasons for
the desired change.
Figure 2-73
Audit Trail Confirmation Dialog Box
The desired modification is blocked until the user confirms the action by entering the
intention for the change explicitly in the Audit Trail Confirmation dialog box.
Figure 2-74
64
GLP Error Message Box
AIDA 2D TLC User’s Manual
2
raytest
As for changes during evaluation you can also set recording options for changes
afterwards. Just click the Changes Afterwards button on the Data Trail Settings for
pane. The Audit Trail Configuration: Changes Afterwards dialog box appears, allowing
you to select the actions to be watched by the GLP system.
Figure 2-75
Audit Trail Configuration: Changes Afterwards Dialog Box
Finish Evaluation Pane
The checkboxes of the Finish Evaluation by pane allow you to specify the user action
which indicates the end of an evaluation.
Figure 2-76
Finish Evaluation Pane
If you click First Save, the settings of the Changes Afterwards dialog box become active
after saving the evaluation the first time. First Close activates the Changes Afterwards
settings when you close the Image window during the initial evaluation. Explicit Stop
allows you to mark the end of the evaluation anytime you want, using the Stop
Evaluation button on the Data Trailing pane.
Using 2D TLC
65
2
raytest
Region Names Pane
Figure 2-77
Region Names Pane
Clicking the Master Nametable button on the Region Names pane opens the Master
Name Table dialog box, which is used to create or modify master nametables. Selecting
the Apply Master Nametable option applies a master nametable to subsequent
evaluations. Existing name-region assignments are left unchanged.
Automatic Export Pane
Figure 2-78
Automatic Export Pane
The Edit Settings button of the Automatic Export pane allows you to select, edit and
save settings for automatically exporting the 2D Region Report/Region Calibration tables
when the evaluation is saved to file.
Note – If you are perfoming evaluations with GLP support disabled, you can access the
automatic export settings via the Automatic Export command of the Options menu.
66
AIDA 2D TLC User’s Manual
2
raytest
Data Trailing Pane
After starting an evaluation, the controls of the Data Trailing pane are enabled.
Figure 2-79
Data Trailing Pane (Evaluation in Progress)
The View Audit Trail button is used to open the Audit Trail window.
Use the Stop Evaluation button to mark the end of an evaluation anytime you want.
In the lower part of the Data Trailing pane, the status of the evaluation as well as the
settings for ending the evaluation (depending on the checked Finish Evaluation by
options) are given. In addition, if the PCB check sum option is disabled, a warning is
displayed below the Stop Evaluation button.
After stopping the evaluation, the action which marked the evaluation's end is displayed
(in this example by explicit stop via clicking the Stop Evaluation button)
Figure 2-80
Data Trailing Pane (Evaluation Aborted by User)
Using 2D TLC
67
2
raytest
Publishing Layout Toolbox in 2D TLC
In AIDA 2D TLC the standard AIDA Publishing Layout toolbox is expanded by three
additional buttons for specifying the print options for the Region Report, Region
Calibration and Audit Trail.:
Region Report Options Button
Region Calibration Options Button
Audit Trail Options Button
Figure 2-81
68
Publishing Layout Toolbox (Overview and Toolbar)
AIDA 2D TLC User’s Manual
2
raytest
Print Options for Region Report
With the first one you can configure layout setting for the Region Report window in the
Protocol Print pane.
Figure 2-82
Print Options for the Region Report Window
Here you can select the paper orientation (Portrait or Landscape) by clicking the
appropriate radio button in the Format pane. In the Print pane the scope for the print
output can be specified. To turn on printing of the Region Report table, click the Table
box.
Print Options for Region Calibration
The second additional button of the Publishing Layout toolbox is used to configure the
layout setting for the Region Calibration window.
Figure 2-83
Print Option for the Region Calibration Window
Using 2D TLC
69
2
raytest
You can select the paper orientation (Portrait or Landscape) by clicking the appropriate
radio button in the Format pane.The options in the Print pane enable or disable the
printing of the calibration curve (Graphic) und/or the calibration table (Table).
Print Options for Audit Trail
The last button of the Publishing Layout toolbox is used to configure the layout setting
for the Audit Trail window in the Protocol Print pane.
Figure 2-84
Protocol Print: Audit Trail Pane
As for the Region Report you can select the paper orientation (Portrait or Landscape) by
clicking the appropriate radio button in the Format pane.The options in the Print pane
enable or disable the printing of the Data Trail settings (Configuration) and/or the
recorded data from the Audit Trail window (Data Trailing). In addition, if the
Configuration option is checked, you can choose to print the Complete Lists of settings
or just the Positive Lists (the checked options only).
70
AIDA 2D TLC User’s Manual
2
raytest
Print
In AIDA there are two ways for printing your image and evaluation data:
• Choose Print from the File menu,
or
• Use the Protocol Print pane on the Publishing Layout toolbox.
The Print command of the File menu allows you to print your data 'on the fly' without
permanently storing the layout/printing settings, whereas the Protocol Print pane
provides you with a complete set of printing features which includes saving the setting
with the data file for reasons of reproducibility.
Choosing the Print command from the File menu opens the Print dialog box, allowing
you to configure the printout to contain only the overlays, results and graphs that are
currently needed. Click the checkboxes for the various items to turn them on or off. Select
the number of copies, you want to print.
Figure 2-85
Print Dialog Box
Using 2D TLC
71
2
raytest
The margins of the printout can be selected in the Edges part of the dialog box. The
Header button displays the following dialog box:
Figure 2-86
Page Header and Footer Dialog Box
Here the Header and Footer of the report can be configured to contain various image and
evaluation specific data.
The Parameter (data overlays), the Image, Region Report and Region Calibration
information can be selected in the left part of the Print dialog box.
In the right part of the dialog box (Parameter and Image Options) you can select Whole
Image, or Window Content from the first drop-down menu. Landscape or Portrait
format can be selected from the second drop-down menu. The printing of Overlays,
Grayscales, Scales, and Overexposed can be selected. The printout can be automatically
fitted to the page, or the relative size of the image representation can be selected (in %).
In the Profile Options pane you can specify to print the Current Selection or all profiles
as well as the paper orientation (Landscape or Portrait) for the printout.
Finally, using the Audit Trail Options pane, you can specify whether to include
information about the Data Trail settings at all, and if yes, to which extent configuration
information should be printed (Include Positive Trail Configuration/Include Complete
Trail Configuration).
72
AIDA 2D TLC User’s Manual
2
raytest
Preview
As for printing, in AIDA there are two ways of previewing pages before they are actually
printed:
• Using the Print Preview command from the File menu, or
• Using the Preview button on the Publishing Layout toolbox.
The Print Preview command of the File menu opens the Preview dialog box, which
allows you to specify the layout settings for the preview. The options presented here are
the same as in the Print dialog box and those selectable from the various panes of the
Publishing Layout toolbox. However, they are not stored with the data file.
The Preview option of the Publishing Layout toolbox allows you to preview all pages as
configured in the Publishing Layout toolbox before they are actually printed. Clicking the
Preview button opens the Preview window directly, because all layout setting are already
made through the Print Protocol pane.
Figure 2-87
Preview Example
Using 2D TLC
73
2
raytest
Export and Import
In AIDA 2D TLC various tables and graphs can be exported to be imported in other
documents or programs. In addition the calibrations and templates can be exported to be
applied to other images. The various functions can be found in the Export and Import
submenus of the File menu.
Exporting Templates
To export your own evaluation templates:
1 On the File menu, click the Export menu item and then choose Template from the
submenu.
2 In the Export Template dialog box that appears type a name for the export file and
confirm the action by clicking Save,
or
1 Click the Export Template button on the toolbar to open the Export Template
dialog box
Figure 2-88
Main Toolbar (Export Template Button)
2 Type a name for the export file in the File Name text box and complete the export
action by clicking Save.
Figure 2-89
74
Export Template Dialog Box
AIDA 2D TLC User’s Manual
2
raytest
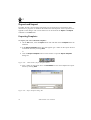
Exporting Region Report
To export the Region Report:
1 On the File menu, click the Export menu item and then choose 2D Region Report
from the submenu.
2 In the 2D Region Report Export dialog box that appears type a name for the export
file.
3 Click Save to confirm the export.
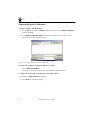
The 2D Region Report Export Options dialog box appears, allowing you to set
further option for the export of the result table.
Figure 2-90
2D Region Report Export Dialog Box
You can specify the Range of the exported rows and columns (Table Header, All
Rows/Columns displayed in the Region Report window or only the Selected
(highlighted) Rows/Columns in the Region Report window) as well as the List Delimiter
and Decimal Delimiter in the respective panes of the dialog box. Selecting the System
Defaults button applies the Windows default settings to List Delimiter and Decimal
Delimiter.
Using 2D TLC
75
2
raytest
In addition, the parameter settings for the evaluation can be exported by checking the
Parameter option. If this option is enabled, the following parameter information will be
written to the export file:
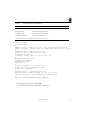
Table 2-6
Exported Parameter Information
Parameter
Desciption
Export Parameters
[1. Row]
Application name (e. g., “AIDA Whole Body
Autoradiography (GLP)”)
[2. Row]
Type of exported data (e. g., “2D Region Report”)
Export settings
Identifier for the export parameter settings
Master nametable
Identifier for the master nametable (comprised of the unique
AIDA internal indentifier and an import identifier and name)
Image File Parameters (for Fuji BAS Scanner)*
Parameter file
Image parameter file path (.pcb or .inf)
Image data file
Image raw data file path (.img)
Original filename
Name defined during the scan process
Scan date
Date and time of scan
Imaging plate type
Type of the imaging plate used
Scanner
Scanner type (e. g. “Fuji BAS-5000”)
Sensitivity
Sensitivity parameter of scan
Latitude
Latitude parameter of scan
IP Number
ID of IP plate used; entered during the scan process
Project
Project name entered during the scan process
Sample
Sample name entered during the scan process
Exposure
Exposure time of the plate entered during the scan process
Comment
Image and evaluation comments combined
Digital Resolution
Digital resolution of image
Image size
Width and height of image
Pixel size
Spatial resolution of image
Scan operator
Operator of the scan process
76
AIDA 2D TLC User’s Manual
2
raytest
Table 2-6
Exported Parameter Information
Parameter
Desciption
Evaluation File Parameters
Evaluation file
Evaluation file path (.adf)
Evaluation date
Date and time of evaluation
Evaluation operator
Operator of evaluation
* The actual image file parameters depend on the data file format and version.
#
#
#
#
#
#
#
#
#
#
#
#
#
#
#
#
#
#
#
#
#
#
#
Aida 2D TLC(GLP)
2D Region Report
Export setting: 20021104 110236 3896 (Till, Default Setting 04-11-2002)
Master nametable: 20021104 142426 7666 (Master Name Table, 2002-08-16 / 35)
Parameter file: i:\Aida Demo\2d tlc.inf
Image data file: i:\Aida Demo\2d tlc.img
Original file: 2d tlc
Scan date: Tuesday, April 20, 1993, 4:02:43
AM
Imaging plate type: 20*40
Scanner: Fuji-BAS 1000
Sensitivity: 10000
Latitude: 4
Digital resolution: 256, 8 bit per pixel
Image size: 348*940, 69.60mm*188.00mm
Pixel size: 200µm*200µm
Evaluation file: i:\Aida Demo\2d tlc.adf
Evaluation date: Monday, November 04, 2002, 3:22:42 PM
Evaluation operator: System Administrator (Administrator)
Figure 2-91
Example of Exported Parameter Information
4 Complete the action by clicking Ok.
The data are saved to a simple ASCII (text) file.
Using 2D TLC
77
2
raytest
Exporting Region Calibration
To export Region Calibration Data:
1 On the File menu, click the Export menu item and then choose Region Calibration
from the submenu.
2 In the Region Calibration Export dialog box that appears type a name for the
export file and specify the data format.
Figure 2-92
Region Calibration Export Dialog Box
To export the graph in the Region Calibration window:
• Choose Windows Metafile.
The graph is saved to a separate file in the Windows Metafile format.
To export the result table of the Region Calibration window:
1 Select the Table Ascii File data format.
2 Click Save to confirm the export.
78
AIDA 2D TLC User’s Manual
2
raytest
The Quantity Calibration Export Options dialog box appears, allowing you to set
further option for the export of the result table.
Figure 2-93
Region Calibration Export Options Dialog Box
You can specify the Range of the exported rows and columns (Table Header, All
Rows/Columns displayed in the Region Report window or only the Selected
(highlighted) Rows/Columns in the Region Report window) as well as the List
Delimiter and Decimal Delimiter in the respective panes of the dialog box.
Selecting the System Defaults button applies the Windows default settings to List
Delimiter and Decimal Delimiter.
In addition, the parameter settings for the evaluation can be exported by checking
the Parameter option.
3 Complete the action by clicking the OK button.
The data are saved to a simple ASCII (text) file.
In addition the calibration data can be exported to an AIDA Calibration file that can be
imported into another image.
Using 2D TLC
79
2
raytest
Exporting Audit Trail
To export Audit Trail data:
1 On the File menu, click the Export menu item and then choose Audit Trail from the
submenu.
2 In the Audit Trail Export dialog box that appears enter a name for the export file.
Figure 2-94
Audit Trail Export Dialog Box
3 Complete the export action by clicking the Save button.
The data from the Audit Trail window are exported to an ASCII file (Audit Trail
Ascii File, .txt).
80
AIDA 2D TLC User’s Manual
2
raytest
Automatic Export of the Region Reports/Region Calibrations
AIDA’s Automatic Export option allows you to export 2D Region Reports and/or Region
Calibrations automatically when you save an evaluation.
You can specify preferences for the range of the table columns to be automatically
exported as well as export settings, which are independent from the current work
configurations of the table(s).
The naming of the export files follows the scheme “Evaluation Name.Region Report.txt”
or “Evaluation Name.Region Calibration.txt”, i. e., if the name of the evaluation file is
example.adf, the Region Report export file has the name example.Region
Report.txt and the Region Calibration export file is named example.Region
Calibration.txt. Existing export files are overwritten without prompting the user.
However, a backup file of the previous export file version is created.
Automatic Export always exports the entire result table. Restricting the export to selected
rows is not possible.
The enabling of the automatic export option as well as its settings are evaluation-specific
attributes, which are valid until they are explicitly changed using the Preferences or
Automatic Export options of the Options menu or by importing an AIDA template. If
you create a new evaluation, the current default configuration for Automatic Export is
applied and will be saved with the evaluation data in the adf. file. The configuration
remains valid unless it is explicitly changed by the user.
If GLP support is enabled, only user with administrator privileges can create or change
automatic export settings. If the Auto. Export Parameter options is enabled via the Data
Trail Settings for pane, any changes to the automatic export settings are logged in the
audit trail report.
The automatic export settings are timestamped internally. In addition you can add a name
and an ID, which are included in the Parameter pane of the export file together with the
internal time stamp.
The parameter settings for the automatic export in AIDA 2D TLC are saved to separate
.set files named “Parameter Name.2D Thin Layer Chromatography
Automatic Export.set” in the AIDA Config directory, where Parameter Name is
the name, you used in the Save Automatic Export Setting dialog box (see below).
Using 2D TLC
81
2
raytest
To create automatic export settings:
1 From the Options menu, choose Automatic Export or click the Edit Settings button
on the Automatic Export pane of the GLP Supporting Tools toolbar.
The Automatic Export Setting dialog box appears.
Figure 2-95
Automatic Export Setting Dialog Box
The top pane of the dialog box shows the current settings parameters, whereas the
second displays the current settings for the automatic export of the 2D Region
Report/Region Calibration. Click on the toolbar to switch between the settings
pages.
82
AIDA 2D TLC User’s Manual
2
raytest
2 Click Edit Settings.
The Edit Automatic Export Setting dialog box opens.
Figure 2-96
Edit Automatic Export Setting Dialog Box
The dialog box provides you with the following option:
• Export on Save: Automatic enables the automatic export and generates the
export filename automatically from the evaluation filename. No disables the
automatic export. If you select Prompt for, you will be prompted for an export
data filename, when you save an evaluation.
• Parameter: enables/disables the export of the result table’s parameter pane.
• Table Header: enables/disables the export of the table header.
• List Delimiter: allows you to select a delimiter for the columns
• Decimal Delimiter: allows you to select a decimal delimiter format.
• Settings for Report Columns: select columns subsequently and click to select
or deselect the Included in Export option to include/exclude the respective
column. Depending on the column you selected, you can specify additional
settings (in this example: the Decimal Digits) for the exported values.
3 Select the appropriate options and click OK to complete the action.
Using 2D TLC
83
2
raytest
Saving Automatic Export Settings:
1 On the Automatic Export Setting dialog box, click Save Setting.
The Save Automatic Export Setting dialog box opens.
Figure 2-97
Save Automatic Export Setting Dialog Box
2 Type a unique name and an ID for the settings and click Save to confirm the action.
Selecting Automatic Export Settings
1 On the Automatic Export Setting dialog box, click Select Setting.
The Select Automatic Export Setting dialog box appears.
Figure 2-98
Select Automatic Eport Setting Dialog Box
2 Select a settings set and click Select to complete the action.
84
AIDA 2D TLC User’s Manual
2
raytest
To delete a settings set:
1 Select the set you want to delete in the list of the Select Automatic Export Setting
dialog box.
2 Click Delete.
Note – If GLP support is turned on, only user with administrator privileges can edit, save
or delete automatic export settings.
Importing Region Calibration
1 To import the calibration curve from another image (e. g. taken at the same time
with the same BAS screen, or from a second gel handled at the same time and
captured under identical conditions), use the Import command of the File menu.
The Region Calibration Import dialog box appears allowing you to specify the
calibration file (.cal).
Figure 2-99
Region Calibration Import Dialog Box
Using 2D TLC
85
2
raytest
86
AIDA 2D TLC User’s Manual
Performing 2D TLC Evaluations
3
raytest
Setting the TLC Plate and 2D Origin/Fron Overlay
The first thing to do when doing a 2D TLC evaluation is to set the TLC plate with the
origin and front lines.
Consider the following image.
Figure 3-1
TLC Image Example
Here you can see the 2D TLC overlays. The outer rectangle represents the TLC plate, the
inner rectangle is used for the calibration of the two TLC runs.
87
3
raytest
The TLC plate overlay is used for the calculation of the Total value shown in the 2D
Region Report.
The little cross-axes indicates the two run directions. The corner of the inner rectangle,
where the little cross-axes are drawn, has the RF value 0 for the first and second run
direction. The opposite corner has the RF value 1 for both run directions.
Figure 3-2
Run Direction Indicators
If the 2D TLC Calibration toolbox is active, there are additional letters and helping lines
that do refer to the dimension and position combo boxes of the toolbox.
You may change the location and size of the letters by choosing Image Overlays from
the Options menu. Here you may also choose if the TLC overlays shall be drawn at all.
To set the TLC plate and 2D origin/front overlay, follow the steps below:
1 Select the 2D TLC Calibration toolbox.
2 In the upper part, select the direction of the first run by choosing the appropriate
entry from the 1st Run Direction pull-down menu.
Figure 3-3
88
Selecting Direction for First Run
AIDA 2D TLC User’s Manual
3
raytest
3 Then select the direction of the second run.
Figure 3-4
Selecting Direction for Second Run
4 Click the Define Sample button.
This will create an overlay for the TLC plate, containing a second overlay for the
origin and front lines.
Figure 3-5
Define Sample Button (Sample Definition Panel)
The outer rectangle represents the TLC plate, the inner rectangle represents the origin and
front lines. By default, the position of the outer rectangle's edges is congruent with the
edges of the image.
If your TLC plate is not identical to the whole image:
1 Double-click near an edge of the image.
This will activate the Editing mode for the TLC plate overlay.
2 Move, rotate and stretch this overlay until it is congruent with the TLC plate.
Performing 2D TLC Evaluations
89
3
raytest
3 Press the Return key to confirm the changes.
Figure 3-6
Editing TLC Plate Overlay
Adjusting Origin and Start Lines
1 Now double-click near an edge of the inner rectangle which represents the origin
and front lines.
2 Move, rotate and stretch this overlay until it is congruent with the origin and start
lines.
Figure 3-7
Adjusting Origin and Start Lines
You can use the various combo boxes to type in directly the dimensions of your plate and
your TLC runs if you know them.
90
AIDA 2D TLC User’s Manual
3
raytest
Changing Run Direction of Existing Overlays
If you want to change the run directions after the overlays have been set, you have to
delete the already set overlays first by clicking the Delete Overlay button and then
redefine them.
Figure 3-8
Delete Overlay Button (Sample Definition Panel)
Now you have completed the setting of the TLC plate and the 2D origin/front overlay.
You may proceed now with the usual 2D densitometry evaluation: Select the Region
Determination toolbox to set regions and then use the Region Calibration toolbox to
calibrate your measurement.
Performing 2D TLC Evaluations
91
3
raytest
Assigning Regions
To define regions for signal intensity evaluation, it is important to set the Image
Attributes in the Options menu first (see the “AIDA Image Analyzer Basic Concepts and
Features User's Manual”). If these settings are not correct further image evaluation will
not result in meaningful results.
Figure 3-9
Setting Image Attributes
To enable signal intensity evaluation the regions of interest must be marked by an
enclosure of the appropriate shape. In the beginning you might find it difficult to exactly
encircle a region of interest. Some experience is needed to get this done on the first
attempt.
To select regions of interest:
1 Click the appropriate button (here circle) in the Region Creation pane of the
Region Determination toolbox to select a shape (alternatively click the circle
symbol on the toolbar).
Figure 3-10
92
Selecting Circle Tool
AIDA 2D TLC User’s Manual
3
raytest
2 Position the mouse pointer over the top left edge of the region in the image, press
the mouse button and drag the mouse to the lower right edge of the region to be
assigned.
Figure 3-11
Marking Region
3 Release the mouse button.
4 Drag on the handles of the overlay to adjust the shape of the region overlay.
Figure 3-12
Adjusting Region Shape
5 Click in the middle of the region to adjust the position of the entire region.
Figure 3-13
Adjusting Region Overlay Position
Performing 2D TLC Evaluations
93
3
raytest
To rotate a region overlay:
1 Click the left mouse button to switch to rotation mode.
Figure 3-14
Activating Rotation Mode
2 Drag on a handle to rotate the overlay.
Figure 3-15
Rotating an Overlay
3 Click the left mouse button again to go back to the relocation mode.
You might need multiple rounds of adjusting in the beginning.
4 After the region is correctly assigned, click the right mouse button or press the
ENTER key to save it.
The same strategy is followed for the squares, circles, and ellipses. The ellipses tend to be
the most difficult to align.
The Polygon tool and the Freehand Drawing tool
graphic programs:
94
AIDA 2D TLC User’s Manual
work similar as for known
3
raytest
Using the Ploygon tool, every edge of the new region is clicked, whereas using the
Freehand Drawing tool the mouse button is hold during the manual encircling.
Figure 3-16
Using the Polygon Tool
To edit these polygons a third mode exists besides the relocation and turning mode. In
this third mode all handles (edges) of the region will be displayed and their position can
be changed. This allows you to reshape the region.
Figure 3-17
Editing Polygonal Overlays
Performing 2D TLC Evaluations
95
3
raytest
Finally the AutoContour tool will connect pixels of similar intensity to encircle an object
automatically.
Figure 3-18
Using the AutoContour Tool
To mark a region using the AutoContour tool:
1 Select the AutoContour tool.
2 Point to a position within the border area of an object that you would like to
encircle (example above: heart of a rat cut autoradiography), press the mouse button
and shift around carefully within the object until the correct border is selected.
3 Release the mouse button.
On release, the border is marked and can be edited as usual.
You can cancel any overlay (region) editing action anytime you want by simply pressing
the ESC key.
The numbering of the regions can be configured using the Region Label and Name
controls of the Region Determination toolbox (for details, refer to the Region Label and
Name pane in the “Region Determination Toolbox” chapter of this manual). Adjust the
settings to your experimental design and personal preferences.
96
AIDA 2D TLC User’s Manual
3
raytest
Using Arrays (Matrices)
It can be helpful to use matrices to evaluate regular patterns of regularly shaped regions
(e. g. slot or dot blots, multiwell plates, etc.).
To create a matrix:
1 Mark the first region of the regular pattern in question using the appropriate
controls of the Region Creation pane on the Region Determination toolbox.
2 Accomplish the region creation by clicking the right mouse button or alternatively
pressing the ENTER key.
3 Click the Create Matrix button on the Region Creation pane, to specify the
appropriate matrix layout for the region pattern.
Figure 3-19
Matrix Options Dialog Box
4 Enter the number of lines (2 in this examples) and columns (6 in this examples) as
well as the distances (x and y- direction) between the center of the regions.
Performing 2D TLC Evaluations
97
3
raytest
This will be easy for scanners (just measure the original and enter the actual
distance) but difficult for camera images (trial and error). However, the work is
worthwhile, because all regions will be drawn and assigned at the same time and the
same array can be used for another image, even if the size of the image is somewhat
different from the original one.
Figure 3-20
Matrix Creation
To save the matrix:
1 Choose Template from the Export submenu of the File menu.
2 Type a name for your matrix template in the text box of the dialog box that appears
(e. g. slotblot.atf).
You can apply your saved template to a similar image from the same kind of application
by selecting the Template command from the Import submenu and then choosing the
appropriate template from the displayed file list in the dialog box that appears. The matrix
region will be displayed in one single frame which can be moved and reshaped as if it
would be only one region.
Figure 3-21
Matrix Creation Completed
You can relocate the matrix template by dragging the frame in the appropriate direction.
Figure 3-22
98
Relocating Matrix Template
AIDA 2D TLC User’s Manual
3
raytest
To rotate the template, just double-click it and drag one of the handles that appear.
Figure 3-23
Rotating Matrix Template
Finally accomplish your adjustments by right-clicking the matrix or alternatively pressing
ENTER.
Figure 3-24
Matrix Template Adjustments Completed
Performing 2D TLC Evaluations
99
3
raytest
Defining a Background Signal
It is advisable to determine the background signal before quantifying the signals.
Since in many applications the background can vary considerably from location to
location, the possibility to assign an individual local background around a region can help
to evaluate the signals. Note, that local backgrounds can be defined for rectangular and
ellipsoidal regions only. It should also be noted that the background around the region
must be clearly separated from the signal. If e. g. a 2D gel spot is assigned, it is likely that
the outer borders of the signal come to lie under the background area, because they are
very difficult to see for the human eye.
To define a global background region:
1 Mark an image area with no signal activity using the Region Creation tools.
Figure 3-25
Selecting Region Creation Tool
Figure 3-26
Selecting Image Area
100
AIDA 2D TLC User’s Manual
3
raytest
The newly created region is highlighted in the 2D Region Report window.
Figure 3-27
Highlighted Region in the 2D Region Report Window
2 To define the region as background region, select the Background check box on the
Integration panel of the Region Determination toolbox.
Figure 3-28
Backgound Checkbox
3 Review the changes in the 2D Region Report window. Note that the value for Type
of the region is changed to Bkg.
Figure 3-29
Bkg Value in the 2D Region Report Window
Performing 2D TLC Evaluations
101
3
raytest
To define one or more local background regions:
1 Mark one or more image areas in the vicinity of spot, for which the background
calculation should be performed using the Region Creation tools of the Region
Determination toolbox.
Figure 3-30
Selecting Region Creation Tool
Figure 3-31
Selecting Image Areas
The newly created region is highlighted in the 2D Region Report window.
Figure 3-32
102
Highlighted Regions
AIDA 2D TLC User’s Manual
3
raytest
2 To set the regions to background, check the Background option on the Integration
pane of the Region Determination toolbox.
3 Select all spots for which the local background should be defined together with the
designated background regions.
Figure 3-33
Selecting Local Background Application area
You can review the selection in the 2D Region Report window.
Figure 3-34
Selected Region highlighted in the 2D Region Report Window
Performing 2D TLC Evaluations
103
3
raytest
4 On the Report panel, click the Group button to assign the selected regions to a
single group.
Figure 3-35
Selecting Group Button
Again, the changes are reflected in the 2D Region Report window.
Figure 3-36
Reviewing Grouping in 2D Region Report Window
Note – All members of the newly created group have the same Grp Name value assigned.
The previously performed (local) background setting now applies only to the domain of
its group members.
104
AIDA 2D TLC User’s Manual
3
raytest
Performing Calibrations
The signal intensity of a region can be compared with the signal intensity of other regions
(relative comparison) or normalized by standards in the same image, or even in other
samples of the same series.
For the normalization (calibration), it is necessary to define reference regions for the
creation of standard curves.
To assign standards:
1 Select the Manual Assignment tool from the Region Calibration toolbox.
2 Click on a region.
The Region Calibration dialog box pops up and prompts you to enter the standard
value und unit of measurement.
Figure 3-37
Entering Standard Values and Unit of Measurement
In the example shown below the regions 1 to 6 are a series of a standard. Region 7
was assigned as a background region.
Figure 3-38
Region Calibration Example
3 Enter the appropriate standard value und click OK to assign it to the region.
Performing 2D TLC Evaluations
105
3
raytest
In the Region Calibration toolbox the entered standard values are listed below the
Standard drop-down menu.
Figure 3-39
Region Calibration Toolbox With Entered Standard Values Displayed
The list of standard values can be saved for later use as a standard list. Standard
values from saved lists can be used to assign all standards by merely clicking at
each region subsequently.
4 Select a Calibration Curve type from the Calibration Curve drop-down menu.
The type of the calibration curve can be selected on the basis of theoretical
considerations or simply to fit the observed situation.The resulting calibration curve
can be immediately evaluated and the r² value will give a parameter to judge the fit
(should be next to 1).
5 Turn on the (0,0) Origin option if useful.
106
AIDA 2D TLC User’s Manual
3
raytest
Figure 3-40
Calibration Graph Example
As mentioned above, a correlation coefficient value of 1 identifies a perfect correlation, a
value of 0 indicates full independence of values. Good standard curves should have value
very near to 1.
Performing 2D TLC Evaluations
107
3
raytest
Using Nametables
Nametables are used to name regions for reference purpose.
To standardize the naming, you can use a master nametable, which contains all region
names in the correct (predefined) spelling. This is especially useful for postprocessing of
evaluation data using a database. Using predefined names ensures that the mapping
between regions and names is consistent across different evaluations. For easy
referencing, every name in the master nametable has a unique identifier associated with it.
The predefined names as well as the associated identifiers are strings, so identifiers are
not required to be of the number type. Names and identifiers must not exceed 1024
characters. On the Region Name tab, only about 20 characters are displayed.
In addition to the list of predefined names and associated IDs, the master nametable
contains a Table Name, Table ID and Table Stamp (a unique internal master nametable
ID, which consists of date, time and a random number).
The master nametable is saved to a file named 2d-densitometry-name.glp in the
AIDA Config folder. To use the table on another computer, just copy the file to the
Config folder of the AIDA program on the respective machine or alternatively use the
Export/Import option of the Master Name Table dialog box (see the “Exporting Master
Nametables” section below).
After applying a master nametable, you can assign the names listed in the master name
table. To assign a name from the master name table to a region, you must create a work
nametable, which contains all or a selection of the names provided by the master
nametable (see the “Creating and Editing Work Nametables” section below).
Master nametables are not part of the evaluation and can therefore be applied ex post. The
application of a master nametable is always logged to the audit trail.
108
AIDA 2D TLC User’s Manual
3
raytest
Creating and Editing Master Nametables
Master nametables are created and applied using the GLP Supporting Tools toolbox.
The names and identifiers for the master nametable are provided by an import table file.
The import table file is a text file, which contains a semicolon or tab separated list of
unique predefined names and identifiers. Cells cannot be empty and multiple instances of
a value are not allowed. Valid end-of-line control codes are the hexadecimal equivalents
for CR (Macintosh), LF (UNIX) or CRLF (Windows). A table name and a table ID can be
included in the file using the keywords #TABLE_NAME: and #TABLE_ID: respectively:
#TABLE_NAME: Master Name Table
#TABLE_ID: 2003-01-10 / 35
#TABLE_UNIQUEID: 20030110 141325 0396
n001
Region1
n002
Region2
n003
Region3
n004
Region4
n005
Region5
n006
Region6
n007
Region7
n008
Region8
Code Example 3-1
Import Table Example
On import, the import table replaces an empty (or existing) master nametable and the
value for #TABLE_UNIQUEID is reset to a new value.
To create or edit a master nametable:
1 Make sure that no image is currently loaded.
2 Select the GLP Supporting Tools toolbox.
3 Click Master Nametable.
Figure 3-41
Selecting Master Nametable
The Master Name Table dialog box appears.
Performing 2D TLC Evaluations
109
3
raytest
4 Click Import to select an import table.
Figure 3-42
Master Name Table (Empty Master Name Table)
The Import Master Name Table dialog box open, allowing you to select an import
table file.
5 Select an import table file and click Open to continue.
Figure 3-43
110
Import Master Table Dialog Box
AIDA 2D TLC User’s Manual
3
raytest
The import table is loaded and replaces the existing (in this example: empty) master
nametable. All changes to the master name table are logged and displayed in the
Changes in Master Nametable dialog box.
Figure 3-44
Changes in the Master Nametable Dialog Box
6 Click OK to apply the changes or Cancel to discard them.
Activating Master Nametables
To activate a master nametable:
• Click the Apply Master Nametable checkbox.
Figure 3-45
Applying Master Nametable
Performing 2D TLC Evaluations
111
3
raytest
Note – Checking this option with GLP support enabled applies the master nametable to
any new evaluation. The Apply Master Nametable attribut is set on evaluation startup
and cannot be changed for the currently running evaluation. On startup, the evaluation is
associated with the current master nametable. The association is logged in the audit trail.
If you open this evaluation with a version of AIDA, which uses a different master
nametable, the master nametable of this version is used for any new name assignments
made. Names assigned using the previous master nametable are left unchanged.
Exporting Master Nametables
You can save your current master nametable to a text file (tab separated values) for use as
import table file using the Export option of the Master Nametable dialog box.
To export a master nametable:
1 Click the Master Nametable button on the GLP Supporting Tools toolbar to open
the Master Nametable dialog box.
2 On the Master Nametable dialog box, click Export.
Figure 3-46
Exporting Master Nametable (Step 1)
The Export Master Name Table dialog box appears.
112
AIDA 2D TLC User’s Manual
3
raytest
3 Type a name and select a location and data format for the export file and click Save
to complete the action.
Figure 3-47
Exporting Master Nametable (Step 2)
In addition to the contents of the master nametable, the internal master nametable
identifier (Table Stamp), the Table Name and the Table ID are included in the export
file.
Note – On import the value for the Table Stamp (TABLE_UNIQUEID) is not imported,
but set to a new value.
Performing 2D TLC Evaluations
113
3
raytest
Creating and Editing Work Nametables
Work nametables are used to assign names to regions. Any user can create a new or edit
an existing work nametable. Note, that depending on whether a master nametable is
applied or not, the creation or editing procedure for work nametables is slightly different.
To create a new work nametable (no master nametable applied):
1 On the Region Determination toolbox click the Select Name List button.
Figure 3-48
114
Region Determination Toolbox: Select Name List Button
AIDA 2D TLC User’s Manual
3
raytest
The Region Nametables dialog box appears showing the current work nametable’s
list of names and a dropdown list with the names of all existing work nametables.
Figure 3-49
Region Nametables Dialog Box
2 Click New.
The Nametable Editor dialog box appears.
Performing 2D TLC Evaluations
115
3
raytest
3 Type a name for the work nametable in the Title text box and a list of names in the
List of Names text box.
Figure 3-50
Nametable Editor Dialog Box
4 Click Accept to confirm the changes.
To modify a work nametable (no master nametable applied):
1 On the Region Determination toolbox click the Select Name List button.
The Region Nametables dialog box appears.
2 Click Modify.
The Nametable Editor dialog box appears.
3 Edit the entries in the in the List of Names list box.
4 Click Accept to confirm the changes.
To create a new work nametable with master nametable applied:
1 On the Region Determination toolbox click the Select Name List button.
The Region Nametables dialog box appears showing the current work nametable’s
list of names and a dropdown list with the names of all existing work nametables.
Only work nametables derived from the master nametable are display (if no master
nametable is applied, only the custom work nametables are displayed).
116
AIDA 2D TLC User’s Manual
3
raytest
2 Click New to create a new work nametable derived from the current master
nametable.
The Nametable Editor dialog box appears.
3 Type a title for the work nametable in the Title text box.
4 Select one or more entries from the Master Nametable list and click the left arrow
button to copy the entries to the List of Names list of the work nametable. The
selected entries are inserted below the last entry in the List of Names list, if no List
of Names entries is highlighted. If one or more List of Names entries are
highlighted, the selected names from the Master Nametable list are inserted above
the first highlighted List of Names entry.
Note – You can add multiple instances of one Master Nametable entry to the work
nametable’s List of Names list.
5 To define a custom name, type the name in the text box above the List of Names
list and click Add to add it to the list.
Figure 3-51
Creating Work Nametable (Master Nametable Applied)
Performing 2D TLC Evaluations
117
3
raytest
To modify a work nametable with master nametable applied:
1 On the Region Determination toolbox click the Select Name List button.
The Region Nametables dialog box appears.
2 Click Modify.
3 On the Nametable Editor dialog box that appears select the entries you want to
remove from the work nametable in the List of Names list box and click the right
arrow button. To add entries to the work nametable, select the appropriate entries in
the Master Nametable list box and click the left arrow button.
4 Click Accept to confirm the changes.
Assigning Names to Regions
To assign names to regions:
1 Select a region.
Figure 3-52
118
Selecting a Region
AIDA 2D TLC User’s Manual
3
raytest
2 On the Region Determination toolbox, select the Region Name tab.
Figure 3-53
Selecting Region Name Tab
3 Select the appropriate entry from the list to assign the name to the selected region.
The list shows the names defined in the current work nametable.
Figure 3-54
Selecting a Name
Performing 2D TLC Evaluations
119
3
raytest
To change a region name:
1 Select the region whose name you want to change.
Figure 3-55
Selecting the Region
2 Click the appropriate name in the Region Name list.
Figure 3-56
120
Changing Name
AIDA 2D TLC User’s Manual
3
raytest
To assign names automatically upon creation of a region:
1 On the Region Determination toolbox, select the Region Name tab.
Figure 3-57
Selecting Region Name Tab
2 Click Apply at Region Creation.
Figure 3-58
Checking Apply at Region Creation
3 Select a tool from the Region Creation pane and mark regions sucessively.
Figure 3-59
Selecting Region Creation Tool
Performing 2D TLC Evaluations
121
3
raytest
The names in the Region Name list are assigned one after another.
Figure 3-60
122
Assigning Names sucessively
AIDA 2D TLC User’s Manual
3
raytest
Audit Trail Logging
If a master nametable is applied to an evaluation, the master nametable’s name, ID and
table stamp are logged in the audit trail report.
Figure 3-61
Audit Trail Logging (Muster Nametable Applied)
If you change the master nametable (modify or replace the current one), the changes are
logged in the audit trail report upon creation of a new region.
Figure 3-62
Audit Trail Logging (Master Nametable Replaced)
Note – Changes of the master nametable are always logged, regardless of the Data Trail
Settings.
Changing/replacing the master nametable does not change existing name assignments.
The new master nametable is applied to newly created regions/assignments only.
Performing 2D TLC Evaluations
123
3
raytest
124
AIDA 2D TLC User’s Manual