1
1 User's Manual
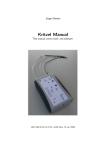
This chapter should help any new user to get his/her FirstGeneration Kritzel to run.
1.1 What is Kritzel?
Kritzel is a simple scanner for general purpose measuring of digital signals up to about 500 kHz. It is host
based, so any data processing occurs at the host side. Kritzel only reports what is happening on the probe
leads and when.
Figure 1: Building Blocks / Visualizing with gtkwave
Other features:
●
Fullspeed USB
●
USB powered, no additional power supply required
●
7 input-only probes, 1 bidirectional probe
●
PWM for stimulus application on external devices under test
●
Two 3.3 V level probes (5 V tolerant), six 5 V level probes
Kritzel supports the VCD (Value Change Dump) data format, so the results can be processed and visualized
with gtkwave (http://gtkwave.sourceforge.net/) or similar applications.
1.2 Device Controls
Kritzel can be controlled by the host, but also a measurement can be started and stopped locally at the
device. A few LEDs are showing the current state of the device. Figure 2 shows the locations of these control
items.
Page 1 of 10
Figure 2: Controls and Connectors
●
●
●
●
●
●
●
●
[A] On LED. Lights green, when USB power is active
[B] Ready LED. Lights green, when device is ready to be used and the start button (E) and stop
buttons (F) can be used
[C] Busy LED. Lights red when a measurement is running
[D] 8 Probe connectors plus one ground connector (not shown here)
[E] Start button. Pressing this button starts a measurement in interactive mode
[F] Stop button. Pressing this button stops a measurement in interactive mode
[G] Data Loss LED. Lights yellow, when more events happen than reports can be transferred
through the USB line
[H] USB connector
1.3 Man Page
Run the program with:
~# kritzel [options] <device name>
Options are:
●
[-s <value>] Define scan interval (unit: ns). Default is 10,000,000 = 10 ms.
●
[-i <value>] Define stimulus interval (unit: ns). Disabled by default.
●
[-a <value>] Define stimulus active time (unit: ns). Default is 1,000,000 = 1 ms.
●
[-l <value>] Define stimulus active level (0|1). Default is 1 = active high.
●
[-o <basename>] Use this basename for all output files. Default is test_file.
●
[-t <text>] Define the measurement title. Default is 'Measuring'.
●
[-r] Start scan immediately, else wait for the scanner's local start action.
●
[-f <format>] Select the data format on stdout. <format> could be:
●
'krt' Kritzel's native format.
●
'vcd' Industrial VCD format.
●
[-<no> <name>] Define a probe name (<no> from 1 to 8).
<device name> depends on the device node name udev gives your device. If it is the only serial device,
usually it will be /dev/ttyUSB0.
1.4 Installation
To install the package, ensure libz is already installed on your system.
Page 2 of 10
~# tar xf kritzel-1.1.2.tar.bz2
~# cd kritzel-1.1.2
~/kritzel-1.1.2 # configure
~/kritzel-1.1.2 # make
~/kritzel-1.1.2 # sudo make install
Most things are done automatically by configure, but there are some parameters that can control how to
build the kritzel executable.
●
[--enable-debug] Be more noisy and do more runtime checking. Enabled by default. You should
disable this feature when you only use this program.
●
[--enable-krt_format] This is the native format kritzel uses when it outputs data to stdout. Don't
mistake it with the compressed data format. This is valid only for stdout.
●
[--enable-vcd_format] This is a industrial format used by other tools and also by gtkwave. Support of
this format is enabled by default.
1.5 Preparation on the Host's Side
The FirstGeneration Kritzel works with a parallel to USB converter from the vendor FTDI. The device is an
FT245BM (refer to http://www.ftdichip.com/). This kind of device is supported since the Linux kernel 2.4 days.
When it integrates itself into the system, it emulates a simple serial connection, so every tool that supports tty
communications can work with it.
When running udev on the host, it creates for each connected FT245BM a device node in this form:
/dev/ttyUSBx
The 'x' part in this device node name will be a number starting at 0. It's possible to connect more than one
device at the same time.
The FTDI device uses a 16 ms timeout value as default to transfer data from its FIFO to the
host, if there are less than 64 bytes in it. To speed things up this value should be decreased to
1 ms. This can be done with a:
$ echo 1 > /sys/class/tty/ttyUSB?/device/latency_timer
Note: Replace the ? with the correct number udev has given your Kritzel.
1.6 How to measure
Up to eight probes can be used to measure digital signals. Two types of levels
are currently supported:
●
●
Probes #1 and #2 are using input stages with 3.3 V power supply. So they are reporting levels below
1.0 V as 0 and levels above 1.5 V as 1.
Probes #3 to #8 are using input stages with 5.0 V power supply. They are reporting levels below 1.2
V as 0 and levels above 2.1 V as 1.
Connect as much probes as you want to observe signals and -- don't forget -- the GND probe.
Do not connect the GND probe to a low impedance source other than ground. This may destroy
your target, Kritzel and your host immediately.
Connect Kritzel through the USB to your host. A device like /dev/ttyUSB0 should now should show up.
1.7 Physical Connections
If you prepare the probe cables in the same way as me, you can do the connections in two ways: Directly
through header pins or through any kind of clip contact. The micro clip contacts are very cool, but also
expensive.
Page 3 of 10
Figure 3: Direct connection through header pins (left) and through micro clips (right)
1.8 Start Measuring
To start a measurement, run at least the kritzel program on your host. It needs only one parameter (all
other settings are using default values in this case): The device node to get a connection to the Kritzel
system.
# kritzel /dev/ttyUSB0
This will use a reporting cycle of 10 ms and stores all data into file test_file.krt and in addition some
human readable info about this measurement in test_file.info.
The Kritzel application doesn't do any data processing. It only collects all events reported by the
scanner and stores them to a file. For any further data processing other applications are
required that can work on the stored data.
To select another reporting interval than the default, extend the command line options with -s. To get a
reporting interval of 4 µs change the command line to:
# kritzel -s 4000 /dev/ttyUSB0
The reporting interval depends on hardware capabilities. Not every interval is possible. Kritzel selects the
nearest possible interval automatically.
For the FirstGeneration Kritzel these intervals are possible:
●
●
●
●
500 ns
4 µs
16 µs
64 µs
Note: The 500 ns interval is an internal interval only. This means Kritzel can detect events with this timing
resolution. But after an event detection the firmware needs 2 µs to generate a report and forward it to the
USB FIFO. So the maximum external frequency is about 500 kHz. Note also, Kritzel cannot generate reports
permanently at this rate. Because each report contains 4 bytes, this would result in a 2 MiB/s data rate,
which a full speed USB device cannot handle.
This means a short burst of a 500 kHz signal Kritzel can handle until the FIFO is full. The average external
frequency Kritzel can handle permanently is about 250 kHz.
Page 4 of 10
1.9 What a Reporting Interval Means
Each reporting interval has a time stamp and all events within this interval are collected and reported at the
end of that reporting interval (refer to figure 4). 'All events' means all events on all signals and it includes if
one or more signals change their level more than once in the same reporting interval. If the latter case
happens, Kritzel uses an "event loss" mark for these signals in this report.
If there was no event within a single reporting interval, there will also be no report. This keeps the data
amount small in the cases where events happen at a low rate.
Figure 4: Reporting Intervals
Note: Due to hardware restrictions the reporting interval 500 ns will generate a report whenever a single
event was detected (no collection). The hardware is not fast enough to detect more than one event in this
short interval.
To distinguish all measurements later on, you can give each a title and a name for each probe. Other data
processing applications can use this information.
# kritzel -s 4000 -t "This is a specific title" /dev/ttyUSB0
There is no length restriction for the title. You only should avoid characters like '@' and '$'. If you use them,
they will get replaced by '_' and '#'}. This restriction exists, as these characters are used to separate fields in
Kritzel's data files.
To define a name for each probed signal you can extend the command line like this:
# kritzel -s 4000 -1 trigger -2 answer -8 interrupt /dev/ttyUSB0
This will assign the name 'trigger' to probe #1, 'answer' to probe #2 and 'interrupt' to probe #8. Probes #3 ...
#7 are still using their default names.
There is no length restriction for each name, but you should avoid the same characters in the name as for
the measurement title.
Each run of kritzel will store the event data into test_file.krt and test_file.info. If you are
using the -o command line option, you can select a different basename than test_file. kritzel will
extend this basename with .krt and .info by itself!
1.10 Probe Protection
Figure 5: Protection Scheme
Page 5 of 10
All inputs are protected against electrostatic discharge (ESD) with a serial resistor and clamping diodes (refer
to figure 5). This will also clamp 5 V input signals at probe #1 and probe #2. But avoid to connect any low
impedance source to any of the probe inputs that will force the clamping diodes to do their work. This will
destroy at least the serial resistors. If the input voltage is above 7 V, all active devices will be damaged, and
as the last member in this chain your host computer!
1.11 How to Stimulate
When you set up the stimulus generation, Kritzel will enable its output buffer on probe #1. Note: Currently
only probe #1 can be a stimulus output. All other probes are input only.
As probe #1 continues to be an input too, the stimulus data will be part of the data set. If there is something
to measure in relation to the stimulus, always select probe #1 as one of the edges to be used for the
calculation.
Note: Stimulus generation depends on the capabilities of the underlying hardware. The FirstGeneration
Kritzel uses an internal 8 bit timer generating the output stimulus. So the stimulus interval and the active time
depend on each other.
Figure 6: Stimulus Generation Overview
You can define the stimulus interval with the -i command line parameter, the active time with -a and the
active level with -l.
The stimulus signal is a simple PWM signal, generated by an 8 bit counter with compare capability. To set up
the nearest value to the given one, Kritzel's firmware first tries to find the best stimulus interval. Due to only a
few internal clock dividers, the intervals are limited to (granularity in parentheses):
●
●
●
●
●
●
●
16 µs (62.5 ns)
128 µs (500 ns)
512 µs (2 µs)
1.024 ms (4 µs)
2.048 ms (8 µs)
4.096 ms (16 µs)
16.384 ms (64 µs)
After selecting the best stimulus interval the firmware searches for the nearest possible active time. Refer to
the values in parentheses for the granularity in each stimulus interval. Based on these values the firmware
will calculate the possible active time within the stimulus interval.
Example: For the 16.384 ms stimulus interval it means the shortest possible active time will be 64 µs. Longer
active times will be always multiples of 64 µs.
1.12 Data Processing
The kritzel main program generates up to two data streams from the reports the scanner sends. One
Page 6 of 10
stream is a compressed one and always generated. The filename is test_file.krt (or a different
basename, when using the command line option -o).
A second stream will be generated if kritzel found its stdout redirected. This stream can be used to
work live on the data. All other data processing programs in this archive can work with the compressed file or
the redirected stream.
1.12.1 Simple Data Display
kritzel_raw displays the scanner data in a primitive way. You can run this program on life data or on an
already stored *.krt file.
Display life data:
# kritzel /dev/ttyUSB0 | kritzel_raw
Display stored data:
# kritzel_raw <file_name.krt>
kritzel_raw has an useful option when handling large data sets. It can start to display with an data set
offset. This option is:
-n <value>
<value> is a simple number. When given, kritzel_raw skips the first number reports before starting to
display.
How to read its output?
[...]
11C: |#||||||
131: ||#|||||
149: |||#||||
162: ||||#|||
[...]
F958: ||||||#|
F96D: |||||||#
F985: ||||||||
1: ||||||||
157: #|||||||
[...]
(+24)
(+21)
(+24)
(+25)
(+24)
(+21)
(+24)
(+1660)
(+342)
First column is the time stamp. It's displayed in hex format. It's always 16 bit wide and overflows at 0xFFFF.
The next columns are showing the states of the 8 probe signals at this time stamp (from left to right: Probe
#1 to #8). The character '|' represents a 0 (low), the '#' represents a 1 (high).
The third column in the example above is empty (description see below).
The fourth column shows the times tamp difference to the previous report. Note: The time stamp is always in
relation to the selected time resolution while scanning! So if the time stamp value advances by one, this
could mean 500 ns, 4 µs and so on.
Lets explain the second row in the example above:
The report was generated at the time stamp 0x131. It happens 21 counts later than the previous report.
Probe #1, #4, #5, #6, #7 and #8 do not change their state. Probe #2 changes from 1 to 0, while probe #3
changes from 0 to 1.
Sometimes a row contains the third column mentioned above:
[...]
1B5: ||||#||| (+24)
1CA: |||||#|| (+21)
Page 7 of 10
1E2: ||||||#| .....!.. (+24)
1FA: |||||||# (+24)
20F: |||||||| (+21)
[...]
At time stamp 0x1E2 the scanner has detected more than one event on probe #6. This means the level on
this probe changed at least two times. In this example at least from 1 (at time stamp 0x1CA) to 0, back to 1
and again to 0 (the final state at time stamp 0x1E2).
There are different reasons for this to occur:
●
The report interval is to long for the frequency on the probe lines.
●
The USB FIFO was full. While the firmware waits for new space in the FIFO it continues to collect
events.
1.12.2 Check Data Consistency
This tool is only useful for the stored data set. It was very helpful during the development of this project. It
could become helpful again, when someone has trouble while using programs of this project.
# kritzel_check <file_name.krt>
Reading data from file test_1.krt
Data file contains 214661 datasets
No obvious errors detected
1.12.3 Display specific Reports
This tool was developed to check the realtime capabilities of the current Linux RT Preempt patch.
To find specific reports showing (for example) a timing violation kritzel_select can be used. With the
help of kritzel_select you can set up two event sources and trigger (results into raw data display) if
these events violates a given timing.
Run kritzel_select --help for the possible options.
1.12.4 Creating a Histogram
This tool was developed to check the realtime capabilities of the current Linux RT Preempt patch.
While the scanner generates a stimulus at a specific rate for a target it scans the target's answers on a
second probe. If the stimulus is connected to an interrupt input, the target can answer interrupt recognition
on the second probe. Based on this dataset you can create a histogram to measure the realtime capabilities
of the target while running various loads on it.
The tool kritzel_histogram creates a histogram in ASCII format, that can be used with gnu plot to get
nice graphical histograms.
Example:
●
The scanner outputs a 1 kHz signal on probe #1. This signal is fed into an interrupt input of our
target. The interrupt input is active low.
●
The target's interrupt routine outputs an answer on a separate GPIO. It toggles the GPIO whenever it
received the interrupt and entered the handler routine. This GPIO is connected to the scanner's
probe #2.
Start the test with:
# kritzel -s 500 -i 1000000 -a 200000 -l 0 -1 stimul -2 answer -t "realtime"
/dev/ttyUSB0
Now run various loads on your target to measure its realtime capabilities.
When the measurement is done, you can build the histogram for this test. We are interested in the timing
Page 8 of 10
starting with the falling edge of probe #1 (interrupt) and ending with both edge of the answer signal on probe
#2.
#
#
#
#
#
#
#
kritzel_histogram -b 1- -e 2 test_file.krt
Histogram
realtime
Reporting interval: 500 ns
From signal stimul (1) falling edge to signal answer (2) both edges
Data sets over all: 214662. Counted events: 23733. Erroneous events: 0.
First collumn: Time in [ns], second collumn: Count
8000
112
9500
291
10000
301
10500
376
11500
198
12500
191
13000
154
15000
85
17500
69
20500
12
24500
2
The worst case in this example is about 25 µs. The graphical histogram can be found in figure 7.
Figure 7: Histogram
1.13 Visualizing with gtkwave
The application gtkwave can be used to visualize the data set in a more convenient way than kritzel_raw
can do it.
To get a dataset in a file format that gtkwave can handle, use the '-f vcd' option and redirection when running
the measurement.
# kritzel -s 500 -f vcd > test.vcd
Page 9 of 10
Note: The file test.vcd will grow quickly and can be very huge!
To visualize this dataset run gtkwave and simply load the test.vcd file.
Page 10 of 10