1
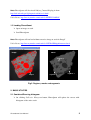
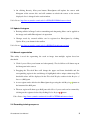
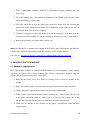
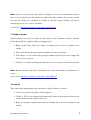
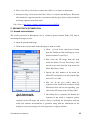
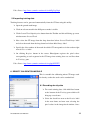
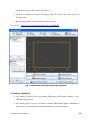
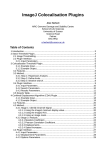
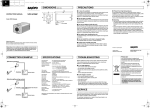
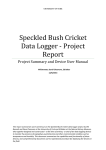
PHASEQUANT (User Manual)
ROI Pane
Toolbar
Threshold Bar
Canvas
Threshold
Display
Training Pane
Buttons
Fig 1. PhaseQuant GUI
1. INSTALLATION AND LOADING
1.1 Installing PhaseQuant
Download the zip file from the following link
http://imagejdocu.tudor.lu/doku.php?id=plugin:segmentation:phasequant_:start
Unzip the contents to the ‘ImageJ/plugins’ folder
Restart ImageJ
PhaseQuant can be found in NHM folder under plugins menu
PhaseQuant User Manual
1
Note: PhaseQuant will also install Object_Counter3D plug-in from
http://rsb.info.nih.gov/ij/plugins/track/objects3.html.
Video Demo: http://www.youtube.com/watch?v=RF5HVUwDHaY
1.2 Loading PhaseQuant
Open an image or stack
Load PhaseQuant
Note: PhaseQuant will not load without an active image or stack in ImageJ
Video Demo: http://www.youtube.com/watch?v=ZdUDa1PPc0g&feature=related
Mask
Image
Segment 3
Region
Segment 2
Segment 1
Fig 2. Regions, masks and segments
2. BASIC UTILITIES
2.1 Combined/Running histogram
On clicking Collective Histogram button, PhaseQuant will update the canvas with
histogram of the entire stack
PhaseQuant User Manual
2
On clicking Running Histogram button, PhaseQuant will update the canvas with
histogram of the current slice and will continue to refresh the canvas as the current
displayed slice is changed in the stack window.
Video Demo: http://www.youtube.com/watch?v=9WDfj9EvDXM&feature=related
2.2 Update histogram
Existing utilities in ImageJ such as smoothing and sharpening filters can be applied to
the image stack while PhaseQuant is in operation
Changes made by external utilities can be registered to PhaseQuant by clicking
Update Histogram button in the toolbar
Video Demo: http://www.youtube.com/watch?v=dBXlBbSJrAs&feature=related
2.3 Manual segmentation
This utility is used for segmenting the stack or image into multiple regions based on
thresholds.
Click Segment Histogram button and subsequently, Threshold Bars will shown up on
the histogram in the canvas
Dragging the Threshold Bars will change the upper and lower thresholds and the
corresponding region in the stack/image is highlighted with a unique colour map. The
threshold values will be displayed in the Threshold Display textbox in the Region of
Interest (ROI) pane
A new region can be added to the PhaseQuant by pressing the Add Region
button at
the bottom of the ROI pane
The new region will show up as ROI pane titled New Segment and can be renamed by
clicking on the region or deleted by clicking Delete Region
button
Video Demo: http://www.youtube.com/watch?v=stRVcCFTDMs&feature=related
2.4 Recording training sequence
PhaseQuant User Manual
3
Some segmentation methods included in PhaseQuant require training data for
processing.
To record training data, click Add Data
button at the bottom of the Training pane
which will bring up a new frame
Select the check box next to the label phase in the new frame and start selecting the
pixel values in the image/stack window. Once completed, assign a label to the data set
for identification (this must be a number)
Click Record button to register the training set and the training set will show up in the
Training pane. The training sets can be renamed or deleted as per user’s convenience
Repeat the procedure to register more training sets.
Note: On clicking Error button at the bottom of the Training pane, PhaseQuant will bring up
a frame with statistical information (mean and variance) on the training datasets.
Video Demo: http://www.youtube.com/watch?v=YHbSfyZHWcc&feature=related
3. PHASE EXTRACTION MODULE
3.1 Automatic segmentation
Five segmentation methods are included in PhaseQuant, two of the methods require training
sequences and others don’t require training data. All the segmentation methods split the
regions into two segments and create a new mask.
Bring up the Phase Extraction frame by clicking Phase Extraction button in the
toolbar
Select one of the regions created by manual segmentation from the drop down box
Choose the phase segmentation method to be used for segmentation
If the selected segmentation method requires training sets – indicated by (TS required)
in the phase extraction window -, then select Use Training Data check box at the
bottom and chose the training data sets from the drop down boxes below
Click Process button at the bottom of the phase segmentation frame to start
segmentation
PhaseQuant User Manual
4
Once segmentation is complete, a new mask titled New Mask is created and shows up
in the ROI pane
On clicking the mask, a new window opens with the segmented image.
Note: It is important not to close the windows as it might crash the program. On clicking the
top level node region named Region/mask in the ROI pane, all the windows except the main
window will disappear.
Video Demos: http://www.youtube.com/watch?v=nISI0JYnlAY
http://www.youtube.com/watch?v=no9yUqveeiI
3.2 Cluster analysis
Cluster analysis utility lets a user specify the minimum
and maximum bounds on the cluster size of each
segment in a mask
Bring up the Phase Extraction frame by
clicking Phase Extraction button in the toolbar
Select a mask from the drop down box on
which cluster analysis is to be performed
Specify the gray value of the segment to be
processed in Seg textbox and minimum size of
the cluster in Vol textbox and gray value to
replace with in Dat textbox if the cluster is
smaller than the value specified in Vol
Click Preview button to process current slice
and preview the results
Click Process button in the bottom of the
Phase Extraction frame to apply cluster
analysis to the entire stack permanently
Fig 3. Phase extraction
module
PhaseQuant User Manual
5
Note: Cluster analysis can only be performed on a mask and cannot be performed on a
region. After performing cluster analysis, it might be necessary to hide the mask and reopen
to refresh the image data.
Video Demo: http://www.youtube.com/watch?v=nISI0JYnlAY
3.3 Convert to mask
A manually segmented region can be converted into a binary mask using this utility.
Bring up the Phase Extraction frame by clicking Phase Extraction button in the
toolbar
Select a region from the drop down box which needs to be converted into a binary
mask
Select Convert to mask utility and click Process button at the bottom of the Phase
Extraction frame to start the conversion
Video Demo: http://www.youtube.com/watch?v=no9yUqveeiI
3.4 Combing masks
The masks created by different segmentation methods can be combined together. It is often
difficult to precisely segment the images manually and as a result there is an overlap between
successive regions. While combining masks generated by processing the regions using the
Calculator and CalculatorPlus utilities in ImageJ, it often results in an overlap as the manual
segmentation may not have been precise and margins might overlap. This problem has been
addressed with Combine mask utility.
Bring up the Phase Extraction frame by clicking Phase Extraction button in the
toolbar
Select Combine mask utility and select the masks to combine in the two drop down
boxes below and click Process button
A new mask will be created in ROI pane with the masks combined together
The mask selected at the top drop down box takes precedence over the mask selected
at the bottom drop down box if there is an overlap
PhaseQuant User Manual
6
Note: Calculator and CalculatorPlus utilities in ImageJ can be used to combine the masks if
there is no overlap between the masks, but while using those utilities the user has to make
sure that the masks to be combined are visible in respective image windows and also to
uncheck the Create new window check box
Video Demo: http://www.youtube.com/watch?v=no9yUqveeiI
3.5 Reduce border
Often it might be necessary to reduce the outer border of the specimen to remove spurious
pixels that result due to partial volume averaging process.
Bring up the Phase Extraction frame by clicking Phase Extraction button in the
toolbar
Select a mask from the drop down box which needs border reduction
Select Reduce border utility and specify the number of pixel layers to be stripped off
in No of Layers textbox.
Click Process button at the bottom of the Phase Extraction frame to start the reduction
Note: Border reduction can only be performed on a mask and cannot be performed on a
region.
Video Demo: http://www.youtube.com/watch?v=4bI11Wpso48
3.6 Log file
The results of the segmentation can be written to a log file which is a text file
Create a new text file anywhere on the computer
Click Log File Location button in the toolbar and browse to the location of the text file
created in the previous step and click open
Bring up the phase segmentation frame by clicking Phase Extraction button in the
toolbar
PhaseQuant User Manual
7
Select Add Results to the Log File check box
Now results of the segmentation will be written to the log file
Video Demo: http://www.youtube.com/watch?v=dPBAxbQeuK0
4. PHASE MEASUREMENT MODULE
4.1 Modal abundance
Bring up the Phase Measure frame by clicking Phase Measurement button in the
toolbar
Select the region or mask
from the drop down box
Select Modal abundance
option and click Process
button at the bottom
Results are displayed in a
new window with volume
fraction in percentage and
number of pixels/voxels in
square brackets
Fig 4. Phase measurement module
Video Demo: http://www.youtube.com/watch?v=no9yUqveeiI
4.2 Object/size distribution (2D & 3D)
Bring up the Phase Measurement frame by clicking Phase Measurement button in the
toolbar
Select the mask from the drop down box
Select Object/size distribution (2D) option and click Process button at the bottom
After processing, PhaseQuant generates a shape mask representing each object with a
unique color and also displays a result window with size distribution statistics (object
identifier, phase ID, size of the object in voxels/pixels ).
PhaseQuant User Manual
8
Note: On clicking Object/size distribution (3D), PhaseQuant loads an existing plug-in named
Object Counter3D. This plugin is well documented and further information about this plug-in
can
be
found
in
the
following
link
http://pacific.mpi-
cbg.de/wiki/index.php/3D_Objects_Counter. If you are using Object/size distribution (3D) in
PhaseQuant it is imperative to cite the reference provided in the above link. Object/size
distribution (2D) option does not require a binary mask, whereas Object/size distribution (3D)
requires a binary mask.
Video Demo: http://www.youtube.com/watch?v=PAYmYOYPr6c
4.3 Porosity
Create a region by thresholding the bulk (everything except air and porosity) of the
specimen using manual segmentation
Bring up the Phase Measurement frame by clicking Phase Measurement button in the
toolbar
Select the bulk from the drop down box
Select Porosity option and click Process button at the bottom
After processing, a new mask called Porosity is created with segmented void spaces
and shows up in the ROI pane
Video Demo: http://www.youtube.com/watch?v=un4LyOOOSV4
4.4 Inter-Phase Distribution
Inter-Phase distribution utility can be used for measuring distribution of a segment within
other segments. This option requires two inputs one containing two segments and another
containing just one segment.
Bring up the Phase Measurement frame by clicking Phase Measurement button in the
toolbar
Select a mask containing two segments in the top drop down box and select a mask
containing one segment in the bottom drop down box
PhaseQuant User Manual
9
Select Inter-Phase Distribution utility and click Process button at the bottom
After processing, a new mask called Inter Phase is created in the ROI pane. This mask
will contain the segment from the second mask with the gray values replaced with the
enclosing segments in the first mask.
Video Demo: http://www.youtube.com/watch?v=SzcscgdAT8k
5. GROUND TRUTH OPTIMIZATION
5.1 Ground truth validation
The masks generated in PhaseQuant can be validated against Ground Truth (GT) data to
measuring the margin of error.
Open the ground truth image
Click on the relevant mask in the ROI pane to make it visible
Click
Ground Truth Optimization button
from the Toolbar and this will bring up a new
window named Ground Truth
Now select the GT image from the drop
down box below Ground Truth Image label
and select the mask from the drop down box
below Mask Image label
Specify the slice number of the mask for
which GT corresponds to in the textbox right
next to Slice no label
Now list all the gray values taken by
segments in the mask in the textboxes below
Mask Data label and list corresponding gray
value in the GT image under GT Data label
Fig 5. Ground truth
optimisation module
On clicking Process button at the bottom, the
segments in the mask is compared against
segments in the GT image and an Error Image visualising the discrepancy between
actual and software measurements is generated along with the information on the
margin of error in percentages for each segment in a separate window.
PhaseQuant User Manual
10
Video Demo: http://www.youtube.com/watch?v=k9ZgCyqC4q4
5.2 Importing training data
Training datasets can be generated automatically from the GT data using this utility
Open the ground truth image
Click on relevant mask in the ROI pane to make it visible
Click Ground Truth Optimization button from the Toolbar and this will bring up a new
window name Ground Truth
Now select the GT image from the drop down box below Ground Truth Image label
and select the mask from the drop down box below Mask Image label
Specify the slice number of the mask for which GT corresponds to in the textbox right
next to Slice no label
On clicking Register button in the center, PhaseQuant registers the pixel values
corresponding to each segment in the GT image into training data sets and lists them
in Training pane
Video Demo: http://www.youtube.com/watch?v=pQqijSZIUTU
6. DENSITY CALIBRATION MODULE
This is a module for calibrating micro-CT image stack
for density so that the stack can be standardised
6.1 Recording density data
To record training data, click Add Data button
at the bottom of the Training pane which will
bring up a new frame
Select the check box next to the Density label
in the new frame and now start selecting the
pixel values in the image/stack window. Once
PhaseQuant User Manual
11
completed assign a density value to the data set
Click Record button to register the density data set and this will show up in the
Training pane.
Repeat the procedure to register more density data sets.
Video Demo: http://www.youtube.com/watch?v=M_UgoS0HpF0
Fig 7. PhaseQuant GUI while density calibration
6.2 Density calibration
On clicking Calibrate Histogram button, PhaseQuant will display density vs gray
value plot in the canvas
On clicking Apply Temporary Calibration button, PhaseQuant applies calibration to
the current slice and displays the calibrated image in a separate window
PhaseQuant User Manual
12
On clicking Apply Permanent Calibration button, PhaseQuant applies calibration to
all the slices and updates the histogram
Video Demo: http://www.youtube.com/watch?v=M_UgoS0HpF0
PhaseQuant User Manual
13