1
Chapter 11: Plotting: Customizing the Graph
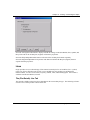
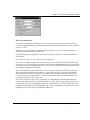
The Incremental check boxes are only available if the current selection on the associated tab can be
incremented between data plots. For example, if you select Color Mapping:Dataset from the Fill Color
button on the Symbol tab, then the Symbol Fill Color check box on the Group tab is unavailable. If you
want to increment a display property whose check box is unavailable on the Group tab, alter the setting on
the associated tab.
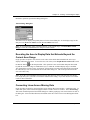
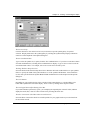
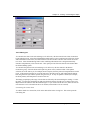
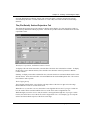
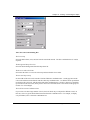
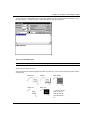
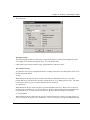
The Group Members View Box
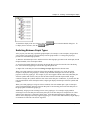
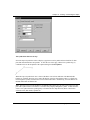
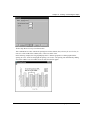
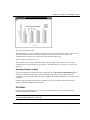
This view box displays the current display settings for all the data plots in the group. The view box
updates as you change selections on the Group tab or on the associated data plot tabs.
Controlling the Display Properties of a Data Point
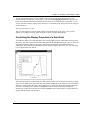
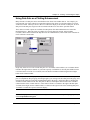
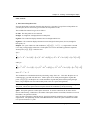
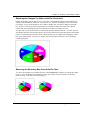
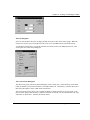
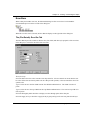
To modify the display of an individual data point, hold the CTRL key down while double-clicking on the
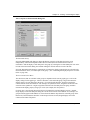
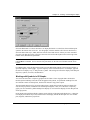
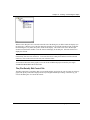
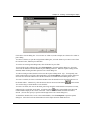
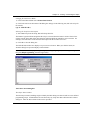
data point. This action opens the Plot Details dialog box for the individual data point. The tree on the left
side of the Plot Details dialog box displays a data point icon beneath the associated data plot icon.
Additionally, the worksheet row index number of the data point displays next to the icon. Edit the dialog
box (for the data point) as desired.
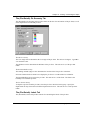
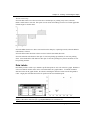
After a data point has been edited using the CTRL+double-click option, the data point becomes an Origin
object. If you double-click on the same data point (without holding down the CTRL key), the Plot Details
dialog box opens with the data point controls displayed. To remove the object status from the data point,
click once on the data point to generate a highlighted border around the point and press DELETE.
Alternatively, right-click on the data point and select Delete from the shortcut menu. The data point now
displays with the format of the data plot.
Data Plots: General Tips • 308