1
Method:
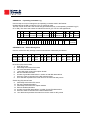
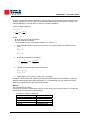
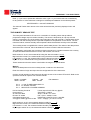
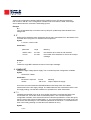
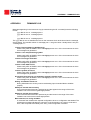
Type SL. The test runs through the same temperature and foreoptic positioning procedures
described in HG, then waits the obligatory five minutes for the quartz-halogen lamp to warm up.
The program then conducts seven measurement runs over the dark-count channel and the five
operational wavelength channels. Each run cycles the slitmask through 20 oscillations,
accumulating the photon counts in the BASIC one-dimensional F() array (described under
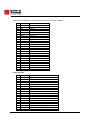
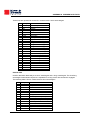
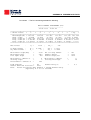
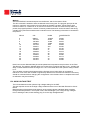
Preliminary Data Reduction). These raw counts are printed in the following format:
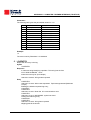
Brewer Temp = 27 C ( 3.56 V)
C.U.T.
CY ZEN
SL0 20:54:25
20 65.63
SL0 20:55:02
20 65.67
SL0 20:55:40
20 65.72
SL0 20:56:18
20 65.76
SL0 20:57:02
20 65.81
SL0 20:57:46
20 65.86
SL0 20:58:24
20 65.9
MU
2.384
2.388
2.392
2.395
2.4
2.404
2.408
DRK
32
35
43
36
31
37
43
1
1102112
1101966
1102630
1101330
1101960
1102690
1102507
2
1052861
1054190
1053024
1054009
1053736
1052931
1053022
3
1066768
1067478
1067318
1068002
1068197
1067378
1067047
4
956627
957870
958662
957890
957257
959002
958135
5
820941
821186
821366
821567
820730
821232
822097
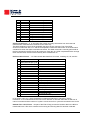
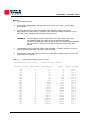
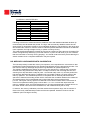
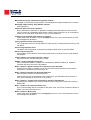
The SL0 indicates that the Standard Lamp test was performed with Filter Wheel #2 in position 0 (ie
no neutral-density attenuation). CY is the number of slit-mask oscillations over which the counts
were accumulated. ZEN and MU are the current solar-zenith angle and airmass respectively (these
are irrelevant to the SL test and are presented for operator information only). The next six columns
are the photon count totals for the dark channel and the five operational channels. When all seven
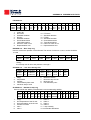
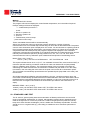
measurement runs are complete the program corrects the raw photon counts for dark count,
deadtime, and temperature-dependence, then prints a series of summary statistics:
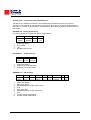
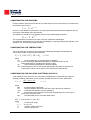
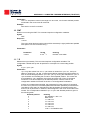
20:56:22
Mean1
1102170
+ 483
Feb 21/85 65.763 2.395 27 C DEG SL 0
mean5 MS(4) MS(5) MS(6) MS(7) MS(8) MS(9)
821302 -623
-426
-488
-694
596
418
+ 445
+3
+5
+5
+4
+ 15
+9
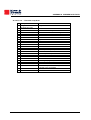
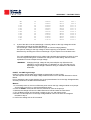
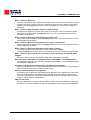
The first line shows the time, date, solar-zenith angle, airmass, instrument temperature and test
identification. The second line of data displays the mean corrected count for channels 1 and 5, the
single-ratios MS(4) through MS(7), and the double-ratios MS(8) (the SO2 ratio), and MS(9) (the O3
ratio). The derivation and interpretation of these values is detailed under Preliminary Data
Reduction.
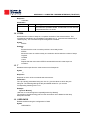
The third line of data shows the standard deviation for each of the quantities in the line above
(there is no ASCII symbol for '±', hence the leading '+' sign).
The single-ratios MS(4) through MS(7) should remain reasonably constant from test to test; the
allowable drifts in the SO2 (MS(8)) and O3 (MS(9)) double-ratios are about ±1.5%.
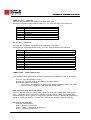
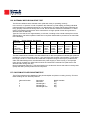
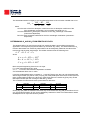
THERMAL TESTS
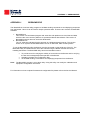
The Thermal Tests consist of a battery of diagnostics which determine the extent to which the
spectrophotometer's performance is affected by temperature.
Measurements are made with the quartz-halogen (standard) lamp. Light intensity measurements
are taken at a number of points which span the temperature range -10 to +40 °C. The wavelength
setting must be recalibrated (via the HG command) at each new temperature before the standardlamp intensities are measured. These intensity data are analyzed to yield the absolute temperature
coefficients for each of the five operational wavelengths; the negative of each coefficient is stored
in the instrument Constants File for subsequent use during data reduction.
During the course of the Thermal Tests all of the Brewer electromechanical subsystems should be
thoroughly exercised, and any malfunction corrected.
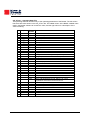
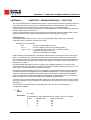
The PRFILE.BAT program is used to process the data and determine the temperature coefficients
for the brewer.
MKIII OPERATOR’S MANUAL
103