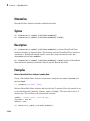
1
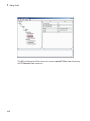
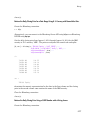
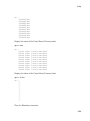
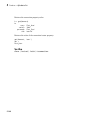
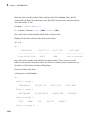
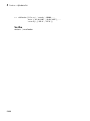
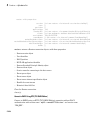
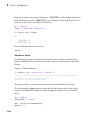
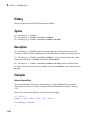
timeseries
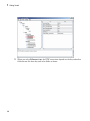
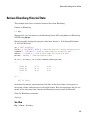
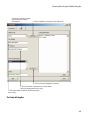
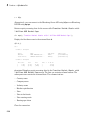
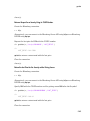
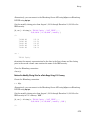
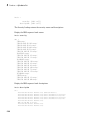
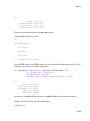
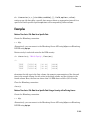
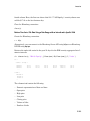
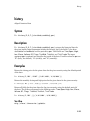
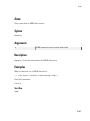
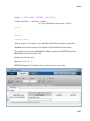
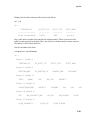
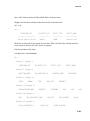
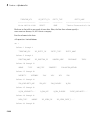
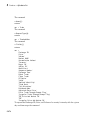
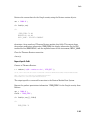
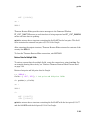
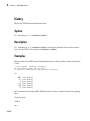
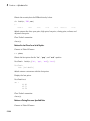
fourth column. Here, the first row shows that 200 'F US Equity' security shares were
sold for $17.09 on the last business day.
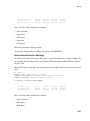
Close the Bloomberg connection.
close(c)
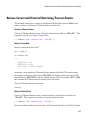
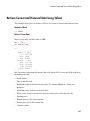
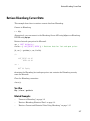
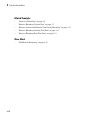
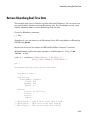
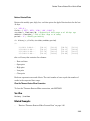
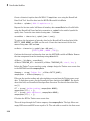
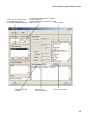
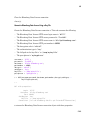
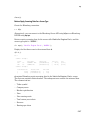
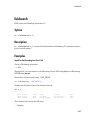
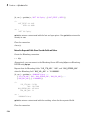
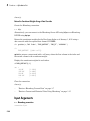
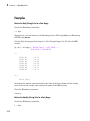
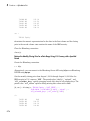
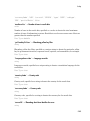
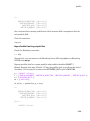
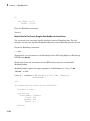
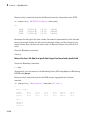
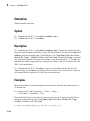
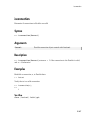
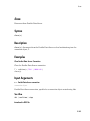
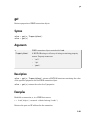
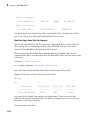
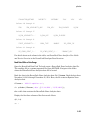
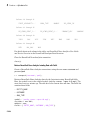
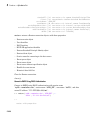
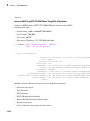
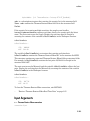
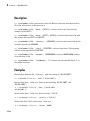
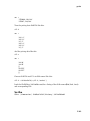
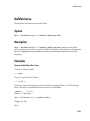
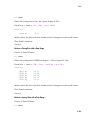
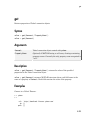
Retrieve Time-Series Tick Data Using a Date Range with an Interval and a Specific Field
Create the Bloomberg connection.
c = blp;
Alternatively, you can connect to the Bloomberg Server API using blpsrv or Bloomberg
B-PIPE using bpipe.
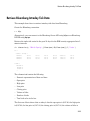
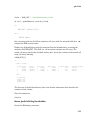
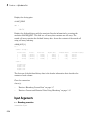
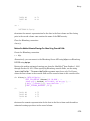
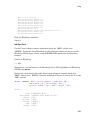
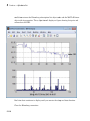
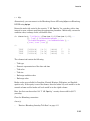
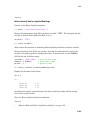
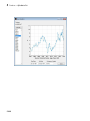
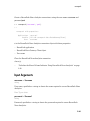
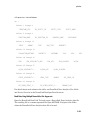
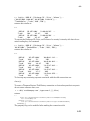
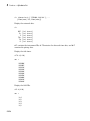
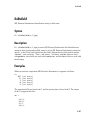
Retrieve the trade tick series for the past 50 days for the IBM security aggregated into 5minute intervals.
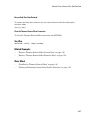
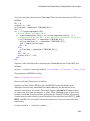
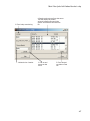
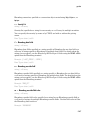
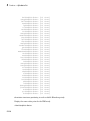
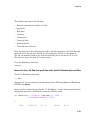
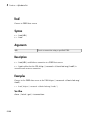
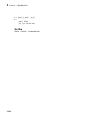
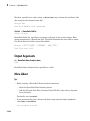
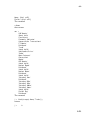
d = timeseries(c,'IBM US Equity',{floor(now)-50,floor(now)},5,'Trade')
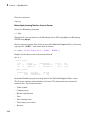
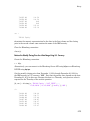
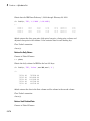
ans =
Columns 1 through 7
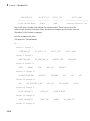
735487.40
735487.40
735487.40
...
187.20
187.03
186.78
187.60
187.13
186.78
187.02
186.65
186.40
187.08
186.78
186.47
207683.00
46990.00
51589.00
560.00
349.00
399.00
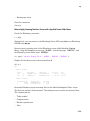
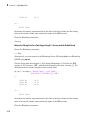
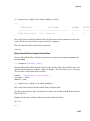
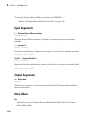
Column 8
38902968.00
8779374.00
9626896.00
...
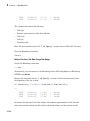
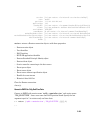
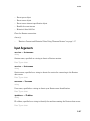
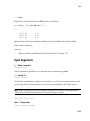
The columns in d contain the following:
• Numeric representation of date and time
• Open price
• High price
• Low price
• Closing price
• Volume of ticks
• Number of ticks
5-133