1
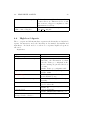
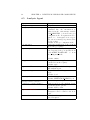
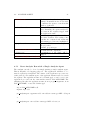
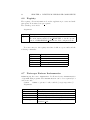
PTF User’s Guide - Working version
Robert Mijakovi´c
June 15, 2014
2
Contents
1 Quick Start
1.1 Installation . . . . . . . . . . . . . . . . . . . . . . .
1.1.1 Analysis Toolkit . . . . . . . . . . . . . . . .
1.1.2 SuperMUC specific installation requirements
1.1.3 Periscope GUI for Eclipse . . . . . . . . . . .
1.2 Preparing an analysis run . . . . . . . . . . . . . . .
1.2.1 Incremental analysis . . . . . . . . . . . . . .
1.2.2 Specification of a phase region . . . . . . . .
1.2.3 Modify your makefile for instrumentation . .
1.2.4 Starting an Analysis Run . . . . . . . . . . .
.
.
.
.
.
.
.
.
.
.
.
.
.
.
.
.
.
.
.
.
.
.
.
.
.
.
.
.
.
.
.
.
.
.
.
.
.
.
.
.
.
.
.
.
.
5
5
5
5
6
7
7
7
8
10
2 Examples
13
3 Known Issues
15
4 Individual Periscope Components
4.1 Environment Variables . . . . . . . . . . . . . . .
4.2 Periscope Configuration File . . . . . . . . . . . .
4.3 Frontend . . . . . . . . . . . . . . . . . . . . . . .
4.4 High-level Agents . . . . . . . . . . . . . . . . . .
4.5 Analysis Agent . . . . . . . . . . . . . . . . . . .
4.5.1 Start Analysis Run with a Single Analysis
4.6 Registry . . . . . . . . . . . . . . . . . . . . . . .
4.7 Periscope Fortran Instrumenter . . . . . . . . . .
4.8 Periscope C/C++ Instrumenter . . . . . . . . . .
4.9 Instrumentation of User-defined Regions . . . . .
4.10 Instrumentation wrapper . . . . . . . . . . . . .
. . . .
. . . .
. . . .
. . . .
. . . .
Agent
. . . .
. . . .
. . . .
. . . .
. . . .
.
.
.
.
.
.
.
.
.
.
.
.
.
.
.
.
.
.
.
.
.
.
.
.
.
.
.
.
.
.
.
.
.
17
17
18
18
23
24
25
26
26
27
28
29
Introduction
Periscope is a scalable automatic performance analysis tool currently under
development at Technische Universit¨at M¨
unchen. It consists of a frontend,
a hierarchy of communication and analysis agents and a GUI for analyzing
3
4
CONTENTS
the results. Each of the analysis agents, i.e. the nodes of the agent hierarchy, searches autonomously for inneficiencies in a subset of the application
processes.
The application processes are linked with a monitoring system that provides the Monitoring Request Interface (MRI). The agents attach to the
monitor via sockets. The MRI allows the agent to configure the measurements; to start, halt, and resume the execution; and to retrieve the performance data. The monitor currently only supports summary information.
The application and the agent network are started through the frontend
process. It analyzes the set of processors available, determines the mapping
of application and analysis agent processes, and then starts the application
and the agent hierarchy. After startup, a command is propagated down to
the analysis agents to start the search. The search is performed according
to a search strategy selected when the frontend is started. At the end
of the local search, the detected performance properties are reported back
via the agent hierarchy to the frontend. Periscope starts its analysis from
the formal specification of performance properties as C++ classes. The
specification determines the condition, the confidence value, and the severity
of performance properties.
Chapter 1
Quick Start
1.1
1.1.1
Installation
Analysis Toolkit
Before you first use Periscope, you have to create the configuration file
.periscope in your home directory. You may copy it from $PERISCOPE ROOT,
i.e. location of your Periscope source code.
cp $PERISCOPE ROOT/docs/periscope.sample/.periscope
It should look like:
MACHINE = SuperMUC
SITE = LRZ
REGSERVICE HOST = localhost
REGSERVICE PORT = 50001
REGSERVICE HOST INIT = localhost
REGSERVICE PORT INIT = 50001
APPL BASEPORT = 51000
AGENT BASEPORT = 50002
1.1.2
SuperMUC specific installation requirements
First insert module load periscope into your .bashrc file on SuperMUC and
execute source .bashrc. Just loading the module on the command line is not
sufficient.
You also have to make sure that you can login using SSH with a private
key. This is essential for startup of the agent hierarchy as it is creating using
the SSH protocol.
1. mkdir ~/.ssh
2. cd ~/.ssh
3. ssh-keygen -t rsa -N ” -f id rsa
4. cat id rsa.pub >> authorized keys
5. chmod 600 authorized keys
5
6
CHAPTER 1. QUICK START
However, if you want to run Periscope only on your local compute, you
have to define the MACHINE option above as localhost. This will force the
toolkit to start the agents locally and does not require any SSH support.
1.1.3
Periscope GUI for Eclipse
Periscope provides a convenient graphical user interface aimed at enhancing
the analysis and the post-processing of the collected performance data. It
is developed as a plug-in for Eclipse in order to integrate with other available programming tools such as C/C++ Development Environment (CDT),
Fortran IDE (Photran), Remote System Explorer (RSE), etc. It currently
consists of three interconnected views that present the detected properties
and provide an overview of the instrumented code regions.
internal Update Manager of Eclipse. This also makes it easier to change
to a newer version whenever available. Following are the steps that have to
be done to install Eclipse and the GUI for Periscope:
• Install Java SE 1.6 Runtime Environment.
• Install Eclipse
– Go to http://www.eclipse.org/downloads and choose the distribution package that best fits your needs. The most common
selection would be the Eclipse IDE for C/C++ Developers.
– You will be redirected to a web site from which you can download
the chosen archive package.
– After downloading, simply extract the archive to folder.
– This completes the installation of Eclipse. The IDE is started by
running ./eclipse from within the extracted folder.
• (Optional) Install the Remote System Explorer (RSE)
• (Optional) Install Photran
• Install the Periscope GUI for Eclipse
– Add the update site of the plugin:
∗ Select Help→Install New Software menu.
∗ Click on Add at the top right side of the window to display
a dialog for adding new update sites.
∗ Enter Periscope GUI for the Name field.
∗ Enter http://www.lrr.in.tum.de/~petkovve/psc/eclipse
for the Location field.
∗ Click OK to add it and go back to the previous window.
1.2. PREPARING AN ANALYSIS RUN
7
– Select the update site by entering Periscope GUI in the Work
with field.
– Select the Periscope Toolkit from the table with the provided
features and click Next.
– Eclipse will calculate all dependencies and then it will show a list
of all plug-ins to be installed. Click Next to confirm this selection
and continue.
– You should accept the license (required by Eclipse for all plug-ins)
and click Next again to start the installation.
– After the downloading and installing everything, Eclipse will ask
you is you want to restart it. It is highly recommended that you
choose Yes so that the IDE can cleanly load the newly installed
software.
1.2
1.2.1
Preparing an analysis run
Incremental analysis
Periscope performs an incremental analysis, i.e., it determines performance properties based on measurements, decides on possible new candidate
properties and performs a new experiment to measure those data required
to check whether the candidate properties hold. This incremental analysis
thus requires execution of multiple experiments.
The experiments can be done during the same application run, if a repetitive region is specified as phase region. The application is suspended at
the end of the phase region, new measurements are requested and the application is released. When the application encounters again the end of the
region, it is suspended and the measured values are retrieved.
The experiments can also be done for entire executions of the application.
If no phase region is specified, Periscope will automatically restart the
application to perform new experiments, until no new candidate properties
are found and the search terminates.
1.2.2
Specification of a phase region
The phase region can be specified as a user region via directives:
Fortran:
!$MON USER REGION
S1
S2
...
!$ MON END USER REGION
8
CHAPTER 1. QUICK START
C/C++:
#pragma start user region
S1
S2
...
#pragma end user region
1.2.3
Modify your makefile for instrumentation
To enable performance measurement, the program has to be instrumented.
This is done via a source instrumenter. Therefore, adopt your makefile in
the following way:
Replace in the compilation of the files the compiler, e.g., mpif90 -c
<args>, with psc instrument <psc options> mpif90 -c <args>. Replace
also in the link step the compiler with psc instrument <psc options> <compiler> <args>. The ”-c” argument will direct the script to instrument and
compile instead of linking the application.
The <psc options> to start with are: -v -t user,mpi -s <executable>.sir.
The option -v switches to verbose mode, -t specifies the regions to instrument, and -s the name of the SIR file. The SIR file stores static information
about the program and is read by Periscope. If the SIR file has the same
name as the executable and the extension .sir, Periscope will find it automatically.
You might want to use with the -t switch also the specification none that
switches of the instrumentation. Files that are not instrumented cannot be
analyzed in detail but this switch allows you to circumvent any problems
with the source instrumenter.
When the application is build, psc instrument creates a configuration file
for the instrumentation, namely psc config inst. You can modify the regions
to be instrumented for each file separately by changing the appropriate line.
When you next build the application, you remove the -t option and the
specification in psc config inst is applied.
Periscope currently supports Fortran and C/C++ programs.
Example Makefile:
MPIF90 = mpif90
# Instrument with phase region for faster analysis
IFC = psc instrument -s cx.sir -t user,sub,loop,call
$(MPIF90)
1.2. PREPARING AN ANALYSIS RUN
9
# Instrument without phase region for application restart
# IFC = psc instrument -s cx.sir -t sub,loop,call
$(MPIF90)
cx:
global.o init.o b node.o csendxs.o main.o sindex.o velo.o bound.o
curr.o maxv.o temp.o crecvxs.o konst.o n node.o testin.o
$(IFC) -autodouble -o $@ $+
.f.o: global.o
$(IFC) -autodouble -O3 -c $+
clean:
rm -rf *.o cx cx.sir global.mod compmod inst instmod prep
Example psc config inst file:
# which files are to be instrumented for Periscope?
#
# id filename [all none mod only user sub call loop omp mpi]
#
1 global.f
2 init.f sub loop user call
3 b node.f sub loop user call
4 csendxs.f sub call
5 main.f sub user loop call
6 sindex.f sub user loop call
7 velo.f sub user loop call
8 bound.f sub user loop call
9 curr.f sub user loop call
10 maxv.f sub user loop call
11 temp.f sub user loop call
12 crecvxs.f sub call
13 konst.f sub user loop call
14 n node.f sub user loop call
15 testin.f sub user loop call
Instrument, compile and link the application
The instrumented application has to be linked with several libraries. Everything is done automatically after you modified your makefile.
10
CHAPTER 1. QUICK START
Re-instrumentation
The instrumented application has to be linked with several libraries. Everything is done automatically after you modified your makefile.
1.2.4
Starting an Analysis Run
In an interactive mode the number of analysis agents is determined according
to the frontend parameter maxcluster. The number of high level agents
results from the maxfan specification.
In a batch job running on SGI Altix, the number of agents is again
computed based on maxcluster. For each host (a01..a19) with processors
allocated for the batch job one high-level agent is started. All the high-level
agents are children of the master agent (the root of the agent hierarchy).
Starting the registry The Periscope agents and the application processes
register with a registry. The registry is started via:
psc regsrv &
The port of the registry will be taken from the environment variable
PSC REGISTRY or from the REGSERVICE PORT in the configuration
file. It will run on the host where it was started. Starting the Analysis via
the Periscope Frontend Periscope is started via the frontend. It will first
contact the registry and then start the application. After all application
processes registered with the registry, the agent hierarchy will be started, the
analysis agents connect to the application processes and the search starts.
The command is:
psc frontend --apprun=~/psctest/add/add --mpinumprocs=4 --strategy=MPI
--debug=1
Option
--apprun=<command line>
--sir=<appl.sir>
--propfile=<filename>
--strategy=<strategy>
--mpinumprocs=<np>
--ompnumthreads=<threads>
Description
Specify the command line to start the
application. It will be passed to the
mpirun command.
SIR file to be used during the analysis
Store the detected properties into filename (default: properties.psc)
Specify one of the following strategies: MPI, SCA, SCABF, P6, P6BF,
P6BF Memory, SCPS BF, scalability OMP. Please note: Some strategies
are platform dependent.
Number of MPI processes for the application.
Number of OpenMP threads.
1.2. PREPARING AN ANALYSIS RUN
--debug=<level>
--force-localhost
11
Level of debug output.
Locally start the agents instead of using SSH.
Periscope will automatically restart the application for multiple experiments if no phase region is specified, i.e., either there is no user region or it
is not instrumented.
Periscope and batch jobs
Periscope can be used in batch jobs. It is recommended to start a local
registry in a batch job to ensure that the registry is running when the batch
job is started.
Example batch script:
#!/bin/bash
#PBS -j oe
#PBS -S /bin/bash
#PBS -l select=80:ncpus=1
#PBS -l walltime=0:20:00
#PBS -N cx64
#PBS -M [email protected]
#PBS -m e
. /etc/profile
cd psc/test/cx parallel/
psc regsrv &
sleep 10
sudo /lrz/sys/lrz perf/bin/lrz perf off hlrb2
psc frontend --apprun=cx --mpinumprocs=64 --strategy=SCA --debug=1
#!/bin/bash
#
#@ job type = parallel
#@ class = test
#@ island count = 1
#@ node = 1
#@ wall clock limit = 1:12:30
#@ job name = add
#@ network.MPI = sn all,not shared,us
#@ initialdir = $(HOME)/TestingRepository/add/
#@ output = $(jobid).out
#@ error = $(jobid).err
12
CHAPTER 1. QUICK START
#@ notification = never
#@ notify user = gerndtin.tum.de
#@ queue
. /etc/profile
. /etc/profile.d/modules.sh
psc frontend --apprun=add --mpinumprocs=4 --sir=add.sir --tune=demo -force-localhost --debug=1
Analyzing the detected performance properties
The frontend will write the properties found into the file properties.psc.
This file is in XML format and can be opened with the any off-the-shelf text
editor or a spreadsheet application.
Due to the textual character of the data stored by Periscope and its
summarized form, a multi-functional table is used in the GUI for Eclipse
for the visualization of the bottlenecks. To reorganize the displayed data so
that maximum knowledge can be gathered out it, the table features:
• Multiple criteria sorting algorithm
• Complex categorization utility
• Searching engine using Regular Expressions
• Filtering operations
• Direct navigation from the bottlenecks to their precise source location
using the default IDE editor for that source file type (e.g. CDT/Photran
editor).
An outline view for the instrumented code regions that were used in an
experiment is also available. The information it shows is a combination of
the standard intermediate representation of the analyzed application and
the distribution of its bottlenecks. The main goals of the view are to assist
the navigation in the source code and attract developer’s attention to the
most problematic code areas.
The multivariate statistical clustering is another key feature of the plugin that enhances the scalability of the GUI and provides means of conducting
Peta-scale performance analysis. It can effectively summarize the displayed
information and identify a runtime behavior possibly hidden in the large
amount of data.
Chapter 2
Examples
You can find two examples with the adapted makefile in ~/psc/test/add and
~/psc/test/cx parallel. Both directories include a file makefile.psc instrument.
13
14
CHAPTER 2. EXAMPLES
Chapter 3
Known Issues
• Automatic restart of the application does not work on the Bluegene.
Make sure, you specify a user region that is executed repetetively.
• C instrumentation: The name of an OMP pragma should not occur
again as a string in another context in this pragma, e.g., in a variable
name.
• Measurements might be wrong in recursive algorithms.
15
16
CHAPTER 3. KNOWN ISSUES
Chapter 4
Individual Periscope
Components
4.1
Environment Variables
Option
PERISCOPE ROOT
PSC REGISTRY
name>:<port>
PSC APPNAME
<host-
PERISCOPE DEBUG
PSC APP BASEPORT
Description
Root directory of the Periscope installation.
It includes Periscopes configuration file.
Specifies the host and port of the registry service.
Specifies the name of the application. It is
either set by the frontend if it starts the application or can be set by the programmer
before starting the application. If it is not
set, the default appl will be used.
0..6
0=quiet
1=startup, found properties in each search
2=candidate properties and found properties
in each strategy step
3=details on refinement
4=
5=very detailed info including the values received by the agents from the application
monitor.
6=individual measurements coming from the
application monitoring.
It is used by the application monitor and determines the first port used by MPI process
with rank 0.
17
18
CHAPTER 4. INDIVIDUAL PERISCOPE COMPONENTS
PSC AGENT BASEPORT It defines the port of the frontend and the
analysis agents, if it is not specified as command line parameter.
4.2
Periscope Configuration File
The configuration of Periscope can be loaded from a configuration file. Its
name is .periscope. It has to be located in your home directory. The precedence is: command line parameters, environment variables, specification
in the configuration file, and finally defaults hardcoded in the program’s
sources.
Option
REGSERVICE HOST
REGSERVICE PORT
APPL BASEPORT
AGENT BASEPORT
4.3
Description
Specifies the host of the registry. It is ignored
by the registry itself. The host will be the one
were the registry is started.
Specifies the port at which the registry is waiting
for connections.
Specifies the base port for the application monitor. The monitor linked to each process will
listen at the baseport+rank.
Specifies the base port for the frontend and the
agent hierarchy. The base port will be used
by the frontend. The agents will increment the
baseport to obtain unique ports.
Frontend
The frontend starts up the application and the agent hierarchy.
Option
--help
-registry=<Hostname>:<port>
Description
Help information
If registry is not specified on the command line, the information is taken from
the Periscope configuration file. An error
message is generated if it does not exist.
Default: Periscope configuration file
4.3. FRONTEND
--port=<port>
--maxfan=<n>
--maxcluster=<n>
19
The port to be used by the frontend. It is
also used as base port for other analysis
agents.
Default: 30000
Determines the fan-out of the tree of
high-level agents in interactive mode.
Default: 4
Maximum number of processors (MPI
processes * OpenMP threads) analyzed
by a single analysisagent.
It is not used on the Bluegene since
the analysisagents are running on the
IO nodes. All processes on the compute
nodes of an IO nodes connect to its
analysisagent.
--phase=<fileid:rfl>
Default: 4
Specifies the phase region via the fileid
and the region first line number.
If no phase region is specified, a user
region is selected if at least one is given
in the code. If multiple are given, it is
undefined which is selected. If no user
region is given, the main program is
the user region and the program will be
restarted for each strategy step.
If you mark the phase region via a
user region and would like to use user
regions also to guide analysis, you have to
give the fileid and rfl for the phase region.
20
CHAPTER 4. INDIVIDUAL PERISCOPE COMPONENTS
--appname=<name>
--apprun=<appl cmdline>
--ompnumthreads=<n>
--mpinumprocs=<n>
--bg-mode=SMP|DUAL|VN
--timeout=<secs>
--debug=level
It specifies the application to be searched
for in the registry. If the value is defined,
it will be passed to the application
processes via PSC APPNAME and to
the analysis agents via a command line
parameter. This variable is set by the
frontend.
Default:
appl<pid>is constructed
based on the pid of the frontend process
This is the command line used by pbsdsh
to start an application process. It should
be the same as in mpirun np procs <appl
cmdline>.
Number of OMP threads to be started per
MPI process.
Number of MPI processes to be started.
The node mode used on the Bluegene.
Timeout for startup of the agent hierarchy.
Default: varying depending on the number of processes
Level of debugging. All debug output up
to that level will be printed.
Default: PERISCOPE DEBUG or 0
4.3. FRONTEND
--selectivedebug=<level>,<level>...
--dontcluster
--strategy=<strategyname>
21
List of debug levels. Messages of those
levels will be printed. The levels are
identified via names.
The following levels are supported:
Autoinstrument: info about automatic
intrumentation
AgentApplComm: communication between agents and application
OnlineClustering: online clustering in
high level agents.
MRItrace: Traces start/end region in P0
into MRIDebugOut.txt
SCAovhd: Debugs MRI overhead in SCA
FrontendStateMachines: Debugs state
machine
AutotuneAll:
AutotunePlugins:
AutotuneSearch:
AutotuneAgentStrategy:
Debugs the
analysis strategy used in the analysis
agent for tuning
Do not use online clustering for the detected bottlenecks.
Strategy used by analysisagent. Currently
one of
MPI - MPI Communication analysis
OMP - OpenMP analysis
P6 - Power6 Analysis (only on Power6
machines)
P6BF - Power6 Breadth First (only on
Power6 machines)
P6BF Memory - Power6 Memory Behavior Analysis (only on Power6machines)
SCPS BF - Generic memory analysis
strategy
scalability OMP - Automatic OpenMP
scalability analysis
22
CHAPTER 4. INDIVIDUAL PERISCOPE COMPONENTS
--sir=<filename>
SIR file of the application to be analyzed.
Default: The file name is composed
of the executable’s name and the extension .sir. If --apprun is omitted, the
default is appl.sir.
--propfile=<filename>
Specify the file to use when exporting the
properties.
Default: properties.psc
--srcrev=<source revision>
Specify the source code revision. It will be
written in the output file.
--delay=<n>
Number of phase executions that are
skipped before the search is started. This
is useful for applications that have a different behavior at the beginning.
--nprops=<n>
Specifies the number of properties the
frontend prints to standard output. Default is 50.
-Automatic instrumentation strategy. The
inst=overhead|all overhead|analysis
overhead and all overhead strategy will
first determine too fine granular regions
and remove their instrumentation. It will
then apply the selected analysis strategy.
The overhead strategy removes the overhead that influences the single node measurements but other overheads may lead
to a prolongation of the execution. The
all overhead strategy removes all overhead
so that the prolongation of the execution
will be negligible.
The analysis instrumentation strategy will
first determine too fine granular regions
and will then instrument exactly those regions that are required in the next experiment.
--inst-folder=<relative path> Path to the folder with the instrumented
sources relative to the execution directory.
This is needed to modify the instrumentation in during automatic instrumentation.
4.4. HIGH-LEVEL AGENTS
23
--src-folder=<relative path>
Path to the source folder relative to the execution directory. This is needed to touch
the sources to trigger recompilation of the
instrumented versions.
File name with relative path to the
psc inst config file.
--psc-inst-config=<relative
path to inst config file>
4.4
High-level Agents
The root agent and all intermediate agents in the hierarchy are high-level
agents. In interactive mode the hierarchy is determined via maxfan and
maxcluster. In batch mode for each node a separate high-level agent is
allocated.
Arguments
Option
--help
--registry=<Hostname>:<port>
--port=<port>
--tag=<tag>
--parent=<Hostname>:<port>
--dontcluster
--timeout=<secs>
--debug=level
--selectivedebug=<level>,<level>...
Description
Help information
If registry is not specified on the command line, the information is taken
from the Periscope configuration file.
An error message is generated if it does
not exist.
Default: Periscope configuration file
The port to be used by the agent.
Default: 30000
All debug messages and the registry entry are marked by tag.
Port of the parent agent in the agent
hierarchy.
Do not use online clustering for the detected bottlenecks.
Timeout for startup of agent hierarchy.
Default: 20
Level of debugging.
Default: PERISCOPE DEBUG or 0
List of debug levels (see frontend).
24
4.5
CHAPTER 4. INDIVIDUAL PERISCOPE COMPONENTS
Analysis Agent
Option
--help
--registry=<Hostname>:<port>
--dontregister
--port=<port>
--appname=<name>
--parent=<Hostname>:<port>
--tag=<string>
--debug=level
--selectivedebug=<level>,<level>...
--strategy=<strategyname>
--phase=<fileid:rfl>
--sir=<filename>
Description
Help information
If registry is not specified on the
command line, the information is
taken from the environment variable
PSC REGISTRY or from Periscope’s
configuration file. If registration is required, i.e., dontregister is not specified, an error message is generated if it
does not exist.
Default: Periscope configuration file
Suppresses registration of the agent in
the Periscope registry.
The port to be used by the agent. If it
is not specified, the port is taken from
PSC AGENT BASEPORT or from
the configuration file.
Default: 30000
It specifies the application to be
searched for in the registry.
Default: appl
High level agent which is the parent of
this analysis agent.
Tag to be used in debug or error messages.
Default: local
Level of debugging.
Default: PERISCOPE DEBUG or 0
List of debug levels (see frontend).
Strategy used by the analysis agent.
See the Frontend options.
Default: MPI + SCA
Specifies the phase region. A detailed
description can be found for the frontend.
SIR file of the application to be analyzed. Required.
4.5. ANALYSIS AGENT
25
--threads=<n>
Number of threads for application
startup. In standalone mode it is used
to instruct the agent to search in this
number of threads.
--id=<id1>,<id2>...
List of MPI process ids from the registry. If missing, the agent searches for
processes in the registry tagged with
the application name.
--searches=<n>
Analysis agent performs this number of
successive searches. The results of the
searches are compared and additional
and missing properties are highlighted.
--propfile=<filename>
Specify the file to use when exporting
the properties.
Default: properties.psc
--srcrev=<source revision>
Specify the source code revision. It will
be written in the output file.
--delay=<n>
<n>instances of the phase will be
skipped.
--inst=overhead|all overhead|analysis
see frontend
4.5.1
Start Analysis Run with a Single Analysis Agent
The analysis can also be done by simply starting a single analysis agent.
This is helpful for debugging purposes. The application will have to be
started separately via mpirun. The entries of the application processes are
either passed to the analysis agent or the application name is used to search
the registry. The application name is by default appl or can be set for the
application processes via the environment variable PSC APPNAME. The
analysis agent takes the application name from a program argument, from
PSC APPNAME, or uses the default appl.
export PSC APPNAME=add
mpirun -np 4 add
psc analysisagent --appname=add --sir=add.sir --strategy=MPI --debug=0
or
psc analysisagent --sir=add.sir --strategy=MPI --id=1,2,3,4
26
CHAPTER 4. INDIVIDUAL PERISCOPE COMPONENTS
4.6
Registry
The registry collects information about the application processes and analysis agents. It is started via psc regsrv&
The default port is 31337.
Arguments
Option
<port>
Description
Specification of the port to be used. It can also be defined via
the environment variable PSC REGISTRY or via the specification of REGSERVICE PORT in the PSC configuration file.
You can connect to the registry via telnet localhost <port>and send the
following commands:
Option
List
Clean
Help
Liststr <id>
quit
4.7
Description
Show the entries
Removes all entries
Shows list of commands
hows strings attached with entry id.
Disconnect
Periscope Fortran Instrumenter
f90inst.ia64 is the source instrumenter. It allows selective instrumentation
of OpenMP F90 programs. The instrumentation can be done separately for
each source file.
Syntax:
f90inst <options>* <file><file-id>[<region-specifier>]*
Arguments
Option
-f
-I <path>
-M <path>
-S
-P <string>
Description
Source file is in fixed format.
Search path for include files and module files.
Location where module files are placed.
Generate SIR file with static program information
Postfix to the file name of the generated file. The
default is inst.
4.8. PERISCOPE C/C++ INSTRUMENTER
-d <n>
-h
-i <n>
<file>
<file-id>
<region-specifier>
4.8
27
n=1: Switch on debug information.
This information.
Switch on information about the instrumentation
process. n is the sum of the requested information
according to the following table:
1: command line arguments
2: NAGf90 syntax tree
4: NAGf90 symbol and scope table
8: current node number
16: current region
32: Jump addresses and references
64: exception handling
128: OMP and instrumentation directive handling
256: region tree
File to be instrumented.
file number used to identify the region’s position.
Specifies the region types to be instrumented.
all: all regions
call: call statements
forall: forall statements
io: IO statements
loop: outermost loops only
nestedloop: non-perfectly nested loops
sub: subroutines
vect: vector statements
omp: OMP constructs except atomic.
par: OMP parallel and worksharing constructs
sync: OMP synchronization statements except
atomic
user: user regions
mpi: mpi function calls are instrumented with
their location in the application sources. It is included in the call specification.
Periscope C/C++ Instrumenter
psc cinst is the source-level instrumenter based on the instrumenter from
TAU. In combination with PDB Comment from TAU, it allows selective
instrumentation of OpenMP C/C++ programs. The instrumentation can
be done separately for each source file.
28
CHAPTER 4. INDIVIDUAL PERISCOPE COMPONENTS
Syntax:
psc cinst <source file.pdb> <source file.c> -o <instr file.c> --sir <sirname> --ompdetails <source file.inc > --filenr <file-id> --regions <regionspecifier>
Arguments
Option
<source file.pdb>
<source file.c>
-o <instr file.c>
--sir <sirname>
--ompdetails <source file.inc>
--filenr <file-id>
--regions <region-specifier>*
Description
A database file containing information about the
source code. This is generated by EDG and it is
internally used by the instrumenter.
File to be instrumented.
Filename to use when storing the result of the instrumentation. Defaults to source file.c.inst.c
Static information generated by PDBComment
about the location of OpenMP regions.
File number used to identify the region’s position.
Specifies the region types to be instrumented.
Currently this defaults to ALL. Subroutines will
always be instrumented.
all: all regions
loop: outermost loops only
sub: subroutines
omp: OMP constructs except atomic.
user: user regions
mpi: mpi function calls are instrumented with
their location in the application sources. It is
included in the call specification.
4.9
Instrumentation of User-defined Regions
Single entry and exit program regions can be defined by the user via the
monitoring directives.
Fortran:
!$MON USER REGION
S1
S2
...
4.10. INSTRUMENTATION WRAPPER
29
!$MON END USER REGION
C/C++:
#pragma start user region
S1
S2
...
#pragma end user region
User regions are instrumented via the region specifier user. Multiple user
regions can be specified in the code. If a user region is the phase region, you
can omit the specification for the frontend if this is the only user region in
the code.
4.10
Instrumentation wrapper
psc instrument command allows to prepare applications for analysis with
Periscope. In the existing makefile, the compilation step generating the
object files has to be modified such that the compiler is prepended with
psc instrument. The script will preprocess the file, instrument it, and finally
call the compiler for generation of the instrumented object file. In addition,
the compiler has to be augmented in the link step by psc instrument. Here
psc instrument will link also the monitoring library to the executable as well
as generate the SIR file with the program’s static information.
The instrumentation is controlled by a file called psc inst config in which
the file id and the region types to be instrumented can be determined for
each file individually.
psc instrument [-t <regions>] [-s <sir >] [-f] [-n] [-d] [-v] <compiler>
[<options>] <file> [<libs>]
If ”-c” is specified in the options list, psc instrument will instrument and
compile the given file. Otherwise it will link the application.
Arguments:
Option
Description
30
CHAPTER 4. INDIVIDUAL PERISCOPE COMPONENTS
-t <regions>
List of region types to be instrumented. This overwrites
the specification in psc inst config.
Here are the most important region types. Other region
types supported by the instrumenter can als be specified.
all: all regions
none: no instrumentation, files are only compiled
mod only: no instrumentation but processing by the
instrumenter to generate compatible module files.
call: call statements
loop: outermost loops only
sub: subroutines
omp: OMP constructs except atomic
mpi: mpi functions
user: user regions
-f
-n
-d
-v
<compiler>
-s <SIR file>
<options>
<file>
<libs>
Force a specific Fortran file format: fixed or free
Dryrun: run the makefile without executing the commands
Provide debug information.
verbose
compiler for final compilation of the instrumented files,
e.g., mpif90 or mpicc
This file name will be used for the static program information. It is recommended to name the sir file according
to the executable with an extension .sir.
List of compiler options used in the original call to the
compiler. These are passed to the compiler.
Default: appl.sir
Name of the file to be instrumented. File extensions .f90
and .F90 determined free source format while .f determines fixed source format.
Libraries for linking.