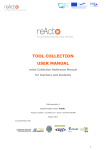
1
Intelligent Tutoring for Life Long Learning USER MANUAL Lifelong Learning Programme KA3 - ICT Project number: 519058-LLP-1-2011-1-IT-KA3-KA3MP With the support of the Lifelong Learning Programme of the European Union. www.intelligent-tutor.eu I‐TUTOR CONFIGURATION ....................................................................................................................................... 3 CREATING THE DOCUMENT CORPUS FOR BUILDING THE I‐TUTOR SEMANTIC SPACE .......................................................................... 3 Criteria for preparing texts and documents ............................................................................................................... 4 Managing more than one language .......................................................................................................................... 5 Interacting with the hidden database........................................................................................................................ 5 Inserting a definition .................................................................................................................................................. 7 Inserting an insight .................................................................................................................................................... 7 Inserting an organization document.......................................................................................................................... 7 Exporting a database ................................................................................................................................................. 7 Importing a database................................................................................................................................................. 8 Creating a new empty database ................................................................................................................................ 8 Loading the structure if the I‐TUTOR database in the new database ........................................................................ 8 Loading data .............................................................................................................................................................. 9 Reading data............................................................................................................................................................ 10 THE I‐TUTOR MAPS THEORETICAL BACKGROUND ........................................................................................................ 11 I‐TUTOR CONCEPTUAL SPACE ............................................................................................................................................ 11 TEACHER/ADMINMANUAL .................................................................................................................................... 16 MONITORING ............................................................................................................................................................... 47 PROFILING ....................................................................................................................................................................... 50 TIMELINE VIEW ................................................................................................................................................................. 52 Options..................................................................................................................................................................... 53 Installation ............................................................................................................................................................... 53 ALERTER .......................................................................................................................................................................... 54 Installation ............................................................................................................................................................... 57 1 OVERVIEW I‐TUTOR is intended to provide intelligent support to the three main actors involved in the learning process through a VLE: - The instructional designer - The tutor - The student. The previous actor names are to be intended as “roles”: the same user can have different roles when interacting with the system but at different times. In few words, a teacher can be an instructional designer when she/he plans the course materials, devises the criteria to be met to accomplish a pedagogical goal, and so on. The same teacher is a tutor when she/he interacts with the VLE to monitor the students, and to assess their results. 2 ITUTOR CONFIGURATION Creating the document corpus for building the I TUTOR semantic space One of the key features in I‐TUTOR is the domain concept map, which forms the base for a series of map‐ based visualizations that are related to monitoring both social and task completion activities of the students as well as enabling teacher self reflection about the homogeneity of the materials with respect to the topics covered in the domain. Due to the multi language implementation requirement, such a tool relies on statistical analysis of text that is “bag of words” approach. In particular, Latent Semantic Analysis (LSA) has been used, which is aimed at building a “semantic space” extracted from a document corpus on the basis of the occurrence frequency of a set of meaningful terms in each document of the corpus. The map will depict emergent semantic correlations between such terms due to the number of documents dealing with them. When creating a new I‐TUTOR course, some requirements have to be satisfied in order to generate a correct semantic space. We need a document corpus that is wide enough to gain statistical significance in representing the course contents.To this aim, suitable tools have been developed to create the corpus. This document is addressed to users with a teacher/administrator role in Moodle (i.e. the person in charge to create a new course) and explains the use of such tools. When a teacher/administrator creates a new I‐TUTOR course, Moodle will insert automatically a hidden database as a section of the course. All the information needed to create the semantic space will go here.As a hidden section, the database will not be visible to the students. The database accepts three kinds of documents: Definitions Insights, i.e. documents used to deepen the topics covered in the course Organization, i.e. documents in support of course management: course schedules, administrative stuff and so on (not used to build the semantic space) Definitions are used to insert a brief description of a key concept to be dealt with and developed throughout the course. Eachdefinitionconsists of threefields: A title, i.e. the actual name of the key concept A field containing tags for annotating the key concept A text field containing the description of the key concept The name of a key concept can be identified with a single word or even with a multi‐word term (maybe no more than two or three words: i.e. “knowledge bases management”). Each key concept can be associated 3 with other ones and with other terms. To this aim, the teacher/administrator can associate to the definition a set of tags. Tags are either a single word or a multi‐word as explained before. Tags are separated by commas. Eventually, the actual description of the key concept is inserted into the database using the text field. Please, record your tags and key concepts apart from the database, and use them to annotate each single section you create in your Moodle course. You will have to create a hidden label in each section that will be used to write a comma‐separated list of either key concepts or tags that are suited to the section. Insight documents have to deal with a specific topic in the course. They should be in a sufficient number to allow the I‐TUTOR system building a comprehensive description of the domain. Eachinsightis made by: A title A set of tags for annotation The actual document Titles should be expressive enough to describe the document content. Each document can be associated to other terms and/or key concepts that are meaningful in the course domains. As a consequence, the teacher/administrator has to associate a set of tags to the documents. Such tags can be either tags and key concepts already used for definitions or completely new words. Tags are subject to the same formatting conditions explained before: comma‐separated list of single or multiple words (i.e. two or three words separated by a blank space). Finally, the document is a file that is uploaded onto the Moodle platform. Organization documents are useful only for the teacher to manage her/his course: they are not directly related with the course domain and they’re not used to build the semantic space. Criteria for preparing texts and documents When building the document corpus, the teacher/administrator has to follow some guidelines. The number of documents to be uploaded/wrote in the Moodle platform must be high enough to ensure a statistical significance of the LSA.Currently, a minimum of three hundred (300) documents is highly recommended. Please, avoid inserting entire books as single documents. As a general guideline a document should cover a well‐defined and precise topic. In particular, documents and/or texts related to a key concept must be very precise describing only the concept itself, while documents and/or texts related to an insight can cover more than a key concept. Returning to the book example, a good strategy could be to upload each subsection dealing with a particular topic inside a chapter as a separate document. The following formats are recognized: PDF; Doc; Txt; PowerPoint. 4 When you prepare texts directly either by typesetting them or cutting and pasting them in the text areas of the database please avoid pending hyphenations, useless pending figure captions, page numbering, headers and footers, and all the formatting stuff. Such text is all “noise” for the LSA engine and can decrease dramatically the performance of the semantic space and the quality of the maps. We acknowledge that such problems can be present in those files that you download from other information sources. Managing more than one language Currently, creating a semantic space made by terms coming from different languages is not possible. Please, ALL THE DATABASE CONTENT MUST BE WRITTEN IN THE SAME LANGUAGE. In this respect, “content” is: titles, tags, definition texts, file contents. In some course domains there are terms coming from a language other than the course language that are relevant for the teacher and the learner. You can cope with this issue either treating the term as a definition or as an explicit tag. In the former case, the foreign term will be placed in the definition title, while in the latter it will be placed in the text field containing tags according to the tag writing rules. Such terms will be automatically added to the vocabulary of the course language. Moreover, they’re relevant terms for the teacher, and will be preserved from automatic filtering that is used to preprocess data when building the semantic space. Interacting with the hidden database The following image shows the section containing the hidden database as it appears when creating a new course. Click on the database name, and you’ll obtain the following screen. Click on the “Add entry” tab and you’ll be able to insert a document belonging to whatever typology into the database, i.e. definitions, insights, and organization documents. 5 The user clicks on the TYPE pull‐down menu, and selects one of the following: Insights Definitions Organization 6 Inserting a definition The user fills the following fields: TITLE: the name of the key concept to be defined goes here; KEYWORDS: comma‐separated list of tags made by either single or multiple words; TEXT: direct writing of the description of the key concept. Inserting an insight The user fills the following fields: TITLE: the title of the document as explained above goes here; KEYWORDS: comma‐separated list of tags made by either single or multiple words; Moreover, the users clicks on the “Choose a file” button, which allows searching a file in the local file system in the user’s computer. Inserting an organization document The user fills the following fields: TITLE: the title of the document goes here; KEYWORDS: comma‐separated list of tags made by either single or multiple words; Moreover, the users clicks on the “Choose a file” button, which allows searching a file in the local file system in the user’s computer. Exporting a database A hidden database can be exported to make it available for generating the semantic space of another I‐ TUTOR course. This functionality has been devised for all the courses sharing a common set of key concepts and terms. Moreover, it is possible to think about an “extended database” for creating a common semantic space that is shared by many courses. To export an I‐TUTOR hidden database as an admin user: Click on the database name Click on the “Presets” tab Click onthe“Export”button Click on the “Export entries” button Please, do not modify export options. 7 Importing a database The overall import procedure consists of three steps: 1. Creating an empty database 2. Loading the structure if the I‐TUTOR database in the new database 3. Loading data. In what follows the previous steps are detailed. Creating a new empty database 1. Create a new section 2. Click on the “Turn editing on” button and onthe “Add an activity” pull‐down menu for actually adding an activity to the section 3. Select the “database” item 4. Select the “Hide” item in the “Visible” pull‐down menu inside “Common module settings” 5. Click on the “Save and display” button Loading the structure if the ITUTOR database in the new database 1. 2. 3. 4. Click on the database name Click on the “Presets” tab Click on the “Choose a file…”button inside “Import from zip file” Select the file exported previously “ITUTOR DATABASE preset******.zip” 8 Loading data 1. 2. 3. 4. 5. Click on “Import entries” in the “Settings” block Click on the “Choose a file …” button Select the file you had exported previously Click on the “Submit”button 9 Reading data 1. Click on the database name 2. Click on the “View list” or “View single” tab 3. If you receive the message “List template is not yet defined” then a. Click on “template” b. Click on “Save template” (do not modify options) 4. Click again on the “View list” or “View single” tab 10 THE ITUTOR MAPS THEORETICAL BACKGROUND ITUTOR Conceptual Space The I‐TUTOR Conceptual space is a bi‐dimensional semantic space of keywords extracted from the hidden database and from the didactical documents of the course; the keywords are clusterized in groups and those which are into the same cluster are words with the same meaning (they mean the same thing). Clusters are distributed so that neighboring clusters in the space contain correlated words, i.e. words that do not mean the same thing but have some conceptualstatistical relation (it will be more clear next). The Latent Semantic Analysis paradigm The I‐TUTOR Conceptual space is computed applying the Latent Semantic Analysis (LSA), that is a paradigm to extract and represent the meaning of words by statistical; words we refer are both the keywords specified by user in the hidden database and the words extracted from the didactical documentsuploaded in the Moodle platforms for the course.The LSA paradigm uses matrix data structure for representing documents and their words: generally, a matrix is a grid of cells organized in rows and columns. A cell is identified by its coordinates (i,j) where i is the row and j the column. According to the LSA paradigm the documentscollection is represented as a matrixA where each row is associated to a word, and each column is associated to a document. The content of the (i, j)‐th cell of Ais a weight of the i‐thword frequency in the j‐thdocument; this weight is initially the number of times given words appears in the document. In the LSA paradigm the matrix A is then approximated by the singular‐value decomposition (SVD) technique (Landauer et al. 1998) for reducing its dimensions. This decomposition outputs three different matrix and it aims to capture the major associational structure in the matrix A and removes the noise given by the accidental variability of terms appearing in the same context. After these processes, each word is represented by a vector, that is a row of a specific matrix outputted from the SVD process. The set of these vectors is the conceptual/semantic space. The semantic space can be created whenever user wants. She can insert new keywords or new documents and chooses to re‐build the semantic space when she considers it necessary. Alternatively, only for documents she can project them in the space without re‐computing it, as will be more clear follow. For keywords instead, she can change the weights they have in the space, highlighting the words she retains more significant. The Self‐Organized Maps For clustering keywords and documents represented as vectors and for showing them by a map, a self‐organizingneural network, and in particular the self‐organizing feature map (SOM) is used. 11 In this neural network, neurons are organized in a lattice, usually in a one‐ or two‐dimensional space; using a two‐dimensional SOM network, it is possible to obtain a map of input space where closeness between units or clusters in the map represents closeness of the input vectors. This network has been used to classify information and documents in "information maps" in the I‐ TUTOR Conceptual space created by performing LSA on the various corpora of learning materials. As a consequence, two documents whose semantics is close, are put together in the same cluster. Given a semantic space (the LSA and the correspondent keywords), the SOM can be used in two different way: 1) forcing learning: in this case the neurons are trained for recognizing input and a new classification is made. It means that the input vectors are used as learning set and SOM builds its "memory" for clustering new input. We mean this step as new SOM creation, and allows user to create different clusters distribution on the semantic space on which next classify the documents; 2) clustering input: in this case, given a SOM (when neurons are already trained), the input vectors are classified by the SOM itself. In the I‐TUTOR plugin, user can choose the SOM she built and prefers. Documents will have different distribution in the space according to the selected SOM. The output of the SOM process is the I‐TUTOR Conceptual space that has three levels of depth; the keywords at high levels have high weights respect to words at lowest levels and so they are most frequents. User can modify this distribution according her evaluations, as next shown. The Conceptual space is represented by the I‐TUTOR Conceptual Map. The I‐TUTOR Conceptual Map The I‐TUTOR Conceptual Map is a graphical representation of a SOM. In particular, the I‐TUTOR Conceptual Map looks as follow: 12 The map has a lattice background of rectangles with same width and height, one for each neuron of the SOM. For example, in the figure the map represents a SOM with 25 neurons (5 rows per 5 columns). The map also shows the clusters generated by the SOM classification; a cluster in the map is the set of cells with the same color. The form of a cluster depends by the cells of which is composed. Different shades of color for the same cluster means the documents distribution among the cluster itself. In particular, a cell with more documents has more luminance than others in the same cluster. Low luminance means that there are fewer documents, high luminance means that there are many documents. Once your mouse hover is on a cluster, a label with the keywords for the cell is shown on the mouse hover, ordered according to their weights. Managing the I‐TUTOR Conceptual Map The main feature of the I‐TUTOR Map plugin is the possibility to tailor the I‐TUTOR Conceptual space (LSA, Keywords weights and SOM), hence the correspondent map: user can create different conceptual spaces maps and she can manipulate the I‐TUTOR Conceptual space components until she finds the conceptual map she enjoys. Once a conceptual map is chosen, each other functionalities will refer to it. In particular, a conceptual map may be manipulated through: 1) new conceptual space definition: it means a new LSA computation. This task is useful when the underlying data are modified (new keywords or documents are uploaded in the platform) and a new conceptual distribution could be required; 2) new SOM definition: chosen the conceptual space (the LSA), user can train a new SOM for re‐computing the clusters of documents. This task modifies only the cluster distribution on the conceptual space, but not the semantic space from LSA; 13 3) new weight definition for keywords: chose the SOM and hence the clusters distribution, user can modify the weight of the keywords in the space with the aim to highlight some words respect to others bringing them at high levels of the map. The map can also be modified when new documents are uploaded in the platform. In this case user can make two different choices: 1) use a specific semantic space and a SOM and project the new documents in this space (the documents are automatically clustered in the space by SOM); this projection will not modify the semantic space; 2) build a new semantic space (and so a new SOM) that will include the new documents. A new space is created considering the effects of these new documents. ITUTOR Activity Space The I‐TUTOR Activity Space is generated when documents related to the students/classes activities are projected in the I‐TUTOR Conceptual space. In particular, the documents we refer are called as activity documents (for distinguishing them from the didactical ones) and are documents retrieved from the Moodle database and related to forum, wikis pages and each other documents that the students or groups of students insert into the platform during the course (as her answers to a questionnaire). The underlying semantic space and the SOM are computed as shown in the previous step, and only new documents are projected in the conceptual space selected by the user. The activity space is graphically represented as the conceptual one, with the obvious difference of the colors of the cells, because in this case there are more documents that are not considered in the conceptual case and more cells are filled trough different levels of gray. Through the I‐TUTOR Activity space is possible to monitor the distribution among the conceptual space of the students (or groups of students) activities, and both tutor and student can take cognizance about their conceptual dislocation during the course. The I‐TUTOR Activity Map The I‐TUTOR Activity Map graphically represents the I‐TUTOR Activity space. As for Conceptual Map, it is a set of clusters with different colors. Using the Maps The I‐TUTOR plugin provides a functionality for observing some documents distribution on both conceptual and activity spaces; it is useful for example for tutor when she wants to monitor a particular student or group of students, watching the dislocation of their activities in the space. In particular, a tutor can: 14 1) view the distribution among the full didactical documents in the conceptual space of a particular section of the course; 2) view the distribution among the full didactical and activity documents in the activity space of the activity documents of a particular student; in this way the tutor can view the student's partecipation in forum or wikis, or her progression in the study of the didactical documents; 3) view the distribution among the full didactical and activity documents in the activity space of the activity documents of a particular group of student;in this way the tutor can view the group's partecipation in forum or wikis, or its progression in the study of the didactical documents. At the other side, a student can view the distribution among the full didactical and activity documents in the activity space of her activity documents; in this way she can evaluate her partecipation in forum or wikisor her progression in the study of the didactical documents, motivating the self‐regulation learning. The marker adopted for hightlighting the cells involved is Google‐Map marker like and looks as follow: The dimension of the marker for a cell depends by the percentage computed considering the number of the involved documents on the total documents contained in the cell itself. In particular: 1) for a student, the involved documents are related to the student himself; they are the forum pages student has partecipated and wiki pages and the didactical documents she has opened at least once; 2) for a group of students, the involved documents are related to the group of students; they are the forum pages the students of the group have partecipated and wiki pages and the didactical documents students of the group have opened at least once; 3) for a section, the involved documents are the documents uploaded by tutor in the specific section. These information are extracted from Moodle database and are retrieved on‐the‐fly each time the user wants know the distribution of involved documents in the semantic space (activity space for the first two cases, conceptual space for the last). The distribution is highlighted marking the cells that contain documents by one marker with specific dimension that depends by the defined percentage. The percentage is also represented in “total activity” field of the label. For example, in the next map some cells are marked by smallest markers; it means that in these cells there are small percentages of involved documents respect to the total number of documents contained in the cell itself 15 TEACHER/ADMINMANUAL In this section we will explain how to use “I‐TUTOR” maps plugin. In order to use this plugin, the logged user needs to click on the I‐TUTOR Maps Plugin block, available inside a course, usually on the top‐left position. 16 The I‐TUTOR plugin block contains four main links, the first one, “I‐TUTOR Maps” once clicked will open a blank page containing the “I‐TUTOR Maps” main page. The I‐TUTOR plugin aims Moodle users to create the conceptual and activity spaces on which she can manage, monitor and retrieve information about her course and its participants. 17 The I‐TUTOR maps main page looks as follow; a menu‐bar allows to access to the main I‐TUTOR plugin functionalities and it has four options: "Conceptual Map", "Activity Map", "UseMaps" and "Snapshots". The "Conceptual Map" widget has a dropdown submenu with the "Generate Conceptual MAP" and "Archive MAPS" options. First functionality allows to create a new semantic space for generating conceptual maps. This task creates the set of clusters of documents according to a content based approach: a weight given to the words in the documents determines the class to which a document is assigned. This weight is initially the number of times given words appears in a document. Then weight can be then modified according your needs and evaluations through the specific plugin functionality. During this task relevant words are distributed in the bi‐dimensional I‐ TUTOR semantic space: it means that neighboring words in the space are words that have the same semantic sense. Conceptual Map functions Conceptual Map option opens a drop‐down menu that allows to manage all funcionalities related to the I‐TUTOR Conceptual maps. In particular, user can generate a conceptual map or retrieved old conceptual maps from the archive. The option Generate Conceputal MAP allows user to perform 4 different actions: 1) Create a new MAP; it creates of a new conceptual space, so both a new semantic space by LSA and a new SOM are computed basing on the state of the hidden and Moodle database at the moment of this creation; 2) Extend MAP: it adds new documents to the existent conceptual space, projecting them in the map and does not recompute the underlying space; 18 3) Customize MAP: it allows user to tailor the map according her evaluations and needs. For viewing a new conceptual map user can combine the main features of the map; she can arrange an existent semantic space, an existent SOM and an existent list of keywords with a weight distribution and view the results; 4) Redraw Map: it allows user to modify the weights of the keywords for managing their levels distribution in the map. Each point is next described. Conceptual Map Generate Conceptual MAP Option New MAP step by step 1. A new LSA and a new SOM will be generated considering the hidden and Moodle database at this moment and a new I‐TUTOR Conceptual Map is created. 2. I‐TUTOR asks confirmation about this operation. 3. During Map generation, I‐TUTOR alerts you to wait the end of all computations (LSA and SOM creations). 4. When I‐TUTOR ends the process, it asks you to give a name to this new conceptual map. 19 5. The new conceptual map is then stored, and a message of successfully creation is shown. 6. Next, I‐TUTOR alerts you that the correspondent activity space will be created and remember you that you can change the conceptual and activity map through the correspondent functionality. 6.1 Once you click OK, I‐TUTOR tells you to wait the end of the process (the activity space creation, i.e. the 20 projection of the activity documents on the conceptual space newly created). 6.2 At the end I‐TUTOR asks you to specify a name for this new activity map… 6.3 ...and stores it in its archive. Extend MAP STEP BY STEP 1. For projecting in the I‐TUTOR Semantic space new documents uploaded in the platform after space creation, you can select Extend Map option. 21 2. I‐TUTOR allows you to select the documents you want add in the existent semantic space; after document selection, I‐TUTOR projects them into the space by SOM, and you can next view the new documents in the map. Customize MAP step by step 1. Once you selected Customize Map in the drop‐ down menu.... 2. ...I‐TUTOR helps you for tailoring your ideal map; you first must choose the semantic space computed by LSA among that you have previously created. 22 3. I‐TUTOR shows you a list of semantic spaces built until that moment (ordered by name, data creation and the correspondent maps created basing on it, that can be conceptual, social or other with projected documents). You can choose one of these spaces by button‐radio, and then you can submit your choice. After your submission, I‐ TUTOR keeps "at mind" the Semantic space you have chosen for next steps. 4. I‐TUTOR reports you the semantic space selection adding the red LSA+ Keywords puzzle pieces in the interface. It means that once you have chosen a semantic space, there are a set of keywords computed by this LSA and next you will refer to them. 23 5. Next you can modify the weight distribution, changing the weight for the keywords you want. 5.1. Clicking on the note icon you can modify the weight for the correspondent word 5.2. A list of possible weight allows you to set a more high or low weight than the current. 24 5. 3. I‐TUTOR reports you the weight modification adding the yellow. Weight puzzle pieces in the interface. 6. Next, you can choose the SOM among those previously created; in this way you can select one way for clustering your documents. The semantic space is fixed, and different clusters distribution can made on it through different SOM. I‐TUTOR shows you the list of all existent SOM for the chosen semantic space. 25 7. Finally all components are defined so you can generate the map according the preference you have selected. Your ideal map is tailored and you can view it in the I‐ TUTOR archive. Redraw Map STEP BY STEP 1. Once you have selected Redraw MAP option from drop‐down menu you can computed different cluster distribution on the same semantic space (LSA). A clear explanation is shown to you in the interface. 2. Once you have selected the semantic space, you can try different SOM 26 distribution, learning a new SOM. 3. A small map preview is shown for viewing the new cluster distribution, and for allowing you the choice the region shape you enjoy. Archive MAPS Option 1. Once you select Archive MAP option… 2…. I‐TUTOR shows you a list of all conceptual maps and you can view one of them by clicking on the 27 correspondent eye. 3. The correspondent I‐ TUTOR conceputal Map is shown and you can browse it using arrows or clicking on it to zoom a zone. There are 3 leveles of zooming. Also, there is a level where the of documents contained in the zoomed cell are listed. Activity Map functions The second functionality in the main page of I‐Itutor plugin is the Activity Map option, that allows you to use the activity map. There are two sub‐options: “Extend MAP” and “Archive MAP”. Considering that the activity MAP is automatically created for each conceptual map, through this function you can use the current activity map (that is the activity map correspondent to the current set conceptual map). 28 Extend MAP Option Use this option to project new activity documents into an existent activity map. 1. I‐TUTOR shows you a list of the activity maps. You can choose the map you want to extend and I‐ TUTOR adds to it the new activity documents. Archive MAPS Option Use this option for viewing an activity map. 1. I‐TUTOR shows you a list of all activity maps. 29 2. Click on the eye icon for viewing a specific activity map… 3. … and I‐TUTOR shows you the correspondent map. You can browse it through the arrows and clicking on the cells for zooming. Like for the conceptual map, the activity map may be zoomed to 3 levels of depth; there is also a forth level that shows the list of documents contained in the zoomed cell. Use MAP functions Once you have selected this option, a drop‐down menu shows you 4 different actions: 1) Domain: for viewing the current conceptual map and activity map. The conceptual map is the map of the course you have selected (or tailored) as map base. The activity map is the I‐TUTOR Conceptual map with activity documents projected; 2) Student: for viewingthe activity documents distribution among the full didactical and activity documents in the activity space of the of a particular student; in this way the tutor can view the student's partecipation in forum or wikis, or her progression in the study of the didactical documents; 3) Group: for viewing the activity documents distribution among the full didactical and activity documents in the activity space of a particular group of student; in this way the tutor can view the group's partecipation in forum or wikis, or its progression in the study of the didactical documents; 30 4) Section: for viewing the distribution among the full didactical documents in the conceptual space of a particular section of the course. Domain Conceptual MAPS option I‐TUTOR shows you the current set conceptual map and you can browse it. Domain Activity MAP option I‐TUTOR shows you the correspondent activity map to the set conceptual map and you can browse it. 31 Student option 1. I‐TUTOR shows you a list of the students of the course and you can view for each of them the conceptual or activity maps, painted according to the Student Name Student Name Student Name Student Name Student Name Student Name Student Name Student Name Student Name Student Name Student Name Student Name Student Name 32 student activity, as explained in the “Coloring the Map” section. In particular, the Conceptual view shows the conceptual map painted according to the percentage of clicked document by student, while the Activity view shows the activity map painted according to the percentage of activity documents of the student, as shown. 2. Click on the folder icon to view the painted Conceptual Map of a student 2.1 I‐TUTOR shows you the conceptual Map of the correspondent student painted according to the percentage of the didactical documents on which student has clicked among the total number of didactical documents contained in the cell. 3. Click on the chat icon to view the painted Activity Map of a student 3.1 I‐TUTOR shows you the Activity Map of the correspondent student painted according to the percentage of documents related to the student among the total number of activity documents contained in the cell. 4. For each kind of map, you can frozen the map itself clicking on the photo icon 33 4.1 I‐TUTOR asks you to specify a name for the photo you want to store and then you can find it among the snapshots in the specific “Snapshot” function next described. Group Option 1. I‐TUTOR shows you a list of the groups of students of the course and you can view for each of them the conceptual or activity maps, painted according to the group activity, as explained in the “Coloring the Map” section. In particular, the Conceptual view shows the conceptual map painted according to the percentage of clicked document by full group, while the Activity view shows the activity map painted according to the percentage of activity documents of the group, as shown. 2. Click on the folder icon to view the painted Conceptual Map of a group 34 2.1 I‐TUTOR shows you the conceptual Map of the correspondent student painted according to the percentage of the didactical documents on which student has clicked among the total number of didactical documents contained in the cell. 3. Click on the chat icon to view the painted Activity Map of a group 3.1 I‐TUTOR shows you the Activity Map of the correspondent group painted according to the percentage of documents related to the group among the total number of activity documents contained in the cell. 4. For each kind of map, you can frozenit clicking on the photo icon 35 4.1 I‐TUTOR asks you to specify a name for the photo you want to store and then you can find it among the snapshots in the specific “Snapshot” function next described. Section Option Use this option for viewing the distribution among the full didactical documents in the conceptual space of a particular section of the course. 1. I‐TUTOR shows you a list of all sections of the course… 2. Click on the eye icon for viewing a particular section 36 3. I‐TUTOR shows you the conceptual map for the selected section, that is painted according to the percentage of didactical documents of the section among all didactical documents contained in the cell. Snapshot function Use this functionality for retrieving your frozen maps. I‐TUTOR helps you in the retrieval because he orders the snapshots for typology. So you can choose to view frozen maps about the domain (conceptual or activity) or about students or about groups. Domain Conceptual MAPS option 1. I‐TUTOR shows you a list of all frozen conceptual maps. Click on the eye icon for retrieving the map. Domain Activity MAPS option 37 1. I‐TUTOR shows you a list of all frozen activity maps. Click on the eye icon for retrieving the map. Student option 1. I‐TUTOR shows you a list of students for which you have frozen maps. 2. Click on the folder icon for retrieving all frozen conceptual maps for a specific student. 38 2.1. I‐TUTOR shows you all frozen conceptual maps for the selected student. Click on the eye icon for retrieving a particular map. 3. Click on the chat icon for retrieving all frozen activity maps for a specific student. 3.1. I‐TUTOR shows you all frozen activity maps for the selected student. Click on the eye icon for retrieving a particular map. Group Option 39 1. I‐TUTOR shows you a list of groups for which you have frozen maps. 2. Click on the folder icon for retrieving all frozen conceptual maps for a specific group. 2.1. I‐TUTOR shows you all frozen conceptual maps for the selected group. Click on the eye icon for retrieving a particular map. 3. Click on the chat icon for retrieving all frozen activity maps for a specific group. 40 3.1. I‐TUTOR shows you all frozen activity maps for the selected group. Click on the eye icon for retrieving a particular map. STUDENT MANUAL In order to use “I‐TUTOR” plugin, the logged student needs to click on the I‐TUTOR Maps Plugin block, available inside a course, usually on the bottom‐left position. 41 The I‐TUTOR plugin aims student to create her conceptual and activity spaces on which she can monitor and retrieve information about her didactical activities. The I‐TUTOR maps main page for student looks as follow; a menu‐bar allows to access to the main I‐TUTOR plugin functionalities and it has two options: "Use Maps" and "Historical Snapshots Maps". 42 Use MAP functions Once you have selected this option, a drop‐down menu shows you 2 different actions: 1) Conceptual Maps: for viewing the conceptual map with the distribution of the didactical documents you have studied; the map is colored according to what explained in the previously section (Coloring the map). The conceptual map is related to the course you have previously selected on the Moodle platform; 2) Activity Maps: for viewing your activities in the course. It is the I‐TUTOR Activity map colored considering the distribution of your activity documents. Conceptual MAPS option I‐TUTOR shows you the current conceptual map and you can browse it. Map is colored according to the percentage of didactical documents you have clicked among all didactical documents uploaded on the Moodle platform by your teacher for the course, so you can view your dislocation in the conceptual space. (see Coloring Maps section) 43 Activity MAPS option I‐TUTOR shows you the current activity map and you can browse it. Map is colored according to the percentage of your activity documents among all activity documents, so you can view your dislocation in the activity space. (see Coloring Maps section) 44 In both section you can frozen the map clicking on the "photo" icon for retrieving it next. Once you have selected the "photo" icon, I‐TUTOR asks you to specify a name for the snapshot map you want save. Historical Snapshots Maps functions This option allows you to retrieve the snapshots of the maps (both conceptual and activity) you have previously frozen; in this way you can see your progression and participation at the course. Once you have selected this option, a drop‐down menu shows you 2 different actions: "Conceptual Maps" and "Activity Maps" options. Conceptual Maps option With this option you can retrieve the conceptual maps you have frozen. I‐TUTOR shows you a list of frozen conceptual maps with the names you have previously entered. Just click on the eye icon for viewing the map; you can also delete it clicking on "cross" icon. 45 Activity Maps option With this option you can retrieve the activity maps you have frozen. I‐TUTOR shows you a list of frozen activity maps with the names you have previously entered. Just click on the eye icon for viewing the map; you can also delete it clicking on "cross" icon. For both options, once you have clicked on "eye" icon, the selected map is shown 46 MONITORING Once you click on the monitoring link in the I‐TUTOR plugin the Monitoring page opens. The monitoring component allows visualization of different indicators of the student’s performance extracted by the clustering engine. The Monitoring page contains a list of activities. For each of them you see a graphic view of the main student clusters. Click on the lens icon for viewing the activity of your interest. Activities are: Assignment Submissions Chat Messages Comments Files 47 Forum Discussions Forum Posts Responder Forum Posts Grade Grades Grade Grades Participation Log Message Message Read Message ReadTo Message To My Pages Post Quiz Grades Tag User Last Access Overall Overall Activities Overall Marks There are a label for each cluster (that are at most 4): “not at all”, “low”, “on average”, and “high”. Both histogram and boxplot visualization are provided for each cluster related to a indicator: boxplots depict the quartiles of the population grouped in each cluster. Each cluster is clickable in the two charts, and provides the complete list of its students belonging. Finally, a particular student name can be selected from a drop‐down list to read her/his indicator value. For example, the activity “Forum Posts” shows the actions of the students, organized in groups, as regards the forum messages. 48 Once you click on a cluster, a list of student is shown. Select a student in the list for viewing his/her indicator value. With this graphical view you can easily understand which student groups spent more time than other ones, on a certain activity. Also a visualization has been implemented in the same interface for viewing the statistical dispersion of Students in Each Cluster. You can access to this visualization scrolling the lateral bar of the windows. 49 Profiling For accessing to profiling functionality you must click on Profiling link in the I‐TUTOR plugin. The profiling component has been implemented in the same way as the monitoring. Once you access to this functionality, a list of student is shown. Select one of them for viewing his/her indicator values. A radar chart depicts the comparative performance of a student w.r.t. a set of indicators. The wider is the area of the chart the better is the student’s performance. The component is able to show whatever set of indicators. 50 51 Timeline view The timeline view of personal logs depends on the clustering agent being installed and running. It is possible to see a ‘sample’ timeline view if the Moodle administrators have installed the database tables and sample data. The sample data provides a rough idea of the sort of information the view will show: The graph shows the individual’s level of activity for a specific metric – by default the graph shows forum posts. This information is shown as the black line, although the actual data points are marked with red circles (the black line is to provide a sense of continuity between the times when the clustering agent runs). The bands of colour represent the different clusters. In this case, each ‘ribbon’ of colour shows 1 standard deviation’s width away from the central line which is the mean value of the metric for that cluster of students. The student in the sample data was about average in the lowest activity cluster for the first couple of measurements, and then started engaging with others on the forums, reaching and briefly exceeding, the average number of forum posts of the most highly active cluster, before tailing off on the last day. 52 Options As a tutor (or other person granted the report/plog:viewcourse capability) you will have the option of choosing which user’s data you wish to see. As a student (or other person granted the report/plog:viewown capability) you only get to choose the time period and which metric to display: These reports can be accessed using the URL : <host/moodle root>/report/plog/index.php This will default to showing the values for the logged‐in user, for the course they accessed the report from. The sample data is available at <host/moodle root>/report/plog/index.php?test=1 If a tutor wishes to link to specific charts, the URL can be copy and pasted from the browser’s address bar, or built up using the values of the parameters. This information can also be used for building moodle ‘blocks’ to link to specific charts. For example, <host/moodle root>/report/plog/index.php? student=49&startdate=1379376000&metric=forum_posts Will give the chart for the student with id = 49, starting on 17 September 2013 (these dates are easiest to create using the forms!), and will show the forum_posts metric. Installation The report plugin can be installed by copying the ‘plog’ folder in to the Moodle ‘report’ folder, and visiting <host/moodle root>/admin/index.php and following normal procedures. However, currently on version 2.4.1 of Moodle, the capability settings are not correctly loading, and a manual intervention has to be performed to create the settings in the database (this is not the case in version 2.5+). A SQL script (export from mysql) is included in the plog.tar file. 53 If you wish to make the test data available, there are 3 SQL scripts which create the sample data records. NOTE however, that cluster_runs.sql uses hard‐coded id values (the others refer to these) – so DO NOT install these scripts if you already have cluster_runs with id values between 105 and 112 inclusive, without editing these values in all three cluster test data scripts (cluster_runs.sql, cluster_stats.sql, cluster_user_clusters.sql). The nature of the timeline graph is such that it requires historical data to provide a meaningful output. It is recommended that it is only used after the clustering agent has run 3 or more times to provide that historical context. Alerter Enable the I‐TUTOR Profiler block in the course in which you wish to use alerting. Click on the configuration icon: The configuration page will be shown – note, this is only seen by the teacher/admin, the alerter does not have a user interface for students, so you can hide this block once you have configured the alerts you wish to use. 54 Here you may choose when you want the alert to be generated, which type of alert you wish to create, and which metric to base the alert on. For instance, you can select to have an alert if the student is in the Zero cluster, (no activity), or in the bottom 10%. You can choose whether to alert on Quiz scores, any activity, posts, etc. You can also configure what the message should say, and whether to send it to yourself, or to the student to whom the alert relates. For example: 55 Once you have set up the basic settings for the alert, the bottom half of the page gives some more advanced settings, and the opportunity to save the alert so that it will monitor student activity: 56 In general, it is OK to leave these settings as they are, and click Save changes. When you next click on the configuration icon, you will see a list of alerts at the top of the page: You can check the summary of the details, and if you uncheck the checkbox, the alert will be deleted when you click on the ‘save changes’ button. If you set up multiple alerts, please be aware that students who trigger each criteria will be sent an email for each one – so if you have alerts for both Zero and lowest 10% for each of the criteria, and a student never logs in, they will receive 2 emails for each criteria to alert them that they have not been taking advantage of the system. It is probably better to configure a small number of alerts, to avoid bombarding students! Installation Requirements: Java The alerter installs the clustering agent. Install by extracting the Alerter folder in to the Blocks folder of your Moodle installation. 57 Furthermore the system administrator need to run these database scripts: CREATE TABLE `cluster_runs` ( `id` bigint(20) NOT NULL AUTO_INCREMENT, `date` timestamp NOT NULL DEFAULT CURRENT_TIMESTAMP, `courseid` bigint(20) DEFAULT NULL, `clusteringname` varchar(100) COLLATE utf8_unicode_ci DEFAULT NULL, `maxCluster` int(11) DEFAULT NULL, PRIMARY KEY (`id`) ) ENGINE=<your engine> AUTO_INCREMENT=1 DEFAULT CHARSET=utf8 COLLATE=utf8_unicode_ci CREATE TABLE `cluster_stats` ( `id` bigint(20) NOT NULL AUTO_INCREMENT, `clusterid` bigint(20) DEFAULT NULL, `cluster` int(11) DEFAULT NULL, `mean` decimal(20,4) DEFAULT NULL, `stddev` decimal(20,4) DEFAULT NULL, PRIMARY KEY (`id`) ) ENGINE=<your engine> AUTO_INCREMENT=1 DEFAULT CHARSET=utf8 COLLATE=utf8_unicode_ci CREATE TABLE `cluster_user_clusters` ( `id` bigint(20) NOT NULL AUTO_INCREMENT, `clusterid` bigint(20) DEFAULT NULL, `userid` bigint(20) DEFAULT NULL, `cluster` int(11) DEFAULT NULL, `value` decimal(20,4) DEFAULT NULL, 58 PRIMARY KEY (`id`) ) ENGINE=<your engine> AUTO_INCREMENT=1 DEFAULT CHARSET=utf8 COLLATE=utf8_unicode_ci 59 Intelligent Tutoring for Life Long Learning That is all... Enjoy the I-TUTOR plugin! With the support of the Lifelong Learning Programme of the European Union. www.intelligent-tutor.eu