1
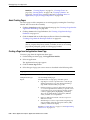
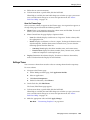
Creating Charts
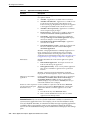
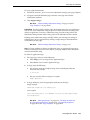
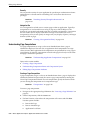
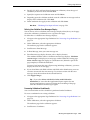
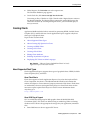
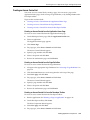
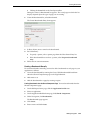
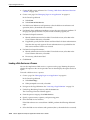
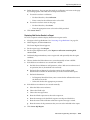
b.
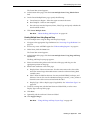
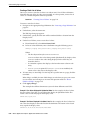
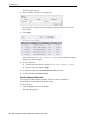
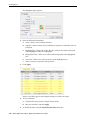
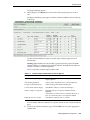
Specify the remaining attributes. To learn more, click the item label.
c.
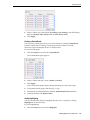
Click Next.
10. Click Finish.
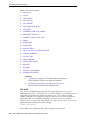
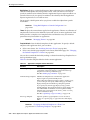
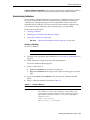
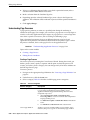
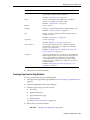
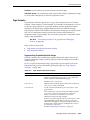
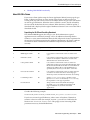
About SVG Chart Types
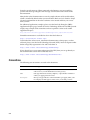
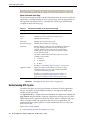
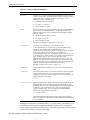
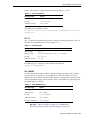
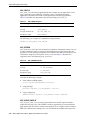
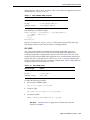
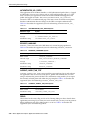
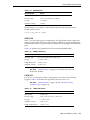
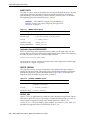
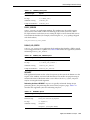
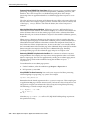
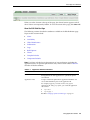
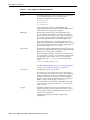
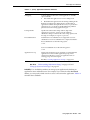
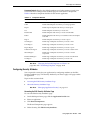
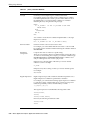
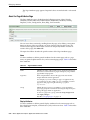
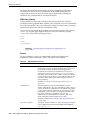
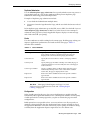
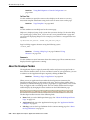
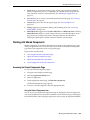
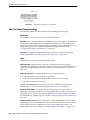
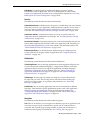
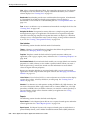
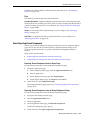
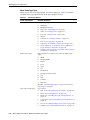
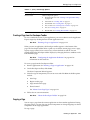
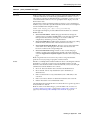
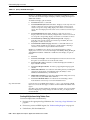
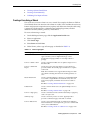
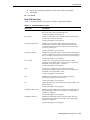
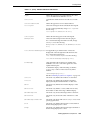
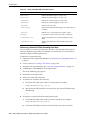
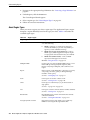
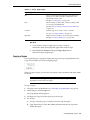
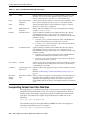
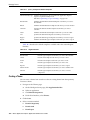
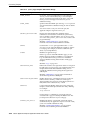
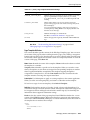
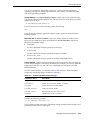
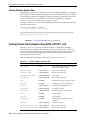
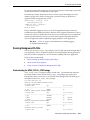
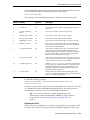
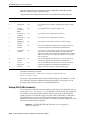
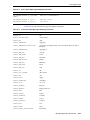
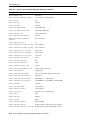
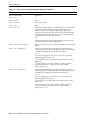
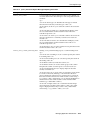
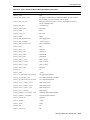
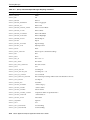
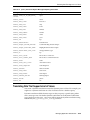
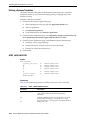
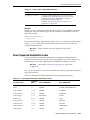
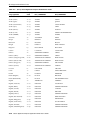
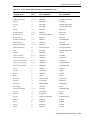
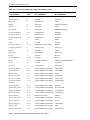
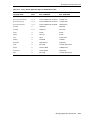
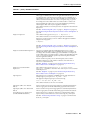
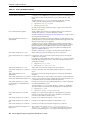
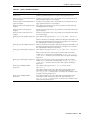
Table 7–7 describes the SVG chart types available in Application Builder.
Table 7–7
Available SVG Chart Types
Chart Type
Description
Bar, Horizontal
Single series-based bar chart oriented horizontally with each
data point in the series represented by a bar.
SVG-based. Requires an SVG plug-in.
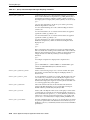
Bar, Vertical
Single series-based bar chart oriented vertically with each data
point in series represented by a bar.
SVG-based. Requires an SVG plug-in.
Cluster Bar, Horizontal
Multiple series-based bar chart oriented horizontally and
clustered by a common variable with each data point in the
series represented by a bar (for example, Department sales total
clustered by month of year).
SVG-based. Requires an SVG plug-in.
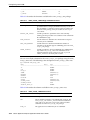
Cluster Bar, Vertical
Multiple series-based bar chart oriented vertically clustered by a
common variable with each data point in series represented by a
bar (for example, Department sales total clustered by month of year).
SVG-based. Requires an SVG plug-in.
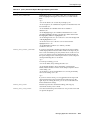
Dial - Sweep
Also known as an angular gauge; this chart shows either
percentage of maximum value or absolute value compared to a
maximum value represented as a solid area.
SVG-based. Requires an SVG plug-in.
Dial
Also known as angular gauge; this chart shows either
percentage of maximum value or absolute value compared to
maximum value represented as a line.
SVG-based. Requires an SVG plug-in.
Line
Multiple series-based line chart oriented with each line
representing all data points in the series.
SVG-based. Requires an SVG plug-in.
Pie
Single series-based pie chart with each slice representing a data
point in the series.
SVG-based. Requires an SVG plug-in.
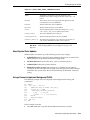
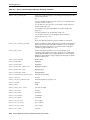
Stacked Bar, Horizontal
Multiple series-based bar chart oriented horizontally with each
data point being an absolute value in the series representing a
segment of a single bar.
SVG-based. Requires an SVG plug-in.
Stacked Bar, Vertical
Multiple series-based bar chart oriented vertically with each
data point being an absolute value in the series representing a
segment of a single bar.
SVG-based. Requires an SVG plug-in.
Adding Application Components 7-67