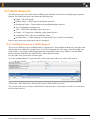
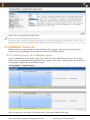
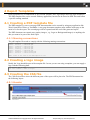
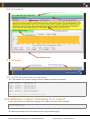
1
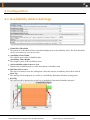
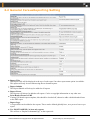
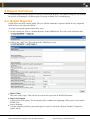
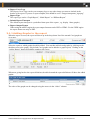
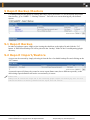
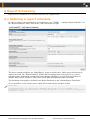
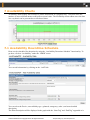
User Guide
CereusReporting - Corporate Edition
Version 1.0
Unicode Support
DSStats Support
Reporting Engine Enhancements
Support Options
Guides for CactiEZ, Ubuntu 9.10
Urban-Software.de
CereusReporting - User Guide
Urban-Software.de © Copyright 2010. All Rights Reserved
1
1 Introduction
1.1 About CereusReporting
CereusReporting is a plugin designed to enhance the reporting functionality of the Cacti Network
Monitoring solution. nmidCreatePDF adds PDF report generation as well as email and report scheduling
functionality of Cacti.
CereusReporting comes in 3 different editions: The Free Edition with limited functionality, a Professional
Edition with added features and the Corporate Edition with support for DSStats, Scheduling and other
features.
1.2 License
By downloading or using a Urban-Software.de software product you are certifying that you are not a
national of Cuba, Iran, Iraq, Libya, North Korea, Sudan, Syria, or any country to which the United States
embargoes goods and that you are not a person on the Table of Denial Orders, the Entity List, or the List
of Specially Designated Nationals.
DISCLAIMER OF WARRANTIES: YOU AGREE THAT URBAN-SOFTWARE.DE HAS MADE NO
EXPRESS WARRANTIES TO YOU REGARDING THE SOFTWARE AND THAT THE SOFTWARE
IS BEING PROVIDED TO YOU "AS IS" WITHOUT WARRANTY OF ANY KIND. URBANSOFTWARE.DE DISCLAIMS ALL WARRANTIES WITH REGARD TO THE SOFTWARE,
EXPRESS OR IMPLIED, INCLUDING, WITHOUT LIMITATION, ANY IMPLIED WARRANTIES
OF FITNESS FOR A PARTICULAR PURPOSE, MERCHANTABILITY, MERCHANTABLE
QUALITY, OR NONINFRINGEMENT OF THIRD-PARTY RIGHTS. Some states or jurisdictions do
not allow the exclusion of implied warranties, so the above limitations may not apply to you.
LIMIT OF LIABILITY: IN NO EVENT WILL URBAN-SOFTWARE.DE BE LIABLE TO YOU FOR
ANY LOSS OF USE, INTERRUPTION OF BUSINESS, OR ANY DIRECT, INDIRECT, SPECIAL,
INCIDENTAL, OR CONSEQUENTIAL DAMAGES OF ANY KIND (INCLUDING LOST PROFITS)
REGARDLESS OF THE FORM OF ACTION WHETHER IN CONTRACT, TORT (INCLUDING
NEGLIGENCE), STRICT PRODUCT LIABILITY OR OTHERWISE, EVEN IF URBANSOFTWARE.DE HAS BEEN ADVISED OF THE POSSIBILITY OF SUCH DAMAGES. Some states or
jurisdictions do not allow the exclusion or limitation of incidental or consequential damages, so the above
limitation or exclusion may not apply to you.
CereusReporting - User Guide
Urban-Software.de © Copyright 2010. All Rights Reserved
2 /16
Template Design by SmileTemplates.com
2 Configuration
2.1 Availability Addon Settings
Global SLA Threshold
The global SLA threshold defines a threshold displayed on each availability chart. The SLA threshold
can be overwritten on a per-device basis
Availibility Chart Width
The width in pixel of the availability chart
Availability Chart Height
The height in pixel of the availability chart
Add availability table to the tree view
Displays the availability data as a table beneath the availability chart
Max Raw data to store
The time in seconds to store the polling data. After this time the availability data will be deleted.
Start Tag
The start tag will be displayed as a suffix to a Availaiblity Downtime Schedule starting point
End Tag
The end tag will be displayed as a suffix to a Availaiblity Downtime Schedule end point
CereusReporting - User Guide
Urban-Software.de © Copyright 2010. All Rights Reserved
3 /16
Template Design by SmileTemplates.com
2.2 General CereusReporting Setting
Report Title
The Report Title will be displayed at the top of each report if no other report name option is available.
This option will only be used when using the on-demand reports.
Report Subtitle
The Report Subtitle will always be added to all reports
Report Footer
The Reports will always be added to all reports. Can be a copyright information or any other text.
Print Header/Footer to PDF
If using CSS based report templates, this should be checked off, otherwise adds a default header/footer
to the PDF report
Report Logo
A Logo which can be added to the reports. These can be defined globally here, on a per-tree base or per
report
Use ‘HOSTNAME(IP)’ in host only reports
This will use a “Report for hostname(ip)” as the report title
CereusReporting - User Guide
Urban-Software.de © Copyright 2010. All Rights Reserved
4 /16
Template Design by SmileTemplates.com
Graphs link back to cacti
Users can click on the graphs in the PDF report to directly go to the specific graph within Cacti.
Cacti Host/Server URL
The host/Server url to be used within the PDF report. Should be in the format “http://server”.
WebService URL
When using the nmidWebService plugin, provide the URL to it here.
PHP binary path
The full path to the PHP binary ( e.g. /usr/bin/php )
Archive Directory
The directory where archived reports are to be stored. Needs to be writeable by the webserver and
Cacti user.
GZip binary path
The full path to the gzip binary ( e.g. /bin/gzip ). If not set, archived reports will not be gziped.
Scheduler being used
There are two scheduler available. For smaller reports, the poller based scheduler can be used. For
large reports it is recommended to use the cron based scheduler.
Parallel Threads for Graph Retrieval
Graph retrieval is threaded. You can choose the number of concurrent threads being used.
Debugging mode
When enabling the debugging mode, graphs and other temporary files will not be delted from the tmp
directory for troubleshooting purposes.
PDF Module to use
cereusReporting offers different PDF modules for creating the PDF reports. The bundled FPDF engine
creates PDF reports using standard based fast methods, but lacks some additional functionality like
Unicode support. The mPDF engine offers more functionality with a slight performance decrease.
Font Name
The default font to use for the Reports. Will be changed automatically when using unicode based
reports
Header Font Size
The font size of the header
Page Size
The default page size. These can also be set on a per report setting.
Page Orientation
The default page orientation. These can also be set on a per report setting.
Graph Format
The default graph report format. Can be single column (default) or a 2 Graphs, 2 Columns based type.
CereusReporting - User Guide
Urban-Software.de © Copyright 2010. All Rights Reserved
5 /16
Template Design by SmileTemplates.com
3 Report Definition
CereusReporting offers the ability to create pre-defined PDF Reports. This chapter will guide you through
the process of creating the 3 different types of reports available for CereusReporting.
3.1 Graph Reports
Graph reports can only contain graphs. They are offered within the Corporate edition for easy migration
from the free to the corporate edition.
To create a new graph reports follow these steps:
1. On the console tab, click on “Manage Reports” in the NMID menu. You will see the following table:
2. Click on the “Add” link. This will open the “Add Report” page:
Report Name
The name of the report. This will also be used as the report title in the PDF document
Report Description
A description of the report. The description will be added to the beginning of the report. It can contain
HTML code.
Report Template
A report template provides a general design for a report. Look at the “Report Template” chapter for
further details
CereusReporting - User Guide
Urban-Software.de © Copyright 2010. All Rights Reserved
6 /16
Template Design by SmileTemplates.com
Report Cover Logo
The Report Cover Logo can be your company logo or any other image you want to include in the
header of the report. If you use a report template, this should be set to “images/transparent_logo.png”
Report Type
The report type can be “Graph Report”, “Multi Report” or “DSStats Report”
Default Report Timespan
The default report timespan is a predefined time span of the report ( e.g. display 1 hour graphs ).
Report Output Format
When using the mPDF engine the report output formant can be PDF or HTML. For the FPDF engine
the report format can only be PDF.
3.1.1 Adding Graphs to the report
When the report is saved, the report will show up in the drop-down list of the normal Cacti graph tree
view page:
Select the report to which graphs should be added. You can then add selected graphs by clicking on the
checkbox next to the graph ( only default Cacti graphs can be added to a graph report). Clicking on the
“Add to Report” button will add the graphs to the report.
When now going back to the report definition, the table beneath the report definition will show the added
graphs:
The order of the graphs can be changed using the arrows in the “Order” column.
CereusReporting - User Guide
Urban-Software.de © Copyright 2010. All Rights Reserved
7 /16
Template Design by SmileTemplates.com
3.2 Multi Reports
The multi report type is the most advanced PDF report available only on the CereusReporting Corporate
Edition. The multi report type can contain the following data:
Graph - The cacti graphs
DSStats Chart - Charts based on the dsstats extension
Smokeping Charts - Charts based on the nmidSmokeping extension
Text - Paragraphs containing text
Title - A Sub-Title explaining what comes next
Chapter - A Chapter title, including a page break before it
Availability Chart - The new Availability Chart
SQLStatement - A Table made up of a custom SQL query of the Cacti database
Each of these items on a multi report can be rearranged.
3.2.1 Adding items to a Multi Report
There are two different ways of adding items to a graph report. The simpliest method is by using the same
functionality as available for a graph report. Go to the Cacti graph tree view page, select the graphs you
want to add ( Cacti graphs, Smokeping graphs and Availaiblity Charts can be added), select the Multi
Report from the drop-down box and click the “Add to Report” button.
For any other item, you need to edit the report.
Go to the “Manage Reports” page and click on the multi report where you want to add an item.
Click on the “Add” link of the “Items for this report” table to add a new item.
You can select the item you want to add from the drop-down box. A description of each item is shown to
the left of the text box.
CereusReporting - User Guide
Urban-Software.de © Copyright 2010. All Rights Reserved
8 /16
Template Design by SmileTemplates.com
Click “Save” to add the item to the report.
!
Please note for the mPDF Reporting Engine:
You need to add at least one Chapter item before you can add the Title item. If you fail to do so, the
resulting PDF file will crash Adobe Reader when clicking on the Bookmarks
3.3 DSStats Reports
DSStats reports can only contain the special DSStats type of graphs. These graphs are generated by
separate php files displaying some statistics provided by the DSStats plugin.
3.3.1 Adding items to a DSStats report
To add a DSStats item to the report, click on the “Add” link of the table below the report. A new page
will be shown with thumbnails of the DSStats report graph. Click on the “Add to Report” link to the left
of the graph to add the item to the DSStats report.
Once you are done, click on the “Go back to report” link at the bottom of the page.
CereusReporting - User Guide
Urban-Software.de © Copyright 2010. All Rights Reserved
9 /16
Template Design by SmileTemplates.com
4 Report Templates
Report templates are a combination of special PDF template files, logo images and CSS style definitions.
The PDF template files can be created with any application, but need to be stored as PDF files and follow
a specific naming standard.
4.1 Creating a PDF template file
The PDF template is a one or two page PDF document that can be created by using any application like
Word, OpenOffice Writer or TextMaker. A two page document template starts with the main page as the
main cover for the report. The second page will be repeated until the end of the generated report.
The PDF document can contain text, graphs, images ( e.g. Logos or Background images) or anything else
that you want to be part of the final report.
4.1.1 Naming conventions
The pdf template file needs to comply with the following naming conventions:
DIN A4
DIN A4
DIN A3
DIN A3
DIN A2
DIN A2
Letter
Letter
-
Landscape
Portrait
Landscape
Portrait
Landscape
Portrait
Landscape
Portrait
:
:
:
:
:
:
:
:
name-L-A4.pdf
name-P-A4.pdf
name-L-A3.pdf
name-P-A3.pdf
name-L-A2.pdf
name-P-A2.pdf
name-L-Letter.pdf
name-P-Letter.pdf
where “name” is the name of the PDF template to use.
4.2 Creating a logo image
Ideally the Logo should be part of the template file. In case you are not using a template, you can supply a
logo with the following data:
File Format: PNG or JPEG
File Size: 800x200 ( width x height )
4.3 Creating the CSS file
The CSS file describes where the different parts of the report will be placed at. The PDF document has
the following layout
4.3.1 Header
CereusReporting - User Guide
Urban-Software.de © Copyright 2010. All Rights Reserved
10 /16
Template Design by SmileTemplates.com
4.3.2 Content
4.3.3 Footer
4.3.4 CSS File naming convention
The CSS template file needs to comply with the following naming conventions:
Generic template
DIN A4 - Portrait
DIN A3 - Landscape
DIN A3 - Portrait
DIN A2 - Landscape
DIN A2 - Portrait
Letter - Landscape
Letter - Portrait
:
:
:
:
:
:
:
:
name.pdf.css
name-P-A4.pdf.css
name-L-A3.pdf.css
name-P-A3.pdf.css
name-L-A2.pdf.css
name-P-A2.pdf.css
name-L-Letter.pdf.css
name-P-Letter.pdf.css
where “name” is the name of the PDF template to use.
4.4 Adding a report template to a report
Let us assume you created the following files for a DIN A4, Portrait report template:
nmidCreatePDF.pdf.css
nmidCreatePDF-P-A4.pdf
The following settings need to be entered to the report definition page:
CereusReporting - User Guide
Urban-Software.de © Copyright 2010. All Rights Reserved
11 /16
Template Design by SmileTemplates.com
Although the file “templates/nmidCreatePDF.pdf” does not exist, it is used as the basis to automatically
choose the correct pdf and css template file based on the “Report Page Size” and “Report Page
Orientation” definition.
CereusReporting - User Guide
Urban-Software.de © Copyright 2010. All Rights Reserved
12 /16
Template Design by SmileTemplates.com
5 Report Backup/Restore
CereusReporting has the ability to backup and restore report definitions. To use the backup and restore
functionality, go to “NMID” -> “Backup / Restore”. You will see a screen showing all your defined
reports:
5.1 Report Backup
In order to backup a report, simply select it using the checkbox to the right of it and click the “Go”
button. A XML based backup file will be placed in the “backup” folder of the CereusReporting plugin
directory.
5.2 Report Import/Restore
A report can be restored by simply selecting it from the list of available backup files and clicking on the
“Go” button:
A restored report will always be created as a new report (Same name, but a different report id), so the
old/existing report definition will not be overwritten by a restore.
!
Please note:
Backup files do contain the unique ids of the containing graphs. Graphs not existing any more are still
restored and need to be manually removed from the report after the restore.
CereusReporting - User Guide
Urban-Software.de © Copyright 2010. All Rights Reserved
13 /16
Template Design by SmileTemplates.com
6 Report Scheduling
Reports can be scheduled for a one-time creation or on a regular basis.
6.1 Defining a report schedule
In order to define a report schedule for a selected host, go to “NMID” -> “Manage Report Schedule”. On
the “Report Schedules” table, click on the “Add” link to the top-right.
The above example schedules our “Multi Report” report on a daily basis. Daily reports will always be
send out at 00:00. The “Report Schedule” defines the first starting time of the report. E.g. a report
schedule can be defined near a moths end, but the Report Schedule is set to the first day of the next
months. Daily reports will the be send out no sooner than the beginning of the next month.
The timeframe of the graphs is defined in the Report Definition as the “Default Report Timeframe”.
So it is possible to create a daily report, which will contain only the last hour of data.
!
Please note:
For scheduled reports, the “Default Report Timeframe” should never be set to “On Demand”. It is
recommended to use the same time frame as the “Recurring frequence”. E.g. for “daily” set the timefram of
the report to “1 Day”.
CereusReporting - User Guide
Urban-Software.de © Copyright 2010. All Rights Reserved
14 /16
Template Design by SmileTemplates.com
7 Availability Charts
Availability charts display the hosts/device status information in a graphical way. Cacti does store the
number of successful and unsuccessful polls as a total value. The availability charts addon stores the data
in a way that it can be presented as a time-based chart.
7.1 Availability Downtime Schedule
Hosts can be scheduled for downtime by using the “Availability Downtime Schedule” functionality. To
go there, click on “Availability” under the “NMID” menu.
You can add a downtime by clicking on the “Add” link.
You can select the Device, an availabilty type ( planned, emergency, other ) and some detailed
description.
The Short Description will be displayed in the graph with the “Start Tag” and “End Tag” appended to it.
CereusReporting - User Guide
Urban-Software.de © Copyright 2010. All Rights Reserved
15 /16
Template Design by SmileTemplates.com
CereusReporting - User Guide
Urban-Software.de © Copyright 2010. All Rights Reserved
16 /16
Template Design by SmileTemplates.com


![[ENG] CE60-3 GSM Software ComCE v4-2](http://vs1.manualzilla.com/store/data/005829621_1-1503a18c5b086c34f94e34b38a52b968-150x150.png)