1
RS-01R User Manual
_________________________________________________________________________________________________________________
shown in the following figures. After adjustment, the value at the display of the RS-01R
corresponds to the series resistance in X.XX kΩ.
Notice: Because of the measuring method and the background noise you always will see
values of at least 10 to 20 Ω, even if no series resistance is present (e.g. when using a cell
model).
The BNC connector RS (#13, Figure 1) OUT provides a DC voltage proportional to the value
of series resistance (scaling: 1V / kΩ). As mentioned above, the measurement can be started
using a TTL signal fed into the BNC connector RS IN (TTL) (#12, Figure 1) at the front panel
of the RS box (HI starts the measurement).
In principle, after the measurement (when the signal at TTL is low again or the switch is in
the OFF position) the stored RS value is displayed continuously until the next measurement is
started.
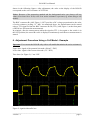
6. Adjustment Procedure Using a Cell Model - Example
Important: You can test the RS-01R only with a cell model that mimics the series resistance!!
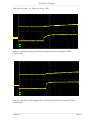
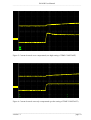
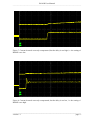
Upper lane: signal of the potential electrode (200 mV / DIV)
Lower lane: signal of the current electrode (2 V / DIV)
Time base (for Figure 2): 5 ms / DIV
1
2
)
)
Figure 2: signals without RS box
___________________________________________________________________________
version 1.1
page 8