1
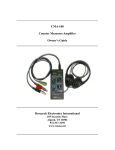
Version 4
27 Feb 08
MDC-900
MDC-2100
OWNER’S GUIDE
RESEARCH ELECTRONICS INTERNATIONAL
455 Security Drive
Algood, TN 38506 U.S.A.
+1 931-537-6032
http://www.reiusa.net/
REI
MDC-2100/MDC-900
1
Version 4
27 Feb 08
TABLE of CONTENTS
TABLE OF CONTENTS .................................................................................................... 2
TABLE OF FIGURES ........................................................................................................ 2
INTRODUCTION ............................................................................................................... 3
INSTALLING THE MDC-2100/MDC-900 .......................................................................... 5
OPERATIONAL CONTROL OF THE MDC ...................................................................... 6
OSCOR VERSION 4.0 ...................................................................................................... 6
OSCOR VERSION 5.0 ...................................................................................................... 6
OSCOR SWEEP AND ANALYZE MODES WITH THE MDC ..................................................... 8
STORING A SWEEP SPAN WITH THE MDC ........................................................................ 10
STORING A SIGNAL IN THE MDC FREQUENCY RANGE ...................................................... 10
MICROWAVE TRANSMISSION CONSIDERATIONS FOR THE MDC-2100/MDC-900 12
USING THE MTU-2100 MICROWAVE TEST UNIT........................................................ 14
MDC-2100/MDC-900 SPECIFICATIONS........................................................................ 15
TECHNICAL BULLETIN, 24 APR 02 .............................................................................. 16
TABLE of FIGURES
FIGURE 1 MDC-2100 MICROWAVE DOWNCONVERTER ............................................... 3
FIGURE 2 ILLUSTRATION OF THE MDC-2100 DOWNCONVERSION PROCESS .......... 4
FIGURE 3 OPERATIONAL FREQUENCY BANDS ............................................................. 4
FIGURE 4 INSTALLATION OF THE OEP ........................................................................... 5
FIGURE 5 MDCA-ALL (OSCOR 5.0) .................................................................................. 7
FIGURE 6A ANALYZING AN MDC SIGNAL (OSCOR 4.0) ................................................ 8
FIGURE 6B ANALYZING AN MDC SIGNAL (OSCOR 5.0) ................................................ 8
FIGURE 7 USING "IDENTIFY" TO VERIFY A SIGNAL (OSCOR 5.0) ................................. 8
FIGURE 8 SELECTING A SIGNAL WITH THE MDC .......................................................... 9
FIGURE 9 SELECTING THE PROPER MDC BAND AND FILTER (OSCOR 4.0) ............ 10
FIGURE 10 EXAMPLES OF STORING SPANS ................................................................ 11
FIGURE 11 ANALYZE MODE USING THE MDC (OSCOR 4.0) ....................................... 11
FIGURE 12 PROPER MTU ORIENTATION FOR BAND 1 (3-9GHZ) ............................... 14
FIGURE 13 PROPER MTU ORIENTATION FOR BAND 2&3 (9-21GHZ) ........................ 14
REI
MDC-2100/MDC-900
2
Version 4
27 Feb 08
INTRODUCTION
The OSCOR Microwave Downconverter option (MDC-2100) expands the OSCOR ’s
frequency range limit to 21GHz. The MDC-900 extends the OSCOR ’s range to 9GHz.
Note: General descriptions of the MDC-2100 in this guide may not always include
exceptions for the MDC-900, which does not cover the 9 to 21GHz spans.
Microwave signals tend to be directional; therefore, the MDC-2100 features an array of
high gain directional antennas. The MDC is compatible with the OPC interface and the
OTL locator options. It can function in the sweep, analyze and correlation modes and
includes a tripod, which provides the stability needed to securely point the antennas and a
swivel neck for easy positioning.
Figure 1: MDC-2100 MICROWAVE DOWNCONVERTER
The span of frequencies from 3 to 21GHz is so broad the OSCOR cannot display them all
in a single window; therefore, a special folding process is implemented. This process
folds the entire spectrum from 3 to 21GHz into twelve 1.5GHz windows. Six windows may
be viewed simultaneously when using OSCOR 5.0 software. Figure 2 illustrates the
down-conversion process.
REI
MDC-2100/MDC-900
3
Version 4
27 Feb 08
MDC-900 only
3
6
4.5
9
7.5
12
10.5
15
13.5
18
16.5
21
19.5
0 1.5
Antennas
3-9*
9-15
15-21
All Numbers
in GHz.
*The MDC-900 only covers the band 1 frequency range.
Figure 2: ILLUSTRATION OF THE MDC-2100 DOWNCONVERSION PROCESS
The OSCOR (version 5.0) displays up to six 1.5GHz (1500MHz) windows simultaneously,
or the spectrum may be separated into three antenna frequency bands: 3 to 9GHz, 9 to
15GHz, or 15 to 21GHz with two 1.5GHz windows displayed simultaneously.
Note: The MDC-900 has a single antenna and covers the band from 3 to 9GHz.
Built-in microwave filters can reduce the display even further. These filters are referred to
as Filter A and Filter B. The Identify function allows for the determination of the
frequency. Below is a chart representing the display of the frequencies in response to the
selected antenna and microwave filter. Understanding Figure 3 is critical to
understanding the OSCOR operations using the MDC-2100 and MDC-900.
Note: The OSCOR always super-imposes the various 1.5GHz windows.
ANTENNA BAND
Filter A
Filter B
Filter A & B
(Not applicable for OSCOR 5.0)
3 – 9GHz
9 – 15GHz
(MDC-2100 only)
15 – 21GHz
(MDC-2100 only)
4.5 -- 6
6 -- 7.5
10.5 -- 12
12 -- 13.5
16.5 -- 18
18 -- 19.5
3 -- 4.5
7.5 -- 9
9 -- 10.5
13.5 -- 15
15 -- 16.5
19.5 -- 21
4.5 -- 6
6 -- 7.5
10.5 -- 12
12 -- 13.5
16.5 -- 18
18 -- 19.5
3 -- 4.5
7.5 -- 9
9 -- 10.5
13.5 -- 15
15 -- 16.5
19.5 -- 21
Figure 3: OPERATIONAL FREQUENCY BANDS
REI
MDC-2100/MDC-900
4
Version 4
27 Feb 08
Installing the MDC-2100/MDC-900
In order to use the MDC with the OSCOR, a special connector (the OEP-2100) must be
installed in the connector tray of the OSCOR. This connector should be installed
permanently into the connector tray and provides for easy connection of the MDC while
not affecting the OSCOR normal operation. Note the step numbers on Figure 4 below to
assist in the installation.
To install the OEP-2100:
1. Turn the OSCOR off and wait at least 30 seconds before proceeding.
2. Remove the OEP from the packaging and insert the mini-din connector (OSCOR
EXP.) into the EXPANSION PORT of the OSCOR as shown in Figure 4. (You may
have to unplug the two tape recorder cables labeled REMOTE OUT RECORDER).
3. Insert the metal support bar into the connector tray. Align the depression at the center
of the bar with the screw head at the top of the OEP. (The cables that provide
connection to the tape recorder controls must be placed under the metal support.)
4. Use the hex wrench to tighten the two hex screws. (This holds the OEP in place.)
5. Unplug the HF/UHF BNC connector from the OSCOR and plug it into the OEP at the
ANTENNA PANEL RF jack.
6. Connect the OEP BNC cable (HF/UHF INPUT) to the OSCOR HF/UHF INPUT.
To install the MDC-2100 or MDC-900:
1. Plug the MDC BNC connector into OEP BNC jack (MDC RF).
2. Plug MDC mini-din connector into the MDC POWER/CTRL jack.
3. Utilize the OSCOR keypad to control the MDC.
4
3
3
5
6
2
Figure 4: INSTALLATION OF THE OEP
The MDC can be used in a stationary position sitting on the provided tripod or it can be
moved around the environment to provide a thorough sweep of the area. For best
operation, the MDC should be located at least three feet away from the OSCOR. Position
the metal housing towards the OSCOR.
REI
MDC-2100/MDC-900
5
Version 4
27 Feb 08
Operational Control of the MDC-2100/MDC-900
OSCOR Version 4.0
Operational control of the MDC-2100 is provided by the OSCOR keypad using the normal
OSCOR functional control. For example, in the OSCOR SWEEP or ANALYZE modes,
pressing the F1 button will toggle through all of the OSCOR inputs including the MDC2100 frequency bands. Furthermore, in the SWEEP mode, pressing the RECALL button
will display the OSCOR available inputs including the MDC inputs. Some of the other
normal OSCOR functions that are impacted by the MDC-2100 are described below.
•
•
•
•
•
•
•
•
•
•
•
Press, F1 “INPUT” and repeat until “3-9GHz” is displayed in the lower left.
Press, “SHIFT” (DATA FUNCTIONS area) and then “EXPAND” (CONTROL area).
Press, F1 “Show All” once to select “Show All”. Use the Control wheel to move the
arrow to any signal you wish to analyze.
Press, “Narrow” (CONTROL area) 2 or 3 times.
Press, “Sweep/Analyze” (CONTROL area) to select “Analyze”.
Reposition the arrow over the signal and press, “Narrow” to center the signal.
Press, F4 “MDC Anlz”. See Figure 6A.
Press, F2 “3-9GHz” as often as needed to select the band with your signal.
Press, F3 ”Fltr A & B” to select Filter A or Filter B. Select the Filter with your signal.
Press, F4 “Identify” once to identify the frequency. Observe which way your signal
moved. The possible frequencies are displayed at top left. Press, F4 again to return.
Press, MENU “EXIT” to return to the normal menu.
OSCOR Version 5.0
Operational control of the MDC is provided by the OSCOR keypad using the normal
OSCOR functional controls. For example, in the OSCOR SWEEP or ANALYZE modes,
pressing the F1 button will toggle through all of the OSCOR inputs including the MDC
frequency bands. Furthermore, in the SWEEP mode, pressing the RECALL button will
display the OSCOR available inputs including the MDC inputs. Some of the other normal
OSCOR functions that are impacted by the MDC are described below.
Signal identification Process:
Viewing the entire spectrum from 3 to 21GHz;
• Select MDCA-all, as illustrated in Figure 5. There are 4 methods you may use.
o Method 1. Press RECALL (DATA FUNCTIONS area), scroll to “MDC-2100….
Filter A” and press RECALL (or MENU/VIEW SPAN then MENU/MANUAL
MODE).
o Method 2. Press AUTO/MANUAL (MODE area - lower left by power light) then
F2, then F1, etc. This method picks from the same menu as above.
o Method 3. Press F1/INPUT and repeat until you see MDCA-all displayed.
o Method 4. Enter a frequency found in an MDCA window. You must start from an
OSCOR RF band (not INFRARED or AC VLF).
o Spans are recalled with the settings last used no matter which method is used.
MDCA-all may not initially display. If MDCA-1, MDCA-2 or MDCA-3 displays,
press F4/MDC Anlz, then F1/Show All.
REI
MDC-2100/MDC-900
6
Version 4
27 Feb 08
o
•
•
•
•
•
You can choose to begin with MDCB-all if you wish. You must view both MDCAall and MDCB-all to see the entire spectrum.
Set the span to 1.5GHz, if necessary. If a smaller span initially displays, press
SWEEP/ANALYZE (CONTROL area) to select SWEEP. Press SHIFT (DATA
FUNCTIONS area) and EXPAND (CONTROL area).
Notice any signals displayed.
Select MDCB-all. Use the same options discussed above.
Set the span to 1.5GHz.
Notice any signals displayed.
Viewing Bands 1, 2 and 3;
•
•
•
You can view bands in any order but be sure to view all six spans.
Press F4/MDC Anlz.
Press F2 to toggle through each band. Note all signals.
Viewing smaller spans; After all bands have been viewed, cycle through each one again.
Analyze all unknown signals.
• Position the display arrow over any signal with the rotary control (CONTROL area).
• Press NARROW (CONTROL area) if you wish.
• Press SWEEP/ANALYZE.
• Press NARROW if you wish.
Identifying signals;
• Press F4/Identify see Figure 6B.
o Observe whether the signal moved left or right, see Figure 7.
o The possible frequencies will be displayed at the top left. If the signal
moved left it is one frequency, if it moved right it is the other.
• Press F4/RETURN to return to the previous menu to identify all other signals.
• Press MENU/EXIT to return to the normal menu.
Figure 5: MDCA-ALL (OSCOR 5.0)
REI
MDC-2100/MDC-900
7
Version 4
27 Feb 08
Figure 6A: ANALYZING AN MDC SIGNAL (OSCOR 4.0)
Figure 6B: ANALYZING AN MDC SIGNAL (OSCOR 5.0)
FIGURE 7: USING “IDENTIFY” TO VERIFY A SIGNAL (OSCOR 5.0)
OSCOR Sweep and Analyze Modes with the MDC
In the Sweep mode, the cursor frequency is no longer representative of a single frequency
because of the folding principle described in the introduction of this manual. Therefore,
when the entire frequency spectrum is displayed from 3 to 21GHz (MDC-2100) or 3 to
9GHz (MDC-900), only the local frequency is displayed for the cursor frequency. In this
display, it is important to note that the OSCOR is in the MDC mode and not to confuse this
display with the normal RF/WhipH frequency display. Furthermore, when selecting a
single antenna band as described by Figure 3, the cursor frequency represents four
different possible frequencies (two if using OSCOR 5.0), and when a specific filter is
selected (A or B) then the cursor frequency represents two different possible frequencies.
From the sweep mode, it is impossible to tell the exact frequency of the transmitted signal.
Follow the sequence described in the previous paragraph to determine the exact
transmitted frequency.
Furthermore, when rolling the cursor rotary dial back and forth, half of the numbers
representing potential signal frequencies will be increasing while others will be
decreasing. This again is due to the down-conversion process. Furthermore, often
signals will have an odd shape due to the down conversion. In Figure 8, a signal is
selected using the OSCOR NARROW button and the OSCOR rotary dial. This signal has
a rather strange shape because of the folding process of the down-conversion, but it
provides an excellent indicator for the proper signal down conversion. Hence, by pressing
REI
MDC-2100/MDC-900
8
Version 4
27 Feb 08
the F4 button to further analyze the signal, it is possible to analyze which antenna and
filter that is actually receiving the signal. Figure 9 shows the proper antenna selected and
the proper filter selected which corrects the signal shape. Furthermore, the unusual signal
shape of Figure 8 indicates that this signal should be a Filter B signal.
Note: The OSCOR 5.0 software will not allow this type signal to be displayed.
The frequency span limits are always between 0 and 3GHz. This is because the OSCOR
is a spectrum analyzer that covers the frequency range up to 3GHz, but the input
frequencies of the down-converter cover 3 to 21GHz (MDC-2100) or 3 to 9 GHz (MDC900). Therefore, the cursor frequencies provide the possible signal frequencies while the
span numbers (indicated at the top right and left of the display) provide the frequency
span the OSCOR is actually viewing after the down-conversion process.
Technical Note: It is possible to have a very slight shift in frequency in the downconversion process. In the example below, the signal shifted about 50KHz; this is a
minimal shift considering the signal is at 10GHz.
Figure 8: SELECTING A SIGNAL WITH THE MDC (OSCOR 4.0)
Technical Note: You may see false signals at 8.5 and 9GHz. These are produced by an
interaction of the MDC and the OSCOR. You may minimize this by moving the MDC a
few feet from the OSCOR and orientating the MDC metal housing towards the OSCOR.
REI
MDC-2100/MDC-900
9
Version 4
27 Feb 08
Figure 9: SELECTING THE PROPER MDC BAND AND FILTER (OSCOR 4.0)
Storing a Sweep Span with the MDC
Since the MDC down-conversion process displays multiple frequency bands at once, the
easiest way to quickly view a specific frequency span is to type in a desired center
frequency and then use the EXPAND and NARROW keys to adjust the span.
To store a specific frequency span:
1. Ensure that the OSCOR is in the SWEEP mode and the MDC is connected.
2. Type in the desired center frequency between 3 and 21 GHz (or 3 and 9GHz for the
MDC-900).
3. Adjust the frequency span using the EXPAND and NARROW keys. (The number in
the top left corner of the OSCOR display shows the span.)
4. Press the STORE button.
5. To review the stored spans, simply press the RECALL button from the SWEEP mode.
Note: Further details can be found in the OSCOR Owner’s Guide.
There are some important aspects of storing spans that should be understood:
• If you store a specific frequency band in the MDC range (for example 5.6 to 5.8GHz),
the MDC will also simultaneously search a parallel frequency band (in the example it
will also search from 6.2 to 6.4GHz).
• You cannot store frequency spans that cross the 1.5GHz crossover points. See
Figures 2 and 3 for the 1.5GHz bands. Therefore, to search specifically from 4 to
6GHz as an example, you may choose to search the 3 to 9GHz antenna band with the
Group A filter to cover the range from 4.5 to 6GHz (See Figure 3). And then, store a
range centered at 4.25GHz with a 500MHz span to cover from 4 to 4.5GHz. If using
OSCOR 4.0, the fastest and simplest method would be to simply cover the entire span
from 3 to 9GHz with Filter A & B selected.
• When storing a span in memory, the actual frequency limits are not displayed in the
frequency span list. However, pressing the RECALL button will recall the span
showing the stored frequency span.
• To summarize these effects:
If you desire to cover a frequency span that is greater than 1.5GHz or crosses the
antenna bands, the best approach is always to cover the entire antenna band that
REI
MDC-2100/MDC-900
10
Version 4
27 Feb 08
includes the desired frequency span. The table below provides some examples
and recommended search span for speed and accuracy.
Example of a Desired Frequency
Span:
Recommended Implementation:
4 – 6GHz
6 – 8GHz
5.7 – 5.9GHz
8 – 10GHz
13 – 16GHz
3 – 9GHz (MDCA-1 & MDCB-1/OSCOR 5.0)
3 – 9GHz (MDCA-1 & MDCB-1/OSCOR 5.0)
5.8 GHz, 250MHz span
3 – 21GHz (MDCA-all & MDCB-all/OSCOR 5.0)
3 – 21GHz (MDCA-all & MDCB-all/OSCOR 5.0)
Figure 10; EXAMPLES OF STORING SPANS
Storing a Signal in the MDC Frequency Range
When a signal is stored in the OSCOR signal database, only the signal frequency is
stored in OSCOR memory. However, when the OSCOR tunes to a specific signal in the
MDC frequency band (3 - 21GHz) then the OSCOR automatically directs the MDC to the
proper antenna band and filter group to maximize the signal to noise ratio and maximize
the system performance. An example signal is shown below, Figure 11.
Figure 11: ANALYZE MODE USING THE MDC (OSCOR 4.0)
To store a specific frequency:
1. Ensure that the OSCOR is in the ANALYZE mode.
2. Type in the desired center frequency between 3 and 21 GHz (or 3 and 9GHz for the
MDC-900).
3. Press the STORE button.
4. To review the stored frequencies, simply press the RECALL button from ANALYZE
mode. Alternatively, you may select AUTO/MANUAL, then MANAGE DATA, then
SIGNALS, then EDIT MENU and pick from that list.
Note: Frequencies are stored in a 2.5MHz wide window (span). If a different span is
desired the frequency should be stored as a span. See previous instructions. Further
details can be found in the OSCOR Owner’s Guide.
REI
MDC-2100/MDC-900
11
Version 4
27 Feb 08
Microwave Transmission Considerations for the MDC
There are important principles and considerations to understand when dealing with
microwave frequency radiators.
• As the frequency increases, the penetration of RF signals through building materials,
foliage, etc. decreases rapidly. Therefore, microwave signals are considered to be a
line-of-sight (LOS) communication link. If you locate a microwave surveillance device,
the receiving station will be in the direction of the transmission antenna.
• Directional properties of microwave transmissions may be leveraged by the use of
high gain, directional antennas to create an efficient point-to-point RF link. In addition,
the short wavelengths of microwave frequencies allow for decreased dimensions of
such antennas. These techniques result in a signal that is beamed from one location
to another with very little energy wasted in unintended directions, and in turn makes
the RF energy more elusive in it's detection.
• Reflections from metal structures in a building can greatly complicate the location and
detection process. Furthermore, these reflections tend to de-polarize the transmitted
signals rather quickly. The MDC antennas are linearly polarized, and some customers
have had concerns that the polarization effect of the MDC antennas could cause the
user to overlook a transmitter due to an incorrect polarization effect. Rotating the
antenna 90 degrees along the LOS axis can minimize this effect. However, our
experience and testing indicate that this is not a problem because of the reflective
nature of the metal structures in a normal building environment.
Sweep operations: The facility you are trying to protect should be considered in
relationship with its surroundings. Any window, or external opening should be considered
a possible LOS portal for microwave radiation. Nearby buildings are potential locations for
receivers.
• Begin any sweep for microwave radiators outside the facility.
• Align the MDC in a LOS path between surrounding buildings and windows or
openings.
• Direct the MDC antennas towards your facility.
• Operate the OSCOR in peak display mode (traces) for a specific time.
• If devices/signals are detected, note the area of the facility where the signals
originated. Signal strength will be greatest when directional MDC antennas are
aligned along an LOS path and the antenna’s polarity matches the transmitter.
• If devices/signals are detected and determined to not be continuous wave signals, run
traces again and again for shorter and shorter times. In this way you can determine
the time between transmissions. This methodology is crucial for detecting devices
using burst or packet transmitters.
• Sweep inside the facility in the areas where signals originated.
• Once an area of a room is determined to be the transmission source, the MDC may be
used as a probe to locate the transmitter.
Because of the principles above, it is important to understand that to properly use the
MDC, it is necessary to point the MDC in all directions of possible concern. It is advisable
to move the MDC to different locations in the room. It has been suggested that because
of the microwave reflections, it may be possible to completely cover a room by pointing
the MDC directly at the ceiling. The concept is that due to the metal in most ceiling
structures, there would be enough reflective effect to detect a transmitter from any
location in the room. This method has some merits, but it is impossible to predict how
reliable that it would be in all situations. Therefore, this method should only be used when
REI
MDC-2100/MDC-900
12
Version 4
27 Feb 08
it is absolutely necessary in order to save time. A good rule of thumb is to assume that
the MDC has an antenna pattern that is about 100 degrees wide. In other words, it is
necessary to point the MDC in at least 4 different directions around the room to cover the
perimeter. Also, the MDC should be pointed up and possibly moved around the room to
cover the ceiling, and down to cover the floor. Furthermore, if you expect a very
sophisticated threat, it is recommended to point the MDC into ducting, above ceiling tiles,
and in any enclosed spaces in which it would be possible to place a transmitter with a high
gain antenna. It is highly recommended that the “Show All” mode of operation for the
MDC-2100 be utilized (MDCA-all and MDCB-all if using OSCOR 5.0). When a signal is
detected, the user can then manually select the different antenna bands and filters to
further investigate the signal. Or, the user can simply go to the analyze mode and allow
the MDC to determine the operational frequency of the transmitter. Also, it is not
recommended to use the MDC with the OSCOR automatic mode unless the MDC
directional characteristics are taken into consideration. If running the OSCOR and MDC
in the automatic mode, take care to enable the appropriate MDC spans. To maximize
usage of the MDC, include MDC 3-21GHz Filter A and MDC 3-21GHz Filter B in your
span list (For OSCOR 4.0 users, set span to All Bands A&B).
REI
MDC-2100/MDC-900
13
Version 4
27 Feb 08
Using the MTU-2100 Microwave Test Unit
The MTU-2100 is designed to provide a simple test to verify that the MDC is working
properly. When the button is pressed on the MTU, low power signals are generated at
about 5.9, 11.8, and 17.7GHz for 3 minutes. Each transmitted signal contains a
modulated tone between 900Hz and 1KHz to verify that the signal is radiating from the
MTU-2100. It is important to note that the frequency transmissions from the MTU may
drift slightly. It should also be noted that the MTU test transmitter and the MDC downconverter both have polarized antennas. When using the MDC in a room environment,
the polarization is often not of great concern because of the depolarizing effect that occurs
from reflections from the room structure. However, when verifying proper operation of the
MDC using the MTU at a close proximity, the polarization of the antennas is important. To
achieve the proper polarization with the high gain antennas of the MDC, the following
positioning should be utilized.
•
•
•
3 – 9GHz band: MTU and MDC should be both horizontally oriented.
9 – 15GHz band: MTU and MDC should be perpendicularly oriented.
15 –21GHz band: MTU and MDC should be perpendicularly oriented.
Figure 12: PROPER MTU ORIENTATION FOR TESTING BAND 1 (3- 9GHZ) OR MDC- 900
Figure 13: PROPER MTU ORIENTATION FOR TESTING BAND 2&3 (9- 21GHZ) FOR MDC2100 ONLY
Since the MDC is a very sensitive receiving device, it is very possible for the MDC to
detect sub-harmonics from the MTU. In other words, when using the MTU, additional
signals may appear at frequencies other than the main signals of 5.9, 11.8, and 17.7 GHz.
The best way to determine if a signal is being radiated from the MTU is to move the MTU
away from the MDC and see if the signal disappears or go the analyze mode in the
OSCOR and listen for the modulated tone from the MTU. All signals from the MTU will
contain the modulated tone. The main MTU signals should all be found using Filter A.
REI
MDC-2100/MDC-900
14
Version 4
27 Feb 08
MDC-2100/MDC-900 SPECIFICATIONS
Specifications
MDC-2100
MDC-900
Frequency Range:
3-21GHz
3-9GHz
Conversion output:
5MHz to 3005MHz
5MHz to 3005MHz
Frequency Bands of Operation: Band 1: 3-9GHz
Band 2: 9-15GHz
Band 3: 15-21GHz
Show All: 3-21GHz
Band 1: 3-9GHz
Antenna Gain:
Band 1: 10 dB
Band 2: 9 dB
Band 3: 9 dB
Band 1: 10 dB
Band 1: -110 dBm
Band 2: -110 dBm
Band 3: -110 dBm
Band 1: -110 dBm
300 milliamps at 12 volts
150 milliamps at 12 volts
MDS - Minimum Detectable
Signal including receiver
sensitivity, antenna gain, and
filtering losses:
Input Power:
All models
Weight:
Dim:
1.4 lb
11.4 x 3.1 x 1.4in
.635 Kg
29 x 8 x 3.5 cm
Tripod:
Weight:
Dim:
Usage Height:
.77 lb
8.75 x 2.5 x 1.5 in
5.5 in
.35 Kg
22.2 x 6.4 x 3.8 cm
14 cm
Case Dimensions:
Size (H x W x D):
6.25 x 18.5 x 14.5 in 47 x 36.8 x 15.9 cm
REI
MDC-2100/MDC-900
15
Version 4
27 Feb 08
Technical Bulletin
24 April 2002
For the MDC-900 and MDC-2100
This bulletin describes a calibration process to ensure the maximum technical
performance for the MDC unit.
Technical Background:
Most Down-converter products contain a local oscillator (LO) reference signal that is
utilized in the down-conversion process. While this LO frequency is vital to the downconversion process, it also creates a blind spot in the frequency spectrum that cannot be
analyzed. However, the MDC and OSCOR design addresses this technical problem. In
order to ensure that there is not a blind spot at the LO frequency or any of it’s harmonics
(6GHz, 12GHz, 18GHz), the OSCOR automatically shifts the LO frequency as it is
sweeping through the frequency range near the LO frequency. The ability to automatically
shift the MDC LO frequency as commanded by the OSCOR is one of the primary reasons
that the MDC units were designed only for use with the OSCOR. Other spectrum
analyzers do not contain the intelligent functions to control this function and remove blind
spots created by the LO. In order for this shifting process to be optimized, it is necessary
to calibrate the OSCOR shift command with the physical characteristics of the MDC
frequency shifting process. However, even if the calibration process is not performed, the
probability for a random signal of 200KHz bandwidth to actually be located in a blind spot
assuming a uniform random signal distribution is only 0.000167.
Calibration Process:
Follow these steps to calibrate the MDC to the particular OSCOR utilized with it. There is
no need to connect the MDC to the OSCOR for calibration.
To calibrate an OSCOR to a specific MDC unit;
1. Press SHIFT and the numbers 786.
2. Enter the number ________. This calibrates for 6GHz. This number is unique to each
MDC unit and must be obtained from REI. The above calibration number is to be
used with MDC-900/MDC-2100 serial number ____________. To calibrate for 12GHZ
enter ________. To calibrate for 18GHz enter ________.
3. Press Shift and the numbers 788 to permanently store the calibration data in the
OSCOR.
Note: This calibration data is permanently stored in the OSCOR Kernel. It will never need
to be repeated even if the OSCOR program key is replaced. The calibration process can
be repeated as often as desired. Also, if the MDC is used with another OSCOR, the
calibration process must be repeated to ensure that the MDC and OSCOR are calibrated
for use together. The OSCOR will store only one calibration number at a time.
REI
MDC-2100/MDC-900
16