1
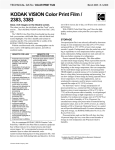
V2CS
KODAK
VISION2
Color Negative
Control Strips
Process ECN-2
Technical Data and
Crossover
Information
©Eastman Kodak Company, 2004
August, 2004
Note: While the data presented are typical of production coatings, they do not represent standards which must be met by Kodak.
Varying storage, exposure, and processing conditions will affect results. The company reserves the right to change and improve
characteristics at any time.
Table of Contents
Introduction . . . . . . . . . . . . . . . . . . . . . . . . . . . . . . . . . . . . . . . . . . . . . . . . . . . . .
Processed Control Strip - 35mm . . . . . . . . . . . . . . . . . . . . . . . . . . .
Important Improvements . . . . . . . . . . . . . . . . . . . . . . . . . . . . . . . . . . . . . . . . . . .
Control Strip Log Exposure Range . . . . . . . . . . . . . . . . . . . . . . . . . . . . . . . . . . .
ECN-2 Control Strip Exposed on KODAK VISION 200T Color
Negative Film 5274 . . . . . . . . . . . . . . . . . . . . . . . . . . . . . . . . . .
ECN-2 Control Strip Exposed on KODAK VISION2 200T Color
Negative Film 5217 . . . . . . . . . . . . . . . . . . . . . . . . . . . . . . . . . .
Effects of Mechanical and Chemical Variations . . . . . . . . . . . . . . . . . . . . . . . . .
Developer Mechanical Factors . . . . . . . . . . . . . . . . . . . . . . . . . . . . . . .
Effects of Time and Temperature Variations . . . . . . . . . . . . . . . . . .
Developer Chemical Factors . . . . . . . . . . . . . . . . . . . . . . . . . . . . . . . . .
Effects of pH and CD-3 Variations . . . . . . . . . . . . . . . . . . . . . . . . .
Effects of NaBr and AF-2000 Variations . . . . . . . . . . . . . . . . . . . .
Effects of Na2SO3 and Under and Over Replenishment Variations.
Effects of Prebath Contamination . . . . . . . . . . . . . . . . . . . . . . . . . .
Effects of CD-2 for CD-3 and Stop Bath Contamination . . . . . . . .
Effects of Bleach Contamination . . . . . . . . . . . . . . . . . . . . . . . . . . .
Effects of F-34a Fixer and Final Rinse Contamination . . . . . . . . . .
Effects of KI Contamination and Water Dilution . . . . . . . . . . . . . .
Effects of Bacterial Na2S and Na2CO3 Contamination . . . . . . . . . .
Control-Strip Crossover . . . . . . . . . . . . . . . . . . . . . . . . . . . . . . . . . . . . . . . . . . .
Control-Strip Crossover for Process ECN-2 . . . . . . . . . . . . . . . . . .
MORE INFORMATION . . . . . . . . . . . . . . . . . . . . . . . . . . . . . . . . . . . . . . . . . .
2
3
3
3
4
5
6
7
8
8
9
9
10
11
12
13
14
15
16
17
18
19
20
KODAK VISION2 Color Negative Control Strips, Technical Data and Crossover Information
KODAK VISION2 Color Negative Control Strips
Introduction
Important Improvements
KODAK VISION2 Color Negative Control Strips (Figure 1)
are intended for the control of Process ECN-2 using the
procedures described in KODAK Publication No. H-24,
Manual for Processing KODAK Motion Picture Films,
Module 1, Process Control.
The first batch of KODAK VISION2 Color Negative
Control Strips is code 5011 for 35 mm, CAT 152 0469 and
code 5012 for 16 mm, CAT 152 0444.
KODAK VISION2 Color Negative Control Strips
incorporate several important improvements into the control
strips for Process ECN-2.
• A VISION2 emulsion is being used for process control.
The new format is exposed on KODAK VISION2 200T
Color Negative Film 5217, while the former ECN control
strip was exposed on KODAK VISION 200T Color
Negative Film 5274.
Figure 1 Processed Control Strip - 35mm
ECN-2
9071
Steps
4
HD
KODAK VISION2 Color Negative Control Strips,
Process ECN-2, are packaged in 100-foot rolls containing at
least 120 exposures and a processed reference strip. The
exposures on the roll are spaced at 9.5-inch intervals. Each
exposure has 21 gray-scale steps at 0.20 log H increments
(2/3 camera stop).
The reference strip accompanying each roll was exposed
along with all other control strips; it was then processed
under specified well-controlled conditions. An instruction
sheet enclosed with the package contains process deviation
(correction) factors, if they are required, to determine your
laboratory process aim numbers. A four-digit code number
appearing on the carton, can, control strips, reference strips,
and instruction sheet, identifies each production batch of
strips.
8
MD
14
LD
21
D-min
F009_0146CC
KODAK VISION2 Color Negative Control Strips, Technical Data and Crossover Information
3
Control Strip Log Exposure Range
The graphs in Figure 2 and Figure 3 demonstrate the
differences between the former ECN control strip exposed
on KODAK VISION 200T Color Negative Film 5274, and
the new format exposed on KODAK VISION2 200T Color
Negative Film 5217.
Physically, the center-to-center step distance has been
maintained on the new control strips; no problems should be
encountered with existing automatic densitometers.
Once the transition to the new control strips is complete,
and the new control step reference values have been
determined, continue to use KODAK VISION2 Color
Negative Control Strips in the same manner as your previous
control strips.
Please contact your Kodak representative for additional
information on monitoring your process with control strips.
4
KODAK VISION2 Color Negative Control Strips, Technical Data and Crossover Information
Figure 2 ECN-2 Control Strip Exposed on KODAK VISION 200T Color Negative Film 5274
3.0
Exposure: 1/50 sec
Process: ECN-2
Densitometry: Status M
B
G
DENSITY
2.0
R
1.0
0.0
-4.0
-3.0
-2.0
-1.0
0.0
1.0
2.0
LOG EXPOSURE (lux-seconds)
KODAK VISION2 Color Negative Control Strips, Technical Data and Crossover Information
5
Figure 3 ECN-2 Control Strip Exposed on KODAK VISION2 200T Color Negative Film 5217
3.0
Exposure: 1/50 sec
Process: ECN-2
Densitometry: Status M
B
G
DENSITY
2.0
R
1.0
0.0
-4.0
-3.0
-2.0
-1.0
0.0
1.0
2.0
LOG EXPOSURE (lux-seconds)
6
KODAK VISION2 Color Negative Control Strips, Technical Data and Crossover Information
Effects of Mechanical and Chemical
Variations
Figures 4 through 13 illustrate some of the major
photographic effects of mechanical and chemical variations
on KODAK VISION2 Color Negative Control Strips
exposed on 5217 Film compared to the former VISION
Control Strips exposed on 5274 Film. Each plot shows the
effect of a change in a process variable (horizontal axis), on
the dye density of the processed film (vertical axis). These
density plots are deviated against the standard level for each
variable (e.g. standard level for the variable is represented by
zero density).
The magnitude of the changes shown in these plots should
not be considered to be process control limits. Also, the data
presented are qualitative, not quantitative. The plots were
derived from experiments using small laboratory machines
in which all constituents were held constant except the
variable being studied. Hence, the figures should be used
only as trend charts and guides. If two or more process
variable are changed, the resulting photographic effect
illustrated may not be additive. Interactions can occur that
produce effects other than those predicted by addition. The
plots in this publication are representative only; they do not
contain all possible solution problems. Most of the important
photographic effects take place in the developer.
KODAK VISION2 Color Negative Control Strips, Technical Data and Crossover Information
7
Developer Mechanical Factors
Figure 4 Effects of Time and Temperature Variations
—VISION2 Control Strips versus VISION Control Strips in Process ECN-2 Developer
Time
5274
GREEN
BLUE
.05
B/W
.10
R
G
B
.15
.20
.25
R
G
R
G
B
.15
R
G
.10
.10
.15
G
V2CSQ_V2CSP_2
8
R
G
B
B
G
R
R
G
B
B
R
G
R
G
B
.10
.10
R
G
.05
+
0
GR
R
B
B
B
G
R
.05
B G
.10
B R
R
sec
G
R
sec
R
G
B
G
B
B G
˚F
110
B/W
R
G
B
B
R
G
108
BLUE
.05
B
R
G
106
GREEN
.05
+
0
104
RED
.10
102
HD-LD
R
G
B
110
B/W
R
R
G
B
108
BLUE
B
B
G
G
R
G
340
GREEN
R
320
RED
.10
300
D-min
.05
240
B/W
B
R
G
R
G
B
220
BLUE
R
G
B
B
B
R
G
.05
+
0
340
GREEN
B
.10
220
RED
R
G
B
R
.20
LD
R
G
B
.05
320
B/W
300
BLUE
B
G
R
B
G
R
.05
+
0
240
GREEN
R
G B
B
R
G
B
RED
G
B
B
.20
MD
R
.10
.05
+
0
RED
B
G
R
106
HD
R
G
.15
5274
B
R
G
B
.20
0000
5217
102
REFERENCE
STRIP
CODE NO.
5217
.25
104
AIM
VALUES
Temperature
˚F
KODAK VISION2 Color Negative Control Strips, Technical Data and Crossover Information
Developer Chemical Factors
Figure 5 Effects of pH and CD-3 Variations
—VISION2 Control Strips versus VISION Control Strips in Process ECN-2 Developer
pH
AIM
VALUES
REFERENCE
STRIP
CODE NO.
CD-3
5217
5274
5217
5274
.25
.20
0000
HD
B
.15
GREEN
BLUE
.05
B/W
.10
.15
R
B
G
R
B
R
B
G
R
G
.10
.05
+
0
RED
G
R
R
G B
G
B
.20
R
G
.25
R
B
B
G
.20
B
B
G
R
.05
+
0
.05
.10
R
G
B
R
G
.15
.20
V2CSN_V2CSD_2
G
G
B
R
B
G
R
R
.10
R
.05
+
0
.05
.10
R
B
G
R
B
G
pH
G
R
pH
G
R
G
B
G
R
B
G
B
R
B
R
g/L
KODAK VISION2 Color Negative Control Strips, Technical Data and Crossover Information
B
B G
5.50
.10
10.05
B/W
G
R
B
B
B
G
R
4.75
BLUE
R
G
B
B
R
G
4.00
GREEN
.05
B
G
R
2.25
RED
.05
+
0
2.50
HD-LD
B
.10
5.50
B/W
G
R
G
10.45
BLUE
G
R
10.35
GREEN
B
B
G
R
B
.10
10.25
RED
B
R
B
R
G
10.15
D-min
.05
B
G
R
10.05
B/W
R
G
B
10.45
BLUE
.05
+
0
B
G
R
10.35
GREEN
.10
10.25
RED
R
B
G
10.15
LD
B
G
R
G
R
R
G B
4.75
B/W
G
R
4.00
BLUE
.10
3.25
RED
GREEN
B
2.50
MD
.15
g/L
9
Developer Chemical Factors
Figure 6 Effects of NaBr and AF-2000 Variations
—VISION2 Control Strips versus VISION Control Strips in Process ECN-2 Developer
NaBr
AIM
VALUES
REFERENCE
STRIP
CODE NO.
AF-2000
5217
5274
5217
5274
.25
.20
0000
HD
.15
B
.10
G
GREEN
.05
+
0
BLUE
.05
B/W
.10
RED
B
G
R
R
G
R
B
R
G
B
G
R
B
R
G
B
.15
B
G
R
B
G
R
.20
.25
.20
MD
.15
.10
RED
GREEN
BLUE
B/W
.05
+
0
B
B
G
R
G
R
G
B
R
R
G
B
.05
.10
G
R
B
R
G
B
G
R
B
G
B
R
.15
.20
V2CSK_V2CSA_2
10
G
R
B
G
R
B
G
R
B
G
B
R
G
R
B
B
R
G
G
B
R
.10
.10
g/L
g/L
ml/L
7.50
R
B
G
B
R
G
6.25
R
G
B
.05
G
R
B
5.00
G
R
B
B
G
R
3.75
.05
+
0
2.50
.10
0.8
B/W
.05
G
R
B
7.50
BLUE
R
G
B
6.25
GREEN
R
G
B
B
G
R
5.00
RED
G
R
B
3.75
HD-LD
B
G
R
2.50
B/W
.05
+
0
1.6
BLUE
.10
1.4
GREEN
G
R
B
.10
1.2
RED
.05
R
G
B
1.0
D-Min
R
B
G
G
R
0.8
B/W
B
B
G
R
1.6
BLUE
.05
+
0
1.4
GREEN
.10
1.2
RED
1.0
LD
ml/L
KODAK VISION2 Color Negative Control Strips, Technical Data and Crossover Information
Developer Chemical Factors
Figure 7 Effects of Na2SO3 and Under and Over Replenishment Variations
—VISION2 Control Strips versus VISION Control Strips in Process ECN-2 Developer
Under and Over
Replenishment
Na 2 SO3
AIM
VALUES
REFERENCE
STRIP
CODE NO.
5217
5274
5217
5274
.25
.20
0000
HD
.15
.10
GREEN
.05
+
0
BLUE
.05
B/W
.10
RED
R
G
R
B
G
B
G
B
R
B
G
R
G
R
B
G
B R
R
G
R
G
B
B
.15
.20
.25
.20
MD
.15
.10
RED
GREEN
BLUE
B/W
.05
+
0
B
G
B
R
G
G
R
B G
R
G
R
.05
G
R
B
B
R
B
.10
B
R
R
B G
G
.15
.20
V2CSL_V2CSR_2
R
G
B
B
B
B
G
R
G
B R
G
R
B
.05
R
G
R
R
G
B
G
.10
.10
.05
B
G
R
R
B
G
B
G
B
R
.10
g/L
g/L
G
R
G
R
G
B
g/L
KODAK VISION2 Color Negative Control Strips, Technical Data and Crossover Information
R
G B
R
B
+20%
R
0.0
B
G
-20%
.05
+
0
1.0
B/W
B G
R
+20%
BLUE
R
G
B
0.0
RED
GREEN
.05
+
0
-20%
HD-LD
R
B G
G
R
.10
3.0
B/W
R
G
B
G
R
.10
2.5
BLUE
B
2.0
RED
GREEN
.05
B
B
1.5
D-min
R
G
B
G
R
1.0
B/W
G
3.0
BLUE
B
R
2.5
GREEN
.05
+
0
2.0
RED
.10
1.5
LD
g/L
11
Developer Chemical Factors
Figure 8 Effects of PB-C1 and PB-2 Prebath Contamination
—VISION2 Control Strips versus VISION Control Strips in Process ECN-2 Developer
Prebath
PB-C1
AIM
VALUES
REFERENCE
STRIP
CODE NO.
PB-2
5217
5274
5217
5274
.25
.20
0000
HD
.15
.10
GREEN
.05
+
0
BLUE
.05
RED
B/W
R
R
B
G
.10
G
B
R
G
B
.15
.20
G
R
B
.25
.20
MD
.15
.10
RED
GREEN
BLUE
B/W
.05
+
0
.05
G
R
G
.10
B
.15
G
R
B
R
G
R
B
B
.20
V2CSB_V2CSM_2
12
BR
G
mL/L
mL/L
mL/L
150.0
100.0
50.0
.10
B
R
G
R
B G
200.0
R
GB
.05
0.0
.05
+
0
0.0
B/W
.10
200.0
BLUE
.10
150.0
GREEN
B
.05
100.0
RED
B
G
R
B
G
R
BGR
50.0
HD-LD
GR
0.0
B/W
.05
+
0
200.0
BLUE
B
.10
150.0
GREEN
B
B
.10
100.0
RED
.05
R
G
R
G
B
G
50.0
D-Min
R
G
0.0
B/W
R
200.0
BLUE
.05
+
0
150.0
GREEN
100.0
RED
.10
50.0
LD
mL/L
KODAK VISION2 Color Negative Control Strips, Technical Data and Crossover Information
Developer Chemical Factors
Figure 9 Effects of CD-2 for CD-3 and Stop Bath Contamination
—VISION2 Control Strips versus VISION Control Strips in Process ECN-2 Developer
Substitute CD-2 for CD-3
AIM
VALUES
REFERENCE
STRIP
CODE NO.
5217
.25
5274
5217
5274
R
B G
R
B G
Stop Bath
.20
0000
HD
.15
.10
GREEN
.05
+
0
BLUE
.05
B/W
.10
RED
R
R
G
.15
B
G
.20
B
.25
.20
MD
B G
R
B G
R
.15
.10
RED
GREEN
BLUE
B/W
.05
+
0
.05
R
G
B
.10
.15
R
GB
.20
V2CSC_V2CSO_2
B G
R
B G
R
.05
+
0
B
g/L
g/L
mL/L
KODAK VISION2 Color Negative Control Strips, Technical Data and Crossover Information
R
G
B
100
R
75
B
G
50
.10
25
.05
0
.10
100
B/W
.10
75
BLUE
R
B
G
.05
50
GREEN
B
25
RED
G
R
0
HD-LD
R
2.0
B/W
G
1.5
BLUE
B
R
1.0
GREEN
B
G
.05
+
0
0.5
RED
.10
0.0
D-min
B
R
G
B
R
G
.10
2.0
B/W
R
.05
1.5
BLUE
BG
R
1.0
GREEN
GB
.05
+
0
0.5
RED
.10
0.0
LD
mL/L
13
Developer Chemical Factors
Figure 10 Effects of Bleach Contamination
—VISION2 Control Strips versus VISION Control Strips in Process ECN-2 Developer
UL Bleach
AIM
VALUES
REFERENCE
STRIP
CODE NO.
5217
5274
.25
.20
0000
HD
.15
.10
GREEN
.05
+
0
BLUE
.05
B/W
.10
RED
R
.15
G
R
B
G
.20
B
.25
.20
MD
.15
.10
RED
GREEN
BLUE
B/W
.05
+
0
.05
R
R
.10
G
G
B
B
R
B
G
G
R
B
R
G
B
G
R
B
.15
.20
HD-LD
RED
GREEN
BLUE
.10
.10
.05
+
0
V2CSU_2
14
G
B
R
R
G
.05
B
.10
0.0
B/W
.05
mL/L
8.0
B/W
6.0
BLUE
.05
+
0
4.0
GREEN
.10
2.0
RED
.10
0.0
D-Min
8.0
B/W
.05
6.0
BLUE
.05
+
0
4.0
RED
GREEN
.10
2.0
LD
mL/L
KODAK VISION2 Color Negative Control Strips, Technical Data and Crossover Information
Developer Chemical Factors
Figure 11 Effects of F-34a Fixer and Final Rinse Contamination
—VISION2 Control Strips versus VISION Control Strips in Process ECN-2 Developer
F-34a Fixer
AIM
VALUES
REFERENCE
STRIP
CODE NO.
Final Rinse
5217
5274
5217
5274
.25
.20
0000
.15
HD
.10
RED
GREEN
.05
+
0
BLUE
.05
B/W
.10
R
G
B
R
G
B
R
R
G
B
B
B
G
R
G
R
.15
.20
.25
.20
MD
.15
.10
RED
GREEN
BLUE
B/W
.05
+
0
B
G B
.05
B
G
R
G
R
.10
.15
.20
V2CSF_V2CSE_2
R
G
B
mL/L
mL/L
mL/L
KODAK VISION2 Color Negative Control Strips, Technical Data and Crossover Information
B
R
400
200
G
300
B
G
100
.10
R
0
.05
400
B/W
.05
+
0
300
BLUE
R
B
G
.10
200
GREEN
GB
R
.10
100
RED
BG
R
.05
0
HD-LD
R
G
B
1.00
B/W
R
G B
0.75
BLUE
.05
+
0
0.50
GREEN
B
G
R
.10
0.25
RED
B
G
R
.10
0.0
D-min
.05
1.00
B/W
R
G
B
R
G
B
0.75
BLUE
.05
+
0
0.50
GREEN
.10
0.25
RED
0.0
LD
mL/L
15
Developer Chemical Factors
Figure 12 Effects of KI Contamination and Water Dilution
—VISION2 Control Strips versus VISION Control Strips in Process ECN-2 Developer
Kl
5217
AIM
VALUES
REFERENCE
STRIP
CODE NO.
Water Dilution
5274
5217
5274
.25
.20
0000
HD
.15
.10
GREEN
.05
+
0
BLUE
.05
B/W
.10
RED
R
G
R
G
B
B
B
B
G
R
R
G
.15
.20
.25
.20
MD
.15
.10
RED
GREEN
BLUE
B/W
B
.05
+
0
R
G
.05
B
R
G
B
B
G
R
G
R
.10
.15
.20
V2CSH_V2CSG_2
16
mg/L
mg/L
mL/L
B
GR
B
400
R
G
300
.10
200
.05
100
.05
+
0
0
B/W
R
G
B
.10
400
BLUE
R
G
B
B
G
R
.10
300
RED
GREEN
B G
R
.05
200
HD-LD
G
R
B
100
B/W
.05
+
0
0
BLUE
R
G
B
.10
7.5
GREEN
B
G
R
.10
5.0
RED
B
G
R
.05
2.5
D-min
G
R
B
0.0
B/W
GR
B
7.5
BLUE
.05
+
0
5.0
GREEN
.10
2.5
RED
0.0
LD
mL/L
KODAK VISION2 Color Negative Control Strips, Technical Data and Crossover Information
Developer Chemical Factors
Figure 13 Effects of Bacterial Na2S and Na2CO3 Contamination
—VISION2 Control Strips versus VISION Control Strips in Process ECN-2 Developer
Bacterial Na S
Na 2 CO3
2
AIM
VALUES
REFERENCE
STRIP
CODE NO.
5217
5274
5217
5274
.25
.20
0000
HD
.15
.10
GREEN
.05
+
0
BLUE
.05
B/W
.10
RED
G
R
B
B
R
G
G
R
B
B
R
G
B
G
R
B
G
R
B
G
R
B
G
R
G
R
B
R
G
B
G
R
B
R
B
G
.15
.20
.25
.20
MD
.15
.10
RED
GREEN
BLUE
B/W
.05
+
0
.05
G
R
B
R
G
B
G
R
B
R
G
B
G
B
R
R
B
G
G
R
B
R
B
G
.10
.15
.20
mg/L
mg/L
g/L
45.6
35.6
25.6
15.6
5.6
.10
45.6
.05
0.0
B/W
.05
+
0
35.6
BLUE
.10
25.6
RED
GREEN
.10
15.6
HD-LD
.05
5.6
B/W
2.0
BLUE
.05
+
0
1.5
GREEN
.10
1.0
RED
.10
0.5
D-min
.05
0.0
B/W
2.0
BLUE
.05
+
0
1.5
GREEN
1.0
RED
.10
0.5
LD
g/L
V2CSJ_V2CSI_2
KODAK VISION2 Color Negative Control Strips, Technical Data and Crossover Information
17
Control-Strip Crossover
Important: During the inventory crossover from the old
VISION Control Strips to the new VISION2 Control Strips,
every effort should be taken in your operations to avoid
switching back and forth. Your process control will be
greatly simplified by depleting your supply of the VISION
Control Strips (except for what is needed for crossover
purposes) prior to utilizing the VISION2 Control Strips.
There will come a time when you will need to begin using
a new batch of control strips. A new batch means a new code
number, not a fresh box of strips with the same code number.
Please be aware no two batches of control strips are
identical because of slight differences in product, exposures,
process, etc. And therefore, the aim value numbers will not
match (however, on rare occasions they could), even with
the application of the deviation factors.
When you first started using control strips, you had no
previous reference and you set up your aim value parameters
by reading the densities of the specified (D-min, LD, MD,
HD, or D-max) control reference steps and applying the
deviation numbers supplied with that batch. Using a new
batch of strips is really no different, except you will have a
new set of aim numbers,
As the time approaches to change to a new batch (code),
you will want to make a “crossover” from the current, or old
batch. Crossover simply means to adapt to a change in aim
numbers, not a change in processing technique. You should
begin the crossover with at least a week’s supply of strips
still available (never wait until you run out).
The crossover to a new batch lets you get a “feel” for the
new set of aim numbers. Do not attempt to match the new
aim numbers to the old ones. If you do, you probably will
find it necessary to change the mechanical and/or chemical
specifications of the process, and this will most likely lead to
a non-conforming unacceptable process. You will notice
some differences in the way the new batch trends as
compared to the previous batch. this is a normal batch-tobatch variation, and is to be expected. If you are unable to
maintain a plot within your action limits with the new
control-strip batch, call your Kodak representative to assist
you.
18
Use the following crossover procedure each time a new
code number is put into service:
• Determine the aim values for the new batch, the same as
you did for the current or old batch by reading the
specified steps (D-min, LD, MD, and HD or D-max) of the
reference strip and applying the correction factors. If there
is more than one roll of the same batch, average the
corresponding step densities for all reference strips in the
batch, then apply the correction factors.
• Process an old and new control strip simultaneously at
least three separate times. Do this at different times of the
day, and better yet, on different days, until you have a
number of pairs. During this time, continue to control the
process with data from the old strips.
• Post the new aim values on the same form as the old,
leaving an appropriate space between the two aim sets (as
illustrated in Figure 14). This way you can see the
differences of each control strip reaction at a glance. You
will observe the tracking of the “old” batch as compared
to the “new” batch, with each plotted to its individual set
of aim numbers. Both should be tracking in similar
directions, but not exactly. However, they still should be
within the same action and control limits. Please
remember, no matter how the aim densities differ in
numerical value, you still use each set as your zero (0)
reference line.
• Once you are comfortable with the new batch of control
strips, use a new H-24F or Y-55 form to separate and not
confuse the old and new aim numbers while making the
daily notations.
• If, for some reason, there is a need to adjust the process to
conform to the new batch of control strips to new action
and control limits, cease processing and evaluate the
entire system. Such a need for change indicates a
fundamental system difficulty, which most likely involves
all aspects of the process, not necessarily a problem with
the new batch of control strips. If difficulty continues,
contact your Kodak technical representative.
KODAK VISION2 Color Negative Control Strips, Technical Data and Crossover Information
Figure 14 Control-Strip Crossover for Process ECN-2
EASTMAN Process Record Form (H-24F)
CONTROL NUMBER
AIM
VALUES
.25
C U R R E N T
N E W
Control Strip Crossover Process ECN-2
.20
.15
.10
HD
1.39
RED
1.88
GREEN
R-1.19
G-1.69
B-1.98
.05
+
0
Code 8051
.05
2.24
BLUE
.10
B/W
.15
.20
.25
.20
MD
.15
.10
RED
GREEN
BLUE
R-0.85
G-0.97
B-0.93
1.00
1.49
1.99
.05
+
0
.05
B/W
.10
.15
.20
LD
.10
RED
GREEN
BLUE
CB action = 0.06
CB control = 0.08
R-0.33
G-0.72
B-1.05
0.34
0.75
1.32
.05
+
0
.05
B/W
D-Min
.10
.10
RED
GREEN
BLUE
R-0.15
G-0.54
B-0.95
0.11
0.54
0.95
.05
+
0
.05
B/W
HD-LD
RED
GREEN
BLUE
.10
.10
CB action = 0.07
CB control = 0.09
R-0.86
G-0.97
B-0.93
1.05
1.13
0.92
.05
+
0
.05
B/W
.10
DATES
12
10
m
1p
PROCESS
MACHINE
F009_0143EC
10
m
4p
12
11
m
4a
11
ECN-2
#1
Reference Strip Code No.
m
1p
11
m
4p
12
12
m
8a
12
m
1p
12
m
4p
12 12 12
10 11 12
m
1p
m
1p
m
1p
EASTMAN KODAK COMPANY ROCHESTER, NY 14650
7121
KODAK Publication No. H-24F
Kodak and Eastman are trademarks.
KODAK VISION2 Color Negative Control Strips, Technical Data and Crossover Information
Printed in U.S.A.
19
KODAK VISION2 Color Negative Control Strips
MORE INFORMATION
Outside the United States and Canada, please contact your
Kodak representative.
You can also visit our web site at www.kodak.com/go/
motion for further information. You may want to bookmark
our location so you can find us easily the next time.
KODAK VISION2 Color Negative
Control Strips
KODAK Publication No. V2CS
Kodak, VISION, and VISION2 are trademarks.
Revised 5-05
Printed in U.S.A.