1
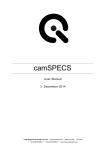
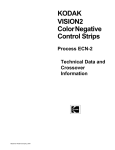
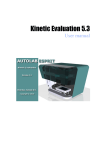
Prinect
Color and Quality
Guideline for Prinect Axis Control for
printing presses with Prinect CP2000 Center
Table of contents
1
1.1
1.2
1.3
Introduction
Definitions
Principles of the Heidelberg color control strips
Why is the color control strip or several measurement patches not
detected?
4
4
6
2
Functions and features of Prinect Axis Control
9
3
Basic rules to optimized printing
10
4
Basic settings of Prinect Axis Control
12
5
5.1
5.2
Typical make-ready for a new job
Procedure
Changes during a job
14
14
16
6
6.1
6.2
6.3
6.4
6.5
Reference values
Color sets
Creating color sets
Ways of entering reference values
Reference values from a print series
Changing reference values
18
18
18
18
19
20
7
Control methods
22
8
Reporting and protocol functions
23
9
9.1
9.2
Quality: the reason for color measurement and color control 24
The goals of color measurement and color control
24
Spectral measurement and colorimetry
24
10
10.1
10.2
10.3
10.4
10.5
Color theory
Human color perception
Spectral distribution of the visible light
Two control strategies: density and Lab
What does “ΔE0” mean?
Lab values from actual printing inks
26
26
27
28
29
29
11
11.1
11.2
11.3
Types of measurement devices
Spectral color measurement
Density measurement
Comparability of results obtained withdifferent measurement
systems
30
30
30
8
32
1 Introduction
1 The
correct notation is L*a*b*.
Lab will be used throughout this text
by way of simplification.
1.1 Definitions
• Lab1 color space, Lab values
To define a color precisely, its location within the Lab color space is
indicated by three coordinates:
L*: lightness or luminance (0 = black, 100 = white)
a*: red-green axis
b*: yellow-blue axis
Neutral grey hues have a = 0 and b = 0.
Left: Lab color space as a 3-dimensional
model
Right: a/b color plane
2 On-screen the letter d is used instead of Δ.
• ΔE2
(pronounced: delta E) describes the distance between two colors within
the Lab color space.
Distances within the Lab color system correspond to visually perceived
differences between colors. In other words, a given ΔE value will always be
perceived the same regardless of the chrominance (colors) and lightness.
ΔE
Perceived difference
smaller than 0.2
not visible
0.2–1.0
very small
1.0–3.0
small
3.0–6.0
moderate
larger than 6.0
large
• ΔE0
Describes the distance between the defined reference value and the best
value achievable (best match) with the combination of ink and paper
white being used.
• Density (D)
The density of a measurement patch is determined with the aid of an
appropriate filter. There are standardized filters for the process colors
4
Black, Cyan, Magenta and Yellow. The densities of special colors are
determined using the filter that yields the largest values.
• Z70
Indicates dot gain in the 70 % tint patch of Prinect® color control strips.
Tolerance values are stored in a tolerance archive.
In order to obtain consistent results throughout a print run, the dot gain must
remain constant. When making films and plates, it is also necessary to take
into consideration how the halftone dot areas will thicken when transferred to
the substrate during printing. Unless the plates are matched to the process, it
will be impossible to get the right colors.
• S/D
Slur/doubling values as percentages
S/D values are determined from the area coverage differences in the line
patches (also known as ladder targets). Tolerance values are stored in a
tolerance archive.
• ΔF
Control parameters as percentages
ΔF values are determined by comparing the reference Lab values with the
actually measured Lab values. They describe how far the measured color
deviates from the reference value, expressed as a percentage.
• Rules of thumb for the relationships among ΔE – ΔF – ΔD for the process
colors:
1 ΔE ~ 3-5 % ΔF
1 ΔE ~ 3/100 ΔD
1/10 ΔD ~ 12 % ΔF
These conversions are only intended to provide a general orientation. These
precise values will vary depending on the inks used, the color separation, and
the ink film thickness.
This figure shows the screen Axis Control/
Measurements. To the right of the screen
you’ll find numerical values for density,
slurring/doubling, Lab, ΔE, ΔE0, and ΔF, in
each case referring to the selected zones.
On the left there is a graphical representation of the ΔF values for the individual
zones and inking units. The reference value
is set as the zero line. The bars indicate the
magnitude of the deviations from the
reference value. In this example, Cyan is
under-inked across the entire width.
5
1.2 The principle of Heidelberg Color Control Strips
In the following, the color control strip “Prinect 4GS” and the functions of its
individual patches are described in detail by way of example.
Section of a 4GS color control strip with
explanations.
6
7
5
1
2
3
4
8
Center of zone
Zone number
Zone limits
Triangle:
center of press
Color control strips consist of repeating sequences. The color control strip
“Prinect 4GS”, for example, consists of sequences with a total length of 104
patches (corresponding to 520 mm or 16 zones).
The color control strip “Prinect 4GS” has various types of patches:
• Patches 1–4: solid patches, i.e. patches printed 100 % with one color, in this
example the process colors CMYK (on the strip, B stands for Black). These
patches are used to control solid colors.
• Patch 5: grey balance patch consisting of 70 % Cyan, 60 % Magenta,
60 % Yellow. Used for grey patch control of the chromatic colors CMY.
• Patches 6+7: solid overprint patches for determining ink acceptance when
printing multiple colors on top of one another; widely described as ink
trapping.
• Patch 8: halftone tint patch, here: Magenta. For determining dot gain
values. Prinect color control strips have a 70 % tint patch, but other values
are also possible.
• Patches 9+10: lines at different angles to identify slurring and doubling
defects.
In Heidelberg presses, each ink zone is 32.5 mm wide, so there are exactly
13 measurement patches within two zones.
When mounting the color control strip, make sure that:
• It is correctly aligned with the ink zones of the press and
• There is a 5 mm paper white margin on the left and right end of the strip.
Important for the Prinect 6GS and 8GS color control strips: due to the large
number of different patches and the fact that each patch is 5 mm wide, it is
not possible for every type of patch to be within each ink zone. If a certain
patch is not found in a zone, its value is assumed to be the average of the
corresponding values from the two neighboring zones. No numerical values
are displayed for deviations in these zones, because inking is controlled based
on the neighboring zones. The graphical display in these zones shows the
average of the neighboring zones.
6
The table below provides an overview of the different color control strips
and their makeup.
Solid and greyscale patches
Patch type
Patch
every other zone
every zone
Prinect 4GS
Prinect 6GS
Prinect 6GS99
Solid patch
Greyscale patch
C, M, Y
Solid patch
K, X, Z
Greyscale patch
C, M, Y
Solid patch
Greyscale patch
Prinect 6S
Solid patch
3 per control strip
K, C, M, Y
K, M, Y
X, Z
K, C, M, Y
C, M, Y
K, C, M, Y, X, Z
Greyscale patch
Prinect 6S+
Solid patch
U, V, S1, S2, S3, S4
Greyscale patch
Prinect 8GS
Solid patch
Greyscale patch
K, C, M, Y, X, Z, U, V
C, M, Y
Special patches
Ink acceptance
patches
Dot gain patches
Slurring/doubling
patches
Prinect 4GS
CM, CY, MY, CMY
K, C, M, Y
K, C, M, Y
Prinect 6GS
CM, CY, MY, CMY
K, C, M, Y, X, Z
K, C, M, Y, X, Z
Prinect 6GS99
CM, CY, MY, CMY
K, C, M, Y, X, Z
K, C, M, Y
Prinect 6S
K, C, M, Y, X, Z
Prinect 6S+
U, V, S1, S2, S3, S4
Prinect 8GS
CM, CY, MY, CMY
K, C, M, Y, X, Z, U,V
K, C, M, Y
Prinect® Axis Control® also lets you define your own customized color control
strip that is structured differently from the Prinect color control strips. However, be aware that the individual patches may not be smaller than 5 × 6 mm.
For details on how to do this consult: “Creating and Editing Color Control
Bars” in the User Manual.
7
1.3 Why is a color control strip or are several patches not detected?
• Wrong reference value ➔ difference between reference and actual values
too large
– Wrong color set loaded
– Soiled ink(s)
– Wrong measurement conditions set
• Swapped color separations
– Reference values are incorrectly assigned in Prinect Axis Control
• No calibration or incorrectly calibrated
• Paper or lenses soiled
• Wrong color control strip positioned
– If the color control strip is not in the archive, it can be created and saved
with the correct definition and size.
• Sheet and color control strip upside down or rotated
• Color control strip printed too close to edge of sheet
– There must be least 5 mm of blank white paper between the color
control strip and the edge of the sheet on the left and right.
• Measuring head incorrectly positioned
– Use the arrow keys on the console to precisely position the green mark in
the middle of the patch.
• Lamp defective
• Printed inks cannot be correctly measured (e.g. metallic inks)
• Actual measurement value is too far off the reference value (> +20 %)
8
2 Functions and Features of Prinect Axis Control
Prinect Axis Control is a color measuring system for all print shops
wishing to efficiently monitor quality right at the control console of their
Speedmaster®. Because it is fully integrated into the ergonomic design
of the Prinect® CP2000 Center®, it can be used on all modells.
Functionality and capabilities
• Spectrophotometric color measurement in color control strips
• Measurement of quality parameters – colorimetric and density values
for solid and grey balance patches, slurring/doubling, dot gain, trapping,
relative print contrast and metamerism.
• Storage of values for repeat jobs
• Job reports for quality analysis and documentation with the add-on tool
“Prinect Axis Control Reporting”
• Color database (HKS, Pantone)
• Digital measurement elements (Dipco) for prepress included
• Integrated in Prinect CP2000 Center for direct process control
• Online control of inking in individual printing units
• Reliable control of special colors with high reflectance
• Objective color measurement and control
The limitations of Prinect Axis Control
Prinect Axis Control cannot be reliably used to measure and control print
results with:
• Metallic inks
• Opaque inks
• Transparent substrates (plastic sheet)
• Metallized substrates
• Color control strips with patches smaller than 5 × 6 mm
9
3 Basic rules to optimized printing
Use of the Prinect Axis Control color measurement system alone does not
automatically guarantee that the results will meet expectations. The
reference values can only be approximated. Color control works best with
an integrated workflow that begins in prepress and extends down through
the production process to the press operator. In the following, the important
aspects for getting the best possible results with Prinect Axis Control are
described.
10
1. Determine the dot gain in the production process
Adjust platemaking to take account of the dot gain when printing
1. Prepress
2. Get the press ready3
• Put the press in a stable, reproducible state
• Determine optimum reference values (= color standards) for standard
process colors
2. Press
3. Optimize pre-inking and characteristic curves for presetting the inking4
• Pre-inking: get inking units in the right state for production
• Presetting of inking: determine how far the zones should be opened to
achieve the desired color standard
3. Characteristic Curves
4. Use presetting data
Preset the zones for the right area coverage values. Sources for values:
Prinect® Prepress Interface or Plate Image Reader.
4. Presetting of ink zones
5. Color control only with Prinect Axis Control
Do not change zones by hand: this interferes with the control system and
results in poorer quality!
5. Color control
6. Responsibilities of the press operator
• Make sure that the inking unit is in a stable state; check for the green
indicator on the Prinect® CP2000 Center.
• Printing just short of where smearing begins: minimize the dampening
solution feed to obtain high-contrast reproduction.
6. Operator
Under optimum conditions the desired colors of less than ΔE 5 compared to
the reference values can be achieved after printing about 130 sheets. From
here on, Prinect Axis Control can take over.
3 All press settings should be performed
again at least once a year.
details on how to proceed, see
“Prinect Color Solutions”.
4 For
When press sheets are pulled for inspection, the inking units must be in a
stable state. Sheets pulled too soon may exhibit excessive or insufficient
inking because they are still increasing or decreasing. That is why it is
important to watch for the green indicator on the Prinect CP2000 Center
display – it’s better to pull a bit later than too early!
If the level of less than ΔE 5 compared to the reference value is not
attained in the first sheet pulled, recheck the characteristic curve for
presetting the inking.
If, while printing a typical form with normal area coverage, the inking
units take considerably longer than 130 sheets to stabilize, check the preinking setting and adjust it if appropriate.
11
4 Basic settings of Prinect Axis Control
Check calibration; regularly recalibrate
• Use the provided customized calibration card.
• Heidelberg® Service will perform the first calibration. It should then be
repeated every three months.
Define measurement conditions (Job/Axis Control/New/Options)
The defined measurement conditions are important for comparing results
obtained using different devices.
Light
• D50: daylight, slightly reddish
• D65: daylight, slightly bluish
• A: standardized light bulb light, reddish
• C: standardized daylight but without UV portions
D50 is the standard applied in the European printing industry.
Observer
Selectable between 2° and 10° standard observer.
The default setting for offset printing is the 2° standard observer.
Filter
Selectable between polarized and unpolarized.
Polarization filters remove surface reflections from the ink. As a result,
measurements of wet and dry sheets are nearly identical. Polarization filters
only affect the density values. The filters are not applied for the Lab values.
Measurements with Prinect Axis Control though are always made in an
unpolarized mode, because Prinect Axis Control does not have a physical
polarization filter. The “polarized” density value is calculated from the
unpolarized spectral measurement.
Density filter standards
The following filters are defined for density measurement:
Selectable filter sets: DIN 16536 NB, DIN 16536, ANSI A, ANSI T
For Prinect Axis Control, the recommendation is to use either “DIN 16536”
or “AnsiT” (in North America).
5 None
of the color control strips supplied
with the equipment can be deleted; only
user-defined bars can be erased. See the
User Manual for details on how to create
your own color control strip.
12
Color control strips
In “Service/Archive/Color Control Bar Archive” you can suppress unused color
control strips. The most frequently used bar can also be preselected.
• For analog mounting: use CPC color control strips
• For digital mounting: use Prinect (or Prinect FOGRA) color control strips
Note: unused color control strips should not be irretrievably deleted, but only
moved to the “unused color control strips” field. They then disappear from
the standard menu, but if needed can be re-enabled for use.5
Defining a color set
An appropriate color set must be defined for the ink series and stock quality
used. For information on the possibilities for determining reference values,
please read section 6.2 “Creating color sets”.
Tolerances
Display of deviations in the measurement overview menu
• Outlined bars for deviation within ΔE tolerances
• Solid bars for deviation outside the tolerances
The “tolerance” setting only affects how setting parameters are displayed onscreen. It does not influence the precision of any follow-up recommendation!
13
5 Typical make-ready for a new job
5.1 Procedure
Make-ready
• Set the stock format
• Assign colors to the printing units using the color symbols.
• After about 130 sheets, pull a sheet; make sure that the green indicator is
lit, indicating that the inking units have stabilized (see figure below).
• Set the measurement conditions, substrate class and tolerance
(narrow/medium/wide).
• Measure substrate (= paper white).
• Color assignment: from a suitable color set (see 6.2 “Creating color sets”)
in the color archive or from individual measurements using the function
“Sample”.
• Select a color control strip and position it.
When there is a connection to prepress via Prinect Prepress Interface and
data is supplied for positioning the color control strip on the sheets, the
measuring head is automatically pre-positioned.
• Check whether the graphical and numerical values are plausible. If not,
double-check the settings!
• Approve the follow-up recommendation.
• After two to three follow-ups the reference colors are achieved.
Production
• Regular pull, measure and follow-up sheets. Here too, make sure that the
green indicator is lit!
• If necessary, manually adjust reference values: OK sheet/zonal transfer/
change (%)/block zones (see 6.3: “Changing reference values”)
Adjustment being initiated
Adjustment being made
The green indicator and how to read it.
14
Adjustment completed –
inking stable again
This figure shows the screen “Measurement/adjustment recommendation”.
Shown here: Dio (from dF, zonal profile and
control algorithm)
In measurement: dF, i.e. colors relative to
reference values.
Here the function “Color Booster” can be
individual enabled and disabled for each
inking unit.
Schematic of the cycle “pull–measure–
follow-up”.
15
5.2 Changes during a job
If everything is done correctly as described in “basic rules for optimized
printing”, the colors will approach the reference values during printing
roughly as shown here:
Coloring
Target
Pull, measure and adjust
with Prinect Axis Control
Makeready
Presetting
Production
Measurement and Control
Sheets
Optimum make-ready with presettings.
The first step toward reaching the reference values is made with pre-inking,
the characteristic curve for presetting the inking, and ink presetting data.
The inking units are filled with ink beforehand and allowed to stabilize for
production.
IMPORTANT: Don’t pull sheets prematurely.
Make sure the green indicator on the Prinect CP2000 Center is lit!
With optimized presettings, the colors should be approx. ΔE 5 compared
to the reference levels.
It takes about three follow-ups to achieve a deviation smaller than ΔE = 2,
which should then remain stable for individual zones over the print run as a
whole. It should be taken into account, however, that the printing conditions
can change with longer runs.
Zones that are outside the printed image or contain a certain color only in the
color control strip should be blocked, as they are not relevant to the results of
printing.
16
If the first inspection sheet pulled exhibits color deviations larger than
ΔE 10 (despite using data from Prinect Prepress Interface or Plate Image
Reader and pre-inking), recheck the press settings. If there is a clear tendency
for over- or under-inking to occur, the characteristic curve for presetting the
inking and the pre-inking settings should be adjusted.
Particularly over-inking of the first sheet pulled is a critical sign. It may be
helpful to wash the press and restart the job with different presettings. Because the inking units act as reservoir, especially when running low coverage
they can be slow to adjust and quite a few waste sheets may have to be printed
before the lower inking level is reached.
If it is impossible to consistently reproduce the reference density, this may
be because the inking unit has not stabilized. Possible causes:
• Zones have previously been manually adjusted
• The rotational speed of the ink fountain roller or the use of oscillators has
been changed
• The press speed has been changed but the characteristic curve for speed
compensation is not appropriately defined
• The feed rate or composition of the dampening solution has changed
• Premature pull (see figure)
Color
Target
Sheets
Inspection sheet pulled before the inking
unit has stabilized. The result: inking is
overcompensated.
17
6 Reference values
6.1 Color sets
The reference values for color control are stored in color sets. Each color set
should at least contain values for:
• The paper white
• The process colors
• The grey balance patch
It can also contain Lab values for non-process colors.
It is absolutely essential to measure the actual stock used for each job.
This value can then be used to adjust the stored color values.
Prinect Axis Control comes with standard color sets designated
“Heidelberg”. These only represent average values for various ink series.
It is therefore important for you to define your own color sets for the inks
and paper classes used.
6.2 Creating color sets
• In Service/Archive/Color Archive you can copy an existing color set and
assign a meaningful name (e.g., name of the ink series used) to the copy.
• Select the stock quality (glossy/matt coated/uncoated).
• Use a sample (preferably a freshly printed sheet with the reference colors)
to measure and save first the paper whiteness value, then the solid
patches, and if relevant the grey balance patches as well.
It is absolutely essential to measure the paper white first!
6.3 Ways of entering reference values
1. Reference values from DIN ISO 12647
Lab reference values cannot be numerically keyed into Prinect Axis
Control. Reference values should be captured from a series of color reproductions. To comply with the stipulations of DIN ISO while printing, the
color closest to the value specified by the standard should be incorporated
into a color set. If necessary, it can then be adjusted by an appropriate
percentage.
Note: the permissible tolerance of ΔE = 5 is reduced by the color deviation
ΔE0 between the set reference value and the values stipulated by DIN ISO.
2. Color samples from color books
Color sample collections are available for non-process ink series. It is
possible to read in a sample and add the measured value to a color set.
18
Color samples can only be used if the substrate on which the book is printed
are the paper used for the pressrun are of the same type (glossy/matt coated/
uncoated) and if the book stock’s whiteness is also measured before.
It is advisable to print a specimen of a non-process color, visually assess it,
and then insert it into the color set. This lets you take account of batch-tobatch fluctuations and printable ink film thicknesses.
3. Measuring an OK sheet
For recurring jobs, it is possible to scan in color patches from the OK sheet
of the original job and store the results in a color set.
Please note that, for process-related reasons, measurements are always made in
unpolarized mode and are therefore different depending on whether the sheet is
moist or dry. Consequently, controlling the colors of freshly printed sheets based
on values read in from a dry OK sheet may yield results that deviate slightly from it.
6.4 Reference values from a print series
Reference values should always be determined from a series of prints. The aim is
to determine the value that yields the highest density in the solid patch without
dot gain causing the 70% tint patch to fill in. This permits high-contrast printing.
Procedure:
• Print sheets with inking levels ranging from too low to too high.
• Apply the Murray-Davies formula to calculate the maximum print
contrast from 100 % and 70 % patches on different sheets:
K=
DV – D70
DV
×100;
where K = relative print contrast as
a percentage value
DV = density of solid patch
D70 = density of 70 % tint patch
That color level is best at which the relative print contrast is the highest.
The reference value for the color separation can be taken from this sheet for
the color set.
Idealized representation of a print series.
In this example, the greatest print contrast
is achieved at a color level of approx. D=1.7.
19
Very important:
In color sets, a distinction is made between the paper classes of “glossy
coated”, “matt coated” and “uncoated”. The most important differences
between these types have to do with surface gloss (calculation of polarized
and unpolarized density) and ink absorption/acceptance when overprinting
different colors. In order to properly use a color set, these basic material
properties must be identical in the source and the paper actually being used
for the print run. Each color set is therefore limited in its application to the
same stock type for which it was defined. The differences between “glossy
coated” and “matt coated” are minimal, however.
The value for the paper white must always be included in the color set!
Printing inks are translucent, and the substrate consequently always affects
the color. Normally, color sets are measured from the printed sheet and
defined accordingly. The paper white will be compensated by calculation so
that the color set can also be used with other papers.
6.5 Changing reference values
Reference values contained in a color set can be changed if necessary. There
are various ways to do this:
1. Changing reference values during job preparation
Right when creating a job, the reference density value can be manually
changed to the desired value in steps of 0.01. The corresponding Lab
values are automatically adjusted accordingly.
2. From an OK sheet
If a sheet has been defined as OK based entirely on a visual assessment
(which often happens when getting a customer’s approval), it can be
defined as the new standard. After approval of an OK sheet, inking is then
no longer controlled based on the values stored in the color set but instead
using the OK sheet as the reference.
3. Zonal transfer
Zones on the press sheet in which the colors have been defined as OK can
be transferred to other zones. Especially when printing multiple “ups” or
image copies, this function is very useful. Please note, however, that an
average value derived from the selected source zones is transferred and
not the actual zone profile.
When working with a perfector press, in double-sided mode you can use
the function “transfer to other side”.
20
4. Changing by a percentage value
For measurement and color control, the color level can be adjusted by a
percentage. As soon as you confirm the changes, they are displayed as the
new deviation to the reference.
Density and Lab values never change independently of one another. Both are
based on the spectral distribution of the light reflected by a patch and
captured by the measuring head. The Lab and density values are calculated
from this spectrum.
If the thickness of the printed ink film changes, its reflectance also changes.
The resulting different spectrum causes the Lab and density values calculated
from it to change as well.
The possibilities for changing reference values should only be utilized when
absolutely necessary, however. Instead of making manual changes, it is better
to define the color set so that the desired print results are achieved entirely
by making measurements and to follow-up the calculated recommendations.
It is also important to ensure a standardized printing process with consistent
reference values. This nearly eliminates the need for manual changes.
If Prinect Axis Control indicates substantial color deviations although a
sheet looks fine, this can have the following causes:
• Wrong color set selected, so that the wrong reference values are being
applied
• Paper white not measured in an unprinted area of the sheet
• Incorrect measurement conditions or the wrong paper class defined
The view “Measurement/reference values”
with the buttons “OK sheet”, “zonal
transfer” and “change by percentage”.
21
7 Control methods
Prinect Axis Control offers a choice between solid control and grey balance
control for the chromatic colors CMY.
Solid control
Here control is based on the solid patches for each color separation. Black and
all non-process colors are always controlled using the solid patches.
Grey balance control
The grey balance patches are used to control the balance among the process
colors C, M and Y. These color separations are overprinted with area coverage
values of C = 70 %, M = 60 % and Y = 60 %.
Some color control strips, including the Prinect 6GS, are specifically
designed for grey balance control and only have solid patches for CMY in a
small number of zones.
Advantages of grey balance control:
• Minimal color fluctuations and changes are registered during the
production run.
• The color balance is critical for the visual appearance of a printed image.
The grey balance reveals even the tiniest changes in printing conditions,
inking or register.
22
8 Reporting and protocol functions
Prinect Axis Control Reporting
This software module permits detailed documentation of all follow-ups and
their specific data so they can be called up on a networked PC. The reporting
module must be additionally licensed and enabled.
Control history
Every time you follow-up the average values for density, dot gain, slurring/
doubling, ΔE, ΔE0 and ΔF are saved in the control history and are displayed
there.
23
9 Quality: the reason for color measurement
and color control
9.1 The goals of color measurement and color control
➔ To achieve specified reference values
➔ To faithfully reproduce originals
➔ To deliver demonstrably consistent print quality
• Colors are always controlled on the basis of changes in ink film thickness.
Two ways of accomplishing this are widely spread in the printing industry:
densitometry and colorimetry.
• Densitometry is optimized for chromatic colors in offset printing.
Colorimetry, by contrast, can be universally used for all processes, because
it simulates the perceptions of the human eye (see section 10.1: “Human
color perception”).
9.2 Spectral measurement and colorimetry
Spectral measurement is the basis for calculating color measurement figures,
whether these are density or colorimetric values. Prinect Axis Control also
displays density values, as well as parameters derived from them: dot gain and
slurring/doubling. Colorimetric values are used to control color by minimizing the colorimetric discrepancy ΔE between the actual print results and the
reference value. The goal is to achieve the best possible color match between
both. Colorimetric color control makes use of a color model that combines
the color appearance of the printed ink with its thickness on the sheet. This
process is computerized and automatic. The press operator is thus free to
concentrate completely on the results of control: the recommendations made
by Prinect Axis Control for adjusting the inking. The advantages of this
control strategy:
• Only colorimetric control ensures compliance with DIN ISO standards.
• The color balance can be controlled using the sensitive grey balance
patches.
• Control of special, non-process colors is significantly better than densitybased control.
• Spectral measurement can compensate for ink soiling, batch-to-batch
fluctuations in the ink, and changes in the substrate being printed on by
appropriately controlling to the ΔE0 value.
• Spectral measurement is the only way to generate ICC profiles. This
enables prepress to make plates that are tailored to the inks and stock
used.
• A ΔE value can be intuitively understood as a measure of color deviation
without possessing any specialist knowledge, because it corresponds to
normal human color perception. Density variations can influence the
appearance very differently depending on the color separation.
24
If you only had to deal with the production process itself, it would definitely
be possible to successfully apply different color control strategies, at least for
the process colors.
But when dealing with customers and struggling to ensure standardized
printing conditions, it is necessary to make objective statements about
quality. Lab color values and the deviation ΔE are the best way to make
generally valid quality assessments. Controlling the production run on the
basis of colorimetric values makes it possible to directly implement and
monitor the customer’s quality stipulations right at the press.
25
10 Color theory
10.1 Human color perception
The human eye perceives colors with three different types of receptors, socalled cones, each of which responds to light of different wavelength ranges.
When light enters the eye, the corresponding cones are stimulated and relay
nerve pulses to the brain. It is there that actual color perception results.
Spectral measurement devices simulate this process by spectrally measuring the light striking them and using the results to calculate the standard
color values XYZ. These can in turn be used to directly calculate Lab color
coordinates, among others.
Light
Human
Measurement device
ct
lr
ef
le
tra
Sp
n
io
ec
ct
Color perception
26
le
ef
lr
Excitation
tra
Lens with
receptor
Cones
Green
ec
Eye
Blue
Sp
io
n
Sample
Red
Standard spectral
function of
standard observer
Standard color values XYZ
Lab color coordinates
10.2 Spectral distribution of the visible light
Prinect Axis Control measures the spectral distribution of the light with a
resolution of 10 nm. These values – called reflectance values – are the basis for
all subsequent density and Lab value calculations. Measurement is performed
by bending the light through a lattice. Wave lengths between 380 and 730 nm
are captured.
Black
Cyan
Magenta
Yellow
Paper whiteness
Example reflectance curves of CMYK and
paper whiteness.
From spectrum to density value
Density values are defined by the reflectance of the light captured in the wave
length range of the filter used. The rest of the spectrum is ignored. There are
standard filters for the process colors Cyan, Magenta, Yellow and Black.
D = 1.70
Reflectance curve of a solid Magenta
patch, obtained with the corresponding
standard narrowband filter.
From spectrum to Lab value
The Lab values are calculated using the standard spectral value functions
defined by CIE. There are three such functions, corresponding to the three
types of color receptors in the human eye. As can be seen in the figure, the
entire visible spectrum is captured.
L = 47
a = 75
b = -6
Spectral pattern of a solid Magenta patch,
with standard spectral value functions.
27
10.3 Two control strategies: Density and Lab
Both D and Lab change depending on the ink film thickness. Because the ink
film thickness is the only controllable parameter in printing, it is obvious that
both values will always change at the same time. For example, when ink zones
are opened further this increases the ink film thickness. This affects the
remitted spectrum and thus both, the density and the Lab value.
Paper white
Magenta at
different ink
film thickness
Change in reflectance as the ink film thickness varies in the solid Magenta patch.
Density:
Within the range that is relevant for offset printing (ink film thicknesses of
around 1 μm) the density of the standard processes colors changes almost
linearly in relation to the ink film thickness. Changes in the film thickness
can thus be directly expressed as differences in density.
For example, increasing the ink film thickness by 10 % normally also
increases the density by approximately 10 %.
However, even if the reference density is precisely achieved this does not
mean that the color will have the desired appearance. This is only the case in
absolutely stable, standardized processes, which hardly ever occur in actual
practice.
Lab:
In the Lab color space there is also a virtually linear relationship between
color coordinates and ink film thickness. However, the three-dimensional
nature of this color space makes it considerably more difficult to depict
changes in ink film thickness. The ΔE value is therefore used as an easily
visualized way of representing changes in the color coordinates and thus
also the ink film thickness.
The goal of colorimetric control is to approach the reference value as
closely as possible. The remaining color deviation, which cannot be eliminated with the printing process as it stands, is indicated by ΔE0.
28
10.4 What does “ΔE0” mean?
For every combination of ink and paper, the curve of printable colors can
be determined within the Lab color space by measuring prints with different
ink film thicknesses and patches with different halftone values.
Colors that are not located on this curve cannot be achieved with that
particular combination of ink and paper. The distance from the best
achievable point on the curve is defined as ΔE0.
ΔE describes the discrepancy between the measured color value and the
achievable color value, the best match.
• When the best possible result has been achieved with the ink used, ΔE is
equal to zero.
• When the achievable color falls short of the desired color, the distance
between them is indicated by the value ΔE0. This color deviation cannot be
reduced by control. The only way to reduce ΔE0 is to change the printing
process, for example by using a different ink.
• Consequently, ΔE and ΔE0 are not interdependent values.
a
Actual
ΔE
Target
ΔE0
Color curve
Starting at the actual color, the color curve
passes through the colors that are achievable by varying the ink film thickness.
Reference
-b
Possible reasons for a large ΔE0 value:
• Soiled ink
• Wrong reference value assigned
• Incorrect settings for measurement conditions and paper class
• Paper white incorrectly measured
• Paper white has changed during the run
• Different ink used
• Ink batch is non-standard
10.5 Lab values of actual printing inks
The following values are provided only by way of example; the Lab values will
be different depending on the ink series, the ink film thickness and the paper.
The “process standard for offset printing” according to DIN ISO 126476 can
provide an orientation:
Paper type
Coated
(Paper classes 1 and 2)
Uncoated
(Paper class 4)
L
a
b
L
a
b
Black:
16
0
0
31
1
1
Cyan:
54
-36
-49
58
-25
-43
Magenta:
46
72
-5
54
58
-2
Yellow:
88
-6
90
86
-4
75
Red (M+Y):
47
66
50
52
55
30
Green (C+Y):
49
-66
33
52
-46
16
Blue (C+M):
20
25
-48
36
12
-32
6 Measurement as per DIN ISO 13655: light
type D50, 2° observer, geometry 0/45 or
45/0, measured on a black base.
29
11 Types of measurement devices
Measurement parameters for the printing industry:
• Measurement geometry: 45°/0° or 0°/45° (angle at which light strikes first
the sample and then the measuring head)
• (Light type) Illuminant: D50 (modeled after natural daylight, slightly
reddish)
• Observer: 2° standard observer
11.1 Spectral color measurement
Spectral measurement is performed by bending the light through a lattice.
Prinect Axis Control captures light in the wavelength range from 380 to
730 nm with a resolution of 10 nm.
Procedure:
• Calibration to absolute white and adjustment according the standard
paper white
• Measurement of the sample
• Calculation of the spectral reflectance values
The values obtained are placed in relation to the corresponding values of
the paper white for each wavelength range (within the limits of the
achievable resolution of 380nm – 730nm). This yields a spectral distribution that is independent of the actual light source used!
• Calculation of the Lab value
A series of calculations is performed on the obtained spectrum to
determine the Lab value.
• Calculation of the density
Density filters stored in the device are applied to the spectrum to obtain
the density values.
11.2 Density measurement
Densitometry is “color blind”. It uses various standardized filters to derive
reflection values. The density is calculated by applying the formula D = - log β
(degree of reflectance β – the ratio of reflected light to incident light).
Procedure:
• Calibration to paper white
• Setting to polarized or unpolarized mode
– Polarized: surface reflections are filtered out
➔ Same values are obtained for wet and dry sheets
– Unpolarized: surface reflections are also measured
➔ Lower density value than in polarized mode
➔ Different measurement results for wet and dry sheets
• Measurement of the sample
30
Density measurement of the process colors CMYK: using appropriate
standardized filters
• There are standardized narrow band filters, broad band filters, etc.
Different filter types yield different results!
• The filters allow light to pass in the wave length range in which the color
separation being measured remits very little light, in other words in the
absorption range. It is here that the ink film thickness affects reflectance
most strongly.
➔ Cyan: “red filter”
➔ Magenta: “green filter”
➔ Yellow: “blue filter”
Density measurement of non-process colors
That filter is used that yields the highest density value.
This causes the following problems:
• “Bright” colors have high reflectance; the density value obtained is
therefore corresponding low and cannot be used very well for color
control purposes, because changes in the ink film thickness result in only
negligible changes in density.
• Two completely different colors can yield exactly the same density value,
despite being obviously different in appearance (see figure below).
31
D = 1.60
L = 60.2
a = 56.8
b = 62.9
D = 1.60
Two completely different colors;
the deviation between them is
ΔE=114.3. The same density value
is obtained for both, however.
L = 59.4
a = -56.7
b = 49.3
11.3 Comparability of results obtained with different measurement systems
Requirement: identical measurement conditions
• Illuminant
• Standard observer
• Measurement geometry
• Calibration to paper white/absolute white
• Same background/base (preferably black base) behind sheet during
measurement
• Same time elapsed between pulling and measuring a sheet (especially
when comparing Lab values, since these cannot be measured with
polarizing filters)
• With densitometers: setting to polarized/unpolarized
Measurement parameters for the printing industry:
• Measurement geometry: 45°/0° (or 0°/45°) (angle of light striking
measuring head)
• Light type: D50 (modeled after natural daylight)
• Observer: 2° standard observer
32
Requirement: correct functioning
• Clean lenses
• Regular calibration. An appropriate calibration card is included.
• When calibrating to the absolute white: regularly clean the tile used
For density comparisons with Prinect Axis Control please note:
the polarized density values are calculated, not measured – Prinect Axis
Control is not equipped with a physical polarization filter! Because measurements are always made without a polarization filter, how wet or dry a sheet is
invariably affects the results of measurement – both when the system is set to
“unpolarized” and when “polarized” values are calculated. As a sheet dries
the colorimetric values obtained can slightly change. The amount of time that
elapses between pulling and measuring a sheet it must therefore be kept
consistent to ensure comparable results.
33
34
35
36
37
38
Heidelberger Druckmaschinen AG
Kurfuersten-Anlage 52–60
69115 Heidelberg
Germany
Phone +49 6221 92-00
Fax +49 6221 92-6999
www.heidelberg.com
Trademarks
Heidelberg, the Heidelberg logotype, Prinect, the Prinect logotype,
Axis Control, CP2000 Center and Speedmaster are registered
trademarks of Heidelberger Druckmaschinen AG in the U.S.
and other countries. Mini Spot is a trademark of Heidelberger
Druckmaschinen AG in Germany and other countries. PANTONE
is a registered trademark of Pantone, Inc. All other trademarks are
property of their respective owners.
Subject to technical modifications and other changes.
00.000.0000
Publishing Information
Printed in: 07/07
Photographs: Heidelberger Druckmaschinen AG
Fonts: HeidelbergGothicMl
Printed in Germany