1
52
vFoglight
Getting Started Guide
Before You Get Started
The section below provides getting started tips on common elements in the browser
interface and features that can affect how you see data in the monitoring dashboards.
Working in a Current or a Diagnostic Time Range
This getting started tip helps you understand whether you are working in a real time
range or a diagnostic time range and how to switch from one to the other.
Note
Some pages do not take a time range input and so do not display a time range.
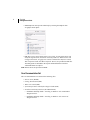
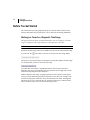
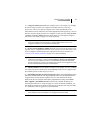
By default, the time range at the top of a dashboard is in real time. When the time range
is in real time, the
icon and the word Now are shown in the time range display.
Figure 1
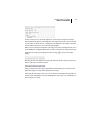
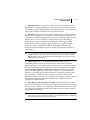
Hovering over the real time range icon displays a message that identifies the time range
as real and informs you how to freeze the time range.
Figure 2
If you drill down on an alarm, vFoglight disconnects from real time and enters a
diagnostic time range. The diagnostic time range spans the same length of time as the
current time range did prior to the drill down.
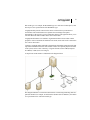
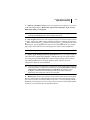
Within a diagnostic time range, vFoglight typically sets three-quarters of this span to
occur prior to the alarm being fired and one-quarter to occur after. For example, if the
current time range spans four hours, when you drill down on an alarm, the diagnostic
time range also covers a four-hour interval, from three hours prior to when the alarm
fired to one hour after it fired (as shown in the image below).