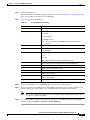
Download Panasonic WV-CW974 Security Camera User Manual

Transcript
Cisco Network Analysis Module
(NAM) Traffic Analyzer User Guide, 5.0
January 2011
Americas Headquarters
Cisco Systems, Inc.
170 West Tasman Drive
San Jose, CA 95134-1706
USA
http://www.cisco.com
Tel: 408 526-4000
800 553-NETS (6387)
Fax: 408 527-0883
Text Part Number: OL-22617-01
THE SPECIFICATIONS AND INFORMATION REGARDING THE PRODUCTS IN THIS MANUAL ARE SUBJECT TO CHANGE WITHOUT NOTICE. ALL
STATEMENTS, INFORMATION, AND RECOMMENDATIONS IN THIS MANUAL ARE BELIEVED TO BE ACCURATE BUT ARE PRESENTED WITHOUT
WARRANTY OF ANY KIND, EXPRESS OR IMPLIED. USERS MUST TAKE FULL RESPONSIBILITY FOR THEIR APPLICATION OF ANY PRODUCTS.
THE SOFTWARE LICENSE AND LIMITED WARRANTY FOR THE ACCOMPANYING PRODUCT ARE SET FORTH IN THE INFORMATION PACKET THAT
SHIPPED WITH THE PRODUCT AND ARE INCORPORATED HEREIN BY THIS REFERENCE. IF YOU ARE UNABLE TO LOCATE THE SOFTWARE LICENSE
OR LIMITED WARRANTY, CONTACT YOUR CISCO REPRESENTATIVE FOR A COPY.
The Cisco implementation of TCP header compression is an adaptation of a program developed by the University of California, Berkeley (UCB) as part of UCB’s public
domain version of the UNIX operating system. All rights reserved. Copyright © 1981, Regents of the University of California.
NOTWITHSTANDING ANY OTHER WARRANTY HEREIN, ALL DOCUMENT FILES AND SOFTWARE OF THESE SUPPLIERS ARE PROVIDED “AS IS” WITH
ALL FAULTS. CISCO AND THE ABOVE-NAMED SUPPLIERS DISCLAIM ALL WARRANTIES, EXPRESSED OR IMPLIED, INCLUDING, WITHOUT
LIMITATION, THOSE OF MERCHANTABILITY, FITNESS FOR A PARTICULAR PURPOSE AND NONINFRINGEMENT OR ARISING FROM A COURSE OF
DEALING, USAGE, OR TRADE PRACTICE.
IN NO EVENT SHALL CISCO OR ITS SUPPLIERS BE LIABLE FOR ANY INDIRECT, SPECIAL, CONSEQUENTIAL, OR INCIDENTAL DAMAGES, INCLUDING,
WITHOUT LIMITATION, LOST PROFITS OR LOSS OR DAMAGE TO DATA ARISING OUT OF THE USE OR INABILITY TO USE THIS MANUAL, EVEN IF CISCO
OR ITS SUPPLIERS HAVE BEEN ADVISED OF THE POSSIBILITY OF SUCH DAMAGES.
Cisco and the Cisco Logo are trademarks of Cisco Systems, Inc. and/or its affiliates in the U.S. and other countries. A listing of Cisco's trademarks can be found at
www.cisco.com/go/trademarks. Third party trademarks mentioned are the property of their respective owners. The use of the word partner does not imply a partnership
relationship between Cisco and any other company. (1005R)
Any Internet Protocol (IP) addresses and phone numbers used in this document are not intended to be actual addresses and phone numbers. Any examples, command display
output, network topology diagrams, and other figures included in the document are shown for illustrative purposes only. Any use of actual IP addresses or phone numbers in
illustrative content is unintentional and coincidental.
Cisco Network Analysis Module (NAM) Traffic Analyzer User Guide, 5.0
© 2011 Cisco Systems, Inc. All rights reserved.
CONTENTS
About This Guide
CHAPTER
1
Overview
xi
1-1
Introducing NAM Traffic Analyzer 5.0 1-1
Dashboards 1-2
Logical Site 1-2
New Application Classification Architecture 1-3
Standards-Based NBI 1-3
NetFlow v9 Data Export 1-4
Historical Analysis 1-4
SNMP v3 Support -- NAM to Router/Switch Support
Overview of the NAM Platforms
Logging In
1-5
1-5
1-6
Navigating the User Interface 1-6
Common Navigation and Control Elements
Menu Bar 1-6
Detailed Views 1-7
Context Menus 1-8
Quick Capture 1-8
Interactive Report 1-9
Chart View / Grid View 1-9
Mouse-Over for Details 1-10
Zoom/Pan Charts 1-10
Sort Grid 1-11
Bytes / Packets 1-11
Statistics 1-11
Context-Sensitive Online Help 1-12
1-6
Understanding How the NAM Works 1-12
Understanding How the NAM Uses SPAN 1-14
Understanding How the NAM Uses VACLs 1-14
Understanding How the NAM Uses NDE 1-15
Understanding How the NAM Uses WAAS 1-16
Configuration Overview 1-17
Configuring and Viewing Data
1-19
User Guide for the Cisco Network Analysis Module (NAM) Traffic Analyzer, 5.0
OL-22617-01
iii
Contents
Cisco WAAS NAM Virtual Service Blade
CHAPTER
2
Setting Up The NAM Traffic Analyzer
1-20
2-1
Default Functions 2-1
Traffic Analysis 2-1
Application Response Time Metrics 2-2
Voice Signaling/RTP Stream Monitoring 2-2
Traffic Usage Statistics 2-3
Traffic 2-3
SPAN 2-3
About SPAN Sessions 2-3
Creating a SPAN Session 2-6
Editing a SPAN Session 2-8
Deleting a SPAN Session 2-9
Data Sources 2-9
SPAN 2-10
ERSPAN 2-10
VACL 2-17
NetFlow 2-18
WAAS 2-29
Understanding WAAS 2-29
Response Time Monitoring from WAAS Data Sources
Managing WAAS Devices 2-32
Adding Data Sources for New WAAS Device 2-33
Editing WAAS Data Sources 2-34
Deleting a WAAS Data Source 2-34
Auto Create of New WAAS Devices 2-35
Hardware Deduplication 2-35
2-30
Alarms 2-36
Alarm Actions 2-36
Alarm Action Configuration 2-37
Editing Alarm Actions 2-38
Deleting Alarm Actions 2-38
Thresholds 2-39
Setting Host Thresholds 2-40
Setting Conversation Thresholds 2-41
Setting Application Thresholds 2-42
Setting Response Time Thresholds 2-43
Setting DSCP Thresholds 2-44
User Guide for the Cisco Network Analysis Module (NAM) Traffic Analyzer, 5.0
iv
OL-22617-01
Contents
Setting RTP Stream Thresholds 2-45
Setting Voice Signaling Thresholds 2-46
Setting NDE Interface Thresholds 2-47
Editing an Alarm Threshold 2-48
Deleting a NAM Threshold 2-48
User Scenario 2-49
Data Export 2-49
NetFlow 2-49
Viewing Configured NetFlow Exports 2-50
Configuring NetFlow Data Export 2-51
Editing NetFlow Data Export 2-53
Scheduled Exports 2-53
Editing a Scheduled Export 2-54
Deleting a Scheduled Export 2-54
Custom Export 2-55
Managed Device 2-55
Device Information 2-55
NBAR Protocol Discovery 2-57
Network 2-58
Sites 2-58
Definition Rules 2-59
Viewing Defined Sites 2-60
Defining a Site 2-61
Editing a Site 2-63
NDE Interface Capacity 2-63
Creating an NDE Interface 2-63
DSCP Groups 2-64
Creating a DSCP Group 2-64
Editing a DSCP Group 2-66
Deleting a DSCP Group 2-66
Classification 2-66
Applications 2-67
Creating a New Application 2-68
Editing an Application 2-69
Deleting a Protocol 2-70
Application Groups 2-70
Creating an Application Group 2-70
Editing an Application Group 2-70
Deleting an Application Group 2-70
User Guide for the Cisco Network Analysis Module (NAM) Traffic Analyzer, 5.0
OL-22617-01
v
Contents
URL-based Applications 2-71
Example 2-72
Editing a URL-Based Application 2-73
Deleting a URL-based Application 2-73
Encapsulations 2-73
Monitoring 2-74
Aggregation Intervals 2-74
Response Time 2-76
Voice 2-76
RTP Filter 2-78
URL 2-78
Enabling a URL Collection 2-78
Changing a URL Collection 2-80
Disabling a URL Collection 2-80
WAAS Monitored Servers 2-80
Adding a WAAS Monitored Server 2-81
Deleting a WAAS Monitored Server 2-81
CHAPTER
3
Monitoring and Analysis
3-1
Navigation 3-2
Context Menus 3-2
Interactive Report 3-2
Saving Filter Parameters
Traffic Summary
3-4
Response Time Summary
Site Summary
Alarm Summary
3-3
3-5
3-6
3-6
Analyzing Traffic 3-8
Application 3-9
Hosts Detail 3-9
Host 3-10
Applications Detail 3-10
NDE Interface Traffic Analysis 3-11
Viewing Interface Details 3-12
DSCP Detail 3-12
DSCP 3-12
Application Groups Detail 3-13
URL Hits 3-14
Viewing Collected URLs 3-14
User Guide for the Cisco Network Analysis Module (NAM) Traffic Analyzer, 5.0
vi
OL-22617-01
Contents
Filtering a URL Collection List
Host Conversations 3-15
Network Conversation 3-15
Top Application Traffic 3-15
Application Traffic By Host 3-17
3-14
WAN Optimization 3-17
Top Talkers Detail 3-17
Application Performance Analysis 3-18
Transaction Time (Client Experience) 3-18
Traffic Volume and Compression Ratio 3-18
Average Concurrent Connections (Optimized vs. Passthru) 3-18
Multi-Segment Network Time (Client LAN - WAN - Server LAN) 3-18
Conversation Multi-Segments 3-18
Response Time 3-19
Application Response Time 3-22
Network Response Time 3-22
Server Response Time 3-23
Client Response Time 3-23
Client-Server Response Time 3-23
Server Application Responses 3-23
Server Application Transactions 3-24
Server Network Responses 3-25
Client-Server Application Responses 3-26
Client-Server Application Transactions 3-27
Client-Server Network Responses 3-28
Managed Device 3-29
Interface 3-30
Interfaces Stats Table 3-30
Interface Statistics Over Time
Health 3-31
Switch Health 3-31
Router Health 3-35
NBAR 3-37
Media 3-37
RTP Streams 3-38
Purpose 3-38
Monitoring RTP Streams
Voice Call Statistics 3-39
Calls Table 3-40
3-31
3-39
User Guide for the Cisco Network Analysis Module (NAM) Traffic Analyzer, 5.0
OL-22617-01
vii
Contents
RTP Conversation
CHAPTER
4
3-42
Capturing and Decoding Packet Data
4-1
Sessions 4-2
Viewing Capture Sessions 4-3
Configuring Capture Sessions 4-4
Software Filters 4-7
Creating a Software Filter 4-8
Editing a Software Capture Filter 4-11
Hardware Assisted Filters 4-12
Configuring a Hardware Filter 4-12
Files 4-15
Analyzing Capture Files 4-17
Error Scan 4-17
Downloading Capture Files 4-18
Deleting a Capture File 4-19
Deleting Multiple Files 4-19
Viewing Packet Decode Information 4-20
Browsing Packets in the Packet Decoder 4-21
Filtering Packets Displayed in the Packet Decoder 4-21
Viewing Detailed Protocol Decode Information 4-22
Using Alarm-Triggered Captures 4-23
Custom Display Filters 4-23
Creating Custom Display Filters 4-23
Editing Custom Display Filters 4-26
Deleting Custom Display Filters 4-27
CHAPTER
5
User and System Administration
5-1
System Administration 5-1
Resources 5-2
Network Parameters 5-2
SNMP Agent 5-3
Working with NAM Community Strings 5-4
System Time 5-5
Synchronizing the NAM System Time with the Switch or Router
Synchronizing the NAM System Time Locally 5-6
Configuring the NAM System Time with an NTP Server 5-7
E-Mail Setting 5-7
Web Data Publication 5-8
5-6
User Guide for the Cisco Network Analysis Module (NAM) Traffic Analyzer, 5.0
viii
OL-22617-01
Contents
Capture Data Storage 5-8
Creating NFS Storage Locations 5-9
Editing NFS Storage Locations 5-10
Creating iSCSI Storage Locations 5-11
Editing iSCSI Storage Locations 5-11
Syslog Setting 5-12
SNMP Trap Setting 5-12
Creating a NAM Trap Destination 5-12
Editing a NAM Trap Destination 5-13
Deleting a NAM Trap Destination 5-13
Preferences 5-13
Diagnostics 5-14
System Alerts 5-14
Audit Trail 5-14
Tech Support 5-15
User Administration 5-16
Local Database 5-16
Recovering Passwords 5-16
Changing Predefined NAM User Accounts on the Switch or Router 5-17
Creating a New User 5-17
Editing a User 5-18
Deleting a User 5-18
Establishing TACACS+ Authentication and Authorization 5-19
Configuring a TACACS+ Server to Support NAM Authentication and Authorization
Configuring a Cisco ACS TACACS+ Server 5-20
Current User Sessions 5-22
CHAPTER
6
NAM Traffic Analyzer 5.0 Usage Scenarios
6-1
Deployment 6-2
Deploying NAMs in the Branch 6-2
Deploying NAMs for Voice/Video applications 6-2
Deploying NAMs for WAN Optimization 6-2
Deploying Multi-NAM Consolidation 6-2
Autodiscovery Capabilities of NAM 6-3
Creating Custom Applications 6-3
Utilizing Sites to Create a Geographically Familiar Deployment
Integrating NAM with Third Party Reporting Tools 6-3
Integrating NAM with LMS 6-4
Monitoring
5-20
6-3
6-4
User Guide for the Cisco Network Analysis Module (NAM) Traffic Analyzer, 5.0
OL-22617-01
ix
Contents
Understanding Traffic Patterns at the Network Layer 6-4
Understanding Traffic patterns for DiffServ-Enabled Networks 6-4
Using NAM to Evaluate Application-Level Performance Monitoring for TCP-Interactive
Applications 6-4
Using NAM to Evaluate Application-Level Performance Monitoring for UDP Realtime
Applications 6-5
Using NAM to Evaluate Potential Impact of WAN Optimization Prior to Deployment 6-5
Troubleshooting 6-5
Using NAM for Problem Isolation 6-5
Using NAM for SmartGrid Visibility 6-6
APPENDIX
A
Troubleshooting
A-1
General NAM Issues
Error Messages
Packet Drops
A-2
A-2
NAM Not Responding
NAM Behavior
B
Supported MIB Objects
Supported MIBs
A-2
A-3
WAAS Troubleshooting
APPENDIX
A-1
A-3
B-1
B-1
User Guide for the Cisco Network Analysis Module (NAM) Traffic Analyzer, 5.0
x
OL-22617-01
About This Guide
This guide describes how to use Cisco Network Analysis Module Traffic Analyzer 5.0 (NAM 5.0)
software. This preface has the following sections:
•
Chapter Overview, page xi
•
Audience, page xii
•
Conventions, page xii
•
Notices, page xii
•
Obtaining Documentation and Submitting a Service Request, page xiii
For a list of the platforms that Cisco NAM 5.0 supports, see Overview of the NAM Platforms, page 1-5.
Chapter Overview
This guide contains the following chapters:
•
Chapter 1, “Overview” provides an overview of the NAM Traffic Analyzer, discusses new features
in this release, describes the new GUI, and provides information about how to use various
components of the NAM Traffic Analyzer.
•
Chapter 2, “Setting Up The NAM Traffic Analyzer,” provides information about the first steps users
should take after booting up the NAM and setting up the NAM Traffic Analyzer applications.
•
Chapter 3, “Monitoring and Analysis” provides information about options for viewing and
monitoring various types data.
•
Chapter 4, “Capturing and Decoding Packet Data” provides information about setting up multiple
sessions for capturing, filtering, and decoding packet data, managing the data in a file control
system, and displaying the contents of the packets.
•
Chapter 5, “User and System Administration” provides information about performing user and
system administration tasks and generating diagnostic information for obtaining technical
assistance.
•
Chapter 6, “NAM Traffic Analyzer 5.0 Usage Scenarios” provides scenarios for NAM deployment
and the details you may need to know about them.
User Guide for the Cisco Network Analysis Module (NAM) Traffic Analyzer, 5.0
OL-22617-01
xi
About This Guide
Audience
This guide is designed for network administrators who are responsible for setting up and configuring
Network Analysis Modules (NAMs) to monitor traffic and diagnose emerging problems on network
segments. As a network administrator, you should be familiar with:
•
Basic concepts and terminology used in internetworking.
•
Network topology and protocols.
•
Basic UNIX commands or basic Windows operations.
Conventions
This document uses the following conventions:
Note
Caution
Item
Convention
Commands and keywords
boldface font
Variables for which you supply values
italic font
Displayed session and system information
screen
Information you enter
boldface screen font
Variables you enter
italic screen
Menu items and button names
boldface font
Selecting a menu item in paragraphs
Option > Network Preferences
Selecting a menu item in tables
Option > Network Preferences
font
font
Means reader take note. Notes contain helpful suggestions or references to material not covered in the
publication.
Means reader be careful. In this situation, you might do something that could result in equipment
damage or loss of data.
Notices
The Third Party and Open Source Copyright Notices for the Cisco Network Analysis Module, Release
5.0 contains the licenses and notices for open source software used in NAM Traffic Analyzer 5.0. NAM
5.0 includes software developed by the OpenSSL Project for use in the OpenSSL Toolkit
(http://www.openssl.org/). This document is available on www.cisco.com with the NAM Traffic
Analyzer technical documentation.
User Guide for the Cisco Network Analysis Module (NAM) Traffic Analyzer, 5.0
xii
OL-22617-01
About This Guide
Obtaining Documentation and Submitting a Service Request
For information on obtaining documentation, submitting a service request, and gathering additional
information, see the monthly What’s New in Cisco Product Documentation, which also lists all new and
revised Cisco technical documentation, at:
http://www.cisco.com/en/US/docs/general/whatsnew/whatsnew.html
Subscribe to the What’s New in Cisco Product Documentation as a Really Simple Syndication (RSS) feed
and set content to be delivered directly to your desktop using a reader application. The RSS feeds are a free
service and Cisco currently supports RSS Version 2.0.
User Guide for the Cisco Network Analysis Module (NAM) Traffic Analyzer, 5.0
OL-22617-01
xiii
About This Guide
User Guide for the Cisco Network Analysis Module (NAM) Traffic Analyzer, 5.0
xiv
OL-22617-01
CH A P T E R
1
Overview
This chapter provides information about the Cisco Network Analysis Module Traffic Analyzer,
Release 5.0 and describes the new features and how to navigate the interface.
This chapter contains the following sections:
•
Introducing NAM Traffic Analyzer 5.0, page 1-1
– Dashboards, page 1-2
– Logical Site, page 1-2
– New Application Classification Architecture, page 1-3
– Standards-Based NBI, page 1-3
– NetFlow v9 Data Export, page 1-4
– Historical Analysis, page 1-4
– SNMP v3 Support -- NAM to Router/Switch Support, page 1-5
•
Overview of the NAM Platforms, page 1-5
•
Logging In, page 1-6
•
Navigating the User Interface, page 1-6
•
Understanding How the NAM Works, page 1-12
– Understanding How the NAM Uses SPAN, page 1-14
– Understanding How the NAM Uses VACLs, page 1-14
– Understanding How the NAM Uses NDE, page 1-15
– Understanding How the NAM Uses WAAS, page 1-16
•
Configuration Overview, page 1-17
Introducing NAM Traffic Analyzer 5.0
The Cisco Network Analysis Module (NAM) Traffic Analyzer software enables network managers to
understand, manage, and improve how applications and services are delivered to end users.
The NAM combines flow-based and packet-based analysis into one solution. The NAM can be used for
traffic analysis of applications, hosts, and conversations, performance-based measurements on
application, server, and network latency, quality of experience metrics for network-based services such
as Voice over IP (VoIP) and video, and problem analysis using deep, insightful packet captures. The
User Guide for the Cisco Network Analysis Module (NAM) Traffic Analyzer, 5.0
OL-22617-01
1-1
Chapter 1
Overview
Introducing NAM Traffic Analyzer 5.0
Cisco NAM includes an embedded, web-based Traffic Analyzer GUI that provides quick access to the
configuration menus and presents easy-to-read performance monitoring and analysis on web, voice, and
video traffic.
Dashboards
The Cisco NAM Traffic Analyzer, Release 5.0 introduces a redesigned interface and user experience,
with more intuitive workflows and interactive reporting capabilities. The dashboard-style layouts show
multiple charts in one window, thereby giving you the ability to view a lot of information at once.
There are two types of dashboards in NAM 5.0: One type is the “summary” views found under the
Monitor menu, and the other type is the “over time” views found under the Analyze menu. The Monitor
dashboards allow you to view network traffic, application performance, site performance, and alarms at
a glance. From there, you can isolate one area, for example an application with response time issues, and
then drill-down to the Analyze dashboard for further investigation.
Figure 1-1 shows an example of one of the Monitoring dashboards in the NAM 5.0 release.
Figure 1-1
Dashboard in NAM 5.0
The Analyze dashboards allow you to zoom or pan to reselect the range. As you change the range, the
related graphs at the bottom will update.
The dashboards can be extracted as a PNG. You can also create a Scheduled Export to have the
dashboards extracted regularly and sent to you in CSV or HTML format (see Scheduled Exports,
page 2-53).
Logical Site
Cisco NAM Traffic Analyzer 5.0 introduces the capability for users to define a site, with which you can
aggregate and organize performance statistics. A site is a collection of hosts (network endpoints)
partitioned into views that help you monitor traffic and troubleshoot problems. A site can be defined as
User Guide for the Cisco Network Analysis Module (NAM) Traffic Analyzer, 5.0
1-2
OL-22617-01
Chapter 1
Overview
Introducing NAM Traffic Analyzer 5.0
a set of subnets specified by an address prefix and mask, or using other criteria such as a remote device
data source (for example, remote WAE device and segment information). If you want to limit the view
of your network analysis data to a specific city, a specific building, or even a specific floor of a building,
you can use the sites function.
You can also include multiple types of data sources in the site definition, and you can then get an
aggregated view of all network traffic.
The pre-defined “Unassigned Site” makes it easy to bring up a NAM without having to configure
user-defined sites. Hosts that do not belong to any user-defined site will automatically belong to the
Unassigned Site.
Figure 1-2 shows an example of how a network may be configured using sites.
Figure 1-2
Site Level Aggregation
San Jose
Campus
San Jose
NAM
Site San
Jose
Site New
York
New York
Netflow
NYC
Building 1
FX
NYC
Building 2
197645
Datacenter
San Jose
For information about defining and editing a site, see Sites, page 2-58.
New Application Classification Architecture
In previous releases of NAM, the RMON-2 protocol directory infrastructure was used to identify
applications and network protocols. In NAM Traffic Analyzer Release 5.0, the application classification
scheme is changed to align with the methodology used by Cisco with technologies such as NBAR
(Network-Based Application Recognition) and SCL. It also accepts standardized application identifiers
exported by Cisco platforms with NDE (NetFlow Data Export).
This allows you to gain application visibility with consistent and unique application identifiers across
the network. For example, you can view applications using a global unique identifier, as compared with
multiple classification engines using different applications identifiers.
For information about set up, see Classification, page 2-66.
Standards-Based NBI
NBI (Northbound Interface), also referred to as API (Application Programming Interface) enables
partners and customers to provision the NAM and extract performance data. Previous releases of NAM
were limited to SNMP s, and direct-URL knowledge for access to some data, including the method by
which CSV-formatted data is retrieved.
User Guide for the Cisco Network Analysis Module (NAM) Traffic Analyzer, 5.0
OL-22617-01
1-3
Chapter 1
Overview
Introducing NAM Traffic Analyzer 5.0
With NAM 5.0, the NBI is expanded to include a Representational State Transfer (REST) web service
for configuration, and retrieval of data pertaining to sites. Also introduced is the capability to export
high-volume performance data in the form of Netflow v9 (see the next section, “NetFlow v9 Data
Export”).
Note
REST does not support retrieval of performance data for sites.
REST is a set of guidelines for doing web services over HTTP. It takes advantage of the HTTP method
(GET, POST, UPDATE, DELETE) as part of the request.
The REST request/response messages using the REST web service will contain XML data in the body
content of the HTTP request. An XML schema will describe the message content format. All REST
request/response messages are handled in XML format. Then the REST web service consumer can use
any HTTP client to communitate with the REST server. To use the REST web service via HTTPS, the
NAM crypto patch needs to be installed on the NAM.
The NBI web service will provide an external API interface for provisioning and retrieving performance
data. For application developers who want to use the NAM APIs to provision network services and
leverage data, see the Cisco Network Analysis Module 5.0 API Programmer’s Guide. The developers
who use the APIs should have an understanding of a high-level programming language such as Java or
an equivalent.
NetFlow v9 Data Export
The NAM uses NetFlow as a format for the ongoing streaming of aggregated data, based on the
configured set of descriptors or queries of the data attributes in NAM. The NAM as a producer of NDE
(NetFlow Data Export) packets is a new feature for NAM Traffic Analyzer 5.0. The NAM's new
functionality of NDE is part of its new NBI.
NetFlow collects traffic statistics by monitoring packets that flow through the device and storing the
statistics in the NetFlow table. NDE converts the NetFlow table statistics into records, and exports the
records to an external device, which is called a NetFlow collector.
The NDE Descriptor is a permanent definition of the NAM aggregated data query of aggregated NAM
data, which must be exported to designated destinations across the network using the industry-wide
standard of NetFlow v9 instead of the standard UDP transport.
The NDE Descriptor defines the data query that remains in effect as long as the NDE descriptor exists
in NAM’s permanent storage. Having it instantiated means that the NAM will be exporting the matching
aggregated data records continuously (in a specified frequency) until the NDE descriptor is deleted or
updated.
For information about set up, see Data Export, NetFlow, page 2-49.
Historical Analysis
Unlike previous versions of the NAM, in which you have to configure targeted historical reports in
advance, the NAM Traffic Analyzer 5.0 stores short-term and long-term data that you can view using the
new dashboards.
The NAM proactively collects and stores up to 72 hours of data at a granularity of 1, 5, or 10 minute
intervals, and longer-term data with a granularity of 1 to 2 hours, This allows you to specify different
time periods to view trends over time and identify potential problems.
User Guide for the Cisco Network Analysis Module (NAM) Traffic Analyzer, 5.0
1-4
OL-22617-01
Chapter 1
Overview
Overview of the NAM Platforms
SNMP v3 Support -- NAM to Router/Switch Support
Simple Network Management Protocol Version 3 (SNMPv3) is an interoperable standards-based
protocol for network management. The security features provided in SNMPv3 are:
•
Message integrity—Ensuring that a packet has not been tampered with in-transit.
•
Authentication—Determining the message is from a valid source.
•
Encryption—Scrambling the contents of a packet prevent it from being seen by an unauthorized
source.
With NAM 5.0, you have the ability to manage devices with SNMPv3.
Note
For the WS-SVC-NAM-1 and WS-SVC-NAM-2 platforms, SNMPv3 is not required. SNMP requests
and responses are communicated over an internal interface within the chassis, and SNMPv3 is not used.
Overview of the NAM Platforms
The following models differ in memory, performance, disk size, and other capabilities. Therefore, some
allow for more features and capabilities (for example, the amount of memory allocated for capture).
Throughout this User Guide, there will be Notes explaining that some features apply only to specific
platforms. If there is no Note, then that feature or aspect applies to all NAM platforms.
NAM 5.0 software supports the following NAM models (SKU):
•
Cisco NAM 2204 Appliances
– NAM2204-RJ45
– NAM2204-SFP
•
Cisco NAM 2220 Appliance
– NAM2220
•
Cisco 6500 Series Switches and Cisco 7600 Series Routers
– WS-SVC-NAM-1
– WS-SVC-NAM-1-250S
– WS-SVC-NAM-2
– WS-SVC-NAM-2-250S
•
Cisco Branch Routers
– NME-NAM-80S
– NME-NAM-120S
NAM 5.0 virtual blade software also supports the following virtual blade:
•
Note
Cisco WAAS NAM Virtual Service Blade
The Cisco Nexus 1010 Virtual Services Appliance is not supported with NAM Traffic Analyzer
Release 5.0. The suggested upgrade path for Nexus 1010 NAM 4.2 users is from NAM 4.2 to 4.2.1N,
and then to NAM 5.1 (when available).
User Guide for the Cisco Network Analysis Module (NAM) Traffic Analyzer, 5.0
OL-22617-01
1-5
Chapter 1
Overview
Logging In
Logging In
Log into the NAM by using the username and password that the NAM installer provided you, and click
the Login button. If you are having problems logging in:
•
Make sure you are using a browser that is currently supported for use with NAM 5.0:
English Firefox 3.6+ or Microsoft Internet Explorer 8+ (Microsoft Internet Explorer 7 is not
supported)
•
Make sure you are using a platform that is currently supported for use with NAM 5.0:
Microsoft Windows XP or Microsoft Windows 7. The Macintosh platform is not supported on this
release.
•
Make sure you have JavaScript enabled.
•
Clear the browser cache and restart the browser (not necessarily if installing NAM for the first time).
•
Make sure cookies are enabled in your browser.
•
If you see the following message: “Initializing database. Please wait until initialization process
finishes,” you must wait until the process finishes.
•
Make sure you had accepted the license agreement (WAAS VSB users only) and that the license has
not expired
To view the full documentation set (including the User Guide and Release Notes) for the Cisco NAM
Traffic Analyzer 5.0, go to the NAM Technical Documentation area on Cisco.com:
http://www.cisco.com/en/US/products/sw/cscowork/ps5401/
tsd_products_support_series_home.html
Navigating the User Interface
NAM 5.0 introduces a redesigned interface and user experience, with more intuitive workflows and
improved operational efficiency. This section describes the improved navigation and control elements in
the user interface.
Note
All times in the Traffic Analyzer are typically displayed in 24-hour clock format. For example, 3:00 p.m.
is displayed as 15:00.
Common Navigation and Control Elements
Menu Bar
To perform the NAM functions, use the menu bar.
The selections enable you to perform the necessary tasks:
Home: Brings you to the Traffic Summary Dashboard (Monitor > Overview > Traffic Summary).
User Guide for the Cisco Network Analysis Module (NAM) Traffic Analyzer, 5.0
1-6
OL-22617-01
Chapter 1
Overview
Navigating the User Interface
Monitor: See “summary” views that allow you to view network traffic, application performance, site
performance, and alarms at a glance.
Analyze: See various “over-time” views for traffic, WAN optimization, response time, managed device,
and media functions.
Capture: Configure multiple sessions for capturing, filtering, and decoding packet data, manage the data
in a file control system, and display the contents of the packets.
Setup: Perform all setup needed to run Cisco NAM Traffic Analyzer 5.0.
Administration: Perform user and system administration tasks, and generate diagnostic information for
obtaining technical assistance.
Detailed Views
Under some topics in the mega-menu, the last selection is “Detailed Views.” Click the small arrow to the
right of the menu selections to see the sub-menu and the functions available.
User Guide for the Cisco Network Analysis Module (NAM) Traffic Analyzer, 5.0
OL-22617-01
1-7
Chapter 1
Overview
Navigating the User Interface
Context Menus
On most charts that appear on the dashboards, you can left-click on a colored bar of data to get a context
menu, with which you can get more detailed information about that item.
The example above is from the Traffic Summary Dashboard, Top N Applications chart. The description
to the right of “Selected Application” in the menu shows what item you had clicked on (in this case,
“snmp”).
The menu items above the separator line are specific to the selected element of the Top N chart. The
items below the separator line are not specific to the selected element, but apply to the Top N chart.
Quick Capture
From the Context menu of many of the bar charts that show Applications or Hosts or VLANs. you can
start a Capture.
For example, when you click on an Application in a barchart (as in the screenshot above) and choose
Capture, the following is done automatically:
Note
•
A memory-based capture session is created
•
A software filter is created using that application
•
The capture session is started
•
The decode window pops open and you can immediately see packets being captured.
Quick Capture does not use site definition/filter.
User Guide for the Cisco Network Analysis Module (NAM) Traffic Analyzer, 5.0
1-8
OL-22617-01
Chapter 1
Overview
Navigating the User Interface
Interactive Report
On most Monitoring and Analyze screens, you can use the Interactive Report on the left side of the
screen to view and change the parameters of the information displayed in the charts. You can redefine
the parameters by clicking the Filter button on the left side of the Interactive Report.
The reporting time interval selection changes depending upon the dashboard you are viewing, and the
NAM platform you are using. The NAM supports up to five saved Interactive Reports.
Chart View / Grid View
Most of the data presented by the NAM can be viewed as either a Chart or a Grid. The Chart view
presents an overview of the data in an integrated manner, and can show you trending information. The
Grid view can be used to see more precise data. For example, to get the exact value of data in graphical
view, you would need to hover over a data point in the Chart to get the data, whereas the same data is
easily visible in table format using Grid view. To toggle between the two views, use the Chart and Grid
icons at the bottom of the panel:
Next to that icon is the “Show as Image” icon, with which you save the chart you are viewing as a PNG
file.
User Guide for the Cisco Network Analysis Module (NAM) Traffic Analyzer, 5.0
OL-22617-01
1-9
Chapter 1
Overview
Navigating the User Interface
Mouse-Over for Details
When in Chart view, you can mouseover the chart to get more detailed information about what occurred
at a specific time.
Many of the line charts in NAM are “dual-axis,” meaning there is one metric shown on the left axis of
the chart and another metric shown on the right axis of the chart.
For example, in the figure above, Total Bytes per second is shown on the left axis, and Total Packets per
second is shown on the right axis.
Zoom/Pan Charts
For many charts, you can drag the beginning or end to change the time interval, as shown below.
The time interval change on the zoom/pan chart will affect the data presented in the charts in the bottom
of the window. The zoom/pan time interval also affects the drill-down navigations; if the zoom/pan
interval is modified, the context menu drill-downs from that dashboard will use the zoom/pan time
interval.
Note
In a bar chart which you can zoom/pan, each block represents data collected during the previous interval
(the time stamp displayed at the bottom of each block is the end of the time range). Therefore, you may
have to drag the zoom/pan one block further than expected to get the desired data to populate in the charts
in the bottom of the window.
User Guide for the Cisco Network Analysis Module (NAM) Traffic Analyzer, 5.0
1-10
OL-22617-01
Chapter 1
Overview
Navigating the User Interface
Sort Grid
When looking at information in Grid view, you can sort the information by clicking the heading of any
column. Click it again to sort in reverse order.
Bytes / Packets
On most Analyze charts, you can use the “Bytes” and “Packets” check boxes at the top to specify which
information you would like the chart to display.
Statistics
The Statistics legend gives you the minimum, maximum, and average statistics of the data. This will
display the initial data retrieved for the selector.
User Guide for the Cisco Network Analysis Module (NAM) Traffic Analyzer, 5.0
OL-22617-01
1-11
Chapter 1
Overview
Understanding How the NAM Works
Above the Statistics legend is a dropdown selector, which allows you to choose which of the metrics
shown in the “over-time” chart you would like reflected in the Statistics legend. For example, if the line
chart has Bytes or Packets in the check boxes above the line chart, the selector over the Statistics legend
will show the same choices, Bytes or Packets.
Context-Sensitive Online Help
The “Help” link on the top-right corner of the NAM Traffic Analyzer interface will bring you to the Help
page for that particular screen of the GUI..
In addition to the Help link on the top-right corner of each page, some pages also have a blue “i”, which
provides help for that specific subject.
Understanding How the NAM Works
The Network Analysis Module (NAM) product family addresses the following major functional areas:
•
Network layer Traffic Analysis. The NAM provides comprehensive traffic analysis to identify what
applications are running over the network, how much network resources are consumed, and who is
using these applications. The NAM offers a rich set of reports with which to view traffic by Hosts,
Application or Conversations. See the discussions about Dashboards, starting with Traffic Summary,
page 3-4.
•
Application Response Time. The NAM can provide passive measurement of TCP-based applications
for any given server or client, supplying a wide variety of statistics like response time, network flight
time, and transaction time.
•
WAN Optimization insight. The NAM can provide insight into WAN Optimization offerings that
compress and optimize WAN Traffic for pre- and post-deployment scenarios. This is applicable for
Optimized and Passthru traffic.
•
Voice Quality Analysis. The NAM provides application performance for real time applications like
Voice and Video. The NAM can compute MOS, as well as provide RTP analysis for the media
stream. See Media, page 3-37.
User Guide for the Cisco Network Analysis Module (NAM) Traffic Analyzer, 5.0
1-12
OL-22617-01
Chapter 1
Overview
Understanding How the NAM Works
•
Advanced Troubleshooting. The NAM provides robust capture and decode capabilities for packet
traces that can be triggered or terminated based on user-defined thresholds.
•
Open instrumentation. The NAM is a mediation and instrumentation product offering, and hence
provides a robust API that can be used by partner products as well as customers that have home
grown applications. See the Cisco NAM 5.0 API Programmer’s Guide.
The NAM delivers the above functionality by analyzing a wide variety of data sources that include:
•
Port mirroring technology like SPAN and RSPAN/ERSPAN. The NAM can analyze Ethernet VLAN
traffic from the following sources: Ethernet, Fast Ethernet, Gigabit Ethernet, trunk port, or Fast
EtherChannel SPAN, RSPAN, or ERSPAN source port
•
VACL
•
NetFlow Data Export (NDE). The NAM can analyze NetFlow Data Export (NDE) from Managed
Devices (Routers/Switches)
•
WAAS
•
SNMP
•
Network Tap Device. Applies to Cisco NAM 2200 Series appliances only.
The NAM Traffic Analyzer 5.0 retains the ability to use SNMP as a southbound interface for
configuration and data retrieval from switches and routers. NAM 5.0 moves away from RMON and
toward web services and Netflow Data Export as the northbound interface for data objects. NAM 5.0 will
continue to support baseline manageability features of SNMP such as MIB-2 and IF-TABLE, and the
health status and interface statistics that can be used by external products like Fault and Configuration
Management offerings (for example, CiscoWorks LMS).
For more information about SPAN, RSPAN, and ERSPAN, see the "Configuring Local SPAN, RSPAN,
and ERSPAN" chapter in the Catalyst 6500 Series Switch Software Configuration Guide.
http://www.cisco.com/en/US/docs/switches/lan/catalyst6500/ios/12.2SX/
configuration/guide/span.html
For more general information about NDE, see this section in the Cisco 7600 Series Cisco IOS Software
Configuration Guide, 12.2SX.
http://www.cisco.com/en/US/docs/routers/7600/ios/12.2SXF/
configuration/guide/nde.html
Table 1-1 summarizes the traffic sources that are used for NAM monitoring.
Table 1-1
Summary of Traffic Sources for NAM Monitoring
Traffic Source
LAN
WAN
Ports
VLANs
Ports
VLANs
VACL capture
Yes
Yes
Yes
N/A
NetFlow Data Export NDE (local)
Yes
Yes
Yes
Yes
NetFlow Data Export NDE (remote) Yes
Yes
Yes
Yes
SPAN
Yes
Yes
No
No
ERSPAN
Yes
Yes
No
No
The next sections describe how the NAM uses the supported data sources:
•
Understanding How the NAM Uses SPAN, page 1-14
•
Understanding How the NAM Uses VACLs, page 1-14
User Guide for the Cisco Network Analysis Module (NAM) Traffic Analyzer, 5.0
OL-22617-01
1-13
Chapter 1
Overview
Understanding How the NAM Works
•
Understanding How the NAM Uses NDE, page 1-15
•
Understanding How the NAM Uses WAAS, page 1-16
Understanding How the NAM Uses SPAN
A switched port analyzer (SPAN) session is an association of a destination port with a set of source ports,
configured with parameters that specify the monitored network traffic. You can configure up to two
SPAN sessions in a Catalyst 6500 or 7600 Routers chassis. Newer Cisco IOS images may support more
than two SPAN sessions. Consult the Cisco IOS document for the number of SPAN sessions supported
per switch or router.
The WS-SVC-NAM-1 platform provides a single destination port for SPAN sessions. The
WS-SVC-NAM-2 platform provides two possible destination ports for SPAN and VLAN access control
list (VACL) sessions. Multiple SPAN sessions to the NAM are supported, but they must be destined for
different ports. The NAM destination ports for use by the SPAN graphical user interface (GUI) are
named DATA PORT 1 and DATA PORT 2 by default. In the CLI, SPAN ports are named as shown in
Table 1-2.
Table 1-2
SPAN Port Names
Module
Cisco IOS Software
WS-SVC-NAM-1
data port
WS-SVC-NAM-2
data port 1 and data port 2
For more information about SPAN and how to configure it on the Catalyst 6500 series switches, see the
Catalyst 6500 Series Switch Software Configuration Guide:
http://www.cisco.com/en/US/docs/switches/lan/catalyst6500/ios/12.2SX/configuration/
guide/span.html
For more information about SPAN and how to configure it on the Cisco 7600 series router, see the Cisco
7600 Series Cisco IOS Software Configuration Guide, 12.2SX:
http://www.cisco.com/en/US/docs/routers/7600/ios/12.2SXF/configuration/guide/span.html
Note
Due to potentially very high volume of ERSPAN traffic from the source, we recommend that you do not
terminate the ERSPAN session on the NAM management port. Instead, you should terminate ERSPAN
on the switch, and use the switch’s SPAN feature to SPAN the traffic to NAM data ports.
Understanding How the NAM Uses VACLs
A VLAN access control list can forward traffic from either a WAN interface or VLANs to a data port on
the NAM. A VACL provides an alternative to using SPAN; a VACL can provide access control based on
Layer 3 addresses for IP and IPX protocols. The unsupported protocols are access controlled through the
MAC addresses. A MAC VACL cannot be used to access control IP or IPX addresses.
There are two types of VACLs: one that captures all bridged or routed VLAN packets and another that
captures a selected subset of all bridged or routed VLAN packets. Catalyst operating system VACLs can
only be used to capture VLAN packets because they are initially routed or bridged into the VLAN on
the switch.
User Guide for the Cisco Network Analysis Module (NAM) Traffic Analyzer, 5.0
1-14
OL-22617-01
Chapter 1
Overview
Understanding How the NAM Works
A VACL can provide access control for all packets that are bridged within a VLAN or that are routed
into or out of a VLAN or, with Release 12.1(13)E or later releases, a WAN interface. Unlike regular
Cisco IOS standard or extended ACLs that are configured on router interfaces only and are applied on
routed packets only, the VACLs apply to all packets and can be applied to any VLAN or WAN interface.
The VACLs are processed in the hardware.
A VACL uses Cisco IOS access control lists (ACLs). A VACL ignores any Cisco IOS ACL fields that
are not supported in the hardware. Standard and extended Cisco IOS ACLs are used to classify packets.
Classified packets can be subject to a number of features, such as access control (security), encryption,
and policy-based routing. Standard and extended Cisco IOS ACLs are only configured on router
interfaces and applied on routed packets.
After a VACL is configured on a VLAN, all packets (routed or bridged) entering the VLAN are checked
against the VACL. Packets can either enter the VLAN through a switch port or through a router port after
being routed. Unlike Cisco IOS ACLs, the VACLs are not defined by direction (input or output).
A VACL contains an ordered list of access control entries (ACEs). Each ACE contains a number of fields
that are matched against the contents of a packet. Each field can have an associated bit mask to indicate
which bits are relevant. Each ACE is associated with an action that describes what the system should do
with the packet when a match occurs. The action is feature dependent. Catalyst 6500 series switches and
Cisco 7600 series routers support three types of ACEs in the hardware: IP, IPX, and MAC-Layer traffic.
The VACLs that are applied to WAN interfaces support only IP traffic.
When you configure a VACL and apply it to a VLAN, all packets entering the VLAN are checked against
this VACL. If you apply a VACL to the VLAN and an ACL to a routed interface in the VLAN, a packet
coming into the VLAN is first checked against the VACL and, if permitted, is then checked against the
input ACL before it is handled by the routed interface. When the packet is routed to another VLAN, it
is first checked against the output ACL applied to the routed interface and, if permitted, the VACL
configured for the destination VLAN is applied. If a VACL is configured for a packet type and a packet
of that type does not match the VACL, the default action is deny.
When configuring VACLs, note the following:
Note
•
VACLs and context-based access control (CBAC) cannot be configured on the same interface.
•
TCP Intercepts and Reflexive ACLs take precedence over a VACL action on the same interface.
•
Internet Group Management Protocol (IGMP) packets are not checked against VACLs.
You cannot set up VACL using the NAM interface.
For details on how to configure a VACL with Cisco IOS software, see the Catalyst 6500 Release 12.2SXF
and Rebuilds Software Configuration Guide.
http://www.cisco.com/en/US/docs/switches/lan/catalyst6500/ios/12.2SXF/native/configuration/
guide/vacl.html
For details on how to configure a VACL on a WAN interface and on a LAN VLAN, see VACL, page 2-17.
Understanding How the NAM Uses NDE
The NAM uses NetFlow as a format for the ongoing streaming of aggregated data, based on the
configured set of descriptors or queries of the data attributes in NAM. NetFlow Data Export (NDE) is a
remote device that allows you to monitor port traffic on the NAM; the NAM can collect NDE from local
or remote switch or router for traffic analysis.
User Guide for the Cisco Network Analysis Module (NAM) Traffic Analyzer, 5.0
OL-22617-01
1-15
Chapter 1
Overview
Understanding How the NAM Works
To use an NDE data source for the NAM, you must configure the remote device to export the NDE
packets. The default UDP port is 3000, but you can configure it from the NAM CLI as follows:
[email protected]# netflow input port ?
<port>
- input NDE port number
The distinguishing feature of the NetFlow v9 format, which is the basis for an IETF standard, is that it
is template-based. Templates provide an extensible design to the record format, a feature that must allow
future enhancements to NetFlow services without requiring concurrent changes to the basic flow-record
format.
For more detailed information about NAM and NetFlow, see NetFlow, page 2-18.
For more information on NetFlow, see http://www.cisco.com/go/netflow or the “Configuring NetFlow
Data Export” chapter in the Cisco 7600 Series Cisco IOS Software Configuration Guide, 12.2SX.
http://www.cisco.com/en/US/docs/routers/7600/ios/12.2SXF/
configuration/guide/nde.html
For specific information about creating and managing NDE queries, see the Cisco Network Analysis
Module 5.0 API Programmer’s Guide.
Understanding How the NAM Uses WAAS
Cisco Wide Area Application Services (WAAS) software optimizes the performance of TCP-based
applications operating in a wide area network (WAN) environment and preserves and strengthens branch
security. The WAAS solution consists of a set of devices called Wide Area Application Engines (WAEs)
that work together to optimize WAN traffic over your network.
When client and server applications attempt to communicate with each other, the network devices
intercepts and redirects this traffic to the WAEs to act on behalf of the client application and the
destination server.
WAEs provide information about packet streams traversing through both LAN and WAN interfaces of
WAAS WAEs. Traffic of interest can include specific servers and types of transaction being exported.
NAM processes the data exported from the WAAS and performs application response time and other
metrics calculations and enters the data into reports you set up.
The WAEs examine the traffic and using built-in application policies to determine whether to optimize
the traffic or allow it to pass through your network not optimized.
You can use the WAAS Central Manager GUI to centrally configure and monitor the WAEs and
application policies in your network. You can also use the WAAS Central Manager GUI to create new
application policies so that the WAAS system will optimize custom applications and less common
applications.
For more information about WAAS data sources and managing WAAS devices, see Understanding
WAAS, page 2-29.
User Guide for the Cisco Network Analysis Module (NAM) Traffic Analyzer, 5.0
1-16
OL-22617-01
Chapter 1
Overview
Configuration Overview
Table 1-3. “Configuration Overview” leads you through the basic configuration steps you can follow for
the NAM Traffic Analyzer 5.0.
These are not necessarily in the order in which you need to perform them, and many are optional
features.
Table 1-3
Configuration Overview
Action
Description
GUI Location
User Guide Location
Install the NAM
--
--
Platform-specific
Installation and
Configuration Guides
(http://www.cisco.com/en/
US/products/sw/cscowork/
ps5401/prod_installation_
guides_list.html)
Configure the Managed Device
Information
Traffic will populate on the
dashboards if you have configured
the managed device.
Setup > Managed Device
> Device Information
See Managed Device,
page 2-55.
Note
This only applies to the
NAM 2200 Series
Appliance or an
NME-NAM device.
Verify that traffic has started
Traffic usage statistics for
Home (Traffic Summary
applications, hosts, conversations, Dashboard)
VLANs, and DSCP are available on
or
the Traffic Summary Dashboard.
Monitor > Overview >
This will start automatically after
Traffic Summary
you turn on the NAM.
See Traffic Analysis,
page 2-1.
Verify that Application Response
Time Metrics are being gathered
The NAM Traffic Analyzer
software provides response time
measurements and various
user-experience-related metrics,
which are computed by monitoring
and time-stamping packets sent
from the user to the server
providing services.
See Application Response
Time Metrics, page 2-2
Analyze > Response
Time.
You can view response
times for applications,
networks, servers, and
clients.
This will start automatically after
you turn on the NAM.
User Guide for the Cisco Network Analysis Module (NAM) Traffic Analyzer, 5.0
OL-22617-01
1-17
Chapter 1
Overview
Configuration Overview
Table 1-3
Configuration Overview (continued)
Action
Description
GUI Location
User Guide Location
Verify that Voice/RTP Stream
Traffic is being gathered
After the NAM Traffic Analyzer is
started, Voice/RTP stream traffic
will automatically start being
monitored. The NAM enables you
to monitor all RTP stream traffic
among all SPANed traffic, without
having to know the signalling traffic
used in negotiating the RTP
channels.
Analyze > Media > RTP
Streams
See Voice Signaling/RTP
Stream Monitoring,
page 2-2
or
Analyze > Media > Voice
Call Statistics.
This will start automatically after
you turn on the NAM.
Set up the System Time
You will need to set up the System
Time correctly; if you do not have
the time synchronized, then you
will see either incorrect or no data.
Configure NDE Data Export
The NAM as a producer of NDE
Setup > Data Export >
(NetFlow Data Export) packets is a NetFlow
new feature for NAM Traffic
Analyzer 5.0. The NAM's new
functionality of NDE is part of its
new NBI.
Administration > System System Time, page 5-5
> System Time
NetFlow, page 2-49
The NAM sends out NDE packets
only in NDE v9 format.
Configure sites
A site is a collection of hosts
(network endpoints) partitioned
into views that help you monitor
traffic and troubleshoot problems.
Setup > Network > Sites.
See Sites, page 2-58.
If you want to limit the view of your
network data to a specific city, a
specific building, or even a specific
floor of a building, you can use the
Sites function.
We recommend that sites are
configured using prefix-based
subnets instead of based on data
source.
Define Alarms and Thresholds
Alarms are predefined conditions
based on a rising data threshold, a
falling data threshold, or both. You
can choose for what types of events
you want the NAM to notify you,
and how you want to be notified.
Setup > Alarms > Actions Alarm Actions, page 2-36
and
Thresholds, page 2-39
Setup > Alarms >
Thresholds
Alarms that will be used for
Thresholds should be created first,
then then the Thresholds created
second.
User Guide for the Cisco Network Analysis Module (NAM) Traffic Analyzer, 5.0
1-18
OL-22617-01
Chapter 1
Overview
Configuration Overview
Table 1-3
Configuration Overview (continued)
Action
Description
GUI Location
Configure Capture
Capture allows you to set up up to Capture > Packet
ten sessions for capturing, filtering, Capture/Decode
and decoding packet data, manage
the data in a file control system, and
display the contents of the packets.
Configure Scheduled Export
You can set up scheduled jobs that
will generate a daily report at a
specified time, in the specified
interval, and then e-mail it to a
specified e-mail address.
Set up Northbound API
NBI (Northbound Interface), also
referred to as API (Application
Programming Interface), enables
partners and customers to provision
the NAM and extract performance
data.
You can write your own scripts
based on the NAM Northbound
API, but there is setup in the NAM
GUI needed.
Set up TACACS+ server
TACACS+ is a Cisco Systems
enhancement that provides
additional support for
authentication and authorization.
User Guide Location
Chapter 4, “Capturing and
Decoding Packet Data.”
In the Interactive Report
Scheduled Exports,
(left side of the dashboard), page 2-53
click the Export button.
For application developers
who want to use the NAM
APIs to provision network
services and leverage data,
see the Cisco Network
Analysis Module 5.0 API
Programmer’s Guide.
Administration > Users > Configuring a TACACS+
TACACS+
Server to Support NAM
Authentication and
Authorization, page 5-20
When a user logs into the NAM
Traffic Analyzer, TACACS+
determines if the username and
password are valid and what the
access privileges are.
Change System Preferences
You can change many preferences,
such as refresh interval, Top N
Entries, Data Displayed, and
enabling Audit Trail, as needed.
Administration > System Chapter 5, “User and
> Preferences
System Administration.”
Configuring and Viewing Data
Some of the NAM 5.0 features require configuration of sites. A site is a collection of hosts, or network
endpoints, partitioned into views that help you monitor traffic and troubleshoot problems (see Sites,
page 2-58 for more detailed information). These features include those in which the NAM provides
measurements of application performance on networks where WAAS devices are deployed, and
dashboards that show traffic levels between sites and alarms levels per site. All other NAM features can
still be used without defining any sites (the default configuration).
If you have set up sites, you will be able to select a particular site to view in the Interactive Report and
view data relevant to that site only. In some cases, you can select both a Client Site and a Server Site to
view data pertaining to interaction between hosts at different sites.
User Guide for the Cisco Network Analysis Module (NAM) Traffic Analyzer, 5.0
OL-22617-01
1-19
Chapter 1
Overview
Configuration Overview
Cisco WAAS NAM Virtual Service Blade
To set up the NAM Traffic Analyzer, Release 5.0 on a Cisco WAAS NAM Virtual Service Blade, you
need to follow these steps:
Step 1
Confirm that you have completed the steps in Chapter 4, “Configuring NAM-WAAS Integration” of the
Cisco WAAS NAM Virtual Service Blade Installation and Configuration Guide, specifically for
“Configuring WAAS to Send Flow Information to NAM VSB” and “Configuring WAAS Data Source in
NAM.”
Step 2
Configure a site for the Client network. See Sites, page 2-58.
Step 3
Configure another site for the Server network. See Sites, page 2-58.
Step 4
Choose Setup > Monitoring > WAAS Servers and click the Add button to add WAAS servers.
Step 5
Add a specific host IP address of the server that you want to monitor. If there are multiple IP addresses,
you can paste them in.
Step 6
To verify that you have set up the WAAS-NAM propertly, choose Analyze > WAN Optimization >
Application Performance Analysis and make sure you can see data (passthrough traffic). If you have
not properly configured the Client Site and the Server Site, you will not see data in the charts.
User Guide for the Cisco Network Analysis Module (NAM) Traffic Analyzer, 5.0
1-20
OL-22617-01
CH A P T E R
2
Setting Up The NAM Traffic Analyzer
This chapter provides information about functions that will begin automatically, and other setup tasks
you will need to perform for NAM Traffic Analyzer Release 5.0.
It contains the following sections:
•
Default Functions, page 2-1
•
Traffic, page 2-3
•
Alarms, page 2-36
•
Data Export, page 2-49
•
Managed Device, page 2-55
•
Network, page 2-58
•
Classification, page 2-66
•
Monitoring, page 2-74
Follow the Installation and Configuration Guide for your specific NAM product to see information about
how to install the product, configure it, log in, and get started.
Default Functions
After the NAM Traffic Analyzer is turned on, some functions will begin automatically, without any setup
steps necessary. These functions are:
•
Traffic Analysis, page 2-1
•
Application Response Time Metrics, page 2-2
•
Voice Signaling/RTP Stream Monitoring, page 2-2
•
Traffic Usage Statistics, page 2-3
Traffic Analysis
Traffic usage statistics for applications, hosts, conversations, VLANs, and DSCP will begin populating
on the Traffic Summary dashboard (Monitor > Overview > Traffic Summary).
User Guide for the Cisco Network Analysis Module (NAM) Traffic Analyzer, 5.0
OL-22617-01
2-1
Chapter 2
Setting Up The NAM Traffic Analyzer
Default Functions
Application Response Time Metrics
The NAM Traffic Analyzer software provides response time measurements and various
user-experience-related metrics, which are computed by monitoring and time-stamping packets sent
from the user to the server providing services.
These Application Response Time Metrics are available to view under the menu Analyze > Response
Time. You can view response times for applications, networks, servers, and clients.
After the NAM Traffic Analyzer is started, these metrics will begin to populate.
Voice Signaling/RTP Stream Monitoring
After the NAM Traffic Analyzer is started, voice signaling and RTP stream traffic will automatically
start being monitored. The NAM enables you to monitor all RTP stream traffic among all SPANed traffic,
without having to know the signalling traffic used in negotiating the RTP channels. When RTP Stream
Monitoring is enabled, the NAM:
•
Identifies all RTP streams among the SPANed traffic
•
Monitors the identified RTP traffic
•
Sends syslog, trap, e-mail, and trigger captures for RTP streams that violate stream statistics
thresholds on the following metrics:
– Number of Consecutive Packet Loss
Each RTP packet has an RTP header that contains a sequence number. The sequence number
increments by one for each RTP packet received in the same RTP stream. A gap in the sequence
numbers identifies a packet loss. If the gap in sequence numbers jump is more than the
threshold, the NAM raises an alarm condition.
– Packet Loss percent
There are two types of percent packet loss percent: Adjusted Packet Loss and Actual Packet
Loss. Actual Packet Loss indicates expected packets that never appear in the NAM. Adjusted
Packet Loss includes actual packets lost and packets that arrive with large delay beyond the
expected buffer capacity of the endpoint.
– Jitter: Packets delay compare to the expected receiving time
– Concealment Seconds: Seconds in which there is one or more packet lost
– Severe Concealment Seconds: Seconds in which there is more than 5% of packet lost
You can set up thresholds at Setup > Alarms > Thresholds.
You can define filter entries to narrow down to the subset of RTP streams so the NAM monitors only
those RTP streams matching the filter criteria.
To verify that the voice signaling/RTP traffic has begun, choose Analyze > Media > RTP Streams or
Analyze > Media > Voice Call Statistics.
User Guide for the Cisco Network Analysis Module (NAM) Traffic Analyzer, 5.0
2-2
OL-22617-01
Chapter 2
Setting Up The NAM Traffic Analyzer
Traffic
Traffic Usage Statistics
The NAM Traffic Analyzer provides traffic statistics broken out by application, host, conversation,
VLAN, and DSCP code point. Summary dashboards show Top N charts broken out by these attributes,
as well as detailed views in tabular form. Analysis dashboards show usage over time by one particular
application, host, and so forth, as well as other interesting measurements for the particular element being
analyzed over a user-specified period of time.
Traffic
The NAM 5.0 Traffic Analyzer menu selections for setting up Traffic are:
•
SPAN, page 2-3
•
Data Sources, page 2-9
•
Hardware Deduplication, page 2-35
SPAN
A switched port analyzer (SPAN) session is an association of a destination port with a set of source ports,
configured with parameters that specify the monitored network traffic. See Data Sources, page 2-9 for
more information about data sources.
The following sections describe SPAN sessions on devices running the NAM:
•
About SPAN Sessions, page 2-3
•
Creating a SPAN Session, page 2-6
•
Editing a SPAN Session, page 2-8
•
Deleting a SPAN Session, page 2-9
About SPAN Sessions
Note
This section applies to WS-SVC-NAM-1 and WS-SVC-NAM-2 devices, the NAM 2220 and 2204
appliances, and the NME-NAM branch routers.
Depending on the IOS running on the Supervisor, port names are displayed differently. Newer versions
of IOS software display a port name as Gi2/1 to represent a Gigabit port on module 2 port 1. In the VSS,
a port name might be displayed as Gi1/2/1to represent a Gigabit port on switch 1, module2, port 1.
The NME-NAM device has two Gigabit Ethernet ports—an internal interface and an external interface.
One of the two interfaces must be selected as the NAM management port for IP traffic (such as HTTP
and SNMP). The NAM can monitor traffic for analysis on the internal interface, the external interface,
or both simultaneously. A typical configuration is to monitor LAN and WAN traffic on the internal
interface. However, the external interface can be used to monitor LAN traffic.
WS-SVC-NAM-1 devices can have only one active SPAN session. You can select a switch port or
EtherChannel as the SPAN source; however, you may select only one SPAN type. WS-SVC-NAM-2
devices and switch software support two SPAN destination ports.
User Guide for the Cisco Network Analysis Module (NAM) Traffic Analyzer, 5.0
OL-22617-01
2-3
Chapter 2
Setting Up The NAM Traffic Analyzer
Traffic
Before you can monitor data, you must direct specific traffic flowing through a switch to the NAM for
monitoring purposes. Use the methods described in Table 2-1, Methods of Directing Traffic.
Table 2-1
Methods of Directing Traffic
Method
Usage Notes
Switch SPAN
You can direct a set of physical ports, a set of VLANs, or a set of EtherChannels to the
NAM.
Selecting an EtherChannel as a SPAN source is the same as selecting all physical ports
comprising the EtherChannel as the SPAN source.
Switch Remote SPAN (RSPAN)
You can monitor packet streams from remote switches, assuming that all traffic from a
remote switch arrives at the local switch on a designated RSPAN VLAN. Use the
RSPAN VLAN as the SPAN source for the NAM.
NetFlow Data Export (NDE)
You can monitor NDE records directly from remote switches or routers. You must
configure the NDE source to the NAM from a local switch or remote router, using the
switch CLI. For received NDE traffic, a default site will be created including all
interfaces from that device. See Sites, page 2-58.
SPAN and NDE sources can be in effect simultaneously.
Note
Starting with NAM release 5.0, in addition to being a consumer of NDE
records, the NAM is also a producer of NDE data packets.
Table 2-2, SPAN Sources, describes the types of SPAN sources and the possible ways to configure them.
Table 2-2
SPAN Sources
SPAN Source
Configured with one of the following:
Any set of physical ports
Any EtherChannel
Any set of VLANs configured on the local switch
•
NAM Traffic Analyzer (the NAM GUI)
•
Switch CLI
•
Supervisor portCopyTable (SNMP)
•
NAM Traffic Analyzer (the NAM GUI)
•
Switch CLI
•
Supervisor portCopyTable (SNMP)
•
NAM Traffic Analyzer (the NAM GUI)
•
Switch CLI
•
Supervisor portCopyTable (SNMP)
User Guide for the Cisco Network Analysis Module (NAM) Traffic Analyzer, 5.0
2-4
OL-22617-01
Chapter 2
Setting Up The NAM Traffic Analyzer
Traffic
Table 2-3, Active SPAN Sessions Dialog, describes the fields on the SPAN Sessions screen.
Table 2-3
Active SPAN Sessions Dialog
Column
Description
Session ID
Monitor session ID of the SPAN.
Note
For switches running Cisco IOS software only.
Type
Type of SPAN source
Source
Source of the SPAN session.
When creating a SPAN session, you can select all ports regardless of their state.
See Table 2-4, Possible SPAN States for a description of the possible SPAN
states.
Note
For switches running Cisco IOS software only.
Dest. Port
Destination port of the SPAN session.
Direction
Direction of the SPAN traffic.
Status
Status of the SPAN session:
Active—Traffic at the SPAN source is being copied to the SPAN destination
Inactive—Traffic at the SPAN source will not be copied to the SPAN
destination
Unknown—A mixture of both active and inactive status
Create
Create a SPAN session.
Save
Saves the current active SPAN session in the running-configuration to the
startup-configuration for switches running Cisco IOS software only.
Add Dest. Port 1
Add NAM Port 1 to the selected SPAN session as a SPAN destination. This
button is labeled Add Dest. Port on the WS-SVC-NAM-1.
Note
Add Dest. Port 2
Add NAM Port 2 to the selected SPAN session as a SPAN destination. This
option is not available on the WS-SVC-NAM-1.
Note
Note
Does not apply to the NAM appliances.
Edit
Edit the selected SPAN session.
Delete
Delete the selected SPAN session.
Refresh
Click to update the SPAN session information.
IOS supports only two SPAN sessions, but each SPAN session can have more than one destination. The
Add Dest. Port 1 and Add Dest. Port 2 buttons enable you to make the NAM dataport an additional
destination to an existing local SPAN session.
User Guide for the Cisco Network Analysis Module (NAM) Traffic Analyzer, 5.0
OL-22617-01
2-5
Chapter 2
Setting Up The NAM Traffic Analyzer
Traffic
Note
Deleting or editing a SPAN session that has multiple SPAN destinations will affect all SPAN
destinations.
Table 2-4 lists the possible SPAN states. The SPAN state displays in parenthesis in the Source - Direction
column.
Table 2-4
Possible SPAN States
State
Description
Active
SPAN source is valid and traffic from the source is being copied to the SPAN
destination
NotInService
SPAN source might be valid, but traffic that appears at the source will not be
copied to the SPAN destination
NotReady
The SPAN source might be valid, but traffic that appears at the source will not be
copied to the SPAN destination
CreateAndGo
The SPAN source might be valid, but the SPAN source is being added to the SPAN
session
CreateAndWait
The SPAN source might be valid, and the SPAN source is being added to the
SPAN session
Destroy
The SPAN source is being removed from the SPAN session.
Creating a SPAN Session
Note
This section applies to WS-SVC-NAM-1 and WS-SVC-NAM-2 devices, and the NAM 2220 and 2204
appliances.
The following procedure shows you how to create a SPAN session on a switch.
Step 1
Choose Setup > Traffic > SPAN Sessions. The SPAN window displays as shown in Figure 2-1.
Figure 2-1
SPAN Sessions
User Guide for the Cisco Network Analysis Module (NAM) Traffic Analyzer, 5.0
2-6
OL-22617-01
Chapter 2
Setting Up The NAM Traffic Analyzer
Traffic
Step 2
Click the Create button.
The Create SPAN Session Dialog displays (the fields are described in Table 2-5, Create SPAN Session
Dialog). Switch Port is the default for the SPAN Type.
Step 3
Select the appropriate information.
Table 2-5
Create SPAN Session Dialog
Field
Description
Monitor Session
Monitor session of the SPAN.
SPAN Type
•
SwitchPort
•
VLAN
•
EtherChannel
•
RSPAN VLAN
You can have only one RSPAN VLAN source per SPAN
session.
Note
SPAN Destination Interface
The NAM interface to which you want to send data.
Switch Module List
Lists all modules on the switch other than NAMs and Switch
Fabric Modules.
SPAN Traffic Direction
•
Rx
•
Tx
•
Both
Note
Not applicable to RSPAN VLAN SPAN types.
Available Sources
SPAN sources that are available for the selected SPAN type.
Add
Adds the selected SPAN source.
Remove
Removes the selected SPAN source.
Remove All
Removes all the SPAN sources.
Selected Sources
SPAN sources selected.
Refresh
Causes the NAM to update the switch configuration information with
current configuration.
Submit
Creates the SPAN configuration; saves the configuration.
Step 4
To create the SPAN session, click Submit. The Active Sessions window displays.
Step 5
To save the current active SPAN session in the running-configuration to the startup-configuration for
switches running Cisco IOS software only, click Save in the active SPAN session window.
Note
Step 6
For switches running Cisco IOS software, all pending running-configuration changes will be
saved to the startup-configuration.
To verify the SPAN session was created and to view the data, go to the Top N charts on the Traffic
Analysis dashboard (Monitor > Overview > Traffic Summary).
User Guide for the Cisco Network Analysis Module (NAM) Traffic Analyzer, 5.0
OL-22617-01
2-7
Chapter 2
Setting Up The NAM Traffic Analyzer
Traffic
Editing a SPAN Session
You can only edit SPAN sessions that have been directed to the NAM.
Note
This section applies to WS-SVC-NAM-1 and WS-SVC-NAM-2 devices, and the NAM 2220 and 2204
appliances.
Note
Editing an existing SPAN session that has multiple SPAN destinations will affect all destinations.
To edit a SPAN session:
Step 1
Choose Setup > Traffic > SPAN Sessions.
The Active SPAN Sessions dialog box displays.
Step 2
Select the SPAN session to edit, then click Edit.
The Edit SPAN Session Dialog Box displays. The fields are described in Table 2-6, Edit SPAN Session
Dialog Box.
Step 3
Make the appropriate changes.
Table 2-6
Edit SPAN Session Dialog Box
Field
Description
Monitor Session
Monitor session of the SPAN.
SPAN Type
Type of SPAN session.
SPAN Destination interface
The NAM interface to which you want to send data.
Switch Module List
Lists all modules on the switch other than NAMs and Switch
Fabric Modules.
SPAN Traffic Direction
Direction of the SPAN traffic.
Available Sources
SPAN sources available for the selected SPAN type.
Add
Adds the selected SPAN source
Remove
Removes the selected SPAN source.
Remove All
Removes all the SPAN sources.
Selected Sources
SPAN sources selected.
Refresh
Causes the NAM to update the switch configuration information with
current configuration.
Submit
Saves changes.
Reset
Clears all changes since previous Submit.
User Guide for the Cisco Network Analysis Module (NAM) Traffic Analyzer, 5.0
2-8
OL-22617-01
Chapter 2
Setting Up The NAM Traffic Analyzer
Traffic
Deleting a SPAN Session
Note
This section does not apply to NME-NAM devices.
Note
Deleting a SPAN session that has multiple SPAN destinations will affect all destinations.
To delete a SPAN session, select it from the Active SPAN Session dialog box, then click Delete.
Data Sources
Data sources are the source of traffic for the NAM Traffic Analyzer. Some examples are: physical data
ports of the NAM where you get SPAN data, a specific router or switch that sends NetFlow to the NAM,
or a WAAS device segment that sends data to NAM or ERSPAN and which goes to NAM's management
port.
A new feature in NAM 5.0 is the “auto discovery” of data sources, in which you can click the Auto
Create button to tell the NAM to automatically discover the data sources. You will be able to see details
such as the IP addresses of devices sending packets to the NAM and the time that the last NDE packet
was received (in NAM 4.x, this was called “Listening Mode”).
Note
If you have configured sites (see Sites, page 2-58), you can assign data sources to that particular site. If
you do this, and you also configure data sources, the two could overlap since sites can also be a primary
“view” into data sources. If there is a mismatch between the two, you will not see any data.
Note
We recommend that you configure a site using subnets instead of selecting a data source. See Specifying
a Site Using Subnets, page 2-59.
The following sections contain specific information about the types of data sources:
•
SPAN, page 2-10
•
ERSPAN, page 2-10
•
VACL, page 2-17
•
NetFlow, page 2-18
•
WAAS, page 2-29
The NAM Data Sources page (Setup > Traffic > Data Sources) lists the data sources configured for that
NAM Traffic Analyzer.
User Guide for the Cisco Network Analysis Module (NAM) Traffic Analyzer, 5.0
OL-22617-01
2-9
Chapter 2
Setting Up The NAM Traffic Analyzer
Traffic
The fields are explained in Table 2-7, NAM Data Sources.
Table 2-7
NAM Data Sources
Field
Description
Device
DATA PORT if it is a local physical port, or the IP address of the
learned device.
Type
The source of traffic for the NAM.
DATA PORT if it is a local physical port.
WAAS, ERSPAN, or NETFLOW if a data stream exported from the
router or switch or WAE device.
Activity
Shows the most recent activity.
Status
ACTIVE or INACTIVE.
Data Source
The Name given to the data source.
Data Source Details
“Physical Port”, or information about the data source being Enabled
or Disabled.
SPAN
A switched port analyzer (SPAN) session is an association of a destination port with a set of source ports,
configured with parameters that specify the monitored network traffic. You can configure up to two
SPAN sessions in a Catalyst 6500 or 7600 Routers chassis.
For information about SPAN sessions, see SPAN, page 2-3.
ERSPAN
This section describes how to configure Encapsulated Remote Switched Port Analyzer (ERSPAN) of the
Catalyst 6500 switch or Cisco 7600 series router as a NAM data source. You configure ERSPAN as a
NAM data source from the Catalyst 6500 switch or Cisco 7600 series router command line interface, not
the NAM GUI.
As an ERSPAN consumer, the NAM can receive ERSPAN packets on its management port from devices
such as Cisco routers and switches. Those packets are analyzed as if that traffic had appeared on one of
the NAM data ports. The NAM supports ERSPAN versions 1 and 3. Incoming ERSPAN data is parsed
by the NAM, stored in its internal database, and presented in the GUI in the same way as traffic from
other data sources.
For the NAM to receive ERSPAN from an external switch or router, that device must be configured to
send ERSPAN packets to the NAM’s IP address.
See the following sections about using ERSPAN as a data source:
•
Enabling Auto-Creation of ERSPAN Data Sources Using the Web GUI, page 2-11
•
Enabling Auto-Creation of ERSPAN Data Sources Using the CLI, page 2-11
•
Disabling Auto-Creation of ERSPAN Data Sources Using the Web GUI, page 2-12
•
Disabling Auto-Creation of ERSPAN Data Sources Using the CLI, page 2-12
•
Creating ERSPAN Data Sources Using the Web GUI, page 2-12
•
Creating ERSPAN Data Sources Using the CLI, page 2-12
User Guide for the Cisco Network Analysis Module (NAM) Traffic Analyzer, 5.0
2-10
OL-22617-01
Chapter 2
Setting Up The NAM Traffic Analyzer
Traffic
•
Deleting ERSPAN Data Sources Using the Web GUI, page 2-14
•
Deleting ERSPAN Data Sources Using the CLI, page 2-15
•
Configuring ERSPAN on Devices, page 2-16
Enabling Auto-Creation of ERSPAN Data Sources Using the Web GUI
There is a convenient “auto-create” feature for data sources, which is enabled by default. With the
auto-create feature, a new data source will automatically be created for each device that sends ERSPAN
traffic to the NAM, after the first packet is received. Manual creation of ERSPAN data sources using the
NAM GUI or the CLI is typically not necessary. When manually creating a data source, you may specify
any name you want for the data source. A data source entry must exist on the NAM in order for it to
accept ERSPAN packets from an external device.
Auto-created ERSPAN data sources will be assigned a name in the format ERSPAN-<IP
Address>-ID-<Integer>, where IP Address is the IP address of the sending device, and Integer is the
Session-ID of the ERSPAN session on that device. For example, device 192.168.0.1 sending ERSPAN
packets with the Session ID field set to 12 would be named “ERSPAN-192.168.0.1-ID-12.” You can edit
these auto-created data sources and change the name if desired.
One device can be configured to send multiple separate ERSPAN sessions to the same NAM. Each
session will have a unique Session ID. The NAM can either group all sessions from the same device into
one data source, or have a different data source for each Session ID. When data sources are auto-created,
they will be associated with one particular Session ID. When manually created, you can instruct the
NAM to group all traffic from the same device into one data source. If you check the Session check box,
and enter a Session ID in the Value field, the data source will only apply to that specific session. If you
leave the check box unchecked, all ERSPAN traffic from the device will be grouped together into this
data source, regardless of Session ID.
To configure the NAM to automatically create data sources when it receives ERSPAN packets from an
external device, use the following steps. Remember however, that the auto-create feature is turned on by
default, so these steps are typically not necessary.
Step 1
Click Setup > Traffic > NAM Data Sources.
Step 2
Click the Auto Create button on the bottom left of the window.
Step 3
Check the ERSPAN check box to toggle auto-creation of ERSPAN data sources to “on”.
Step 4
Click the Submit button.
Enabling Auto-Creation of ERSPAN Data Sources Using the CLI
Configuration of the auto-create feature is also possible using the NAM CLI. Because the auto-create
feature is turned on by default, in most cases these steps are not necessary.
To configure the NAM to automatically create data sources when it receives ERSPAN packets from an
external device, use the "autocreate-data-source" command as follows:
[email protected]# autocreate-data-source erspan
ERSPAN data source autocreate successfully ENABLED
User Guide for the Cisco Network Analysis Module (NAM) Traffic Analyzer, 5.0
OL-22617-01
2-11
Chapter 2
Setting Up The NAM Traffic Analyzer
Traffic
The NAM will now automatically create a ERSPAN data source for each device that sends ERSPAN
packets to it. The data source will have the specific Session ID that is populated by the device in the
ERSPAN packets sent to the NAM. If the same device happens to send ERSPAN packets to the NAM
with different Session ID values, a separate data source will be created for each unique Session ID sent
from the device.
Disabling Auto-Creation of ERSPAN Data Sources Using the Web GUI
Step 1
Click Setup > Traffic > NAM Data Sources.
Step 2
Click the Auto Create button on the bottom left of the window.
Step 3
Uncheck the ERSPAN check box to toggle auto-creation of ERSPAN data sources to “off”.
Step 4
Click the Submit button.
Disabling Auto-Creation of ERSPAN Data Sources Using the CLI
To disable auto-creation of ERSPAN data sources, use the no autocreate-data-source command as
follows:
[email protected]# no autocreate-data-source erspan
ERSPAN data source autocreate successfully DISABLED
[email protected]#
Creating ERSPAN Data Sources Using the Web GUI
To manually configure a ERSPAN data source on the NAM using the GUI, for example if the
auto-creation feature is turned off, use the following steps:
Step 1
Click Setup > Traffic > NAM Data Sources.
Step 2
Click the Create button along the bottom of the window.
Step 3
In the Type drop-down list, select “ERSPAN”.
Step 4
Enter the IP address of the device that will export ERSPAN to the NAM.
Step 5
Give the Data Source a name. This name will appear anywhere there is a Data Source drop-down list.
Step 6
(Optional) Check the Session check box and enter an Session ID into the Value field if the data source
should only apply to that specific session. If you leave the check box unchecked, all ERSPAN traffic
from the device will be grouped together into this data source, regardless of Session ID.
Devices can be configured with multiple ERSPAN Sessions. The packets exported may have the same
source IP address, but the Session ID exported will be a different for each session. If you want to include
only one Session in the data source, you must check the “Session” box and provide the value of that
Session ID.
Step 7
Click the Submit button.
User Guide for the Cisco Network Analysis Module (NAM) Traffic Analyzer, 5.0
2-12
OL-22617-01
Chapter 2
Setting Up The NAM Traffic Analyzer
Traffic
Creating ERSPAN Data Sources Using the CLI
To manually configure a ERSPAN data source on the NAM using the CLI (for example if the
auto-creation feature is turned off), use the following steps. Note that when using the CLI, there are two
separate phases involved: First, you must create a “device” entry on the NAM and remember the device
ID, and then you must create a data source entry using this device ID. In the NAM GUI, these two phases
for creating ERSPAN data sources are combined together.
Step 1
Enter the command device erspan. You will now be in erspan device subcommand mode as shown here:
[email protected]# device erspan
Entering into subcommand mode for this command.
Type 'exit' to apply changes and come out of this mode.
Type 'cancel' to discard changes and come out of this mode.
[email protected](sub-device-erspan)#
Step 2
Enter ? to see all the command options available, as in the example below:
[email protected](sub-device-netflow)# ?
?
- display help
address
- device IP address (*)
cancel
- discard changes and exit from subcommand mode
exit
- create device and exit from sub-command mode
help
- display help
show
- show current config that will be applied on exit
(*) - denotes a mandatory field for this configuration.
[email protected](sub-device-netflow)#
Step 3
Enter the IP address of the device as shown in this example (required):
[email protected](sub-device-erspan)# address 192.168.0.1
Step 4
Type show to look at the device configuration that will be applied and verify that it is correct:
[email protected](sub-device-erspan)# show
DEVICE TYPE
DEVICE ADDRESS
: ERSPAN (Encapsulated Remote SPAN)
: 192.168.0.1
[email protected](sub-device-erspan)#
Step 5
Type exit to come out of the subcommand mode and create the device. Remember the ID value that was
assigned to the new device (you will need it to create the data source).
[email protected](sub-device-erspan)# exit
Device created successfully, ID = 1
[email protected]#
Step 6
Enter the command data-source erspan. You will now be in erspan data source subcommand mode as
shown here:
[email protected]# data-source erspan
Entering into subcommand mode for this command.
Type 'exit' to apply changes and come out of this mode.
Type 'cancel' to discard changes and come out of this mode.
[email protected](sub-data-source-erspan)#
User Guide for the Cisco Network Analysis Module (NAM) Traffic Analyzer, 5.0
OL-22617-01
2-13
Chapter 2
Setting Up The NAM Traffic Analyzer
Traffic
Step 7
Enter ? to see all the command options available, as in the example below:
[email protected](sub-data-source-erspan)# ?
?
- display help
cancel
- discard changes and exit from subcommand mode
device-id
- netflow device ID (*)
exit
- create data-source and exit from sub-command mode
help
- display help
name
- data-source name (*)
session-id
- erspan Session ID
show
- show current config that will be applied on exit
(*) - denotes a mandatory field for this configuration.
[email protected](sub-data-source-erspan)#
Step 8
Enter the device ID from Step 4.
[email protected](sub-data-source-erspan)# device-id 1
Step 9
Enter the name you would like for the data source (required):
[email protected](sub-data-source-erspan)# name MyFirstErspanDataSource
Step 10
If desired, supply the specific Session ID for this ERSPAN data source (optional):
[email protected](sub-data-source-erspan)# session-id 123
Step 11
Type show to look at the data source configuration that will be applied and verify that it is correct:
[email protected](sub-data-source-netflow)# show
DATA SOURCE NAME
DATA SOURCE TYPE
DEVICE ID
DEVICE ADDRESS
SESSION ID
:
:
:
:
:
MyFirstErspanDataSource
ERSPAN (Encapsulated Remote SPAN)
1
192.168.0.1
123
[email protected](sub-data-source-erspan)#
Step 12
Type exit to come out of the subcommand mode and create the data source:
[email protected](sub-data-source-erspan)# exit
Data source created successfully, ID = 3
The data source is now created, and ERSPAN records from the device will be received and accepted by
the NAM as they arrive.
Deleting ERSPAN Data Sources Using the Web GUI
To delete an existing ERSPAN data source, use the following steps. Note that if the auto-creation feature
is turned on, and the device continues to send ERSPAN packets to the NAM, the data source will be
recreated again automatically as soon as the next ERSPAN packet arrives. Therefore, if you wish to
delete an existing ERSPAN data source, it is usually advisable to first turn the ERSPAN auto-create
feature off, as described earlier.
Step 1
Click Setup > Traffic > NAM Data Sources
Step 2
Click on the data source you would like to delete to highlight it.
User Guide for the Cisco Network Analysis Module (NAM) Traffic Analyzer, 5.0
2-14
OL-22617-01
Chapter 2
Setting Up The NAM Traffic Analyzer
Traffic
Step 3
Click the Delete button along the bottom of the window.
Deleting ERSPAN Data Sources Using the CLI
To delete a ERSPAN data source using the CLI, use the following steps. Note that when using the CLI,
there are generally two separate phases involved. First you should delete the data source, then delete the
device if you have no other data sources using the same device (for example with a different Engine ID
value). As a shortcut, if you simply delete the device, then all data sources using that device will also be
deleted.
Step 1
Show all data sources so you can find the ID of the one you want to delete:
[email protected]# show data-source
DATA SOURCE ID
DATA SOURCE NAME
TYPE
PORT NUMBER
-----------
:
:
:
:
1
DATA PORT 1
Data Port
1
DATA SOURCE ID
DATA SOURCE NAME
TYPE
PORT NUMBER
-----------
:
:
:
:
2
DATA PORT 2
Data Port
2
DATA SOURCE ID
DATA SOURCE NAME
TYPE
DEVICE ID
DEVICE ADDRESS
ENGINE ID
-----------
:
:
:
:
:
:
3
MyFirstErspanDataSource
ERSPAN (Encapsulated Remote SPAN)
2
192.168.0.1
123
[email protected]#
Step 2
Use the no data-source command to delete the data source:
[email protected]# no data-source 3
Successfully deleted data source 3
[email protected]#
Step 3
Show all devices so you can find the ID of the one you want to delete:
[email protected]# show device
DEVICE ID
DEVICE TYPE
IP ADDRESS
INFORMATION
STATUS
------
:
:
:
:
:
1
ERSPAN (Encapsulated Remote SPAN)
192.168.0.1
No packets received
Inactive
[email protected]#
User Guide for the Cisco Network Analysis Module (NAM) Traffic Analyzer, 5.0
OL-22617-01
2-15
Chapter 2
Setting Up The NAM Traffic Analyzer
Traffic
Step 4
Use the no device command to delete the device:
[email protected]# no device 1
Sucessfully deleted device 1
[email protected]#
Note that if the auto-creation mode is on, and the device continues to send ERSPAN packets to the NAM,
the data source (and device entry) will be recreated again automatically as soon as the next ERSPAN
packet arrives. Therefore, if you wish to delete an existing ERSPAN data source, it is usually advisable
to first turn the ERSPAN auto-create feature off, as described earlier.
Configuring ERSPAN on Devices
There are two ways to configure ERSPAN so that the NAM receives the data:
•
Sending ERSPAN Data to Layer 3 Interface, page 2-16
•
Sending ERSPAN Data Directly to the NAM Management Interface, page 2-17
Sending ERSPAN Data to Layer 3 Interface
To send the data to a layer 3 interface on the Switch housing the NAM, configure the ERSPAN source
session. The ERSPAN destination session then sends the traffic to a NAM data-port. After performing
this configuration, you can select the DATA PORT X data source to analyze the ERSPAN traffic.
Note
This method causes the ERSPAN traffic to arrive on one of the NAM data ports, which is the most
efficient method and will not have any adverse effect on the NAM’s IP connectivity. Therefore, we
recommend this method.
Sample Configuration of ERSPAN Source
monitor session 1 type erspan-source
no shut
source interface Fa 3/47
destination
erspan-id N
ip address aa.bb.cc.dd
origin ip address ee.ff.gg.hh
Where:
•
erspan-id N is the ERSPAN ID
•
aa.bb.cc.dd is the IP address of the destination switch (loopback address or any routable IP address)
•
ee.ff.gg.hh is the source IP address of the ERSPAN traffic
Sample Configuration of ERSPAN Destination
monitor session 1 type erspan-destination
no shut
destination analysis-module 2 data-port 2
source
erspan-id N
ip address aa.bb.cc.dd
Where:
•
erspan-id N matches the ERSPAN ID at the source switch
User Guide for the Cisco Network Analysis Module (NAM) Traffic Analyzer, 5.0
2-16
OL-22617-01
Chapter 2
Setting Up The NAM Traffic Analyzer
Traffic
•
aa.bb.cc.dd is the IP address defined at the destination
You can now connect to the NAM to monitor and capture traffic of the Data Port 2 data source.
Sending ERSPAN Data Directly to the NAM Management Interface
To send the data directly to the NAM management IP address (management-port), configure the
ERSPAN source session. No ERSPAN destination session configuration is required. After performing
this configuration on the Catalyst 6500 switch or Cisco 7600 series router, when ERSPAN packets are
sent to the NAM, it will automatically create a data source for that packet stream. If the auto-create
feature is not enabled, you will have to manually create the data source for this ERSPAN stream of traffic
(see Creating ERSPAN Data Sources Using the Web GUI, page 2-12).
Note
This method causes the ERSPAN traffic to arrive on the NAM management port. If the traffic level is
high, this could have negative impact on the NAM’s performance and IP connectivity.
Sample Configuration
monitor session 1 type erspan-source
no shut
source interface Fa3/47
destination
erspan-id Y
ip address aa.bb.cc.dd
origin ip address ee.ff.gg.hh
Where:
•
Interface fa3/47 is a local interface on the erspan-source switch to be monitored
•
Y is any valid span session number
•
aa.bb.cc.dd is the management IP address of the NAM
•
ee.ff.gg.hh is the source IP address of the ERSPAN traffic
VACL
A VLAN access control (VACL) list can forward traffic from either a WAN interface or VLANs to a data
port on the NAM. A VACL provides an alternative to using SPAN; a VACL can provide access control
based on Layer 3 addresses for IP and IPX protocols. The unsupported protocols are access controlled
through the MAC addresses. A MAC VACL cannot be used to access control IP or IPX addresses.
Configuring VACL on a WAN Interface
Because WAN interfaces do not support the SPAN function, you must use the switch CLI to manually
configure a VACL in order to monitor WAN traffic with the NAM. This feature only works for IP traffic
over the WAN interface.
VACL can also be used of there is no available SPAN session to direct traffic to the NAM. In this case,
a VACL can be set up in place of a SPAN for monitoring VLAN traffic.
The following example shows how to configure a VACL on an ATM WAN interface and forward both
ingress and egress traffic to the NAM. These commands are for switches running Cisco IOS version
12.1(13)E1 or higher. For more information on using these features, see your accompanying switch
documentation.
Cat6509#config terminal
Cat6509(config)# access-list 100 permit ip any any
User Guide for the Cisco Network Analysis Module (NAM) Traffic Analyzer, 5.0
OL-22617-01
2-17
Chapter 2
Setting Up The NAM Traffic Analyzer
Traffic
Cat6509(config)# vlan access-map wan 100
Cat6509(config-access-map)# match ip address 100
Cat6509(config-access-map)# action forward capture
Cat6509(config-access-map)# exit
Cat6509(config)# vlan filter wan interface AM6/0/0.1
Cat6509(config)# analysis module 3 data-port 1 capture allowed-vlan 1-4094
Cat6509(config)# analysis module 3 data-port 1 capture
Cat6509(config)# exit
To monitor egress traffic only, get the VLAN ID that is associated with the WAN interface by using the
following command:
Cat6509#show cwan vlan
Hidden
VLAN
swidb->i_number
1017
94
Interface
ATM6/0/0.1
Once you have the VLAN ID, configure the NAM data port using the following command:
Cat6509(config)# analysis module 3 data-port 1 capture allowed-vlan 1017
To monitor ingress traffic only, replace the VLAN number in the capture configuration with the native
VLAN ID that carries the ingress traffic. For example, if VLAN 1 carries the ingress traffic, you would
use the following command:
Cat6509(config)# analysis module 3 data-port 1 capture allowed-vlan 1
Configuring VACL on a LAN VLAN
For VLAN Traffic monitoring on a LAN, traffic can be sent to the NAM by using the SPAN feature of
the switch. However, in some instances when the traffic being spanned exceeds the monitoring capability
of the NAM, you might want to pre-filter the LAN traffic before it is forwarded. This can be done by
using VACL.
The following example shows how to configure VACL for LAN VLAN interfaces. In this example, all
traffic directed to the server 172.20.122.226 on VLAN 1 is captured and forwarded to the NAM located
in slot 3.
Cat6509#config terminal
Cat6509#(config)#access-list 100 permit ip any any
Cat6509#(config)#access-list 110 permit ip any host 172.20.122.226
Cat6509#(config)#vlan access-map lan 100
Cat6509#(config-access-map)match ip address 110
Cat6509#(config-access-map)#action forward capture
Cat6509#(config-access-map)#exit
Cat6509#(config)#vlan access-map lan 200
Cat6509#(config-access-map)#match ip address 100
Cat6509#(config-access-map)#action forward
Cat6509#(config-access-map)#exit
Cat6509#(config)#vlan filter lan vlan-list 1
Cat6509#(config)#analysis module 3 data-port 1 capture allowed-vlan 1
Cat6509#(config)#analysis module 3 data-port 1 capture
Cat6509#(config)#exit
NetFlow
The NAM can function as a NetFlow consumer, or a NetFlow producer (new in NAM Traffic Analyzer
5.0), or both. For information about NAM as an NDE producer, see Configuring NetFlow Data Export,
page 2-51.
User Guide for the Cisco Network Analysis Module (NAM) Traffic Analyzer, 5.0
2-18
OL-22617-01
Chapter 2
Setting Up The NAM Traffic Analyzer
Traffic
As a consumer, the NAM can receive NetFlow packets on its management port from devices such as
Cisco routers and switches. Those records are stored in its collection database as if that traffic had
appeared on one of the NAM data ports. The NAM understands NetFlow v1, v5, v6, v7, v8, and v9.
Incoming NetFlow data is parsed by the NAM, stored in its internal database, and presented in the GUI
in the same way as traffic from other data sources.
For the NAM to receive NetFlow packets from an external switch or router, that device must be
configured by export flow records to the NAM’s IP address and the correct UDP port number. The default
port number on which the NAM listens for NetFlow packets is port 3000. This can be modified using the
NAM CLI, but the important point is that the same port must be configured on the NAM and the
exporting device(s). Depending on the external device, you may need to enable the NetFlow feature on
a per-interface basis.
See the following sections about NetFlow as a data source:
•
Understanding NetFlow Interfaces, page 2-19
•
Understanding NetFlow Flow Records, page 2-19
•
Managing NetFlow Data Sources, page 2-20
•
Configuring NetFlow on Devices, page 2-20
Understanding NetFlow Interfaces
To use a device as an NDE data source for the NAM, you must configure the device itself to export NDE
packets to UDP port 3000 on the NAM. You might need to configure the device itself on a per-interface
basis. An NDE device is identified by its IP address. In NAM Traffic Analyzer 5.0, the default UDP port
of 3000 can be changed with a NAM CLI command (see Configuring NetFlow on Devices, page 2-20).
You can define additional NDE devices by specifying the IP addresses and (optionally) the community
strings. Community strings are used to upload convenient text strings for interfaces on the managed
devices that are monitored in NetFlow records.
Remote NDE devices may export information pertaining to any or all of their individual interfaces. The
NAM keeps track of the interface associated with any flow information received from the device. On the
NDE Interface Analysis page (Analyze > Traffic > NDE Interface), you can view information for any
selected interface on the device. This page will display the interface utilization or throughput over time,
as well as show the top Applications, Hosts, and DSCP groups in both the input and output directions
for the interface.
Understanding NetFlow Flow Records
An NDE packet contains multiple flow records. Each flow record has two fields:
Note
•
Input SNMP ifIndex
•
Output SNMP ifIndex
This information might not be available because of NDE feature incompatibility with your Cisco IOS
version, or because of an NDE flow-mask configuration.
In most cases, turning on NetFlow on an interface populates the NetFlow cache in the device with flows
that are in the input direction of the interface. As a result, the input SNMP ifIndex field in the flow record
has the ifIndex of the interface on which NetFlow was turned on. Sample NetFlow Network, Figure 2-2,
shows a sample network configuration with a NetFlow router.
User Guide for the Cisco Network Analysis Module (NAM) Traffic Analyzer, 5.0
OL-22617-01
2-19
Chapter 2
Setting Up The NAM Traffic Analyzer
Traffic
Figure 2-2
Sample NetFlow Network
Host A
Host C
a
b
c
Router
91629
Host B
Table 2-8, Reporting Flow Records lists the reported flows if NetFlow is enabled on interface a.
Table 2-8
Reporting Flow Records
Input Interface
Output Interface
Are Flows Reported?
a
b
Yes
a
c
Yes
b
c
No
b
a
No
c
a
No
c
b
No
Managing NetFlow Data Sources
A data source entry must exist on the NAM in order for it to accept NetFlow records from an external
device. Data source entries may be created manually using the NAM web GUI or the CLI. When
manually creating a data source, you may specify any name you want for the data source.
For convenience however, manual creation of NetFlow data sources is not necessary. There is an
“auto-create” feature which is enabled by default. With the auto-create feature, a new data source will
automatically be created for each device which sends NDE traffic to the NAM when the first packet is
received.
Auto-created NetFlow data sources will be assigned a name in the format NDE-<IP
Address>-ID-<Integer>, where <IP Address> is the IP address of the exporting device, and <Integer>
is the Engine-ID that the device populates in the packets (part of the NetFlow Data Export standard). An
example might be “NDE-192.168.0.1-ID-12” for device 192.168.0.1 sending NDE packets with the
Engine ID field set to 12. You can edit these auto-created data sources and change the name if you want
to, as well as optionally specifying SNMP credentials for the device, as described later in this document.
Configuring NetFlow on Devices
The configuration commands for NetFlow devices to export NDE packets to the NAM are platform and
device specific. The example configuration commands provided here are the ones most commonly found
for devices running Cisco IOS. For more detailed information, see your device documentation.
User Guide for the Cisco Network Analysis Module (NAM) Traffic Analyzer, 5.0
2-20
OL-22617-01
Chapter 2
Setting Up The NAM Traffic Analyzer
Traffic
For Devices Running Cisco IOS
Step 1
Select the interface on which you wish to turn on routed flow cache.
Prompt# configure terminal
Prompt(config)# interface <type slot/port>
Prompt(config-if)# ip route-cache flow
Step 2
Export routed flow cache entries to UDP port 3000 of the NAM.
Prompt(config)# ip flow-export destination <NAM IP address> 3000
Note
Newer Cisco IOS images support Flexible NetFlow. This feature allows you to configure a router
or switch to export certain fields of network traffic flow to the NAM. From the NAM’s
perspective, it is not practical to have incomplete flow information, such as flow records with no
packet count but byte count. Another exactly is flow records without a source address but with
a destination address. These incomplete flow records make the presentation in the NAM GUI
confusing. Cisco highly recommends that you export full flow (for example, NDEv5 format)
information to the NAM.
For Devices Supporting Multi-Layer Switching Cache Running Cisco IOS
Step 1
Select the version of NDE.
Prompt(config)# mls nde sender version <version-number>
Note
Step 2
The NAM supports NDE versions 1, 5, 6, 7, 8, and 9 aggregation caches.
Select NDE flow mask.
Prompt(config)# mls flow ip full
Step 3
Enable NetFlow export.
Prompt(config)# mls nde sender
Step 4
Export NetFlow to UDP port 3000 of the NAM.
Prompt(config)# ip flow-export destination <NAM IP address> 3000
For Devices Supporting NDE v8 Aggregations Running Cisco IOS
Step 1
Select a v8 aggregation.
Prompt(config)# ip flow-aggregation cache <aggregation-type>
Where aggregation-type can be:
•
destination-prefix
•
source-prefix
User Guide for the Cisco Network Analysis Module (NAM) Traffic Analyzer, 5.0
OL-22617-01
2-21
Chapter 2
Setting Up The NAM Traffic Analyzer
Traffic
Step 2
•
protocol-port
•
prefix
Enable the aggregation cache.
Prompt(config-flow-cache)# enable
Step 3
Export the flow entries in the aggregation cache to NAM UDP port 3000.
Prompt(config-flow-cache)#export destination <NAM address> 3000
For Devices That Support NDE Export From Bridged-Flows Statistics
Step 1
Enable bridged-flows statistics on the VLANs.
Prompt>(enable) set mls bridged-flow-statistics enable <vlan-list>
Step 2
Export the NDE packets to UPD port 3000 of the NAM
Prompt>(enable) set mls nde <NAM address> 3000
For NAMs Located in a Device Slot
If the NAM is located in one of the device slots, the device can be set up to export NDE packets to the
NAM.
Step 1
Select the version of NDE.
Prompt>(enable) set mls nde version <nde-version-number>
Step 2
Select NDE flow mask to be full.
Prompt>(enable) sel mls nde full
Step 3
Enable NDE export.
Prompt>(enable) set mls nde enable
Step 4
Export the NDE packets to the NAM.
Prompt>(enable) set snmp extendedrmon netflow enable <NAM-slot>
Enabling Auto-Creation of NetFlow Data Sources Using the Web GUI
To configure the NAM to automatically create data sources when it receives NDE packets from an
external device, use the following steps. Remember however, that the auto-create feature is turned on by
default, so these steps are typically not necessary.
Step 1
Click Setup > Traffic > NAM Data Sources.
Step 2
Click the Auto Create button on the bottom left of the window.
Step 3
Check the Netflow check box to toggle auto-creation of NDE data sources on.
User Guide for the Cisco Network Analysis Module (NAM) Traffic Analyzer, 5.0
2-22
OL-22617-01
Chapter 2
Setting Up The NAM Traffic Analyzer
Traffic
Step 4
Click the Submit button.
Enabling Auto-Creation of NetFlow Data Sources Using the CLI
Configuration of the auto-create feature is also possible using the NAM CLI. Remember that the
auto-create feature is turned ON by default, so in most cases these steps are not necessary.
To configure the NAM to automatically create data sources when it receives NDE packets from an
external device, use the following steps:
Use the autocreate-data-source command as follows:
[email protected]# autocreate-data-source netflow
NDE data source autocreate successfully ENABLED
The NAM will now automatically create a NetFlow data source for each device that sends NetFlow
packets to it. The data source will have the specific Engine ID that is populated by the device in the NDE
packets sent to the NAM. If the same device happens to send NDE packets to the NAM with different
Engine ID values, a separate data source will be created for each unique Engine ID sent from the device.
Disabling Auto-Creation of NetFlow Data Sources Using the Web GUI
Step 1
Click Setup > Traffic > NAM Data Sources.
Step 2
Click the Auto Create button on the bottom left of the window.
Step 3
Uncheck the Netflow check box to toggle auto-creation of NDE data sources off.
Step 4
Click the Submit button.
Disabling Auto-Creation of NetFlow Data Sources Using the CLI
To disable auto-creation of NetFlow data sources, use the no autocreate-data-source command as
follows:
[email protected]# no autocreate-data-source netflow
NDE data source autocreate successfully DISABLED
[email protected]#
Creating NetFlow Data Sources Using the Web GUI
To manually configure a NetFlow data source on the NAM using the GUI, for example if the
auto-creation feature is turned OFF, use the following steps:
Step 1
Click Setup > Traffic > NAM Data Sources.
Step 2
Click the Create button along the bottom of the window.
Step 3
In the Type drop-down list, select “NetFlow.”
Step 4
Enter the IP address of the device that will export NDE to the NAM (required).
Step 5
Give the Data Source a name. This name will appear anywhere there's a Data Source drop-down list.
User Guide for the Cisco Network Analysis Module (NAM) Traffic Analyzer, 5.0
OL-22617-01
2-23
Chapter 2
Setting Up The NAM Traffic Analyzer
Traffic
Step 6
(Optional) If you know the specific value of the Engine ID on the device you would like to monitor,
check the “Engine” check box, and enter the value of the Engine ID. If the “Engine” check box is left
unchecked, then all NDE records exported by the device will be grouped into the same data source,
regardless of the Engine ID populated in the NDE packets (in most cases the Engine check box can be
left blank and you don't have to worry about the Engine ID value).
Some devices have multiple Engines which independently export NDE records. For example, on some
Cisco routers, NDE records can be exported by the Supervisor module as well as individual line cards.
The packets exported may have the same source IP address, but the Engine ID exported by the Supervisor
will be a different value than the Engine ID(s) exported by the line card(s). If you want to include only
one Engine in the data source, you must check the “Engine” box and provide the value of that Engine ID.
Step 7
(Optional) SNMP v1/v2c RO Community String: If SNMP v1 or v2c will be used to communicate with
the device, enter the community string that is configured on the device that is going to export NetFlow
packets to the NAM.
Step 8
(Optional) “Enable SNMP v3”: If SNMP v3 will be used to communicate with the device, fill in the
fields within the v3-specific dialog.
Step 9
(Optional) If desired, fill in the SNMP credentials for the device. If valid SNMP credentials are provided,
the NAM can upload readable text strings from the device to describe the interfaces on that device rather
than just displaying the interfaces as numbers. You may specify either SNMPv2c or SNMPv3
credentials. See Table 2-9, SNMP Credentials.
Table 2-9
Step 10
SNMP Credentials
Field
Description
Mode: No Auth, No Priv
SNMP will be used in a mode with no authentication and no
privacy.
Mode: Auth, No Priv
SNMP will be used in a mode with authentication, but no
privacy.
Mode: Auth and Priv
SNMP will be used in a mode with both authentication and
privacy.
User Name
Enter a username, which will match the username
configured on the device.
Auth Password
Enter the authentication password associated with the
username that was configured on the device. Verify the
password.
Auth Algorithm
Choose the authentication standard which is configured on
the device (MD5 or SHA-1).
Privacy Password
Enter the privacy password, which is configured on the
device. Verify the password.
Privacy Algorithm
Enter the privacy algorithm, which is configured on the
device (AES or DES).
Click the Submit button.
User Guide for the Cisco Network Analysis Module (NAM) Traffic Analyzer, 5.0
2-24
OL-22617-01
Chapter 2
Setting Up The NAM Traffic Analyzer
Traffic
Creating NetFlow Data Sources Using the CLI
To manually configure a NetFlow data source on the NAM using the CLI, for example if the
auto-creation feature is turned off, use the following steps. Note that when using the CLI, there are two
separate phases involved. First you must create a “device” entry on the NAM and remember the device
ID. Then you must create a data source entry using this device ID. For convenience, these two phases
are combined together when using the GUI to create NetFlow data sources.
Step 1
Enter the command device netflow. You will now be in netflow device subcommand mode as shown
here:
[email protected]# device netflow
Entering into subcommand mode for this command.
Type 'exit' to apply changes and come out of this mode.
Type 'cancel' to discard changes and come out of this mode.
[email protected](sub-device-netflow)#
Step 2
Enter ? to see all the command options available, as in the example below:
[email protected](sub-device-netflow)# ?
?
- display help
address
- device IP address (*)
cancel
- discard changes and exit from subcommand mode
community
- SNMPv2c community string
exit
- create device and exit from sub-command mode
help
- display help
show
- show current config that will be applied on exit
snmp-version
- SNMP version to use to communicate with device
v3-auth-passphrase
- SNMPv3 authentication passphrase
v3-auth-protocol
- SNMPv3 authentication protocol
v3-priv-passphrase
- SNMPv3 privacy passphrase
v3-priv-protocol
- SNMPv3 privacy protocol
v3-sec-level
- SNMPv3 security level
v3-username
- SNMPv3 username
(*) - denotes a mandatory field for this configuration.
[email protected](sub-device-netflow)#
Step 3
Enter the IP address of the device as shown in this example (required):
[email protected](sub-device-netflow)# address 192.168.0.1
Step 4
If desired, enter the SNMP credentials for the device, as in the example below. If you specify
snmp-version v2c, then you should enter the community string for the device. If you specify
snmp-version v3, then you should enter the security level, username, authentication protocol,
authentication passphrase, privacy protocol, and privacy passphrase.
[email protected](sub-device-netflow)# snmp-version v2c
[email protected](sub-device-netflow)# community public
Step 5
Type show to look at the device configuration that will be applied and verify that it is correct:
[email protected](sub-device-netflow)# show
DEVICE TYPE
DEVICE ADDRESS
SNMP VERSION
V2C COMMUNITY
V3 USERNAME
:
:
:
:
:
NDE (Netflow Data Export)
192.168.0.1
SNMPv2c
public
User Guide for the Cisco Network Analysis Module (NAM) Traffic Analyzer, 5.0
OL-22617-01
2-25
Chapter 2
Setting Up The NAM Traffic Analyzer
Traffic
V3
V3
V3
V3
V3
SECURITY LEVEL
AUTHENTICATION
AUTH PASSPHRASE
PRIVACY
PRIV PASSPHRASE
: No authentication, no privacy
: MD5
:
: DES
:
[email protected](sub-device-netflow)#
Step 6
Type exit to come out of the subcommand mode and create the device. Remember the ID value that was
assigned to the new device, you will need it to create the data source!
[email protected](sub-device-netflow)# exit
Device created successfully, ID = 1
[email protected]#
Step 7
Enter the command data-source netflow. You will now be in netflow data source subcommand mode as
shown here:
[email protected]# data-source netflow
Entering into subcommand mode for this command.
Type 'exit' to apply changes and come out of this mode.
Type 'cancel' to discard changes and come out of this mode.
[email protected](sub-data-source-netflow)#
Step 8
Enter ? to see all the command options available, as in the example below:
[email protected](sub-data-source-netflow)# ?
?
- display help
cancel
- discard changes and exit from subcommand mode
device-id
- netflow device ID (*)
engine-id
- netflow Engine ID
exit
- create data-source and exit from sub-command mode
help
- display help
name
- data-source name (*)
show
- show current config that will be applied on exit
(*) - denotes a mandatory field for this configuration.
[email protected](sub-data-source-netflow)#
Step 9
Enter the device ID from Step 4 (required):
[email protected](sub-data-source-netflow)# device-id 1
Step 10
Enter the name you would like for the data source (required):
[email protected](sub-data-source-netflow)# name MyFirstNdeDataSource
Step 11
If desired, supply the specific Engine ID for this NDE data source (optional):
[email protected](sub-data-source-netflow)# engine-id 123
Step 12
Type show to look at the data source configuration that will be applied and verify that it is correct:
[email protected](sub-data-source-netflow)# show
DATA SOURCE NAME
DATA SOURCE TYPE
DEVICE ID
DEVICE ADDRESS
ENGINE ID
:
:
:
:
:
MyFirstNdeDataSource
NDE (Netflow Data Export)
1
192.168.0.1
123
[email protected](sub-data-source-netflow)#
User Guide for the Cisco Network Analysis Module (NAM) Traffic Analyzer, 5.0
2-26
OL-22617-01
Chapter 2
Setting Up The NAM Traffic Analyzer
Traffic
Step 13
Type exit to come out of the subcommand mode and create the data source:
[email protected](sub-data-source-netflow)# exit
Data source created successfully, ID = 3
The data source is now created, and NDE records from the device will be received and accepted by the
NAM as they arrive.
Deleting NetFlow Data Sources Using the Web GUI
To delete an existing NetFlow data source, use the following steps. Note that if the auto-creation feature
is turned on, and the device continues to send NDE packets to the NAM, the data source will be
re-created again automatically as soon as the next NDE packet arrives. Therefore, if you wish to delete
an existing NetFlow data source, it is usually advisable to first turn the NetFlow auto-create feature off,
as described earlier.
Step 1
Click Setup > Traffic > NAM Data Sources.
Step 2
Click on the data source you would like to delete.
Step 3
Click the Delete button along the bottom of the window.
Deleting NetFlow Data Sources Using the CLI
To delete a NetFlow data source using the CLI, use the following steps. Note that when using the CLI,
there are generally two separate phases involved. First you should delete the data source, then delete the
device if you have no other data sources using the same device (for example with a different Engine ID
value). As a shortcut, if you simply delete the device, then all data sources using that device will also
be deleted.
Step 1
Show all data sources so you can find the ID of the one you want to delete:
[email protected]# show data-source
DATA SOURCE ID
DATA SOURCE NAME
TYPE
PORT NUMBER
-----------
:
:
:
:
1
DATA PORT 1
Data Port
1
DATA SOURCE ID
DATA SOURCE NAME
TYPE
PORT NUMBER
-----------
:
:
:
:
2
DATA PORT 2
Data Port
2
DATA SOURCE ID
DATA SOURCE NAME
TYPE
DEVICE ID
DEVICE ADDRESS
ENGINE ID
-----------
:
:
:
:
:
:
3
MyFirstNdeDataSource
NDE (Netflow Data Export)
2
192.168.0.1
123
User Guide for the Cisco Network Analysis Module (NAM) Traffic Analyzer, 5.0
OL-22617-01
2-27
Chapter 2
Setting Up The NAM Traffic Analyzer
Traffic
[email protected]#
Step 2
Use the no data-source command to delete the data source:
[email protected]# no data-source 3
Successfully deleted data source 3
[email protected]#
Step 3
Show all devices so you can find the ID of the one you want to delete:
[email protected]# show device
DEVICE ID
DEVICE TYPE
IP ADDRESS
SNMP VERSION
V2C COMMUNITY
V3 USERNAME
V3 SECURITY LEVEL
V3 AUTHENTICATION
V3 AUTH PASSPHRASE
V3 PRIVACY
V3 PRIV PASSPHRASE
INFORMATION
STATUS
------
:
:
:
:
:
:
:
:
:
:
:
:
:
1
NDE (Netflow Data Export)
192.168.0.1
SNMPv2c
public
No authentication, no privacy
MD5
DES
No packets received
Inactive
[email protected]#
Step 4
Use the no device command to delete the device:
[email protected]# no device 1
Successfully deleted device 1
[email protected]#
Note that if the auto-creation mode is on, and the device continues to send NDE packets to the NAM,
the data source (and device entry) will be re-created again automatically as soon as the next NDE packet
arrives. Therefore, if you wish to delete an existing NetFlow data source, it is usually advisable to first
turn the NetFlow auto-create feature off, as described earlier.
Testing NetFlow Devices
You can test the SNMP community strings for the devices in the Devices table. To test a device, select
it from the Devices table, then click Test. The Device System Information Dialog Box displays.
Table 2-10, Device System Information Dialog Box describes the fields.
Table 2-10
Device System Information Dialog Box
Field
Description
Name
Name of the device.
Hardware
Hardware description of the device.
Device Software Version
The current software version running on the device.
System Uptime
Total time the device has been running since the last
reboot.
Location
Location of the device.
User Guide for the Cisco Network Analysis Module (NAM) Traffic Analyzer, 5.0
2-28
OL-22617-01
Chapter 2
Setting Up The NAM Traffic Analyzer
Traffic
Table 2-10
Device System Information Dialog Box (continued)
Field
Description
Contact
Contact information for the device.
SNMP read from device
SNMP read test result. For the local device only.
If the device is sending NetFlow Version 9 (V9) and the NAM has received the NDE templates, then a
V9 Templates button appears below the Device System Information window.
Note
NetFlow v9 templates do not appear in all NDE packets. When there are no templates, the V9 Templates
button does not appear.
WAAS
Understanding WAAS
Cisco Wide Area Application Services (WAAS) software optimizes the performance of TCP-based
applications operating in a wide area network (WAN) environment and preserves and strengthens branch
security. The WAAS solution consists of a set of devices called Wide Area Application Engines (WAEs)
that work together to optimize WAN traffic over your network.
When client and server applications attempt to communicate with each other, the network devices
intercept and redirect this traffic to the WAEs to act on behalf of the client application and the destination
server.
WAEs provide information about packet streams traversing through both LAN and WAN interfaces of
WAAS WAEs. Traffic of interest can include specific servers and types of transaction being exported.
NAM processes the data exported from the WAAS and performs application response time calculations
and enters the data into reports you set up.
The WAEs examine the traffic and use built-in application policies to determine whether to optimize the
traffic or allow it to pass through your network not optimized.
You can use the WAAS Top Talkers Detail Dashboard to analyze the traffic for optimization. See Top
Talkers Detail, page 3-17 for more information.
Cisco WAAS helps enterprises to meet the following objectives:
•
Provide branch office employees with LAN-like access to information and applications across a
geographically distributed network.
•
Migrate application and file servers from branch offices into centrally managed data centers.
•
Minimize unnecessary WAN bandwidth consumption through the use of advanced compression
algorithms.
•
Provide print services to branch office users. WAAS allows you to configure a WAE as a print server
so you do not need to deploy a dedicated system to fulfill print requests.
•
Improve application performance over the WAN by addressing the following common issues:
– Low data rates (constrained bandwidth)
– Slow delivery of frames (high network latency)
– Higher rates of packet loss (low reliability)
User Guide for the Cisco Network Analysis Module (NAM) Traffic Analyzer, 5.0
OL-22617-01
2-29
Chapter 2
Setting Up The NAM Traffic Analyzer
Traffic
For more information about WAAS and configuring the WAAS components, see the document:
Cisco Wide Area Application Services Configuration Guide, OL-16376-01
http://www.cisco.com/en/US/docs/app_ntwk_services/waas/waas/v4019/configuration/guide/
waas4cfg.html
Response Time Monitoring from WAAS Data Sources
The NAM processes the TCP flow data exported from the WAAS and performs application response time
(ART) calculations and reports. You use the NAM GUI to create a WAAS data source to monitor WAAS
traffic statistics. In addition to ART, NAM monitors and reports other traffic statistics of the WAAS data
sources including application, host, and conversation information.
The NAM provides different ART metrics by collecting data at different points as packets flow along
their paths. The NAM provides five different collection points, each represented by a WAAS data source.
Figure 2-3, “WAAS Data Sources (Data Collection Points)”, shows an example of the data collection
points. The solid line represents data exported from a WAAS device and/or directly monitored traffic
like SPAN. The broken line represents data exported from a WAAS device only.
WAAS Data Sources (Data Collection Points)
Edge
WAE
Client
Client
Client
WAN
TCP 1
Server
WAN
TCP 2
NAM
Core
WAE
Server
Server
TCP 3
205558
Figure 2-3
You can use the NAM GUI to configure data sources at the locations in the network described in
Table 2-11, WAAS Data Collection Points.
Table 2-11
WAAS Data Collection Points
Setting
Description
Client
This setting configures the WAE device to export the original (LAN side) TCP
flows originated from its clients to NAM for monitoring. To monitor this point,
configure a Client data source.
Client WAN
This setting configures the WAE device to export the optimized (WAN side)
TCP flows originated from its clients to NAM for monitoring. To monitor this
point, configure a Client WAN data source.
Server WAN
This setting configures the WAE device to export the optimized (WAN side)
TCP flows from its servers to NAM for monitoring. To monitor this point,
configure a Server WAN data source.
User Guide for the Cisco Network Analysis Module (NAM) Traffic Analyzer, 5.0
2-30
OL-22617-01
Chapter 2
Setting Up The NAM Traffic Analyzer
Traffic
Table 2-11
WAAS Data Collection Points (continued)
Setting
Description
Server
This setting configures the WAE device to export the original (LAN side) TCP
flows from its servers to NAM for monitoring. To monitor this point, configure
a Server data source.
Passthrough
This setting configures the WAE device to export the TCP flows that are passed
through unoptimized.
You can also configure a data source to use Export Passthrough data. For more information about
configuring WAAS data sources, see Editing WAAS Data Sources, page 2-34.
Monitoring Client Data Sources
By monitoring the TCP connections between the client and the WAE device (Client segment in
Figure 2-3), you can measure the following ART metrics:
•
Total Response Time as experienced by the client
•
Total Transaction Time as experienced by the client
•
Bandwidth usage (bytes/packets) before optimization
•
Number of transactions and connections.
•
Network Time broken down into two segments: client-edge and edge-server
Monitoring WAN Data Sources
By monitoring the TCP connections between the edge and core WAE devices (Client WAN and Server
WAN segments in Figure 2-3), you can measure the following:
•
Bandwidth usage (bytes/packets) after optimization
•
Network Time of the WAN segment
Monitoring Server Data Sources
By monitoring the TCP connections between the core WAE devices and the servers (Server segment in
Figure 2-3), you can measure the following ART metrics:
Note
•
Server Response Time (without proxy acceleration/caching server)
•
Network Time between the core WAE device and the servers
NAM measures Network Time by monitoring the TCP three-way handshake between the devices.
User Guide for the Cisco Network Analysis Module (NAM) Traffic Analyzer, 5.0
OL-22617-01
2-31
Chapter 2
Setting Up The NAM Traffic Analyzer
Traffic
Deployment Scenarios
Table 2-12, WAAS Data Source Configurations lists six different deployment scenarios you might
consider to monitor the optimized traffic on your WAAS network. Scenario #1 is typical when using
WS-SVC-NAM-1 and WS-SVC-NAM-2 blades. Scenario #2 is typical when using NME-NAM devices.
Table 2-12
WAAS Data Source Configurations
Deployment Scenario
1
2
3
4
5
Edge WAE Data Source
Core WAE Data Source
Client
Server
•
Clients in the edge (branch)
•
Servers in the core (data center)
•
NAM in the core
•
Clients in the edge (branch)
Client
•
Servers in the core (data center)
Client WAN
•
NAM in the edge
•
Servers in the edge (branch)
•
Clients in the core (data center)
•
NAM in the core
•
Servers in the edge (branch)
Server
•
Clients in the core (data center)
Server WAN
•
NAM in the edge
•
Clients and servers in the edge (branch) and the core (data
center)
•
NAM in the core
Server WAN
Server
Server
Client
Client WAN
Client
Client
Client
Server
Server
Client WAN
Server WAN
6
•
Clients and servers in the edge (branch) and the core (data
center)
Client
Client
Server
Server
•
NAM in the edge
Client WAN
Server WAN
Managing WAAS Devices
Before you can monitor WAAS traffic, you must first configure the WAAS device to export WAAS flow
record data to the NAM using the WAAS command-line interface (CLI) flow monitor command like the
following:
flow monitor tcpstat-v1 host <nam IP address>
flow monitor tcpstat-v1 enable
After you enable flow export to the NAM using WAAS CLI commands like those above, WAAS devices
will be detected and automatically added to the NAM’s WAAS device list.
User Guide for the Cisco Network Analysis Module (NAM) Traffic Analyzer, 5.0
2-32
OL-22617-01
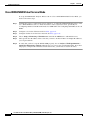
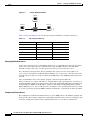
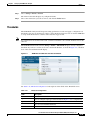
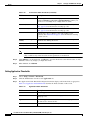
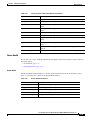
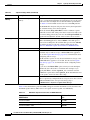
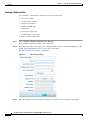
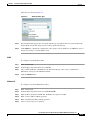
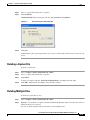
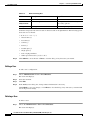
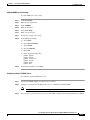
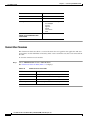
Chapter 2
Setting Up The NAM Traffic Analyzer
Traffic
You must then configure the WAAS segments you want to monitor as WAAS data sources: Client, Client
WAN, Server WAN, and/or Server. See Editing WAAS Data Sources, page 2-34, for more detailed
information.
You can also use the Central Manager (CM) to centrally issue WAAS CLI commands to configure a large
number of WAEs at one time.
Note
In addition to configuring the WAAS devices, you must specify which application servers you want to
monitor among the servers being optimized by WAAS devices. See WAAS Monitored Servers,
page 2-80, for more detailed information.
For more information about WAAS and configuring the WAAS components, see the document:
Cisco Wide Area Application Services Configuration Guide, OL-16376-01
http://www.cisco.com/en/US/docs/app_ntwk_services/waas/waas/v4019/configuration/guide/
waas4cfg.html
This section contains the following topics:
•
Adding Data Sources for New WAAS Device, page 2-33
•
Editing WAAS Data Sources, page 2-34
•
Deleting a WAAS Data Source, page 2-34
Adding Data Sources for New WAAS Device
The NAM uses WAAS data sources to monitor traffic collected from different WAAS segments: Client,
Client WAN, Server WAN, and Server. Each WAAS segment is represented by a data source. You can
set up the NAM to monitor and report other traffic statistics of the WAAS data sources such as
application, host, and conversation information in addition to the monitored Response Time metrics.
Note
This step is not usually necessary because export-enabled WAAS devices are detected and added
automatically. See Managing WAAS Devices, page 2-32, for more information about how to enable
WAAS export to the NAM.
To manually add a WAAS device to the list of devices monitored by the NAM:
Step 1
Choose Setup > Traffic > NAM Data Sources.
Step 2
Click Create.
The NAM Data Source Configuration Dialog appears.
Step 3
Choose “WAAS” from the list of Types.
Step 4
Enter the device IP address in the IP field.
Step 5
Check the check boxes for the appropriate WAAS Segments. See (Table 2-11).
Step 6
(Optional) If Response Time Export is enabled (see Custom Export, page 2-55), and you want to export
passthrough traffic, check the Passthrough Response Time check box.
Step 7
Click Submit to add the new WAAS custom data source.
User Guide for the Cisco Network Analysis Module (NAM) Traffic Analyzer, 5.0
OL-22617-01
2-33
Chapter 2
Setting Up The NAM Traffic Analyzer
Traffic
Editing WAAS Data Sources
The NAM uses WAAS data sources to monitor traffic collected from different WAAS segments: Client,
Client WAN, Server WAN, and Server. Each WAAS segment is represented by a data source. You can
set up the NAM to monitor and report other traffic statistics of the WAAS data sources such as
application, host, and conversation information in addition to the monitored Response Time metrics.
To edit a WAAS device’s custom data source:
Step 1
Choose Setup > Traffic > NAM Data Sources. The data sources are displayed.
Step 2
Click the WAAS device you want to modify, and then click the Edit button.
You can configure the WAAS data sources to monitor the following WAAS segments as shown in
Figure 2-3, WAAS Data Sources (Data Collection Points):
•
Client—This setting configures the WAE device to export the original (LAN side) TCP flows
originated from its clients to NAM for monitoring.
•
Client WAN— This setting configures the WAE device to export the optimized (WAN side) TCP
flows originated from its clients to NAM for monitoring.
•
Server WAN—This setting configures the WAE device to export the optimized (WAN side) TCP
flows from its servers to NAM for monitoring.
•
Server—This setting configures the WAE device to export the original (LAN side) TCP flows from
its servers to NAM for monitoring.
SPAN data sources might take the place of the WAE Server data sources listed in Table 2-12. For
example, if you already configure SPAN to monitor the server LAN traffic, it is not necessary to enable
the Server data source on the WAE device.
Note
Step 3
The following step is optional and applies only when the NAM is configured to export data to an External
Response Time Reporting Console, such as the NetQos Super Agent.
To export WAAS pass-through data to the External Response Time Reporting Console, check the
Passthrough Response Time check box.
Note
WAAS pass-through data is not analyzed by the NAM.
See Custom Export, page 2-55 for more information.
Deleting a WAAS Data Source
To delete a WAAS custom data source:
Step 1
Choose Setup > Traffic > NAM Data Sources. The data sources are displayed.
Step 2
Choose the WAAS custom data source you want to delete, then click the Delete button.
A dialog box displays the device address and asks if you are sure you want to delete the device.
User Guide for the Cisco Network Analysis Module (NAM) Traffic Analyzer, 5.0
2-34
OL-22617-01
Chapter 2
Setting Up The NAM Traffic Analyzer
Traffic
Auto Create of New WAAS Devices
If you have numerous WAE devices, you can set up the NAM to configure newly discovered WAE
devices using a predefined configuration template using the NAM Auto Config option.
Note
If most of your WAE devices are edge WAE, you might want to set the auto config to be that of the edge
device, then manually configure the data center WAE. For example, select the Client segment for
monitoring.
To configure WAAS auto-config:
Step 1
Choose Setup > Traffic > NAM Data Sources. The data sources are displayed.
Step 2
Click the Auto Create button.
The NAM Data Source Configuration Dialog displays.
Step 3
Check the WAAS check box.
Step 4
Check the check boxes for the desired Segments. See Editing WAAS Data Sources, page 2-34, for more
information.
Hardware Deduplication
Note
This section applies only to Cisco NAM 2200 Series appliances.
NAM 5.0 supports hardware-based detection of duplicate packets and allows you to configure a single
deduplication filter across all adapter ports.
After you enable deduplication, the NAM appliance detects and filters the duplicated packets. The packet
is identified as duplicated if all inspected segments match another packet within the specific time
window.
In addition to the duration-based timeout, there is also a fixed packet-count timeout. There cannot be
more than 7 packets between the duplicate packets. If packets 0 and 8 are identical, packet 8 will be
dropped. If packets 0 and 9 are identical, packet 9 will not be dropped.
To configure packet deduplication:
Step 1
Choose Setup > Traffic > Hardware Deduplication.
The Deduplication window displays.
Step 2
Check the Enabled check box to enable packet deduplication.
Step 3
Enter a value in the Time Window (1-127 in milliseconds) for the search or buffer period.
The value you set in the Time Window indicates the length of time (n milliseconds) in which two packets
can be considered duplicates. If the Time Window is 100 ms but two identical packets arrive 120ms apart,
the second packet would not be dropped. If the identical packets arrive 80 ms apart, the second packet
would be dropped.
Step 4
Click to choose a segment of the packet to inspect for deduplication.
User Guide for the Cisco Network Analysis Module (NAM) Traffic Analyzer, 5.0
OL-22617-01
2-35
Chapter 2
Setting Up The NAM Traffic Analyzer
Alarms
The default inspects the entire packet. The second option inspects all segments except the ISL portion
of the packet. The third option inspects all segments except the ISL, MAC, and VLAN portions of the
packet. The fourth option inspects all segments except the ISL, MAC, and VLAN portions of the packet.
The final (bottom) option inspects only the UDP/TCP and payload segments of the packet.
Note
Step 5
Regardless of the option you choose, the packet checksum is ignored.
Click Submit to enable the settings you have entered, or click Reset to cancel any change.
Alarms
Alarms are predefined conditions based on a rising data threshold, a falling data threshold, or both. You
can choose what types of events for which you want the NAM to notify you, and how you want to be
notified.
This is the order that you will typically follow for setting up alarms and alarm thresholds:
Step 1
Depending on the type of alarm action you would like to configure, define the way you would like to be
notified (by e-mail, trap, trigger capture, or syslog).
•
For e-mail server settings: Choose Administration > System > E-Mail Setting
•
For trap settings: Choose Administration > System > SNMP Trap Setting
•
For capture session settings: Choose Capture > Packet Capture/Decode > Sessions
•
For syslog settings: Choose Administration > System > Syslog Setting
Step 2
Define the Alarm Action at Setup > Alarms > Actions.
Step 3
Define the Threshold for this alarm at Setup > Alarms > Thresholds.
The NAM 5.0 Traffic Analyzer menu selections for setting up Alarms are:
•
Alarm Actions, page 2-36
•
Thresholds, page 2-39
•
User Scenario, page 2-49
Alarm Actions
Alarms are predefined conditions based on a rising data threshold, a falling data threshold, or both. You
can set thresholds and alarms on various network parameters such as increased utilization, severe
application response delays, and voice quality degradation and be alerted to potential problems.
Note
NAM 5.0 supports IPv6 for all alarm functionality.
User Guide for the Cisco Network Analysis Module (NAM) Traffic Analyzer, 5.0
2-36
OL-22617-01
Chapter 2
Setting Up The NAM Traffic Analyzer
Alarms
Note
You could see two alarms for the same occurrence if both the source and the destination are in the same
site.
When you choose Setup > Alarms > Actions, you will see events that have been created. See Table 2-13,
Alarm Configuration for descriptions of the fields.
Table 2-13
Alarm Configuration
Field
Description
Name
Name given to the alarm at setup.
Email
If turned on, will show “Enable”. If not turned on,
will show “Disable.” E-mail server settings are
configured on Administration > System >
E-Mail Setting.
Trap
If configured, will show “Community: xxxxx” as
configured on Administration > System >
SNMP Trap Setting. If not configured, will be
blank.
Trigger Capture
If configured, will show “Session:xxxxx” as
configured on Capture > Packet
Capture/Decode > Sessions. If no captures are
configured, will be blank.
Syslog Remote
If turned on, will say “Enable”. If turned off, will
say “Disable.” Settings configured on
Administration > System > Syslog Setting.
Status
“Missing Trap” means that the trap configured for
that alarm action has been deleted.
“OK” means the Alarm action was successfully
created.
Alarm Action Configuration
When a threshold’s rising water mark is crossed, the alarm condition is met. This will trigger the alarm
action to take effect. The NAM supports the following alarm actions:
•
E-mail syslog: An alarm action that e-mails the syslog content of the alarm condition. To avoid
e-mail flooding the network, the NAM does not send more than five e-mails in any given hour.
•
Trap: An alarm action that sends NAM trap message to one or more trap servers. Any trap server
that has the same community string will receive the trap message. The NAM use Cisco Syslog MIB
in the trap message. To avoid trap flooding, the NAM’s limit is ten trap messages per interval.
•
Remote syslog: An alarm action that sends syslog messages to remote syslog servers. The NAM’s
limit is ten syslog messages per interval to avoid flooding the network.
•
Trigger capture: An alarm action to start or stop a pre-defined capture session.
The NAM supports any combination of the above four actions in one alarm condition.
User Guide for the Cisco Network Analysis Module (NAM) Traffic Analyzer, 5.0
OL-22617-01
2-37
Chapter 2
Setting Up The NAM Traffic Analyzer
Alarms
To configure e-mail alarm actions:
Step 1
Choose Setup > Alarms > Actions.
The Alarm Action page displays any configured actions. If none of the four actions (e-mail, trap, capture,
or syslog) are configured, you will see “No data available.”
Step 2
Click the Create button.
Step 3
Enter a Name for the action (up to 63 characters).
Step 4
Choose the type of alarm action:
•
Email: The NAM will use the e-mail address configured in Administration > System > E-Mail
Setting. NAM alarm mail is sent as a result of NAM alarms, not router or switch alarms.
The NAM sends up to five e-mails per hour per function (traffic and NDE, voice signaling, RTP, and
application response time). Also, in each e-mail, there could be up to five alarm messages. These
limits are in place to avoid e-mail overload.
If you have configured e-mail alarms and do not receive e-mail, then your NAM does not have any
alarms.
If the NAM is planning to send you many alarm messages, the e-mail may state, for example, “5 of
2,345 alarm messages.”
Step 5
•
Trap: Choose the SNMP community where you would like traps to be sent. The NAM will use the
community configured in Administration > System > SNMP Trap Setting. After the
“Community” field appears, choose the community string from the drop-down list.
•
Trigger Capture: From the Session drop-down, select the session (the list will be empty if there is
no capture session configured in Capture > Packet Capture/Decode > Sessions. Click the “Start”
or “Stop” radio button.
•
Syslog: This will log syslog messages. The default setting is to log syslog messages locally to the
NAM. If you want to log syslog messages to remote servers, set up the destination information at
Administration > System > Syslog Setting.
Click Submit.
The Alarm Action table displays the newly configured action in its list.
Editing Alarm Actions
To edit an alarm action:
Step 1
Choose Setup > Alarms > Actions.
The Alarm Action table displays any configured Alarms.
Step 2
Choose the alarm event you want to modify, and click the Edit button.
Deleting Alarm Actions
To delete an alarm:
User Guide for the Cisco Network Analysis Module (NAM) Traffic Analyzer, 5.0
2-38
OL-22617-01
Chapter 2
Setting Up The NAM Traffic Analyzer
Alarms
Step 1
Choose Setup > Alarms > Actions.
The Alarm Action table displays any configured Alarms.
Step 2
Choose the alarm event you want to remove, and click the Delete button.
Thresholds
The NAM Traffic Analyzer will inspect incoming performance records and apply a configured set of
thresholds to the most recent interval of data to detect threshold violations. You can use the NAM GUI
to set up alarm thresholds for variables with values that trigger alarms.
Note
You could receive two alarms for the same occurrence if both the source and the destination are in the
same site.
The NAM Threshold Alarms window (Setup > Alarms > Thresholds) displays already-configured
thresholds. If you hover over the arrow next to the threshold Name, as shown in Figure 2-4, a detailed
view of the selected threshold will display.
Figure 2-4
NAM Threshold Window and Threshold Details
See Table 2-14, Threshold Configuration for descriptions of the fields on the Threshold screen.
Table 2-14
Threshold Configuration
Field
Description
Name
Name of the threshold.
Type
You can configure eight types of thresholds. See Figure 2-5 for a complete list.
Application
Application associated with this threshold.
Site
Site associated with this threshold.
Host
Host associated with this threshold.
User Guide for the Cisco Network Analysis Module (NAM) Traffic Analyzer, 5.0
OL-22617-01
2-39
Chapter 2
Setting Up The NAM Traffic Analyzer
Alarms
Table 2-14
Threshold Configuration
Field
Description
Severity
High or Low (user-configured classification). These alarms are displayed on
the Alarm Summary dashboard (Monitor > Overview > Alarm Summary).
You can choose to view High, Low, or High and Low alarms.
Action
Rising action and Falling action (if configured). Alarms are predefined
conditions based on a rising data threshold, a falling data threshold, or both.
Status
“OK” if configuration is complete. Otherwise, the issue will be listed (for
example, “Missing Src Site”).
You can set up alarm thresholds by defining threshold conditions for monitored variables on the NAM
Traffic Analyzer. Figure 2-5 shows the threshold types you can configure:
Figure 2-5
Create Threshold
To see the specific steps required for setting up a threshold type, choose the type from the list below:
•
Setting Host Thresholds, page 2-40
•
Setting Conversation Thresholds, page 2-41
•
Setting Application Thresholds, page 2-42
•
Setting Response Time Thresholds, page 2-43
•
Setting DSCP Thresholds, page 2-44
•
Setting RTP Stream Thresholds, page 2-45
•
Setting Voice Signaling Thresholds, page 2-46
•
Setting NDE Interface Thresholds, page 2-47
Setting Host Thresholds
Step 1
Choose Setup > Alarms > Thresholds.
Step 2
Click the Create button and choose the Host tab.
Step 3
The Host Alarm Threshold Configuration window displays. Fill in the fields as appropriate. Table 2-15,
Host Alarm Thresholds describes the fields available on this screen.
Table 2-15
Host Alarm Thresholds
Field
Description
Name
Give the Host Alarm Threshold a name.
Site
Choose a site from the list. See Sites, page 2-58 for information on setting up a
site.
User Guide for the Cisco Network Analysis Module (NAM) Traffic Analyzer, 5.0
2-40
OL-22617-01
Chapter 2
Setting Up The NAM Traffic Analyzer
Alarms
Table 2-15
Host Alarm Thresholds (continued)
Field
Description
Host
Choose a host from the list.
You can type in the name of the host if the drop-down list does not contain the
desired host.
Application
Choose an application from the list. You can enter the first few characters to
narrow the selection in the drop-down list.
DSCP
Choose a DSCP value from the list. You can enter the first few characters to
narrow the selection in the drop-down list.
Severity
Choose High or Low. These will display on the Alarm Summary dashboard
(Monitor > Overview >Alarm Summary), where you can choose to view High,
Low, or High and Low alarms.
Actions
From the drop-down lists, choose a Rising action and a Falling action (optional).
During threshold creation, by default, the falling action is the same as rising
action. See Alarm Actions, page 2-36 for information on setting up alarm actions.
Host Metrics
(per second)
Choose the type of metric from the list, and then enter a value for a Rising
threshold and a Falling threshold.
Add Metrics
(button)
Click the Add Metrics button to add another row.
Delete (button)
Click the Delete button to remove that Metrics row.
Note
If you leave a selection blank, it means that that parameter will not be considered. If you select
“Any”, it will use any of the selections for that parameter, if encountered.
Step 4
Click Submit to set the thresholds, click Reset to reset the thresholds to their default value, or click
Cancel to remove any changes you might have made.
Step 5
When finished, click Submit.
Setting Conversation Thresholds
Step 1
Choose Setup > Alarms > Thresholds.
Step 2
Click the Create button and choose the Conversation tab.
Step 3
The Conversation Alarm Threshold Configuration window displays. Fill in the fields as appropriate.
Table 2-16, Conversation Alarm Thresholds describes the fields available on this screen.
Table 2-16
Conversation Alarm Thresholds
Field
Description
Name
Give the Conversation Alarm Threshold a name.
Application
Choose an application from the list. You can start typing the first
few characters to narrow the list.
User Guide for the Cisco Network Analysis Module (NAM) Traffic Analyzer, 5.0
OL-22617-01
2-41
Chapter 2
Setting Up The NAM Traffic Analyzer
Alarms
Table 2-16
Conversation Alarm Thresholds (continued)
Field
Description
Severity
Choose High or Low. These will display on the Alarm Summary
dashboard (Monitor > Overview >Alarm Summary), where you
can choose to view High, Low, or High and Low alarms.
Source Site/Host
Make a selection from the drop-down lists, or leave as “Any.” See
Sites, page 2-58 for information on setting up a site.
Destination Site/Host
Make a selection from the drop-down lists, or leave as “Any.” See
Sites, page 2-58 for information on setting up a site.
Actions
From the lists, choose a Rising action and a Falling action
(optional). See Alarm Actions, page 2-36 for information on setting
up alarm actions.
Conversation Metrics (per
second)
Choose from one of the six metrics, and then enter a Rising
threshold and a Falling threshold.
Add Metrics (button)
Click the Add Metrics button to add another row.
Delete (button)
Click the Delete button to remove that Metrics row.
Note
If you leave a selection blank, it means that that parameter will not be considered. If you select
“Any”, it will use any of the selections for that parameter, if encountered.
Step 4
Click Submit to set the thresholds, click Reset to reset the thresholds to their default value, or click
Cancel to remove any changes you might have made.
Step 5
When finished, click Submit.
Setting Application Thresholds
Step 1
Choose Setup > Alarms > Thresholds.
Step 2
Click the Create button and choose the Application tab.
Step 3
The Application Alarm Threshold Configuration window displays. Fill in the fields as appropriate.
Table 2-17, Application Alarm Thresholds describes the fields available on this screen.
Table 2-17
Application Alarm Thresholds
Field
Description
Name
Give the Application Alarm Threshold a name.
Site
Choose a site from the list. See Sites, page 2-58 for information on
setting up a site.
Application
Choose an application from the list. You can start typing the first
few characters to narrow the list.
DSCP
Choose a DSCP value 0-63, or Any.
User Guide for the Cisco Network Analysis Module (NAM) Traffic Analyzer, 5.0
2-42
OL-22617-01
Chapter 2
Setting Up The NAM Traffic Analyzer
Alarms
Table 2-17
Application Alarm Thresholds (continued)
Field
Description
Severity
Choose High or Low. These will display on the Alarm Summary
dashboard (Monitor > Overview >Alarm Summary), where you
can choose to view High, Low, or High and Low alarms.
Actions
From the lists, choose a Rising action and a Falling action
(optional). See Alarm Actions, page 2-36 for information on setting
up alarm actions.
Application Metrics (per
second)
Choose Bytes or Packets, and then enter a Rising threshold and a
Falling threshold.
Add Metrics (button)
Click the Add Metrics button to add another row.
Delete (button)
Click the Delete button to remove that Metrics row.
Note
If you leave a selection blank, it means that that parameter will not be considered. If you select
“Any”, it will use any of the selections for that parameter, if encountered.
Step 4
Click Submit to set the thresholds, click Reset to reset the thresholds to their default value, or click
Cancel to remove any changes you might have made.
Step 5
When finished, click Submit.
Setting Response Time Thresholds
Step 1
Choose Setup > Alarms > Thresholds.
Step 2
Click the Create button and choose the Response Time tab.
Step 3
The Response Time Alarm Threshold Configuration window displays. Fill in the fields as appropriate.
Table 2-18, Response Time Thresholds describes the fields available on this screen.
Table 2-18
Response Time Thresholds
Field
Description
Name
Give the Response Time Alarm Threshold a name.
Application
Choose an application from the list. You can start typing the first
few characters to narrow the list.
Severity
Choose High or Low. These will display on the Alarm Summary
dashboard (Monitor > Overview >Alarm Summary), where you
can choose to view High, Low, or High and Low alarms.
Client Site/Host
Make a selection from the lists. See Sites, page 2-58 for information
on setting up a site.
Server Site/Host
Make a selection from the lists, or leave as “Any.” See Sites,
page 2-58 for information on setting up a site.
User Guide for the Cisco Network Analysis Module (NAM) Traffic Analyzer, 5.0
OL-22617-01
2-43
Chapter 2
Setting Up The NAM Traffic Analyzer
Alarms
Table 2-18
Response Time Thresholds (continued)
Field
Description
Actions
From the lists, choose a Rising action and a Falling action
(optional). See Alarm Actions, page 2-36 for information on setting
up alarm actions.
Response Time Metrics
Choose a metric from the list, and then enter a Rising threshold and
a Falling threshold. For the Packets and Bytes-related metrics, the
entry is per second. For the time-related metrics, the unit is ms.
Add Metrics (button)
Click the Add Metrics button to add another row.
Delete (button)
Click the Delete button to remove that Metrics row.
Note
If you leave a selection blank, it means that that parameter will not be considered. If you select
“Any”, it will use any of the selections for that parameter, if encountered.
Step 4
Click Submit to set the thresholds, click Reset to reset the thresholds to their default value, or click
Cancel to remove any changes you might have made.
Step 5
When finished, click Submit.
Setting DSCP Thresholds
Step 1
Choose Setup > Alarms > Thresholds.
Step 2
Click the Create button and choose the DSCP tab.
Step 3
The DSCP Alarm Threshold Configuration window displays. Fill in the fields as appropriate. Table 2-19,
DSCP Alarm Thresholds describes the fields available on this screen.
Table 2-19
DSCP Alarm Thresholds
Field
Description
Name
Give the DSCP Alarm Threshold a name.
Site
Choose a site from the list. See Sites, page 2-58 for information on
setting up a site.
DSCP
Chose a DSCP value from the list.
Severity
Choose High or Low. These will display on the Alarm Summary
dashboard (Monitor > Overview >Alarm Summary), where you
can choose to view High, Low, or High and Low alarms.
Actions
From the drop-down lists, choose a Rising action and a Falling
action (optional).
DSCP Metrics (per second)
Choose one of the metric types from the list, and then enter a Rising
threshold and a Falling threshold.
Add Metrics (button)
Click the Add Metrics button to add another row.
Delete (button)
Click the Delete button to remove that Metrics row.
User Guide for the Cisco Network Analysis Module (NAM) Traffic Analyzer, 5.0
2-44
OL-22617-01
Chapter 2
Setting Up The NAM Traffic Analyzer
Alarms
Note
If you leave a selection blank, it means that that parameter will not be considered. If you select
“Any”, it will use any of the selections for that parameter, if encountered.
Step 4
Click Submit to set the thresholds, click Reset to reset the thresholds to their default value, or click
Cancel to remove any changes you might have made.
Step 5
When finished, click Submit.
Setting RTP Stream Thresholds
Step 1
Choose Setup > Alarms > Thresholds.
Step 2
Click the Create button and choose the RTP Streams tab.
Step 3
The RTP Stream Alarm Threshold Configuration window displays. Fill in the fields as appropriate.
Table 2-20, RTP Streams Thresholds describes the fields available on this screen.
Table 2-20
RTP Streams Thresholds
Field
Description
Name
Give the RTP Streams Alarm Threshold a name.
Severity
Choose High or Low. These will display on the Alarm Summary dashboard
(Monitor > Overview >Alarm Summary), where you can choose to view
High, Low, or High and Low alarms.
Codec
Choose a Codec from the list.
Source Site/Host
Make a selection from the drop-down lists, or leave as “Any.” See Sites,
page 2-58 for information on setting up a site.
Severity
Choose High or Low. These will display on the Alarm Summary dashboard
(Monitor > Overview >Alarm Summary), where you can choose to view
High, Low, or High and Low alarms.
Actions
From the drop-down lists, choose a Rising action and a Falling action
(optional). See Alarm Actions, page 2-36 for information on setting up
alarm actions.
User Guide for the Cisco Network Analysis Module (NAM) Traffic Analyzer, 5.0
OL-22617-01
2-45
Chapter 2
Setting Up The NAM Traffic Analyzer
Alarms
Table 2-20
RTP Streams Thresholds (continued)
Field
Description
RTP Stream Metrics
Choose a metric from the list:
•
Jitter: Variation of packet arrival time compare to expected arrival time.
•
Adjusted packet loss percent: Percent of packet loss which includes
packets actually lost and packets that arrived beyond the NAM
expected buffering capability of the endpoint.
•
Actual packet loss percent: Percent of packets that the NAM has never
seen.
•
MOS: Mean opinion score that is composed of both jitter and adjusted
packet loss.
•
Concealment seconds: Number of seconds in which the NAM detected
packets lost.
•
Severe concealment seconds: Number of seconds in which the NAM
detected packets lost of more than 5%.
Enter a Rising threshold and a Falling threshold.
Add Metrics (button)
Click the Add Metrics button to add another row.
Delete (button)
Click the Delete button to remove that Metrics row.
Note
If you leave a selection blank, it means that that parameter will not be considered. If you select
“Any”, it will use any of the selections for that parameter, if encountered.
Step 4
Click Submit to set the thresholds, click Reset to reset the thresholds to their default value, or click
Cancel to remove any changes you might have made.
Step 5
When finished, click Submit.
Setting Voice Signaling Thresholds
You can set up the NAM to monitor voice call quality. When Cisco Call Manager’s call detail records
option is enabled, Cisco IP phones, both SCCP and SIP, will report the call’s jitter and packet loss at the
end of the call. The NAM intercepts this information and raises an alarm when the alarm condition
crosses the rising threshold.
To set up a voice signaling threshold:
Step 1
Choose Setup > Alarms > Thresholds.
User Guide for the Cisco Network Analysis Module (NAM) Traffic Analyzer, 5.0
2-46
OL-22617-01
Chapter 2
Setting Up The NAM Traffic Analyzer
Alarms
Step 2
Click the Create button and choose Voice Signaling tab.
Step 3
The Voice Signaling Alarm Threshold Configuration window displays. Fill in the fields as appropriate.
Table 2-21, Voice Signaling Thresholds describes the fields available under the Voice Signaling Metrics
drop-down menu.
Table 2-21
Voice Signaling Thresholds
Field
Description
Name
Give the Voice Signaling Alarm Threshold a name.
Severity
Choose High or Low. These will display on the Alarm Summary
dashboard (Monitor > Overview >Alarm Summary), where you can
choose to view High, Low, or High and Low alarms.
Actions
Choose a Rising action and a Falling action from the lists (optional).
See Alarm Actions, page 2-36 for information on setting up alarm
actions.
Voice Signaling Metrics
Choose Jitter to enable an alarm when the NAM detects jitter to be
more than the value set here.
Check Packet Loss % to enable an alarm when the NAM detects
Packet Loss percentage to be outside of the values you entered.
Add Metrics (button)
Click the Add Metrics button to add another row.
Delete (button)
Click the Delete button to remove that Metrics row.
Note
If you leave a selection blank, it means that that parameter will not be considered. If you select
“Any”, it will use any of the selections for that parameter, if encountered.
Step 4
Click Submit to set the voice signaling thresholds, click Reset to reset the thresholds to their default
value, or click Cancel to remove any changes you might have made.
Step 5
When finished, click Submit.
Setting NDE Interface Thresholds
Step 1
Choose Setup > Alarms > Thresholds.
Step 2
Click the Create button and choose the NDE Interface tab.
The NDE Interface Alarm Threshold Configuration screen displays. The fields are described in
Table 2-22, NDE Interface Alarm Thresholds.
Table 2-22
NDE Interface Alarm Thresholds
Field
Description
Name
Give the NDE Interface Alarm Threshold a name.
Data Source
Choose a data source from the list.
Interface
Choose an interface from the list.
User Guide for the Cisco Network Analysis Module (NAM) Traffic Analyzer, 5.0
OL-22617-01
2-47
Chapter 2
Setting Up The NAM Traffic Analyzer
Alarms
Table 2-22
Field
Description
Direction
Choose Ingress or Egress.
Severity
Choose High or Low. These will display on the Alarm Summary dashboard
(Monitor > Overview >Alarm Summary), where you can choose to view
High, Low, or High and Low alarms.
Actions
Choose a Rising action and a Falling action from the lists (optional). See
Alarm Actions, page 2-36 for information on setting up alarm actions.
NDE Interface Metrics
(per second)
Choose Bytes or Packets, and enter a Rising and Falling threshold.
Add Metrics (button)
Click the Add Metrics button to add another row.
Delete (button)
Click the Delete button to remove that Metrics row.
Note
Step 3
NDE Interface Alarm Thresholds (continued)
If you leave a selection blank, it means that that parameter will not be considered. If you select
“Any”, it will use any of the selections for that parameter, if encountered.
Click Submit to set the thresholds, click Reset to reset the thresholds to their default value, or click
Cancel to remove any changes you might have made.
Editing an Alarm Threshold
To edit an alarm threshold:
Step 1
Choose Setup > Alarms > Thresholds.
The Thresholds table displays.
Step 2
Select the alarm to edit, then click Edit.
The dialog box displays for the type of alarm; for example, “Host Threshold.”
Step 3
Make the necessary changes.
Step 4
Click Submit to save your changes, click Reset to reset the thresholds to the values set before you edited
them, or click Cancel to cancel the edit and return to the previous page.
Deleting a NAM Threshold
To delete a NAM alarm threshold, simply select it from the Alarms table, then click Delete.
Click OK to confirm deletion, or click Cancel to leave the configuration unchanged.
User Guide for the Cisco Network Analysis Module (NAM) Traffic Analyzer, 5.0
2-48
OL-22617-01
Chapter 2
Setting Up The NAM Traffic Analyzer
Data Export
User Scenario
If you want the NAM to notify you of any violations of Response Time metrics for a particular server,
and then initiate a packet capture, complete the following steps:
Step 1
Step 2
Step 3
Set up the e-mail and capture settings.
a.
Choose Administration > System > E-Mail Setting to define the e-mail settings.
a.
Choose Capture > Packet Capture/Decode > Sessions and create a capture session for this
particular server.
Define an Alarm Action.
a.
Choose Setup > Alarms > Actions.
b.
Click the Create button.
c.
Enter a Name.
d.
Check the “Email” check box.
e.
Check the “Trigger Capture” check box, choose the session you created in Step 1 from the
drop-down menu, and select the Start or Stop radio button.
f.
Click the Submit button.
Define the Threshold for this alarm.
a.
Choose Setup > Alarms > Thresholds.
b.
Click the Create button.
c.
Choose the Response Time tab.
d.
Give the Response Time Alarm Threshold a Name, and choose the Application and Severity.
e.
Choose the server from the Host drop-down list.
f.
Choose the action you created in Step 2, define the metrics for the thresholds, and click the Submit
button.
Data Export
The NAM 5.0 Traffic Analyzer selections for setting up Data Export are:
•
NetFlow, page 2-49
•
Scheduled Exports, page 2-53
•
Custom Export, page 2-55
NetFlow
The NAM as a producer of NDE (NetFlow Data Export) packets is a new feature for NAM Traffic
Analyzer 5.0. The NAM’s new functionality of NDE is part of its new NBI.
User Guide for the Cisco Network Analysis Module (NAM) Traffic Analyzer, 5.0
OL-22617-01
2-49
Chapter 2
Setting Up The NAM Traffic Analyzer
Data Export
NetFlow collects traffic statistics by monitoring packets that flow through the device and storing the
statistics in the NetFlow table. NDE converts the NetFlow table statistics into records, and exports the
records to an external device, which is called a NetFlow collector. The NAM sends out NDE packets only
in NDE v9 format.
There are currently six record types (or templates) that NAM exports (four in Core Stats, one in ART):
•
Application
•
Host
•
Client Server Response Time
•
Application Conversations
•
Network Conversations
•
RTP Metrics
The NDE data is exported in a fixed selection of aggregated data records that are shipped with the
product. This part of the NDE descriptor defines what is to be exported:
•
Record Type
•
Period (in minutes)
•
NetFlow options selector
After you select the Record Type, you will make selections for Filters. The purpose of the Filter is to
restrict the set of exported records to the subset matching the filter's conditions;
•
Depending on which fields are contained in the specified record type, the filter can specify
conditions on site, application (whenever applicable), and host (or server, or client, depending on
record type)
•
The semantics of multiple conditions is conjunctive; for example, if filter specifies “siteA” and
“app1,” then the values in exported records will have to match both “siteA” and “app1.”
•
Filter specification is optional, and by default all fields can be assumed as having value of Any
•
The host (if applicable, or server, or client, depending on record type) allows multiple values to be
selected. If multiple values are specified, for example “host1, host2”, then the NAM assumes “host1
or host2.”
The following sections describe setting up NetFlow Data Export:
•
Viewing Configured NetFlow Exports, page 2-50
•
Configuring NetFlow Data Export, page 2-51
•
Editing NetFlow Data Export, page 2-53
Viewing Configured NetFlow Exports
Step 1
Choose Setup > Data Export > NetFlow.
Step 2
The NetFlow Exports screen appears (shown in Figure 2-6).
User Guide for the Cisco Network Analysis Module (NAM) Traffic Analyzer, 5.0
2-50
OL-22617-01
Chapter 2
Setting Up The NAM Traffic Analyzer
Data Export
Figure 2-6
NetFlow Exports Screen
Already defined NetFlow Exports will be listed on the screen. If you hover over the “quick view” arrow
icon next to the Record Type, as shown in Figure 2-4, a detailed view of the filter details of the selected
NetFlow export will display.
The fields are described in Table 2-23.
Configuring NetFlow Data Export
To configure NetFlow Data Export, perform the following steps:
Step 1
Choose Setup > Data Export > NetFlow.
Step 2
Click the Create button.
Step 3
At the NetFlow Export Configuration screen, fill in the fields. See Table 2-23, NetFlow Exports Fields
for field descriptions.
Table 2-23
NetFlow Exports Fields
Field
Description
Description
A description of the NetFlow Export.
Destination IP
Address
The IP address of the device to be exported to. Only IPv4 addresses are supported.
Destination Port
The port number of the device to be exported to.
Valid characters: 1-9. Length: Min 1, Max 65535.
User Guide for the Cisco Network Analysis Module (NAM) Traffic Analyzer, 5.0
OL-22617-01
2-51
Chapter 2
Setting Up The NAM Traffic Analyzer
Data Export
Table 2-23
NetFlow Exports Fields (continued)
Field
Description
Export Record
Type
The record types supported by NAM for NetFlow are:
Export Interval
(min)
Options
(button)
•
Application
•
Host
•
ART Client Server Application
•
Application Conversations
•
Network Conversations
•
RTP Metrics
Choose the desired export time interval (1, 5, 10, 15, 30, or 60 minutes).
The Export Interval column values are dependent upon Aggregation intervals.
•
Core/media aggregation interval value is utilized for the following record types: Application, Host,
Network Conversation, Application conversation, and RTP Metrics.
•
Response Time aggregation interval is utilized for the Client Server Response Time record type.
The NetFlow option selection contains a set of check boxes. These allow independent selections of on or
off settings for individual NetFlow options, which can be exported in addition to the NDE packets with data
and templates, as follows:
•
Mapping of integer application ID values into application names (as strings)
•
Mapping of integer site ID values into site names and descriptions (as strings)
If there are several NetFlow Export Descriptors defined for the same destination, then the last user’s
selection of option exports flags is enforced on all descriptor instances that exist for the same export
destination.
Filter
After you choose the Export Record Type (above), the Filter menus populate depending on your selection.
•
Note
Site: List of created sites for the NAM (configured in Setup > Network > Sites). Select Any to use any
of the selections for that parameter.
When you choose a record type with two sites (for example serverSite and clientSite in Client
Server Response Time), the value specified by the filter will apply to either of these fields. If a
certain site is chosen, then the filter will match records having the specified value in any of the site
fields.
•
Application: All applications created on the NAM (configured in Setup > Classification >
Applications). Select Any to use any of the selections for that parameter.
•
Source: Enter a valid host address (hostname, IPv4 address, IPv6 address, or MAC address). Click the
right arrow to add it to the list of Chosen Sources.
•
Destination: Enter a valid host address (hostname, IPv4 address, IPv6 address, or MAC address). Click
the right arrow to add it to the list of Chosen Destinations.
•
Host: List of available hosts. Click the right arrow to add it to the list of Chosen Hosts. If more than
one host is selected, the filter will apply to records with the value being one of the selected set.
•
Client: Enter a valid host address (hostname, IPv4 address, IPv6 address, or MAC address). Click the
right arrow to add it to the list of Chosen Clients.
•
Server: List of available servers. Click the right arrow to add it to the list of Chosen Servers.
User Guide for the Cisco Network Analysis Module (NAM) Traffic Analyzer, 5.0
2-52
OL-22617-01
Chapter 2
Setting Up The NAM Traffic Analyzer
Data Export
Step 4
Click the Submit button to save the configuration, or click the Reset button to clear the fields, or click
the Cancel button to exit the screen without configuration.
Editing NetFlow Data Export
Step 1
Choose Setup > Data Export > NetFlow.
Step 2
Highlight the export you want to edit and click the Edit button.
Step 3
Make the desired changes.
Step 4
Click:
•
The Submit button to submit the edits
•
The Reset button to clear the changes you made
•
The Cancel button to close the dialog box and return to the previous screen.
Scheduled Exports
You can set up scheduled jobs that will generate a daily report at a specified time, in the specified
interval, and then e-mail it to a specified e-mail address. You can also obtain a report on the spot clicking
on the Preview button, rather than wait for the scheduled time. This report can also be sent after you
preview it.
At the Setup > Data Exports > Scheduled Export screen, you will only be able to edit or delete an
already-configured scheduled export. The creation of can only be done from a “Monitor” or “Analyze”
screen.
To set up a Scheduled Export:
Step 1
When you are on most screens under the “Monitor” or “Analyze” menus, the Interactive Report is
available on the left side of the screen. Click the Export button in the Interactive Report box.
Step 2
Choose the Export Type (Daily or Weekly).
Step 3
Choose the Export Time (when you would like the report delivered to you): Day and Hour.
Step 4
Choose the Report Time (if Daily) or the Data Time Range (if Weekly). This is the interval of time you
would like measured.
•
The Report Time for a daily report is restricted to the current 24 hours.
•
The Report Time for a weekly report is always from 17:00 to 17:00, for however many days chosen.
For example:
Step 5
•
If you choose Export Type “Weekly,” Data Time Range “Last 2 Days,” and Export Time: Day
“Wednesday” and Hour “13:00,” the report will show data from Sunday at 17:00 to Tuesday at 17:00.
•
If you choose Export Time: Day “Wednesday” and Hour “18:00,” the report will show data from
Monday at 17:00 to Wednesday at 17:00.
Enter the e-mail address to which you would like the report delivered.
User Guide for the Cisco Network Analysis Module (NAM) Traffic Analyzer, 5.0
OL-22617-01
2-53
Chapter 2
Setting Up The NAM Traffic Analyzer
Data Export
With NAM Traffic Analyzer 5.0, you can only configure one e-mail address.
Note
Step 6
Choose the delivery option (HTML or CSV).
Step 7
Enter the report description, which will appear at the end of the filename of the report delivered to you.
Step 8
Click:
•
The Reset button to clear the values in the dialog box
•
The Preview button to preview the report
•
The Submit button to submit the request for the scheduled job
•
The Cancel button to close the dialog box and return to the previous screen
Editing a Scheduled Export
Step 1
Choose Setup > Data Export > Scheduled Exports.
Step 2
Highlight the job you would like to edit.
Step 3
Click the Edit button.
Step 4
Modify the information as desired. On this screen, you can only change the Email, Delivery Option
(HTML or CSV), and Report Description.
Step 5
Click:
•
The Submit button to submit the request for the scheduled job
•
The Reset button to clear the values in the dialog box
•
The Cancel button to close the dialog box and return to the previous screen.
Deleting a Scheduled Export
Step 1
Choose Setup > Data Export > Scheduled Exports.
Step 2
Highlight the job you would like to delete.
Step 3
Click the Delete button.
Step 4
Click OK to confirm, or click Cancel to return to the previous screen without deleting the job.
User Guide for the Cisco Network Analysis Module (NAM) Traffic Analyzer, 5.0
2-54
OL-22617-01
Chapter 2
Setting Up The NAM Traffic Analyzer
Managed Device
Custom Export
You can enable Custom Export to send response time data to an external reporting console such as
NetQoS SuperAgent.
After you enable Custom Export, you may also want to enable the “Export Passthrough Response Time”
option when creating a WAAS Data Source (Setup > NAM Data Sources > Auto Create).
To enable the NAM to export response time data to an external console:
Step 1
From the NAM GUI, choose Setup > Data Export > Custom Export.
The Response Time Export window displays.
Step 2
Check the Enable Export check box.
Step 3
Enter the IP address of the external reporting console in the IP Address field.
Step 4
Enter the UDP port number of the external console (blank is default).
Step 5
Optionally, click Export Non-WAAS Traffic.
This enables the export of SPAN and other data as well as WAAS traffic.
Step 6
Click Submit to enable traffic export, or click Reset to clear the changes from the screen.
Managed Device
A managed device is the device on which SPAN is configured, and where system health ifTable statistics
are polled via SNMP.
The NAM 5.0 Traffic Analyzer menu selections for setting up Managed Devices are:
•
Device Information, page 2-55
•
NBAR Protocol Discovery, page 2-57
Device Information
To view the switch information, choose Setup > Managed Device > Device Information. The fields are
described in Table 2-24, Switch Information.
Table 2-24
Switch Information
Field
Description
SNMP Test information
Displays the IP address of the NAM and the switch that the SNMP test
occurred on.
Name
Name of the switch.
Hardware
Hardware description of the switch.
Supervisor Software Version
Current software version of the Supervisor.
System Uptime
Total time the switch has been running.
Location
Physical location of the switch.
User Guide for the Cisco Network Analysis Module (NAM) Traffic Analyzer, 5.0
OL-22617-01
2-55
Chapter 2
Setting Up The NAM Traffic Analyzer
Managed Device
Table 2-24
Switch Information (continued)
Field
Description
Contact
Contact name of the network administrator for the switch.
SNMP read from switch
SNMP read test result.
SNMP write to switch
SNMP write test result.
Mini-RMON on switch
For Cisco IOS devices, displays the status if there are any ports with
Mini-RMON configured (Available) or not (Unavailable).
NBAR on switch
Displays if NBAR is available on the switch.
VLAN Traffic Statistics on Switch Displays if VLAN data is Available or Unavailable.
Note
NetFlow Status
Note
Catalyst 6500 Series switches require a Supervisor 2 or MSFC2
card.
For Catalyst 6500 Series devices running Cisco IOS, if NetFlow is
configured on the switch, Remote export to NAM <address> on port
<number> displays, otherwise the status will display Configuration
unknown.
For the WS-SVC-NAM-1 and WS-SVC-NAM-2 platforms, SNMPv3 is not required. SNMP
requests and responses are communicated over an internal interface within the chassis, and
SNMPv3 is not used.
This section describes how to set router/managed device parameters.
Note
Step 1
This section applies only to NME-NAM devices (branch routers) and Cisco 2200 Series Appliances.
Choose Setup > Managed Device > Device Information.
The Router System Information displays as shown in Table 2-25, Router/Managed Device System
Information.
Table 2-25
Router/Managed Device System Information
Field
Description
Name
Name of the router.
Hardware
Hardware description of the router.
Managed Device Software
Version
Current software version of the router.
Managed Device System
Uptime
Total time the switch has been running.
Location
Physical location of the router.
Contact
Name of the network administrator for the router.
Managed Device
IP address of the router.
SNMP v1/v2c RW Community
String
Name of the SNMP read-write community string configured on the
router
User Guide for the Cisco Network Analysis Module (NAM) Traffic Analyzer, 5.0
2-56
OL-22617-01
Chapter 2
Setting Up The NAM Traffic Analyzer
Managed Device
Table 2-25
Router/Managed Device System Information (continued)
Field
Description
Verify String
Verify the SNMP .
Enable SNMP V3
Check the check box to enable SNMP Version 3 (with NAM 5.0, you
have the ability to manage devices with SNMPv3). If SNMPv3 is not
enabled, the community string is used.
Mode: No Auth, No Priv
SNMP will be used in a mode with no authentication and no privacy.
Mode: Auth, No Priv
SNMP will be used in a mode with authentication, but no privacy.
Mode: Auth and Priv
SNMP will be used in a mode with both authentication and privacy.
User Name
Enter a username, which will match the username configured on the
device.
Auth Password
Enter the authentication password associated with the username that
was configured on the device. Verify the password.
Auth Algorithm
Choose the authentication standard which is configured on the device
(MD5 or SHA-1).
Privacy Password
Enter the privacy password, which is configured on the device. Verify
the password.
Privacy Algorithm
Enter the privacy algorithm, which is configured on the device (AES
or DES).
Step 2
Click the Test Connectivity button to perform an SNMP test. Click Close when finished.
Step 3
Click Submit to submit the information and close the window.
NBAR Protocol Discovery
Note
NBAR is supported on ISR routers and switches with the Catalyst 6500 Supervisor Engine 32
Programmable Intelligent Services Accelerator (PISA) running IOS 12.2(18)ZY (or later).
To set up NBAR Protocol Discovery, choose Setup > Managed Device > NBAR Protocol Discovery.
From the NBAR Protocol Discovery window, you can view the NBAR Status information and enable or
disable NBAR on all interfaces.
You must enable the NBAR Interfaces feature for the NAM to provide information about ethernet ports.
Note
If your switch does not support NBAR, a message displays indicating that NBAR is not supported on
your switch.
User Guide for the Cisco Network Analysis Module (NAM) Traffic Analyzer, 5.0
OL-22617-01
2-57
Chapter 2
Setting Up The NAM Traffic Analyzer
Network
If NBAR Protocol Discovery is enabled, the NBAR Interfaces window lists known interfaces by name
and type. Table 2-26, NBAR Interface Details describes the fields on the screen.
Table 2-26
NBAR Interface Details
Field / Operation
Description
Enable
(check box)
Check indicates that NBAR is enabled.
Interface
Name of the interface.
Depending on the IOS running on the Supervisor, port names are displayed
differently.
Newer versions of IOS software display a port name as Gi2/1 to represent a
Gigabit port on module 2 port 1.
In the Virtual Switch software (VSS), a port name might be displayed as
Gi1/2/1to represent a Gigabit port on switch 1, module2, port 1.
Interface Description
Description of the interface.
To narrow the list of interfaces, choose “Interface Name” or “Interface Description” from the drop-down
list, enter any part of the interface name or description in the text box, and click the Filter button. To
clear the Filter text box, click Clear. To return to showing all interfaces, check the All check box and
click the Submit button.
Check the check box to enable an interface, and then click the Submit button.
The Save button will save the router’s running configuration to startup configuration.
Network
The NAM 5.0 Traffic Analyzer menu selections for setting up the Network are:
•
Sites, page 2-58
•
NDE Interface Capacity, page 2-63
•
DSCP Groups, page 2-64
Sites
A site is a collection of hosts (network endpoints) partitioned into views that help you monitor traffic
and troubleshoot problems. If you want to limit the view of your network analysis data to a specific city,
a specific building, or even a specific floor of a building, you can use the Sites function.
Note
If there are multiple data sources configured for the same site, the same traffic may be accounted for
more than once, resulting in inflated traffic statistics. For example, if the NAM is configured to receive
SPAN traffic for a particular site, and also is receiving Netflow records for that same site, they will both
be combined in the traffic statistics. In this case, if you then want to only see the statistics for a particular
data source, you would need to use the Interactive Report window on the left side of the screen to specify
both the Site and Data Source.
User Guide for the Cisco Network Analysis Module (NAM) Traffic Analyzer, 5.0
2-58
OL-22617-01
Chapter 2
Setting Up The NAM Traffic Analyzer
Network
The site definition is very flexible and can accommodate various scenarios. The site definition is used
not only for viewing of data, but for data export and data retention as well. Normally, a site is defined
by its subnet(s), but a site can also be defined using the following rules:
•
Subnet (IP address prefix)
•
Subnet from a data source
•
Subnet from a given VLAN of a SPAN data source
•
WAE device serving the site
The preferred way to define sites is using subnets, and should be used whenever possible.
Note
The same rule cannot be defined in multiple sites.
Note
If you are configuring a WAAS device, you will need to add WAAS servers to the NAM. See Auto Create
of New WAAS Devices, page 2-35.
See the following sections to set up sites:
•
Definition Rules, page 2-59
•
Viewing Defined Sites, page 2-60
•
Defining a Site, page 2-61
•
Editing a Site, page 2-63
Definition Rules
Specifying a Site Using Subnets
Normally, subnets alone are sufficient to define a site. For example:
Site Data-Center = subnet 172.20.0.0/16
In certain scenarios when there are overlapping IP address spaces in the networks (for example, in
private networks where hosts from different sites have the same IP addresses), then data sources or
VLANs can be used to differentiate the subnets. For example:
Site NewYork = subnet 10.11.0.0/16 from "NDE-NewYork" data source.
Site LosAngeles = subnet 10.11.0.0/16 from "NDE-LosAngeles" data source.
Site Sale-Dept = subnet 10.11.0.0/16 from VLAN 10 of "DATA PORT 1" data source.
Site Finance-Dept = subnet 10.11.0.0/16 from VLAN 12 of "DATA PORT 1" data source.
Specifying a Site Using WAE devices (WAAS Data Sources)
For WAAS traffic, you can define a site associated with a WAE device without specifying the site’s
subnets. Simply select all of the WAAS data sources coming from the WAE device(s) serving that site.
Site SanJose = WAE-SJ-Client, WAE-SJ-CltWAN, and WAE-SJ-Passthrough data sources.
Note
We recommend that you use subnets to specify WAAS-optimized sites. Use this method only if the site’s
subnets cannot be determined.
User Guide for the Cisco Network Analysis Module (NAM) Traffic Analyzer, 5.0
OL-22617-01
2-59
Chapter 2
Setting Up The NAM Traffic Analyzer
Network
Specifying a Site Using Multiple Rules
You can define a site using a combination of multiple rules described above. For example, if a site has
both optimized and non-optimized traffic, it can be defined using a combination of WAAS data sources
and a subnet from a NDE data source.
When defining a site using multiple data sources, be careful to make sure that those data sources do not
have duplicated traffic to avoid double counting the site traffic statistics.
Resolving Ambiguity (Overlapping Site Definitions)
Conflicting rules are not allowed in site definitions. Of the following two scenarios, the second one is
not allowed.
1.2.3.0/24 from SPAN1 = SiteA
1.2.3.0/24 from SPAN1 = SiteB
Using a prefix is the preferred method. Data source and VLAN are secondary. In the following two
scenarios, the first would receive the higher priority.
1.2.3.0/24 = Site D
WAE1-Client datasrc = Site E
The longest prefix has higher priority (same data source/VLAN). In the following two scenarios, the first
would receive the higher priority.
1.2.3.0/24 from SPAN1 = Site A
1.2.0.0/16 from SPAN1 = Site C
The more refined (specific) rule has higher priority. In the following two scenarios, the first would
receive the higher priority.
1.2.3.0/24 from SPAN1 = Site A
1.2.3.0/24 (any datasrc) = Site D
Viewing Defined Sites
Step 1
Choose Setup > Network > Sites.
Step 2
The Sites screen appears. Defined sites will be listed in the table.
User Guide for the Cisco Network Analysis Module (NAM) Traffic Analyzer, 5.0
2-60
OL-22617-01
Chapter 2
Setting Up The NAM Traffic Analyzer
Network
The fields on this screen are described in Table 2-27, Sites Screen.
Table 2-27
Sites Screen
Field
Description
Name
Name of the site.
Description
Description of what the site includes.
Rule
Lists the first rule assigned to the selected site. If you see periods
next to the site rule (...), then multiple rules were created for that
site. To see the list of all rules, click the quick view icon (after
highlighting the site, click the small arrow on the right).
Status
Shows if the site is Enabled or Disabled.
Defining a Site
The “Definition Rules” section on page 2-59 gives specific information about various scenarios. To set
up a Site or Sites:
Step 1
Choose Setup > Network > Sites.
Step 2
Click the Create button.
Step 3
The Site Configuration window appears. Enter a Name, Description, Subnet, Data Source, and/or VLAN
as appropriate.
User Guide for the Cisco Network Analysis Module (NAM) Traffic Analyzer, 5.0
OL-22617-01
2-61
Chapter 2
Setting Up The NAM Traffic Analyzer
Network
See Figure 2-7 for an example.
Figure 2-7
Site Configuration Screen
The fields are defined below in Table 2-28, Site Configuration Screen Fields.
Table 2-28
Site Configuration Screen Fields
Field
Description
Name
Unique text string for naming a site.
Description
Optional text string for describing site.
Disable Site
(check box)
If you check this check box, the NAM will skip this site when classifying traffic. This is useful if the
site is no longer active, but the user would still like to access historical site data in the database.
Otherwise, the user should delete sites that are not needed.
Subnet
IP address subnet (IPv4/IPv6 address and mask); for example, 10.1.1.0/24. Click the blue “i” to get
information about Site Rules.
You can click the Detect button to tell the NAM to look for subnets in the traffic. See the next section,
Subnet Detection.
Data Source
Specify the data source where the site traffic is coming from.
Leave this field blank if the site traffic can come from multiple data sources.
VLAN
Specify the VLAN where the site traffic is coming from.
Note
The VLAN selection is not enabled for NDE and WAAS data sources.
Leave this field blank if the site traffic can come from multiple VLANs.
User Guide for the Cisco Network Analysis Module (NAM) Traffic Analyzer, 5.0
2-62
OL-22617-01
Chapter 2
Setting Up The NAM Traffic Analyzer
Network
Step 4
Click the Submit button.
Note
The “Unassigned” site (with a description of “Unclassified hosts”) includes any that do not
match any of your site configurations. Sites are classified at the time of packet processing.
Subnet Detection
When you click the Detect button at Setup > Network > Sites > Sites Configuration, the NAM will
look for subnets detected within in the past hour. See Table 2-29, Subnet Detection for information about
the fields.
Table 2-29
Subnet Detection
Field
Description
Subnet Mask
Enter the subnet mask.
Note
If the bit mask is less than 32, the NAM will detect an IPv4 subnet. If the bit
mask is between 32 and 64, then it will detect an IPv6 subnet.
Data Source
Choose the data source in which you would like to detect subnets.
Interface
Choose the interface in which you would like to detect subnets.
Filter Subnets Within Network
Enter an IPv4 or IPv6 address
Unassigned Site (check box)
The “Unassigned” site includes any that do not match any of your site configurations.
Sites are classified at the time of packet processing.
When you click the Detect button, the NAM will find those that meet the criteria that you entered.
Editing a Site
You can edit sites that have been created. Note that the “Unassigned' site cannot be edited or deleted.
Step 1
Choose Setup > Network > Sites.
Step 2
Highlight the site that you have configured.
Step 3
Click the Edit button.
Step 4
Edit the desired field.
Step 5
Click Submit to save the changes, or click Reset and OK to reinstate the site’s previous settings, or click
Cancel to cancel any changes and return to the main Sites page.
User Guide for the Cisco Network Analysis Module (NAM) Traffic Analyzer, 5.0
OL-22617-01
2-63
Chapter 2
Setting Up The NAM Traffic Analyzer
Network
NDE Interface Capacity
After you have set up NetFlow data sources (see NetFlow, page 2-18), you can go to the NDE Interface
Capacity screen at Setup > Network > NDE Interface Capacity to specify the speed of each interface.
This allows the NAM to calculate interface utilization on the NDE Interface Traffic Analysis screen
(Analyze > Traffic > NDE Interface). Otherwise, the NAM can only display the throughput of the
interface, but cannot show its utilization.
You can click Edit to edit the interface. You can edit the name (for example, WAN link to Boston) and
speed of the interface.
The interface name and speed will be automatically discovered by the NAM if you configure the router’s
SNMP credentials in Setup > NAM Data Sources > Create > Type: NETFLOW.
Creating an NDE Interface
To add an interface, at the NDE Interface Capacity screen (Setup > Network > NDE Interface
Capacity), click the Add button. Then fill in the fields as described in Table 2-30, Add NDE Interface.
Note
It is normally not necessary to manually create NDE interfaces. They will be discovered automatically
when the device sends NDE packets to the NAM.
Table 2-30
Add NDE Interface
Field
Description
Device
Enter the IPv4 or IPv6 address.
ifIndex
Unique identifying number associated with a physical or
logical interface. Valid characters: 0-9.
ifName
Name of the interface. Valid characters are A-Z, a-z, 0-9
ifSpeed(Mbps)
An estimate of the interface’s current bandwidth in bits per
second.
DSCP Groups
Differentiated services monitoring (DiffServ) is designed to monitor the network traffic usage of
Differentiated Services Code Point (DSCP) values. To monitor DSCP, you must configure at least one
aggregation profile, and one or more aggregation groups associated with each profile. This section
describes how to set up the DSCP groups.
You can define two or three different groups of traffic, and assign the various DSCP values to each group.
Or you can assign one particular value for the first group and give it a name, and then assign all the rest
to the other (or default) group and give that a name.
For detailed information about setting DSCP values, see Implementing Quality of Service Policies with
DSCP:
http://www.cisco.com/en/US/tech/tk543/tk757/technologies_tech_note09186a00800949f2.shtml
User Guide for the Cisco Network Analysis Module (NAM) Traffic Analyzer, 5.0
2-64
OL-22617-01
Chapter 2
Setting Up The NAM Traffic Analyzer
Network
These topics help you set up and manage the DSCP groups:
•
Creating a DSCP Group, page 2-64
•
Editing a DSCP Group, page 2-66
•
Deleting a DSCP Group, page 2-66
Creating a DSCP Group
To create a DSCP Group:
Step 1
Choose Setup > Network > DSCP Groups.
The DSCP Groups table displays.
Step 2
Click the Create button.
The DSCP Group Configuration window displays.
Step 3
Table 2-31
Fill in the fields as described in Table 2-31, DSCP Group Setup Dialog Box.
DSCP Group Setup Dialog Box
Field
Description
Usage Notes
Name
Name of the profile.
Enter the name of the profile you are creating. The maximum is 64
characters.
Label Format
DSCP
DSCP numbers from 0 to 63. After selecting the DSCP radio button,
you can freely choose any of the 64 possible values and assign them
to Groups.
AF / EF / CS
Assured Forwarding (AF) guarantees a certain amount of bandwidth
to an AF class and allows access to extra bandwidth,
Expedited Forwarding (EF) is used for traffic that is very sensitive
to delay, loss and jitter, such as voice or video traffic.
Class Selector (CS) the last 3 bits of the 6-bit DSCP field, so these
correspond to DSCP 0 through DSCP 7.
Bit Field
Six bits in the IP header of a packet. See Table 2-32.
Table 2-32, DSCP Group Label Formats shows the available formats and associated values.
Table 2-32
DSCP Group Label Formats
DSCP Format (DSCP 0
through DSCP 63)
AF/EF/CS Format
Bit Field Format
DSCP 0
-
000000
DSCP 8
CS1
001000
DSCP 10
AF11
001010
DSCP 12
AF12
001100
DSCP 14
AF13
001110
DSCP 16
CS2
010000
User Guide for the Cisco Network Analysis Module (NAM) Traffic Analyzer, 5.0
OL-22617-01
2-65
Chapter 2
Setting Up The NAM Traffic Analyzer
Classification
Table 2-32
Step 4
DSCP Group Label Formats (continued)
DSCP Format (DSCP 0
through DSCP 63)
AF/EF/CS Format
Bit Field Format
DSCP 18
AF21
010010
DSCP 20
AF22
010100
DSCP 22
AF23
010110
DSCP 24
CS3
011000
DSCP 26
AF31
011010
DSCP 28
AF32
011100
DSCP 30
AF33
011110
DSCP 32
CS4
100000
DSCP 34
AF41
100010
DSCP 36
AF42
100100
DSCP 38
AF43
100110
DSCP 40
CS5
101000
DSCP 46
EF
101110
DSCP 48
CS6
110000
DSCP 56
CS7
111000
Click Submit to save your changes, or click Reset to cancel.
Editing a DSCP Group
To edit a DSCP group:
Step 1
Choose Setup > Network > DSCP Groups.
The DSCP groups window displays.
Step 2
Select the profile to edit, then click Edit.
Step 3
Make the necessary changes, then click Submit to save your changes, or click Reset to cancel.
Deleting a DSCP Group
To delete one or more DSCP groups, simply select the profiles from the DSCP Groups table, then click
Delete.
Classification
In Network Analysis Module release 5.0, the RMON-based protocol directory is replaced with a new
application ID classification system. When defining applications, you will be able to view and select
from a list of candidate IP addresses and port numbers for the traffic being analyzed.
User Guide for the Cisco Network Analysis Module (NAM) Traffic Analyzer, 5.0
2-66
OL-22617-01
Chapter 2
Setting Up The NAM Traffic Analyzer
Classification
The NAM enables the selection of the "better" application identifier, wherein "better" is defined as the
deeper inspection to be used for application classification. You can also manually select the preferred
inspection method.
For example, the NBAR Application ID inspection may report a "better" classification than the NAM’s
Protocol Directory, and so you may want to use the NBAR Application ID instead.
The NAM also allows for the configuration of custom applications via the North Bound Interface (NBI).
This is needed to ensure uniform application classification across a number of NAMs.
The menu selections for setting up Classification are:
•
Applications, page 2-67
•
Application Groups, page 2-70
•
URL-based Applications, page 2-71
•
Encapsulations, page 2-73
Applications
The NAM recognizes an application on the basis of port number, port number range, stateful inspection
of traffic (for example, voice signaling traffic or FTP), heuristics (for example, MS-RPC or SUN-RPC),
or standardized application identifiers exported by Cisco platforms with NDE. If the NAM is not able to
recognize an application using any of these mechanisms, the application type of the traffic is reported as
“unknown.” You can configure the application reported as “unknown” to create custom applications.
The Applications window lists applications that have been set up for this NAM. To view the Applications
window, click Setup > Classification > Applications. Use this window to view and add proprietary
applications, and edit the user-defined applications.
Figure 2-8 shows an example of what the screen may look like.
Figure 2-8
Applications
User Guide for the Cisco Network Analysis Module (NAM) Traffic Analyzer, 5.0
OL-22617-01
2-67
Chapter 2
Setting Up The NAM Traffic Analyzer
Classification
Table 2-33, Applications describes the fields on the Applications setup page.
Table 2-33
Applications
Field
Description
Application
Standard protocols, or name given by the user (if user-created).
Protocol/Port
Application protocol and port.
The port is an arbitrary number you assign to handle the additional ports for
the protocol family. This protocol number must be unique so it does not
conflict with standard protocol/port assignments.
The port number range will vary depending on the protocol type selected.
Selector
An arbitrary number, unique within an engine-id. It will be automatically
assigned if left blank.
This allows you to configure applications consistently across multiple NAMs,
so that the same user-created application is exported with the same value. This
should be used when configuring the same custom applications on multiple
NAMs.
Engine ID
Will show “Custom” if it was user-created.
Application Tag
Pre-defined for standard protocols.
For user-created, the application tag is a combination of the engine ID and the
Selector. The 32 bit is generated by using the engine ID as the highest order
byte, and the Selector makes up the other 3 bytes.
Description
Full name of the protocol.
This section provides the following procedures:
•
Creating a New Application, page 2-68
•
Editing an Application, page 2-69
•
Deleting a Protocol, page 2-70
Creating a New Application
When defining applications, you will be able to view and select from a list of candidate IP addresses and
port numbers for the traffic being analyzed. You can create additional ports to enable the NAM to handle
additional traffic for standard applications.
To create a new application:
Step 1
Choose Setup > Classification > Applications.
The Applications screen displays.
Step 2
Choose the type you would like to create and click Create.
The Application Configuration window displays.
Step 3
Enter a name in the Name field.
Step 4
Enter a Selector value. This is an arbitrary number, unique within an engine-id. It will be automatically
assigned if left blank.
User Guide for the Cisco Network Analysis Module (NAM) Traffic Analyzer, 5.0
2-68
OL-22617-01
Chapter 2
Setting Up The NAM Traffic Analyzer
Classification
This allows you to configure applications consistently across multiple NAMs, so that the same
user-created application is exported with the same value.
Step 5
Choose a protocol family from the list:
•
CISCO-SNAP
•
DCE-RPC
•
ETHER2
•
IP
•
LLC
•
SCTP-PORT
•
SCTP-PPI
•
SUN-RPC
•
TCP
•
UDP
Choose the the type of traffic you want to create the additional protocol to handle.
Step 6
Enter a port number; the range will vary depending on the protocol family selected. This is an arbitrary
number you assign to handle the additional ports for the protocol family. This protocol number must be
unique so it does not conflict with standard protocol/port assignments.
Step 7
Click the right arrow to add the selections to the “Chosen Protocol/Port” list. To remove an item from
that list, highlight it and click the left arrow.
Step 8
Repeat Step 4 through Step 7 as many times as desired.
Step 9
Click:
•
The Submit button to create the new application.
•
The Reset button to clear the values on the screen.
•
The Cancel button to close the screen and return to the previous screen.
Step 10
Use the pull-down menu to choose a Protocol Family.
Step 11
Enter an integer to use as the beginning port number for the protocol you want to create.
The range is 1-255 for IP and 1-65535 for TCP, UDP, and SCTP.
Step 12
Click the right arrow to add the port to the “Chosen Protocol/Port” field.
Step 13
Click Submit to create the new protocol ports, or click Cancel to clear the dialog of any characters you
entered or restore the previous settings.
Editing an Application
In NAM Traffic Analyzer 5.0, you can only modify the user-defined applications, and not the standard
applications. You can only edit an application for which it states “Custom” in the Engine ID column.
User Guide for the Cisco Network Analysis Module (NAM) Traffic Analyzer, 5.0
OL-22617-01
2-69
Chapter 2
Setting Up The NAM Traffic Analyzer
Classification
To edit an application:
Step 1
Choose Setup > Classification > Applications.
Step 2
Select the application to edit, and click Edit.
The Application Configuration window displays.
Step 3
Make the desired changes (you will only be able to change the name and protocol/port/port range).
Step 4
Do one of the following:
•
To accept the changes, click Submit.
•
To leave the configuration unchanged, click Cancel.
•
To delete the protocol, click Delete.
Deleting a Protocol
To delete a protocol, simply select it from the Application Configuration window, then click Delete.
Application Groups
An application group is a set of applications that can be monitored as a whole. The following topics help
you set up and manage the application group:
•
Creating an Application Group, page 2-70
•
Editing an Application Group, page 2-70
•
Deleting an Application Group, page 2-70
Creating an Application Group
To create an application group:
Step 1
Choose Setup > Classification > Application Groups.
The Application Groups window displays.
Step 2
Click the Create button.
Step 3
Enter the name in the Application Group Name field.
Step 4
Use the next Application field and the Filter button to narrow the list of selectable applications.
Step 5
Select an application and click the Add button. Applications appear in the Selected Applications box.
You can select multiple applications at once by using the Shift button, and then click Add.
Step 6
Click Submit to save your changes, or click Reset to cancel.
User Guide for the Cisco Network Analysis Module (NAM) Traffic Analyzer, 5.0
2-70
OL-22617-01
Chapter 2
Setting Up The NAM Traffic Analyzer
Classification
Editing an Application Group
To edit an application group:
Step 1
Choose Setup > Classification > Application Groups.
Step 2
Select the Application Group by clicking the radio button, then click Edit.
Step 3
Make the necessary changes, then click Submit to save your changes, or click Reset to cancel.
Deleting an Application Group
To delete an application group, simply select the application and then click the Delete button. You can
only delete one application group at a time.
URL-based Applications
URL-based applications are extensions to the list of applications. When the URL in an HTTP request (a
URL on any port that is part of the iana-l4:http protocol, or protocol named “http” under the “iana-l4”
engine ID) matches the criteria of a URL-based application, the traffic is classified as that protocol. The
device interface statistics are collected by regularly (once a minute) polling the ifTable statistics of all
interfaces on the managed device.
A URL-based application can be used the same way as any other application. For example, a URL-based
application can be used in collections, captures, and reports.
An incoming URL is matched against the criteria of the configured URL-based application, in the order
of the index, until a match is found. When a match is found, the remaining URL-based applications are
not considered.
A URL consists of the following parts:
•
a host
•
a path
•
an argument
For example, in the URL http://host.domain.com/intro?id=123:
•
the host part is host.domain.com
•
the path part is /intro
•
the argument part is ?id=123
In the configuration of an URL-based application, the path part and the argument path are combined and
called the path part.
Note
The match strings of the URL-based applications are POSIX-limited regular expressions.
Note
A maximum of 64 URL-based applications can be defined.
To create a URL-based application from a collected URL:
User Guide for the Cisco Network Analysis Module (NAM) Traffic Analyzer, 5.0
OL-22617-01
2-71
Chapter 2
Setting Up The NAM Traffic Analyzer
Classification
Step 1
Choose Setup > Classification > URL-based Applications.
Step 2
Click Create.
The Create URL-based Application window displays.
Enter values in the fields according to Table 2-34, URL-Based Applications.
Table 2-34
URL-Based Applications
Field
Description
Index
A unique number (1-64) of each URL-based application. You can
define up to 64 URL-based applications in NAM.
URL Host Part Match
Matching criteria in the host portion of the URL string appears in
HTTP packets. This match is a POSIX Regular Expression1.
URL Path Part Match
Matching criteria in the path portion of the URL string appears
in HTTP packets. This match is a POSIX Regular Expression1.
Content-Type Match
Matching criteria in the Content-Type field of the HTTP packets.
This match is a POSIX Regular Expression1.
Protocol Description
Description of this URL-based application.
1. A regular expression provides a concise and flexible means for matching strings of text, such as particular
characters, words, or patterns of characters. A regular expression is written in a formal language that can be
interpreted by a regular expression processor, a program that either serves as a parser generator or examines
text and identifies parts that match the provided specification. The IEEE POSIX Basic Regular Expressions
(BRE) standard (released alongside an alternative flavor called Extended Regular Expressions or ERE) was
designed mostly for backward compatibility with the traditional (Simple Regular Expression) syntax but
provided a common standard which has since been adopted as the default syntax of many Unix regular
expression tools, though there is often some variation or additional features. Many such tools also provide
support for ERE syntax with command line arguments. In the BRE syntax, most characters are treated as
literals - they match only themselves (in other words, a matches "a").
Step 3
Click:
•
The Submit button to submit the request
•
The Reset button to clear the values on the screen
•
The Cancel button to close the dialog box and return to the previous screen
Example
After you click submit, the NAM will have an application named “my_host HTTPserver.” It functions
like any user-defined application in the NAM. The packets or octets counter is the number of HTTP
packets that have the URL “HOST=my_host.mydomain.com.”
User Guide for the Cisco Network Analysis Module (NAM) Traffic Analyzer, 5.0
2-72
OL-22617-01
Chapter 2
Setting Up The NAM Traffic Analyzer
Classification
See Figure 2-9 for an example of creating a URL-based application.
Figure 2-9
Example of Creating a URL-Based Application
Editing a URL-Based Application
To edit URL-based applications:
Step 1
Choose Setup > Classification > URL-based Applications.
Step 2
Select a radio button and click Edit.
Note
When editing a URL-based application, the index can not be changed. To change the index (to change
the order of execution) delete the URL-based application and recreate it.
Change the information as desired.
Step 3
Click:
•
The Submit button to submit the request
•
The Reset button to clear the values on the screen
•
The Cancel button to close the dialog box and return to the previous screen.
Deleting a URL-based Application
To delete a URL-based application:
Step 1
Choose Setup > Classification > URL-based Applications.
Step 2
Click the radio button for the item you would like to delete.
Step 3
Click the Delete button.
User Guide for the Cisco Network Analysis Module (NAM) Traffic Analyzer, 5.0
OL-22617-01
2-73
Chapter 2
Setting Up The NAM Traffic Analyzer
Monitoring
Encapsulations
Using Encapsulation gives you increased flexibility when trying to monitor (such as counting or
grouping) different types of application traffic. The encapsulation settings affect how traffic of certain
IP based tunneling protocols are treated in the NAM.
You can use the NAM to set up the way you monitor different types of encapsulation in network traffic
for the following protocols:
•
IPIP4—IP in IP tunneling
•
GREIP—IP over GRE tunneling
•
IPESP—IP with Encapsulating Security Payload
•
GTP—GPRS (General Packet Radio Service) Tunneling Protocol
•
IPIP6—IP in IP tunneling
To configure encapsulation:
Step 1
Choose Setup > Classification > Encapsulations.
The Encapsulations configuration page appears.
Step 2
Use the pull-down menu to choose the type of Encapsulation Configuration you want for each protocol.
•
Application in Tunnel, Inner IP Addresses
In default mode, the NAM uses Application in Tunnel, Inner IP Addresses. In this mode, the NAM
will classify the application based on the payload of the tunneled traffic, and use the inner IP
addresses (IP addresses of the traffic carried inside the tunnel) for reporting and capture.
•
Application in Tunnel, Outer IP Addresses
In the Application in Tunnel, Outer IP Addresses mode, the NAM will also classify the traffic based
on the payload of the tunneled traffic, but use the outer IP addresses (the IP addresses of the tunnel
endpoints) for reporting and capture.
•
Tunnel as Application
In the Tunnel as Application mode, the traffic will be classified as the tunnel protocol and the packet
not further parsed. The outer IP addresses will be used in this case.
Step 3
Click Submit to change the Encapsulation Configuration.
Click Reset to revert to the previous settings since the last Submit.
Monitoring
Before you can monitor data on the NAM Traffic Analyzer, you must set up the data collections. The
NAM 5.0 Traffic Analyzer menu selections for setting up Monitoring are:
•
Aggregation Intervals, page 2-74
•
Response Time, page 2-76
•
Voice, page 2-76
•
RTP Filter, page 2-78
User Guide for the Cisco Network Analysis Module (NAM) Traffic Analyzer, 5.0
2-74
OL-22617-01
Chapter 2
Setting Up The NAM Traffic Analyzer
Monitoring
•
URL, page 2-78
•
WAAS Monitored Servers, page 2-80
Aggregation Intervals
The NAM Traffic Analyzer has short-term and long-term aggregation intervals (referred to as long-term
reporting in NAM 4.x). In NAM Traffic Analyzer Release 5.0, the aggregated data will be displayed in
the dashboards if the query is longer than one day.
The purpose of gathering short term aggregation interval data is for troubleshooting. It has a finer
granularity than long term data (by default, the short term aggregation interval for Traffic/Media is one
minute, and short term response time interval is five minutes).
The purpose of gathering long term interval data is for trending analysis. The smallest aggregation
interval for long term data is one hour (60 minutes).
Caution
If you modify the aggregation intervals, existing collected data that is not in the same aggregation
interval will be completely removed. Data will then start being collected from the beginning again at the
moment the intervals are modified and applied.
Traffic and Media refer to applications, hosts, RTP streams, and voice calls monitoring. Response Time
refers only to application response time. The NAM does not support long term aggregations of data for
the following media: conversations, RTP streams, and voice signaling calls monitoring.
To set up aggregation intervals:
Step 1
Choose Setup > Monitoring > Aggregation Intervals.
Step 2
Choose the desired durations for Short Term Interval and Long Term Interval.
Step 3
Check the “Collect only hosts from user-defined sites (exclude hosts from Unassigned site)” check box
if you want the NAM long term data to only contain information for hosts classified to the user-defined
sites. This check box only applies to the long term data; short term will always collects all hosts.
Note
Enabling the “Collect only hosts from user-define sites” option can significantly speed up report
queries, because it excludes unclassified hosts’ statistics from the database.
When you first start the NAM Traffic Analyzer, in monitoring screens that show site information, you
will see a site named “Unassigned” and with a description of “Unclassified Hosts.” The Unassigned site
includes any that do not match the site configurations. By default, long-term storage will include data
for all sites, including the Unassigned”de site. In some cases, you may not want to view long term data
of hosts that are not in your network, in which case you would check the check box.
Step 4
Click Submit.
User Guide for the Cisco Network Analysis Module (NAM) Traffic Analyzer, 5.0
OL-22617-01
2-75
Chapter 2
Setting Up The NAM Traffic Analyzer
Monitoring
The aggregation intervals determine how much data can be stored in the NAM database. See Table 2-35,
Data Retention for information about data retention.
Table 2-35
Data Retention
Short-Term
Short-Term
Long-Term
Long-Term
Aggregated Data Aggregated Data Aggregated Data Aggregated Data
(Normal)
(Minimum)
(Minimum)
(Normal)1
WS-SVC-NAM-1 and
WS-SVC-NAM-2
24 hours
5 hours
30 days
10 days
All other platforms
72 hours
14 hours
100 days (with
default polling
interval)
30 days (with
default polling
interval)
1. Can depend on how the user configures the LT polling interval. The more frequent polling, the shorter the duration.
Response Time
To configure the timing parameters (or buckets) for response time data collections:
Step 1
Choose Setup > Monitoring > Response Time.
The Response Time Configuration page displays. The settings you make on this window comprise the
time distribution in milliseconds for the detailed Server Application Response Time data collection.
Step 2
Check the “Enable Response Time Monitor” check box.
Step 3
After “Monitored Server Filter”, you will see “Disabled” or “Enabled.” If a WAAS server has been
configured under Setup > Monitoring > WAAS Servers, you will see “Enabled.” Click the Configure
Filter button to configure a filter.
Step 4
Enter the Response Time settings as described in Table 2-36, Response Time Configuration Window.
Table 2-36
Response Time Configuration Window
Field
Description
Usage Notes
RspTime1 (msec)
Upper response time limit for the Enter a number in milliseconds. The
first bucket
default is 5.
RspTime2 (msec)
Upper response time limit for the Enter a number in milliseconds. The
second bucket
default is 10.
RspTime3 (msec)
Upper response time limit for the Enter a number in milliseconds. The
third bucket
default is 50.
RspTime4 (msec)
Upper response time limit for the Enter a number in milliseconds. The
fourth bucket
default is 100.
RspTime5 (msec)
Upper response time limit for the Enter a number in milliseconds. The
fifth bucket
default is 200.
RspTime6 (msec)
Upper response time limit for the Enter a number in milliseconds. The
sixth bucket
default is 500.
Late RspTime
(msec)
The maximum interval that the
Enter a number in milliseconds. The
NAM waits for a server response default is 1000.
to a client request
User Guide for the Cisco Network Analysis Module (NAM) Traffic Analyzer, 5.0
2-76
OL-22617-01
Chapter 2
Setting Up The NAM Traffic Analyzer
Monitoring
Step 5
Accept the default settings or change the settings to the values you want to monitor. Click Submit to
save your changes, or click Reset to cancel.
Voice
After you set up the NAM to monitor voice data, you will be able to view the collected voice data under
the Analyze > Media menu in the NAM. For more information on viewing the voice data, see Media,
page 3-37.
Note
Voice monitoring features are supported with Cisco IP telephony devices only.
To set up voice monitoring:
Step 1
Choose Setup > Monitoring > Voice.
The Voice Monitoring page displays.
Step 2
Check the “Enable Call Signal Monitoring” check box.
Step 3
Accept the default MOS Score value range or modify the values as you prefer. See Table 2-37, Voice
Monitor Setup Window.
Table 2-37
Voice Monitor Setup Window
Field
Description
Voice Monitoring
Enabled
Enables voice monitoring
MOS Values
Excellent
Highest quality MOS score (5.0 being highest). The default value is
5.00.
Good
Quality less than excellent; MOS score ranges from this setting to
less than excellent. The default value is 4.33.
Fair
Quality less than good; MOS score ranges from this setting to less
than good. The default value is 4.02.
Poor
Quality less than excellent; MOS score ranges from this setting to
less than fair. The default value is 3.59.
Table 2-38, Maximum and Default Voice/Video and RTP Stream Parameters per Platform provides the
maximum numbers allowed for various voice, video, and RTP streams depending on the NAM platform.
The default values for each parameter are in parenthesis.
Table 2-38
Maximum and Default Voice/Video and RTP Stream Parameters per Platform
Field
2220 Appliance
2204 Appliance NAM-2(x)
NAM-1(x)
NME-NAM
RTP Streams
4,000 (2000)
1,500 (750)
800 (400)
400 (200)
100 (50)
Max Active Calls
2,000 (1,000)
750 (375)
400 (200)
200 (100)
50 (25)
User Guide for the Cisco Network Analysis Module (NAM) Traffic Analyzer, 5.0
OL-22617-01
2-77
Chapter 2
Setting Up The NAM Traffic Analyzer
Monitoring
Table 2-38
Note
Step 4
Maximum and Default Voice/Video and RTP Stream Parameters per Platform
Field
2220 Appliance
2204 Appliance NAM-2(x)
NAM-1(x)
NME-NAM
Known Phones
10,000 (5,000)
3,500 (1,750)
2,000 (1,000) 1,000 (500)
Phone History
25,000 (12,500)
7,000 (3,500)
5,000 (2,500) 2,500 (1,250) 600 (300)
250 (125)
To report jitter and packet loss for the SCCP protocol, you must enable CDR on Cisco Unified
CallManager. For more information on Cisco Unified CallManager, see the Cisco Unified CallManager
documentation.
http://www.cisco.com/en/US/products/sw/voicesw/ps556/tsd_products_support_series_home.html
Click Submit to save your changes, or click Reset to cancel and revert to the previous settings.
RTP Filter
When the NAM Traffic Analyzer is initially started, RTP stream traffic will automatically start being
monitored. The NAM enables you to monitor all RTP stream traffic among all SPANed traffic, without
having to know the signaling traffic used in negotiating the RTP channels. RTP Stream Monitoring is
enabled by default under Setup > Monitoring > RTP Filter. To disable it, uncheck the “Enable RTP
Stream Monitoring” check box and click the Submit button to apply the change.
To create an RTP filter:
Step 1
Choose Setup > Monitoring > RTP Filter.
Step 2
Click the Create button.
Step 3
From the drop-down menu, choose the protocol (IP or IPv6).
Step 4
Enter the Source Address, Source Mask, Destination Address, and Destination Mask.
Step 5
Click OK.
URL
The URL collection listens to traffic on TCP port 80 of a selected datasource and collects URLs. Any
protocol which has its master port set to TCP port 80 can be used for URL collections. Only one
collection on a single datasource can be enabled at a time.
A URL, for example: http://host.domain.com/intro?id=123, consists of a host part
(host.domain.com), a path part (intro), and an arguments part (?id=123).
The collection can be configured to collect all parts or it can configured to collect only some of the parts
and ignore others.
This section contains the following procedures:
•
Enabling a URL Collection
•
Changing a URL Collection
User Guide for the Cisco Network Analysis Module (NAM) Traffic Analyzer, 5.0
2-78
OL-22617-01
Chapter 2
Setting Up The NAM Traffic Analyzer
Monitoring
•
Disabling a URL Collection
Enabling a URL Collection
To enable a URL collection:
Step 1
Choose Setup > Monitoring > URL.
The URL screen displays.
Figure 2-10
Step 2
Check the Enable check box to initiate URL Collection.
Note
Step 3
URL Collection Configuration Dialog Box
The collection will not begin until you click Submit.
Provide the information described in Table 2-39, URL Collection Configuration Dialog Box.
You can enter a partial name of a data source and click Filter to find data sources that match. Choose
Clear to return to the entire list of data sources.
Note
Depending on which radio button option is collected, the format of the URL varies. For example, the
leading http: part is only present if the host part is collected. Keep this variable in mind, when
configuring a match only expression.
User Guide for the Cisco Network Analysis Module (NAM) Traffic Analyzer, 5.0
OL-22617-01
2-79
Chapter 2
Setting Up The NAM Traffic Analyzer
Monitoring
:
Table 2-39
URL Collection Configuration Dialog Box
Element
Description
Data Source
Identifies type of traffic incoming Select one of the options from the drop
from the application.
down box.
Max Entries
Maximum number of URLS to
collect.
Match only
The application URL to match.
Step 4
Check the Recycle Entries check box to recycle entries.
Step 5
Check the check box for one of the following:
Step 6
•
Collect complete URL (Host, Path and Arguments)
•
Collect Host only (ignore Path and Arguments)
•
Collect Host and Path (ignore Arguments)
•
Collect Path and Arguments (ignore Host)
•
Collect Path only (ignore Host and Arguments)
Usage Notes
Select one of the following options from
the drop down box:
•
100
•
500
•
1000
Optional parameter to limit collection
of URLs that match the regular
expression of this field.
Click Submit to save your changes, or click Reset to cancel.
Changing a URL Collection
To change a URL collection:
Step 1
Choose Setup > Monitoring > URL.
The URL page (Figure 2-10) displays.
Step 2
Change the information as described in Table 2-39, URL Collection Configuration Dialog Box.
Note
Changing any parameters and applying the changes flushes the collected URLs and restarts the
collection process.
Step 3
Click Submit to save your changes, or click Reset to cancel.
User Guide for the Cisco Network Analysis Module (NAM) Traffic Analyzer, 5.0
2-80
OL-22617-01
Chapter 2
Setting Up The NAM Traffic Analyzer
Monitoring
Disabling a URL Collection
To disable a URL collection:
Step 1
Choose Setup > Monitoring > URL Collection.
Step 2
Uncheck the Enable check box.
Step 3
Click Submit.
WAAS Monitored Servers
WAAS monitored servers specify the servers from which WAAS devices export traffic flow data to the
NAM monitors. To enable WAAS monitoring, you must list the servers to be monitored by the NAM
using the WAAS device's flow monitoring.
Note
The NAM is unable to monitor WAAS traffic until you set up WAAS monitored servers. The NAM
displays status of WAAS devices as pending until you set up WAAS monitored servers.
This section contains the following topics:
•
Adding a WAAS Monitored Server, page 2-81
•
Deleting a WAAS Monitored Server, page 2-81
Adding a WAAS Monitored Server
To add a WAAS monitored server:
Step 1
Choose Setup > Monitoring > WAAS Servers. The WAAS Servers page displays. Figure 2-11 shows
an example of the WAAS Monitored Servers table.
Figure 2-11
WAAS Monitored Servers Table
Step 2
Check the “Filter Response Time for all Data Sources by Monitored Servers” check box if you want the
NAM to compute response time data only for the servers from this list for all data sources, including
non-WAAS data sources. All other servers will be ignored in response time monitoring views. This
enables you to reduce NAM workload and to improve NAM overall performance.
Step 3
Click Add.
User Guide for the Cisco Network Analysis Module (NAM) Traffic Analyzer, 5.0
OL-22617-01
2-81
Chapter 2
Setting Up The NAM Traffic Analyzer
Monitoring
The Add WAAS Server(s) dialog box displays.
Step 4
Enter the server IP address in the Server Address field. You can paste multiple IP addresses here as well.
Step 5
Click Submit.
Deleting a WAAS Monitored Server
To delete a WAAS monitored server data source:
Step 1
Choose Setup > Monitoring > WAAS Servers.
The WAAS Servers page displays any WAAS monitored servers.
Step 2
Select the monitored WAAS server to delete, then click Delete.
A confirmation dialog displays to ensure you want to delete the selected WAAS monitored server.
Step 3
Click OK to delete the WAAS monitored server.
User Guide for the Cisco Network Analysis Module (NAM) Traffic Analyzer, 5.0
2-82
OL-22617-01
CH A P T E R
3
Monitoring and Analysis
The Cisco NAM Traffic Analyzer Release 5.0 introduces a redesigned interface and user experience,
with more intuitive workflows and interactive reporting capabilities.
There are two types of dashboards in NAM 5.0: One type is the “summary” views found under the
Monitor menu, and the other type is the “over time” views found under the Analyze menu. The Monitor
dashboards allow you to view network traffic, application performance, site performance, and alarms at
a glance. From there, you can isolate one area, for example an application with response time issues, and
then drill-down to the Analyze dashboard for further investigation.
This chapter provides information about monitoring your network traffic and analyzing the information
presented.
This chapter contains the following sections:
•
Navigation, page 3-2
Monitor
•
Traffic Summary, page 3-4
•
Response Time Summary, page 3-5
•
Site Summary, page 3-6
•
Alarm Summary, page 3-6
Analyze
•
Analyzing Traffic, page 3-8
•
WAN Optimization, page 3-17
•
Response Time, page 3-19
•
Managed Device, page 3-29
•
Media, page 3-37
User Guide for the Cisco Network Analysis Module (NAM) Traffic Analyzer, 5.0
OL-22617-01
3-1
Chapter 3
Monitoring and Analysis
Navigation
Navigation
Context Menus
On most of the dashboards, you can left-click on the colored bar of data to get a context menu, with
which you can get more detailed information about one particular application.
The description to the right of “Selected Application” in the menu shows what item you had clicked on
(in the case above, “ftp”).
The menu items above the separator line are specific to the selected element of the Top N chart. The
items below the separator line are not specific to the selected element, but apply to the Top N chart.
Interactive Report
On most Monitoring or Analyze screens, you can use the Interactive Report on the left to redefine the
parameters of the information displayed in the dashboards. Click the Filter button to change the
parameters of the information displayed in the charts.
You can choose from various parameters, such as the time interval for the data being displayed. An
asterisk represents required fields.
The reporting time interval selection changes depending upon the dashboard you are viewing, and the
NAM platform you are using:
•
The NAM appliance supports the following short term intervals: Last 5 minutes, last 15 minutes, last
1 hour, last 4 hours, and last 8 hours.
•
The Branch Routers (NME-NAM) support the following short term intervals: Last 5 minutes, last
15 minutes, and last 1 hour.
•
The other platforms support the following short term intervals: Last 5 minutes, last 15 minutes, last
1 hour, and last 4 hours.
•
The Long Term interval selections (Last 1 day, 1 week, and 1 month) are disabled from the following
dashboards: RTP Streams, Voice Call Statistics, Calls Tables, RTP Conversations, Host
Conversations, Conversations, and Response Time Details Views.
User Guide for the Cisco Network Analysis Module (NAM) Traffic Analyzer, 5.0
3-2
OL-22617-01
Chapter 3
Monitoring and Analysis
Navigation
•
Maximum interval for up to 1 hour is supported for the following dashboards: RTP Streams, Voice
Call Statistics, Calls Tables, RTP Conversations, Host Conversations, Conversations, and Response
Time Details Views.
The “From” and “To” fields are only enabled when the Time Range is set to “Custom.”
Saving Filter Parameters
After clicking the Filter button in the Interactive Report and selecting the desired parameters, you can
then save these selections with the purpose of viewing that same data at a future time. Enter a name in
the “Filter Name” field, as shown in Figure 3-1. A filter will only be saved if a Filter Name is entered.
Also, only saved filters are persisted across muliple login sessions. Click the Submit button.
Figure 3-1
Saving Filter Information
This filter is now saved and displayed underneath the Interactive Report, as shown in Figure 3-2. You
can save up to five filters.
Figure 3-2
Filter Parameters Accessible
User Guide for the Cisco Network Analysis Module (NAM) Traffic Analyzer, 5.0
OL-22617-01
3-3
Chapter 3
Monitoring and Analysis
Traffic Summary
Traffic Summary
The Traffic Summary Dashboard allows you to view the Top N Applications, Top N Application Groups,
Top N Hosts (In and Out), IP Distribution by Bytes, Top N DSCP, and Top N VLAN being monitored on
your network. It provides auto-monitoring of traffic from all potential data sources (for example, SPAN,
NDE, and WAAS). You can get to the Traffic Summary Dashboard by going to Monitor > Overview >
Traffic Summary.
You can use the Interactive Report on the left to filter the information for a particular Site, Data Source,
VLAN, or reporting time interval. You can specify just one type of criteria and leave the others blank,
or specify all of them. You can also choose to view the Rate or cumulative data from the Interactive
Report.
When you log into the NAM for the first time, the default view will be the Traffic Summary dashboard,
and the top data source is selected by default.
For each chart described below, you can left-click on any colored bar to get to a context menu, with
which you can get more detailed information about that item.
The charts shown on this dashboard are:
•
Top N Applications
The Top N Applications Chart enables you to view the traffic rate (bytes per second or bits per
second) or traffic volume (bytes or bits), depending on the Interactive Report filter selection (data
rate or cumulative, respectively). When you place your cursor over the colored bar, you will see the
number of bytes per second collected or the total bytes over the last time interval.
If you left-click on a colored bar and choose “Capture” from the context menu, you can start a
capture on this data (see Chapter 4, “Capturing and Decoding Packet Data” for more information
about Capture).
•
Top N Application Groups
This chart shows a detailed analysis of the Top N application groups and the traffic rate or volume
for this interval. In the Interactive Report, you can select either rate or cumulative, where rate is the
bytes per second, and cumulative is the total number of bytes.
•
Top N Hosts (In and Out)
This chart displays the traffic rate (bytes per second or bits per second) or traffic volume (bytes or
bits). To get more specific details about the host activity, left-click on the colored bar and make a
selection. You can also choose “Capture” from the context menu to start a capture on this data (see
Chapter 4, “Capturing and Decoding Packet Data” for more information about Capture).
•
IP Distribution by Bytes
This chart shows the percentages of bytes being distributed to IP protocols (for example, IPv4 TCP).
•
Top N DSCP
This chart shows statistics for the top DSCP Aggregation Groups.
•
Top N VLAN
This chart shows the Top N VLAN statistics. In this chart, you may see VLAN 0, which is for traffic
that does not have any VLAN tags. You can also use this value in Capture to do filtering.
If you left-click on a colored bar and choose “Capture” from the context menu, you can start a
capture on this data (see Chapter 4, “Capturing and Decoding Packet Data” for more information
about Capture).
User Guide for the Cisco Network Analysis Module (NAM) Traffic Analyzer, 5.0
3-4
OL-22617-01
Chapter 3
Monitoring and Analysis
Response Time Summary
To see a chart in table format, use the “View as Chart / View as Grid” toggle button on the bottom right
corner of the chart. You can also click the “View as Image” button to view the image and save it as a
PNG file.
When viewing the data as a Grid, the numbers will be formatted according to what you have configured
in Administration > System > Preferences. On that page, you can also configure the number of Top N
entries you would like to display.
Response Time Summary
The NAM Traffic Analyzer software provides response time measurements and various
user-experience-related metrics, which are computed by monitoring and time-stamping packets sent
from the user to the server providing services. These Application Response Time Metrics are available
to view under the Response Time Summary Dashboard (Monitor > Overview > Response Time
Summary). In NAM 4.x, this was referred to as Intelligent Application Performance (IAP) analytics.
After the NAM Traffic Analyzer is started, these metrics will begin to populate automatically. When you
first navigate to Response Time Summary dashboard, the top data source is selected by default. This
dashboard shows you performance statistics for Site, Data Source, VLAN, and a specific amount of time.
Use the Interactive Report window on the left side of the screen to change the parameters for the
information displayed. To see a chart in table format, use the “View as Chart / View as Grid” toggle
button on the bottom right corner of the chart. You can also click the “View as Image” button to view the
image and save it as a PNG file.
The dashboard charts will show you the following information:
•
Top N Applications by Server Response Time
This chart displays the server response times for the applications in the site, data source, VLAN, or
site clients or servers you selected in the Interactive Report window. For example, a selection “http”
would show you the average response time of http servers seen in the traffic category you have
selected in the Interactive Report window. The data is shown in microseconds.
•
Top N Site-to-Site Network Time
This chart displays the top network time between the client site and the server site in the category
you selected. The data is shown in microseconds.
•
Top N Servers By Server Response Time
This chart allows you to see how well servers are performing, by showing you the server that has the
longest response time (the item appearing at the top). The data is shown in microseconds.
•
Top N Servers By Bytes
This chart displays the total bytes or rate of traffic for the top servers.
Note
•
To change from bytes to bits, choose Administration > System > Preferences and change
the “Data displayed in” selection.
Top N Clients By Transaction Time
This chart displays the transaction time per client. The client with the highest response time appears
on top. The data is shown in milliseconds.
•
Top N Clients By Bytes
This chart displays the total bytes or rate of traffic for the top clients.
User Guide for the Cisco Network Analysis Module (NAM) Traffic Analyzer, 5.0
OL-22617-01
3-5
Chapter 3
Monitoring and Analysis
Site Summary
Note
To change from bytes to bits, choose Administration > System > Preferences and change
the “Data displayed in” selection.
Site Summary
The Site Summary Dashboard (accessed by choosing Monitor > Overview > Site Summary) will show
you information about the sites in your network. You can use the Interactive Report on the left side of
the screen to change the information displayed. For more information about sites, see Sites, page 2-58.
The charts displayed on the Alarm Summary dashboard are:
•
Top N Site Pairs by Traffic
This chart shows top site to site traffic.
•
Top N Sites by Average Transaction Time
This chart shows the average transaction time by site.
•
Top N Sites by Traffic
This chart shows the sites that have the most traffic (which are the most active). It is a total of all
the traffic sent or received for hosts that belong to the particular site, which means that this traffic
includes intra-site traffic as well.
•
Top N Sites by Average MOS
This chart shows sites that have the highest average Mean Opinion Score (MOS).
MOS will normally range from 1-5, denoting the perceived quality of the transmission, where 1 is
the lowest perceived quality, and 5 is the highest perceived quality measurement. The MOS is
weighted depending on the duration.
To see any of the charts in table format, use the “View as Chart / View as Grid” toggle button on the
bottom right corner of the chart. You can also click the “View as Image” button to view the image and
save it as a PNG file. The numbers will be formatted according to what you have configured in
Administration > Settings > Preferences.
Alarm Summary
The Alarm Summary Dashboard (accessed by choosing Monitor > Overview > Alarm Summary) will
show you the top alarms occurring in the network.
To display network traffic information for a particular amount of time, use the Interactive Report on the
left side of the screen. The Severity Selector in the Interactive Report allows you to choose to view high
severity alarms only, low severity alarms only, or both high and low severity alarms (these settings are
configured under Setup > Alarms > Thresholds). You can also choose the desired amount of time from
the Time Range drop-down menu, or you can customize the time range.
On any chart on the Alarm Summary Dashboard, you can click on a colored bar to see the Context menu,
with which you can get more information.
If you do not set any alarms or thresholds, the Alarm Summary Dashboard will have no data. For
information on setting up alarms and thresholds, see Alarms, page 2-36.
User Guide for the Cisco Network Analysis Module (NAM) Traffic Analyzer, 5.0
3-6
OL-22617-01
Chapter 3
Monitoring and Analysis
Alarm Summary
Note
You could see a count of two alarms for the same occurrence if:
- both the source and the destination are in the same site in the Top N Site - Host Pair chart.
- both the source and the destination are in the same site in the Top N Site chart.
- both the source and the destination are in the same site using the same application in the Top N Site Application Pair chart.
Note
You will not have any data in Top N Site - Application and Top N Application if there is no threshold
configured that involves an application (for example: Response Time threshold or Application
threshold).
NDE Interface alarms are not related to any site; therefore, they will not appear on the four colored site
alarm charts on the Alarm Summary dashboard. Instead, the New Alarms Raised and Last 50 Alarms
tables at the bottom of this screen will contain NDE Interface alarms raised.
The five charts displayed on the Alarm Summary dashboard are:
•
Top N Sites by Alarm Count
This chart will list the Top N sites (maximum of 10) that have the most alarm triggers during the
selected time range. If no thresholds are configured, this chart will have no data.The number on the
bottom of the chart is the alarm count.
You can configure thresholds under Setup > Alarms > Thresholds. You can configure the Top N
entries under Administration > System > Preferences.
•
Top N Hosts by Site and Alarm Count
This chart shows the number of alarm messages during the selected time range that are triggered for
Hosts across all sites, by the Site - Host Pair.
•
Top N Applications by Alarm Count
This chart shows the number of alarms during the selected time range for Applications across all
sites.
•
Top N Applications by Site and Alarm Count
This chart shows the most alarm triggers during the selected time range by the application and site
pair.
•
New Alarms Raised
The New Alarms Raised table shows you all alarms that occurred during the interval selected in the
Interactive Report window. Some alarms may have been triggered outside of the time period, but
may still be occurring.
You can use the Filter drop-down menu to filter the alarms.
•
Last 50 Alarms
The Last 50 Alarms table shows you the alarms that occurred during the interval selected in the
Interactive Report window. Some alarms may have been triggered outside of the time period, but
may still be occurring.
You can click the “All Alarms” button at the bottom to bring up a separate window, which will show
you all 50 alarms without the need for scrolling.
You can also use the “Filter” button, both on this screen and the “All Alarms” screen, to display only
alarms that meet the criteria you enter.
User Guide for the Cisco Network Analysis Module (NAM) Traffic Analyzer, 5.0
OL-22617-01
3-7
Chapter 3
Monitoring and Analysis
Analyzing Traffic
Table 3-1
Field
Description
Site
This contain site or source and destination sites (source - destination)
of the network traffic that generated the alarm message.
Alarm Triggered By
Details information of the network traffic that generated the alarm
message. The format of the alarm triggered by string are:
•
Triggered by application threshold: application
•
Triggered by application with DSCP threshold: DSCP:codepoint application
•
Triggered by host threshold: host
•
Triggered by host with application threshold: host - application
•
Triggered by host with application and DSCP: DSCP: code point
- host - application
•
Triggered by host with DSCP: DSCP: code point - host
•
Triggered by conversation: source - destination
•
Triggered by conversation with application: source - application destination
•
Triggered by response time: IAP: client - application - server.
•
Triggered by DSCP: DSCP: code point
•
Triggered by RTP stream: source - source port - codec(codec
string) - SSRC(number) - destination - destination port
•
Triggered by voice signaling: Calling (address - number) Called
(address - number) ID/References(id() - ref(calling:called))
•
Triggered by NDE interfaces: NDE: Device (address) If-Index(number) - Ingress/Egress
Threshold Variable
Parameter of the threshold that is used to evaluate alarm condition.
Threshold Value
User defined rising value of the threshold variable.
Triggered Time
Time when the alarm condition was found occurred.
Triggered Value
Parameter value when the alarm condition was raised. Note: The
triggered value could be - when the viewing window does not included
the alarm when it was occurring.
Clear Time
Time when the alarm condition was resolved. The alarm variable has
fallen below the falling threshold value.
Analyzing Traffic
The charts available under the “Analyze” menu show statistics that occur over time.
User Guide for the Cisco Network Analysis Module (NAM) Traffic Analyzer, 5.0
3-8
OL-22617-01
Chapter 3
Monitoring and Analysis
Analyzing Traffic
You can use the Zoom/Pan feature, in which you can drag the beginning or end to change the time
interval, as shown below.
The time interval change on the zoom/pan chart will affect the data presented in the charts in the bottom
of the window. The zoom/pan time interval also affects the drill-down navigations; if the zoom/pan
interval is modified, the context menu drill-downs from that dashboard will use the zoom/pan time
interval.
Note
In a bar chart which you can zoom/pan, each block represents data collected during the previous interval
(the time stamp displayed at the bottom of each block is the end of the time range). Therefore, you may
have to drag the zoom/pan one block further than expected to get the desired data to populate in the charts
in the bottom of the window.
The NAM 5.0 Traffic Analyzer menu selections for Analyze > Traffic are:
•
Application, page 3-9
•
Host, page 3-10
•
NDE Interface Traffic Analysis, page 3-11
•
DSCP, page 3-12
•
URL Hits, page 3-14
Application
The Application Analysis screen will show you at a glance the traffic level for a giver application over
a selected period of time. It is available under the menu option Analyze > Traffic > Application. It will
show you:
•
A graph of application traffic over time
•
Top hosts transmitting and receiving traffc on that application for the selected time period
•
Application Configuration -- Shows the criteria by which the NAM classifies packets as that
application. This is typically a list of TCP and/or UDP ports that identify the application. Note that
some applications are identified by heuristic or other state-based algorithms.
Hosts Detail
On the “Top N Hosts - Traffic In” or “Top N Hosts - Traffic Out” chart, you can left-click a colored bar
to get the context menu, and choose “Hosts Detail” to see the All Hosts screen and the detailed
information about all hosts. Table 3-3 describes the fields on the All Hosts screen.
User Guide for the Cisco Network Analysis Module (NAM) Traffic Analyzer, 5.0
OL-22617-01
3-9
Chapter 3
Monitoring and Analysis
Analyzing Traffic
Table 3-2
Host Detail
Field
Description
Host
Host address
Application
Application type
In Bytes/sec
Number of bytes per second incoming
In Packets/sec
Number of packets per second incoming
Out Bytes/sec
Number of bytes per second outgoing
Out Packets/sec
Number of packets per second outgoing
Host
The Host Traffic Analysis Screen will show you at a quick glance the input and output of a particular
host over time. It is available under the menu option Analyze > Traffic > Host. It will show you:
•
Input and output traffic for the host over time
•
Top N application activity of the host over the selected interval
•
Total application usage distribution for the host
Figure 3-3
Host Traffic Analysis
Applications Detail
On the “Top N Applications” chart, you can left-click a colored bar to get the context menu, and choose
“Applications Detail” to see the All Applications screen and the detailed information about all
applications. Table 3-3 describes the fields on the All Applications screen.
User Guide for the Cisco Network Analysis Module (NAM) Traffic Analyzer, 5.0
3-10
OL-22617-01
Chapter 3
Monitoring and Analysis
Analyzing Traffic
Table 3-3
Applications Detail
Field
Description
Application
Application type
Application Group
The application group (set of applications that can be
monitored as a whole).
Bytes/sec
Traffic rate; number of bytes per second
Packets/sec
Traffic rate; number of packets per second
NDE Interface Traffic Analysis
The NDE Interface Analysis page enables you to view data collected for individual interfaces on a switch
or router that is exporting Netflow packets to the NAM. The displayed information represents the total
data collected since the collection was created, or since the NAM was restarted. To view the NDE
Interface Analysis page, choose Analyze > Traffic > NDE Interface.
You need to configure the NDE interface capacity to see both the utilization in the charts and the
interface name on the NDE interface list. See NDE Interface Capacity, page 2-63.
You can also give the SNMP RO (or RW) community string to an NDE data source, and then the NAM
will fill up the NDE interface Capacity. Choose Setup > NAM Data Sources to enter the community
string. For more information, see Creating NetFlow Data Sources Using the Web GUI, page 2-23 or
Creating NetFlow Data Sources Using the CLI, page 2-25.
Select an interface from the Interface Selector on the left side of the screen to see traffic in the charts
(see Figure 3-4). Click the arrow icon to the left of the NDE data source name to display all interfaces,
and then select an interface. If the charts show no data, and you see a message “Interface needs to be
selected,” you have not yet chosen an interface.
Figure 3-4
Interface Selector
Once you have chosen the interface, you will see the following charts populated:
•
Interface Traffic (Ingress % Utilization and Egress % Utilization)
•
Top N Applications - Ingress
User Guide for the Cisco Network Analysis Module (NAM) Traffic Analyzer, 5.0
OL-22617-01
3-11
Chapter 3
Monitoring and Analysis
Analyzing Traffic
•
Top N Applications - Egress
•
Top N Hosts - Ingress
•
Top N Hosts - Egress
•
Top N DSCP Aggr - Ingress
•
Top N DSCP Aggr - Egress
The interface speed can be entered manually through the Interface capacity table, or it can be auto
configured if the SNMP settings for the NDE device are entered in data source table.
Viewing Interface Details
To view packet distribution details on a specific interface, click the interface name (or interface index)
in the Interface Selector on the left side of the screen. The detail window displays with a chart that shows
the total packet distribution on the specified interface.
DSCP Detail
On the “Top N DSCP Aggr - Ingress” and “Top N DSCP Aggr - Egress” chart, you can left-click a
colored bar to get the context menu, and choose “DSCP Detail” to see the “All DSCP” screen. You can
also get to this screen by choosing Analyze > Traffic > DSCP Traffic from the menu and clicking the
“All DSCP” button on the right.
Table 3-4 describes the fields on the All Applications screen.
Table 3-4
DSCP Detail
Field
Description
DSCP
DSCP value
Application
Application type
Bits/sec or Bytes/sec
Traffic rate; number of bits or bytes per second
Note
Packets/sec
In Administration > System > Preferences, you
can choose to display NAM data in Bits or Bytes.
Traffic rate; number of packets per second
DSCP
Differentiated services monitoring (DiffServ) is designed to monitor the network traffic usage of
differentiated services code point (DSCP) values.
To monitor DSCP groups, you must configure at least one aggregation profile and one or more
aggregation groups associated with each profile. For more information on configuring an aggregation
profile, see DSCP Groups, page 2-64.
You can monitor the DSCP information by going to Analyze > Traffic > DSCP Traffic Analysis. You
will see the DSCP group information as shown in Figure 3-5.
User Guide for the Cisco Network Analysis Module (NAM) Traffic Analyzer, 5.0
3-12
OL-22617-01
Chapter 3
Monitoring and Analysis
Analyzing Traffic
Figure 3-5
DSCP Group Traffic Over Time
On this screen, you will see:
•
Traffic volume over time for the selected DSCP group
•
Top N applications and application groups using that DSCP group
•
Top N hosts transmitting and receiving traffic on that DSCP group
Application Groups Detail
On the “Top N Application Groups” chart, you can left-click a colored bar to get the context menu, and
choose “Applications Groups Detail” to see the All Application Groups screen and the detailed
information about all application groups. Table 3-5 describes the fields on the All Applications screen.
Table 3-5
Application Groups Detail
Field
Description
Application Group
The application group (set of applications that can be
monitored as a whole).
Site
Applicable site (or Unassigned if no site)
Bytes/sec
Traffic rate; number of bytes per second
Packets/sec
Traffic rate; number of packets per second
User Guide for the Cisco Network Analysis Module (NAM) Traffic Analyzer, 5.0
OL-22617-01
3-13
Chapter 3
Monitoring and Analysis
Analyzing Traffic
URL Hits
You can analyze the URLs collected by the NAM (for setup, see URL, page 2-78). This section contains
the following procedures:
•
Viewing Collected URLs
•
Filtering a URL Collection List
Viewing Collected URLs
To view collected URLs:
Step 1
Choose Analyze > Traffic > URL.
The URLs Window displays with the collected URLs. The columns are described in Table 3-6.
Table 3-6
Note
URLs Table
Field
Description
Index
URL index
URL
URL text
Hits
Number of hits
Only one URL collection can be active at one time. The data source is for information only.
Filtering a URL Collection List
To filter a URL collection list:
Step 1
From the drop-down list in the URLs Window (Analyze > Traffic > URL), select which part of the URL
to filter:
•
URL—You can filter on any part of the URL
•
Host—This filter applies only to the host part of collected URLs.
•
Path—This filter applies only to the path part of the collected URLs
•
Arguments—This filter applies only to the argument part of the collected URLs.
Step 2
Enter filter string.
Step 3
Click Filter to apply the filter.
Note
To remove any display filter and show all URLs collected, click Clear.
User Guide for the Cisco Network Analysis Module (NAM) Traffic Analyzer, 5.0
3-14
OL-22617-01
Chapter 3
Monitoring and Analysis
Analyzing Traffic
Host Conversations
If you choose Analyze > Traffic > Detailed Views > Host Conversations, and click on “Host” in the
host coversation tables, you can see detailed lists of all the conversations for a particular host:
•
Table of hosts which are sending packets to the selected host, along with application, vlan, and
traffic rate information.
•
Table of hosts which are receiving packets from the selected host, along with application, vlan, and
traffic rate information.
•
Breakout of application usage for the selected host.
Use the Filter button in the Interactive Report (left side of the screen) to change the parameters of the
information displayed.
The NAM Traffic Analyzer only supports a maximum Time Range of one hour filter for the Host
Conversations, Network Conversation, RTP Streams, Voice Calls Statistics, Calls Table, and RTP
Conversations.
Network Conversation
If you choose Analyze > Traffic > Detailed Views > Conversations, you can see a detailed analysis of
all Network Conversations (including packets and bits information).
Use the Filter button in the Interactive Report (left side of the screen) to change the information
displayed.
Figure 3-6
Network Conversations
The NAM Traffic Analyzer only supports a maximum Time Range of one hour filter for the Host
Conversations, Network Conversation, RTP Streams, Voice Calls Statistics, Calls Table, and RTP
Conversations.
Top Application Traffic
When you choose Analyze > Traffic > Detailed Views > Top Application Traffic, you can view the
top applications by traffic rate over a selected time and for the specified site and/or data source.
User Guide for the Cisco Network Analysis Module (NAM) Traffic Analyzer, 5.0
OL-22617-01
3-15
Chapter 3
Monitoring and Analysis
Analyzing Traffic
Applications Over Time, as shown in Figure 3-7, will show you all of the applications that have been
running for the time period interval. The color-coded legend shows you what the applications are
running.
Figure 3-7
Top Application Traffic
If you place your cursor over any of the data points, you will get more details about the exact values for
each of the applications that are running, as shown in Figure 3-8.
Figure 3-8
Mouse-Over Details
User Guide for the Cisco Network Analysis Module (NAM) Traffic Analyzer, 5.0
3-16
OL-22617-01
Chapter 3
Monitoring and Analysis
WAN Optimization
Application Traffic By Host
When you choose Analyze > Traffic > Detailed Views > Application Traffic By Hosts, you will see
the traffic for a given application broken out by individual hosts using the application (see Figure 3-9).
You may specify the time period to view, as well as the application, site (optional), data source
(optional), and VLAN (optional).
Figure 3-9
Application Traffic By Host
The NAM Traffic Analyzer only supports a maximum Time Range of one hour filter for the Host
Conversations, Network Conversation, RTP Streams, Voice Calls Statistics, Calls Table, and RTP
Conversations.
WAN Optimization
The NAM can provide insight into WAN Optimization offerings that compress and optimize WAN
Traffic for pre- and post-deployment scenarios. This is applicable for Optimized and Passthru traffic.
The NAM 5.0 Traffic Analyzer menu selections for WAN Optimization are:
•
Top Talkers Detail, page 3-17
•
Application Performance Analysis, page 3-18
•
Conversation Multi-Segments, page 3-18
Top Talkers Detail
While you are in the process of deploying WAAS devices, you can get data to assist in the WAAS
planning and configuration. For information about setting up WAN traffic, see Adding Data Sources for
New WAAS Device, page 2-33.
When you choose Monitor > WAN Optimization > Top Talkers Detail, you will see the window that
assists you in the pre-deployment process. Use the Interactive Report window to select the traffic you
want to analyze for optimization. It will show you the Top Applications, Top Network Links, Top
Clients, and Top Servers. It will not be available for the NetFlow (NDE) data sources.
Based on the results, you can then configure the WAAS products to optimize your network.
User Guide for the Cisco Network Analysis Module (NAM) Traffic Analyzer, 5.0
OL-22617-01
3-17
Chapter 3
Monitoring and Analysis
WAN Optimization
Application Performance Analysis
To analyze the WAAS traffic, choose Analyze > WAN Optimization > Application Performance
Analysis.
The charts available on this page are:
•
Transaction Time (Client Experience)
•
Traffic Volume and Compression Ratio
•
Average Concurrent Connections (Optimized vs. Passthru)
•
Multi-Segment Network Time (Client LAN - WAN - Server LAN)
Transaction Time (Client Experience)
This chart displays the average client transaction time. One line represents pass-through traffic (in which
optimization is turned off), and the second represents optimized traffic. After setting up optimization for
a certain period, you can compare the two lines and see where the vertical drop in the chart occurs. The
data is shown in milliseconds.
Traffic Volume and Compression Ratio
This chart shows the bandwidth reduction ratio between the number of bytes before compression and the
number of bytes after compression.
Average Concurrent Connections (Optimized vs. Passthru)
This chart shows the number of concurrent connections during a specified time and can be used for
capacity planning.
Multi-Segment Network Time (Client LAN - WAN - Server LAN)
This chart shows the network time between the multiple segments. The data is shown in milliseconds.
Conversation Multi-Segments
Use the Conversation Multiple Segments window to monitor WAAS traffic. This window provides a
correlation of data from different data sources, and allows you to view and compare response time
metrics from multiple WAAS segments (data sources). You can access this window from Analyze >
WAN Optimization > Conversation Multi-segments.
The Response Time Across Multiple Segments window shows response time metrics of the selected
server or client-server pair from applicable data sources.
User Guide for the Cisco Network Analysis Module (NAM) Traffic Analyzer, 5.0
3-18
OL-22617-01
Chapter 3
Monitoring and Analysis
Response Time
Response Time
The NAM Traffic Analyzer monitors TCP packet flow between client and server, and measures response
time data to provide more visibility into application response times (ART) and network latency. NAM
5.0 response time monitoring provides end-to-end response times to help you locate possible network
and application delays.
Note
NAM 5.0 does not support IPv6 for response time monitoring.
You can set up the NAM to measure network time, client response time, server response time, and total
transaction time to improve application performance. Figure 3-10 shows the various points in network
packet flow where the NAM gathers data and the trip times you can monitor. This is one example that
represents only a subset of measurements.
Figure 3-10
NAM Application Response Time Measurements
Client
Cat6K
Client
Server
NAM
Server
application
Client
CND
(Client Network Delay)
SND
(Server Network Delay)
AD
(Application Delay)
TD
(Total Delay)
210303
ND
(Network Delay)
Figure 3-11 shows a representation of total transaction time as opposed to application response time.
User Guide for the Cisco Network Analysis Module (NAM) Traffic Analyzer, 5.0
OL-22617-01
3-19
Chapter 3
Monitoring and Analysis
Response Time
Transaction Time versus Response Time Measurements
Client request
Packet 1
Packet 2
Server response
Packet N
Application
response time
Packet 1
Packet 2
Packet N
210305
Figure 3-11
Total transaction time
Table 3-7 lists and describes the ART metrics measured by NAM 5.0.
Table 3-7
Application Response Time Metrics
Metric
Description
Average Response Time
Response Time is the time between the client request and the first response packet
from the server, as observed at the NAM probing point. Increases in the response time
usually indicate problems with server resources, such as the CPU, Memory, Disk, or
I/O due to a lack of necessary resources or a poorly written application.
Min Response Time
Max Response Time
This and other Response Time metrics are in millisecond (msec) units.
Number of Responses
Total number of request-response pairs observed during the monitoring interval
Number of Late Responses
Total number of responses that exceed the Max Response Time
Number of Responses 1
Number of responses with a response time less than RspTime1 threshold
Number of Responses 2
Number of responses with response time less than RspTime2 and larger than
RspTime1
Number of Responses 3
Number of responses with response time less than RspTime3 and larger than
RspTime2
Number of Responses 4
Number of responses with response time less than RspTime4 and larger than
RspTime3
Number of Responses 5
Number of responses with response time less than RspTime5 and larger than
RspTime4
Number of Responses 6
Number of responses with response time less than RspTime6 and larger than
RspTime5
Number of Responses 7
Number of responses with response time less than LateRsp and larger than RspTime6
Client Bytes
Number of TCP payload bytes sent from the client(s) during the monitoring interval
Server Bytes
Number of TCP payload bytes sent from the server(s) during the monitoring interval
Client Packets
Number of TCP packets sent from the client(s) during the monitoring interval
Server Packets
Number of TCP packets sent from the server(s) during the monitoring interval
Average number of concurrent
connections
Average number of concurrent TCP connections during the reporting interval
Number of new connections
Number of new TCP connections made (TCP 3-way handshake) during the
monitoring interval
Number of closed connections
Number of TCP connections closed during the monitoring interval
User Guide for the Cisco Network Analysis Module (NAM) Traffic Analyzer, 5.0
3-20
OL-22617-01
Chapter 3
Monitoring and Analysis
Response Time
Table 3-7
Application Response Time Metrics (continued)
Metric
Description
Number of unresponsive connections Number of TCP connection requests (SYN) that are not responded during the
monitoring interval
Number of refused connections
Number of TCP connection requests (SYN) that are refused during the monitoring
interval
Average Connection duration
Average duration of TCP connections during the monitoring interval
Average Server Response Time
Server Response Time is the time it takes an application server (for example, a web
server) to respond to a request. This is the server "think time," which is the time
between the client request arriving at the server and the first response packet being
returned by the server.
Min Server Response Time
Max Server Response Time
Increases in the server response time usually indicate problems with application
and/or server resources, such as the CPU, Memory, Disk, or I/O.
Average Network Time
Min Network Time
Max Network Time
Average Client Network Time
Min Client Network Time
Network time between a client and a server. Network Time is the sum of Client
Network Time and Server Network Time. NAM measures the Network Time using
TCP 3-way handshakes. If there are no new TCP connections made during the
monitoring interval, this metric is not reported.
Client Network Time is the network time between a client and the NAM switch or
router.
Max Client Network Time
In WAAS monitoring, Client Network Time from a WAE client data source represents
the network RTT between the client and its edge WAE, while Client Network Time
from the WAE server data source represents the WAN RTT (between the edge and
core WAEs).
Average Server Network Time
Server Network Time is the network time between a server and NAM probing point.
Min Server Network Time
In WAAS monitoring, Server Network Time from a server data source represents the
network time between the server and its core WAE.
Max Server Network Time
Average Total Response Time
Min Total Response Time
Total Response Time is the total amount of time between the client request and when
the client receives the first response packet from the server.
Max Total Response Time
Use Total Response Time with care because it is not measured directly and mixes the
server response time metric with the network time metric.
Average Transaction Time
Transaction Time is the total amount of time between the client request and the final
response packet from the server.
Min Transaction Time
Max Transaction Time
Transaction times may vary depending upon client usages and application types.
Transaction Time is a key indicator for monitoring client experiences and detecting
application performance anomalies.
Number of Transactions
The number of transactions completed during the monitoring interval.
Average Data Transmission Time
Elapsed time from the first server-response packet to the last server-response packet,
excluding retransmission time.
Average Data Time
Data Time: Average data time portion of transaction time.
Packets Retransmitted
Number of retransmitted packets detected during the monitoring interval
Bytes Retransmitted
Number of retransmitted bytes detected during the monitoring interval
Average Retransmission Time
Average time to retransmit lost packets per transaction
User Guide for the Cisco Network Analysis Module (NAM) Traffic Analyzer, 5.0
OL-22617-01
3-21
Chapter 3
Monitoring and Analysis
Response Time
Table 3-7
Application Response Time Metrics (continued)
Metric
Description
Client ACK Round Trip Time
Average network time for the client to acknowledge (ACK) a server data packet as
observed at NAM probing point
Number of Client ACK Round Trips
Number of client ACK RTs observered during the monitoring interval
Application Response Time Metrics are available on the response Response Time Summary Dashboard
(Monitor > Response Time Summary), which allows you to see a “summary” view of the data.
To analyze Response Time data over time, use the selections found under Analyze > Response Time:
•
Application Response Time, page 3-22
•
Network Response Time, page 3-22
•
Server Response Time, page 3-23
•
Client Response Time, page 3-23
•
Client-Server Response Time, page 3-23
When you select Analyze > Response Time > Detailed Views, you will be able to select one of the
following screens, each of which contains detailed lists of the response events.
•
Server Application Responses, page 3-23
•
Server Application Transactions, page 3-24
•
Server Network Responses, page 3-25
•
Client-Server Application Responses, page 3-26
•
Client-Server Application Transactions, page 3-27
•
Client-Server Network Responses, page 3-28
Application Response Time
The Application Analysis screen allows you to view the performance of a particular application over
time. It is accessed from Analyze > Response Time > Application.
The Transaction Time chart shows you the average transaction time for the application you have
selected. It is broken down into three components: Network Time, Server Response Time, and Data
Time.
The Other Metrics chart allows you to see information over time after you have selected the desired
metrics from the “Metric1” and “Metric2” drop-down.
Next are the Top Clients and Top Servers charts. These will show you the clients and servers with the
most bytes of traffic for the chosen application.
Network Response Time
After you have selected a client site and a server site, the chart will show you the transaction time of the
network link between the client site and server site. It is accessed from Analyze > Response Time >
Network.
User Guide for the Cisco Network Analysis Module (NAM) Traffic Analyzer, 5.0
3-22
OL-22617-01
Chapter 3
Monitoring and Analysis
Response Time
Note
If you do not specify any application, the chart will show the network time instead of transaction time.
The Other Metrics chart allows you to see information about the network link between sites, after you
have selected the desired metrics from the “Metric1” and “Metric2” drop-down.
The Top Clients and Top Servers charts will show you the top clients and servers that are communicating
through the network link (in bytes).
Server Response Time
Choose the Client Site and Server Site from the Interactive Report on the left, and enter the IP address
for the server that you want to analyze. The Server Transaction Time Composition chart will display the
network time, server response time, data time, and transaction time.
The Other Metrics chart allows you to see information about the server performance after you have
selected the desired metrics from the “Metric1” and “Metric2” drop-down.
Top Client shows you top client talking to the server you have selected; Server Top Clients Sites shows
the top client sites. (traffic bytes)
Client Response Time
After entering the client IP address and application in the Interactive Report Filter, you can analyze the
transaction time of that client in the Client Transaction Time Composition chart.
The Other Metrics chart allows you to see client performance over time after you have selected the
desired metrics from the “Metric1” and “Metric2” drop-down.
The Clients Top Applications chart show you the applications being used the most by the client selected,
and the Top Servers chart show you the servers being used most by the client.
Client-Server Response Time
After you enter the client IP address and server IP address in the Interactive Report, you can analyze the
transaction times between the client and server you have selected in the Client-Server Transaction
Composition Over Time chart.
The Other Metrics chart allows you to see Client-Server transaction information after you have selected
the desired metrics from the “Metric1” and “Metric2” drop-down.
Server Application Responses
The Server Application Responses Table displays when you choose Analyze > Response Time >
Detailed Views > Server Application Responses.
If you click on a row of data, you can then choose “Response Time Details” to see more information.
User Guide for the Cisco Network Analysis Module (NAM) Traffic Analyzer, 5.0
OL-22617-01
3-23
Chapter 3
Monitoring and Analysis
Response Time
Table 3-8, Server Application Responses Metrics, provides definitions of each field of the Server
Application Responses window.
Table 3-8
Server Application Responses Metrics
Field
Description
Client Site
Name of the client site.
Server Site
Name of the server site.
Data Source
Name of the data source
VLAN
VLAN
Server
Name or IP address of the server
Application
Application currently running
Number of Clients
Total number of clients
Number of Responses
Total number of responses
Average Client Network Time
(ms)
Client Network Time is the network time between a client and the NAM
switch or router.
Maximum Client Network Time In WAAS monitoring, Client Network Time from a WAE client data
(ms)
source represents the network RTT between the client and its edge
WAE, while Client Network Time from the WAE server data source
represents the WAN RTT (between the edge and core WAEs).
Average Server Response Time
(ms)
Maximum Server Response
Time (ms)
Server Response Time is the time it takes an application server (for
example, a web server) to respond to a request. This is the server "think
time," which is the time between the client request arriving at the server
and the first response packet being returned by the server.
Increases in the server response time usually indicate problems with
application and/or server resources, such as the CPU, Memory, Disk, or
I/O.
Average Total Response Time
(ms)
Total Response Time is the total amount of time between the client
request and when the client receives the first response packet from the
Maximum Total Response Time server.
(ms)
Server Application Transactions
The Server Application Transaction window displays when you click Analyze > Response Time >
Detailed Views > Server Application Transactions.
The Server Application Transactions window provides a summary of the server application transaction
response times (ART) per server application displaying the server IP address, application used, and
minimum, average, and maximum response times for the following:
•
Application Response Time
•
Data Transfer Time
•
Retransmit Time
•
Round Trip Time
User Guide for the Cisco Network Analysis Module (NAM) Traffic Analyzer, 5.0
3-24
OL-22617-01
Chapter 3
Monitoring and Analysis
Response Time
Note
NAM uses the TCP three-way handshake to calculate network delay. If there are no new TCP
connections during the polling interval, the NAM GUI displays a dash (-) for the delay value indicating
there is no delay data for that interval.
Table 3-9, Server Application Transactions Metrics, provides definitions of each field of the Server
Application Transactions window.
Table 3-9
Server Application Transactions Metrics
Field
Description
Client Site
Name of the client site.
Server Site
Name of the server site.
Data Source
Name of the data source
VLAN
VLAN
Server
Name or IP address of the server
Application
Application currently running
Number of Clients
Total number of clients
Number of Transactions
Total number of transactions
Average Transaction Time (ms)
Average time (ms) elapsed from the start of a client request to the
completion of server response. Transaction times might vary
significantly depending upon application types. Relative thresholds are
useful in this situation.
Transaction time is a key indicator when detecting application
performance anomalies.
Average Server Response Time
(ms)
Amount of time it takes a server to send the initial response to a client
request as seen by the NAM.
Average Data Transfer Time
(ms)
Average elapsed time from the first server-response packet to the last
server-response packet, excluding retransmission time. Data transfer
time is always measured in the server-to-client direction and can be
used to detect problems for a particular type of transaction of an
application.
Average Retransmission Time
(ms)
Average time to retransmit lost packets, per transaction.
Client ACK Round Trip Time
(ms)
Average round trip time for the client to acknowledge (ACK) a server
TCP packet.
Server Network Responses
The Server Network Responses window shows the network connectivity and responsiveness between the
server and the switch. It is located at Analyze > Response Time > Detailed Views > Server Network
Responses.
User Guide for the Cisco Network Analysis Module (NAM) Traffic Analyzer, 5.0
OL-22617-01
3-25
Chapter 3
Monitoring and Analysis
Response Time
Note
NAM uses the TCP three-way handshake to calculate network delay. If there are no new TCP
connections during the polling interval, the NAM GUI displays a dash (-) for the delay value indicating
there is no delay data for that interval.
Table 3-10, Server Network Responses Window, provides definitions of each field of the Server Network
Response Times window.
Table 3-10
Server Network Responses Window
Field
Description
Client Site
Name of the client site
Server Site
Name of the server site
Data Source
Name of the data source.
VLAN
VLAN
Server
Name or IP address of the server
Application
Application being used by server
Number of Clients
Total number of clients during the monitoring interval
Number of Connections
Total number of connections during the monitoring interval
Average Server Network
Time (ms)
Average of the Server Network Time (network time between a server and
NAM probing point).
Maximum Server Network
Time (ms)
Maximum of the Server Network Time (network time between a server and
NAM probing point).
Average Network Time
Average of the network time between client and server. Network Time is the
sum of Client Network Time and Server Network Time. NAM measures the
Network Time using TCP 3-way handshakes. If there are no new TCP
connections made during the monitoring interval, this metric is not reported.
Maximum Network Time
Maximum of the network time between client and server.
Server Bytes
Number of TCP payload bytes sent from the server(s) during the monitoring
interval.
Client Bytes
Number of TCP payload bytes sent from the client(s) during the monitoring
interval.
Client-Server Application Responses
To view the Client-Server Application Responses window, click Analyze > Response Time > Detailed
Views > Client-Server Appplication Responses.
The Client-Server Application Responses window displays.
Note
NAM uses the TCP three-way handshake to calculate network delay. If there are no new TCP
connections during the polling interval, the NAM GUI displays a dash (-) for the delay value indicating
there is no delay data for that interval.
User Guide for the Cisco Network Analysis Module (NAM) Traffic Analyzer, 5.0
3-26
OL-22617-01
Chapter 3
Monitoring and Analysis
Response Time
Table 3-11
Client-Server Application Responses Window
Field
Description
Client Site
Name of the client site
Server Site
Name of the server site
Data Source
Name of the data source.
VLAN
VLAN
Server
Name or IP address of the server
Client
Host address of the client.
Application
Application being used by server
Number of Responses
Total number of responses observed during the monitoring interval
Minimum Client Network
Time (ms)
Minimum network time between a client and the NAM switch or router.
Average Client Network
Time (ms)
Average network time between a client and the NAM switch or router.
Maximum Client Network
Time (ms)
Maximum network time between a client and the NAM switch or router.
Minimum Server Network
Time (ms)
Minimum network time between a server and NAM probing point.
Average Server Network
Time (ms)
Average network time between a server and NAM probing point.
Maximum Server Network
Time (ms)
Maximum network time between a server and NAM probing point.
Minimum Transaction Time The total amount of time between the client request and the final response
(ms)
packet from the server.
Average Transaction Time
(ms)
Average time (ms) elapsed from the start of a client request to the
completion of server response. Transaction times might vary significantly
depending upon application types. Relative thresholds are useful in this
situation.
Transaction time is a key indicator when detecting application performance
anomalies.
Maximum Transaction
Time (ms)
The total amount of time between the client request and the final response
packet from the server.
Client-Server Application Transactions
The Client-Server Application Transactions window provides a summary of the server application
transaction response times (ART) per server application displaying the server IP address, application
used, and minimum, average, and maximum response times for the following:
•
Application Response Time
•
Data Transfer Time
•
Retransmit Time
•
Round Trip Time
User Guide for the Cisco Network Analysis Module (NAM) Traffic Analyzer, 5.0
OL-22617-01
3-27
Chapter 3
Monitoring and Analysis
Response Time
Note
NAM uses the TCP three-way handshake to calculate network delay. If there are no new TCP
connections during the polling interval, the NAM GUI displays a dash (-) for the delay value indicating
there is no delay data for that interval.
The Client-Server Application Transaction window displays when you click Analyze > Response Time
> Detailed Views > Client-Server Application Transactions. You can also view the TopN Chart to
view the most active network.
Table 3-12
Client-Server Application Transactions Window
Field
Description
Client Site
Name of the client site.
Server Site
Name of the server site.
Data Source
Name of the data source.
VLAN
VLAN
Server
Name or IP address of the server
Client
Host address of the client.
Application
Application being used by server
Number of Transactions
Total number of transactions observed during the monitoring interval
Average Transaction Time
(ms)
Average time (ms) elapsed from the start of a client request to the
completion of server response. Transaction times might vary significantly
depending upon application types. Relative thresholds are useful in this
situation.
Transaction time is a key indicator when detecting application performance
anomalies.
Average Server Response
Time (ms)
Amount of time it takes a server to send the initial response to a client
request as seen by the NAM.
Average Data Transmission Elapsed time from the first server-response packet to the last
Time (ms)
server-response packet, excluding retransmission time.
Average Retransmission
Time (ms)
Average time to retransmit lost packets per transaction
Client ACK Round Trip Time Average network time for the client to acknowledge (ACK) a server data
(ms)
packet as observed at NAM probing point
Client-Server Network Responses
The Client-Server Network Responses window shows information about network connectivity (also
known as network flight time) between servers and clients.
User Guide for the Cisco Network Analysis Module (NAM) Traffic Analyzer, 5.0
3-28
OL-22617-01
Chapter 3
Monitoring and Analysis
Managed Device
To view the Client-Server Network Responses window, choose Analyze > Response Time > Detailed
Views > Client-Server Network Responses.
NAM uses the TCP three-way handshake to calculate network delay. If there are no new TCP
connections during the polling interval, the NAM GUI displays a dash (-) for the delay value indicating
there is no delay data for that interval.
Table 3-13 describes the fields of the Server-Client Network Response Time window.
Table 3-13
Client-Server Network Responses Window
Field
Description
Client Site
Name of the client site.
Server Site
Name of the server site.
Data Source
Name of the data source.
VLAN
VLAN
Server
Name or IP address of the server.
Client
Host address of the client.
Application
Application being used by server.
Number of Connections
Number of connections.
Minimum Client Network Time (ms)
Minimum network time between a client and the NAM
switch or router.
Average Client Network Time (ms)
Average network time between a client and the NAM switch
or router.
Maximum Client Network Time (ms)
Maximum network time between a client and the NAM
switch or router.
Minimum Server Network Time (ms)
Minimum network time between a server and NAM probing
point.
Average Server Network Time (ms)
Average network time between a server and NAM probing
point.
Maximum Server Network Time (ms)
Maximum network time between a server and NAM probing
point.
Minimum Network Time (ms)
Minimum of the network time between client and server.
Network Time is the sum of Client Network Time and Server
Network Time. NAM measures the Network Time using TCP
3-way handshakes. If there are no new TCP connections
made during the monitoring interval, this metric is not
reported.
Average Network Time (ms)
Average of the network time between client and server.
Maximum Network Time (ms)
Maximum of the network time between client and server.
Managed Device
The NAM 5.0 Traffic Analyzer menu selections for analyzing Managed Devices are:
•
Interface, page 3-30
User Guide for the Cisco Network Analysis Module (NAM) Traffic Analyzer, 5.0
OL-22617-01
3-29
Chapter 3
Monitoring and Analysis
Managed Device
•
Health, page 3-31
•
NBAR, page 3-37
Interface
Interfaces Stats Table
To view packet distribution details on the interfaces, choose Analyze > Managed Device > Interface.
The Interfaces Stats table displays and shows the total packet distribution on all interfaces. Use the
Interactive Report and the Filter button on the left to change the time range displayed. The Discards and
Errors are measured in packets per second.
Figure 3-12
Interfaces Stats Table
The fields in the table are described in Table 3-14.
Table 3-14
Interfaces Stats Table
Field
Description
Interface
Interface number.
In % Utilization
Utilization percentage of the port.
Out % Utilization
Utilization percentage of the port.
In Packets/s
Number of incoming packets collected per second.
Out Packets/s
Number of outgoing packets sent out per second.
In Bytes/s
Number of bytes collected per second.
Out Bytes/s
Number of bytes sent out per second.
In Non-Unicast/s
Number of non-unicasts collected per second.
Out Non-Unicast/s
Number of non-unicasts sent out per second.
In Discards/s
Number of discards collected per second.
Out Discards/s
Number of discards sent out per second.
In Errors/s
Number of errors collected per second.
Out Errors/s
Number of errors sent out per second.
User Guide for the Cisco Network Analysis Module (NAM) Traffic Analyzer, 5.0
3-30
OL-22617-01
Chapter 3
Monitoring and Analysis
Managed Device
Interface Statistics Over Time
When you select an interface in the Interface Stats Table, the statistics for that interface will be graphed
in the area below, as shown in Figure 3-13.
Figure 3-13
Interface Statistics Over Time
There are four check boxes above the graph: Bytes, Packets, Discards, and Errors. You can check the
check boxes for the information you would like displayed in the graph:
Bytes: In Bytes, Out Bytes
Packets: In Packets (inUcastPkts + inNUcastPkts ), Out Packets (outUcastPkts + outNUcastPkts)
Discards: In Discards, Out Discards
Errors: In Errors, Out Errors
Health
You can use the NAM Traffic Analyzer to view system health data. To view system health data collected
for the switch or router, choose Monitor > Managed Device > Health from the menu.
Switch Health
For a switch, the Health window is displayed with a drop-down menu that provides the following
options:
•
Chassis Health, page 3-32
•
Chassis Information, page 3-32
•
Crossbar Switching Fabric, page 3-33
•
Ternary Content Addressable Memory Information, page 3-34
User Guide for the Cisco Network Analysis Module (NAM) Traffic Analyzer, 5.0
OL-22617-01
3-31
Chapter 3
Monitoring and Analysis
Managed Device
Chassis Health
The Chassis Health window displays two real-time graphs: CPU usage and Backplane Utilization.
CPU usage
CPU type
•
Usage for last 1 minute (%)
•
Usage for last 5 minutes (%)
Backplane Utilization
•
Peak %
•
Peak Time (For example: Mon October 1 2007, 15:26:55)
The Health window also displays a matrix with the following information:
•
Minor Alarm (on, off)
•
Major Alarm (on, off)
•
Temperature Alarm (on, off)
•
Fan Status (other, ok, minorFault, majorFault, unknown)
Table 3-15
Chassis Memory Information
Column
Description
Memory Type
Type of memory including DRAM, FLASH,
NVRAM, MBUF, CLUSTER, MALLOC.
Used
Number of used MB for a particular memory type.
Free
Number of free MB for a particular memory type.
Largest Free
Number of largest contiguous free MB for a
particular memory type.
Chassis Information
The Chassis Information window displays.
Table 3-16
Chassis Information
Field
Description
Name
Name an administrator assigned to this managed node,
this is the node's fully-qualified domain name.
Hardware
A textual description which should contain the
manufacturer's name for the physical entity and be set
to a distinct value for each version or model of the
physical entity.
Backplane
The chassis backplane type.
Supervisor Software
Version
The full name and version identification of the system's
software operating-system and networking software.
User Guide for the Cisco Network Analysis Module (NAM) Traffic Analyzer, 5.0
3-32
OL-22617-01
Chapter 3
Monitoring and Analysis
Managed Device
Table 3-16
Chassis Information (continued)
Field
Description
UpTime
The time (in hundredths of a second) since the network
management portion of the system was last
re-initialized.
Location
The physical location of this node.
Contact
The textual identification of the contact person for this
managed node and information on how to contact this
person.
Modem
Indicates whether the RS-232 port modem control lines
are enabled.
Baud rate
The baud rate in bits per second of the RS-232 port.
Power Supply
Description of the power supply being instrumented.
Power Supply Type
The power supply source:
Power Supply Status
•
unknown
•
ac
•
dc
•
externalPowerSupply
•
internalRedundant
The current state of the power supply being
instrumented.
1: normal
2: warning
3: critical
4: shutdown
5: notPresent
6: notFunctioning
Power Redundancy
Mode
Power Redundancy Mode:
Power Total
Total current available for FRU usage.
The power-supply redundancy mode.
1: not supported
2: redundant
3: combined
When Redundancy Mode is redundant, the total current
available will be the capability of a power supply with
the lesser power capability of the two power supplies.
When Redundancy Mode is combined, the total current
available will be the sum of the capacities of all
operating power supplies.
Power Drawn
Total Current Drawn by powered-on FRUs.
Crossbar Switching Fabric
This option shows the Crossbar Switching Fabric information.
User Guide for the Cisco Network Analysis Module (NAM) Traffic Analyzer, 5.0
OL-22617-01
3-33
Chapter 3
Monitoring and Analysis
Managed Device
Table 3-17
Crossbar Switching Fabric Information
Field
Description
Crossbar Switching Fabric
Physical and configuration information about the module:
Active slot—Indicates the slot number of the active switching fabric
module. A value of zero indicates that the active switching fabric
module is either powered down or not present in the chassis.
Backup slot—Indicates the slot number of the backup switching fabric
module. A value of zero indicates that the backup switching fabric
module is either powered down or not present in the chassis.
Bus Only Mode Allowed—Determines the value of each module. If set
to True, each and every module is allowed to run in bus-only mode. If
set to False, none of the modules are allowed to run in bus-only mode.
(All the non-fabric capable modules will be powered off.) Absence of
fabric module results in all the fabric capable modules being powered
off.
Truncated Mode Allowed—Indicates whether truncated mode is
administratively enabled on the device or not.
Module Switching Mode
Indicates switching mode of the module:
busmode—Module does not use fabric. Backplane is used for both
lookup and data forwarding.
crossbarmode—Module uses the backplane for forwarding decision
and fabric for data forwarding.
dcefmode—Module uses fabric for data forwarding and local
forwarding is enabled.
Module-Channel
Module slot number
Module-Status
Status of the fabric channel at the module
Fabric Status
Status of the fabric channel at the slot
Speed (MB)
Speed (MB/second) of the module
Module-Channel
Channel for the module
In Errors
The total number of error packets received since this entry was last
initialized.
Our Errors
The total number of error packets transmitted since this entry was last
initialized.
Dropped
The total number of dropped packets transmitted since this entry was
last initialized.
In Utilization (%)
Input utilization of the channel for the module.
Out Utilization (%)
Output utilization of the channel for the module.
Ternary Content Addressable Memory Information
Shows the Ternary Content Addressable Memory (TCAM) usage information. Table 3-18 lists and
describes the TCAM information.
User Guide for the Cisco Network Analysis Module (NAM) Traffic Analyzer, 5.0
3-34
OL-22617-01
Chapter 3
Monitoring and Analysis
Managed Device
Table 3-18
Ternary Content Addressable Memory Information
Field
Description
Security Acl Mask
Indicates that TCAM space is allocated to store ACL masks.
Security Acl Value
Indicates that TCAM space is allocated to store ACL value.
Dynamic Security Acl Mask
Indicates that TCAM space is allocated to dynamically store ACL
masks.
Dynamic Security Acl Value
Indicates that TCAM space is allocated to dynamically store ACL
values.
Qos Acl Mask
Indicates that TCAM space is allocated to store QoS masks.
Qos Acl Value
Indicates that TCAM space is allocated to store QoS value.
Dynamic Qos Acl Mask
Indicates that TCAM space is allocated to dynamically store QoS
masks.
Dynamic Qos Acl Value
Indicates that TCAM space is allocated to dynamically store ACL
values.
Layer 4 Port Operator
Indicates that TCAM space is allocated for layer 4 port operators
purpose.
Interface Mapping Module
Indicates that TCAM space is allocated for interface mapping purpose.
Router Health
If your device is a router, the Router Health window displays with a drop-down box that provides the
following options:
•
Router Health, page 3-35
•
Router Information, page 3-36
Router Health
The Router Health window displays a real-time graph and information about the health of a router.
Table 3-19 describes the contents of the Router Health window.
Table 3-19
Router Health Information
Field
Description
CPU Usage (graph)
Overall CPU busy percentage in the last 5 minute period
CPU Type
Describes type of CPU being monitored
Last 1 minute
Overall CPU busy percentage in the last 1 minute period.
Last 5 minutes
Overall CPU busy percentage in the last 5 minute period.
Temperature Description
Description of the test point being measured
User Guide for the Cisco Network Analysis Module (NAM) Traffic Analyzer, 5.0
OL-22617-01
3-35
Chapter 3
Monitoring and Analysis
Managed Device
Table 3-19
Router Health Information (continued)
Field
Description
Temperature Status
The current state of the test point being instrumented; one of the
following are the states:
Failures
•
Normal
•
Warning
•
Critical
•
Shutdown
•
Not Present
•
Not Functioning
•
Unknown
The failing component of the power supply being measured:
•
None—No failure
•
inputVoltage—Input power lost in one of the power supplies
•
dcOutputVoltage—DC output voltage lost in one of the power
supplies
•
Thermal—Power supply thermal failure.
•
Multiple—Multiple failures.
•
Fan—Fan failure
•
Overvoltage—Over voltage.
Memory Type
Type of memory including processor and I/O.
Used
Number of used MB for a particular memory type.
Free
Number of free MB for a particular memory type.
Largest Free
Number of largest contiguous free MB for a particular memory
type.
Router Information
The Router Information window displays router information. Table 3-20 lists and describes the fields of
the Router Information window.
Table 3-20
Router Information
Field
Description
Name
Name an administrator assigned to this managed node, this is the node's
fully-qualified domain name.
Hardware
A textual description which should contain the manufacturer's name for
the physical entity and be set to a distinct value for each version or model
of the physical entity.
Supervisor Software
Version
The full name and version identification of the system's software
operating-system and networking software.
User Guide for the Cisco Network Analysis Module (NAM) Traffic Analyzer, 5.0
3-36
OL-22617-01
Chapter 3
Monitoring and Analysis
Media
Table 3-20
Router Information (continued)
Field
Description
Up Time
The time (in hundredths of a second) since the network management
portion of the system was last re-initialized.
Location
The physical location of this node.
Contact
The textual identification of the contact person for this managed node
and information on how to contact this person.
Modem
Indicates whether the RS-232 port modem control lines are enabled.
Baud
The baud rate in bits per second of the RS-232 port.
Power Supply
Description of the power supply being instrumented.
Power Supply Type
The power supply source:
Power Supply Status
•
unknown
•
ac
•
dc
•
externalPowerSupply
•
internalRedundant
The current state of the power supply being instrumented.
1: normal
2: warning
3: critical
4: shutdown
5: notPresent
6: notFunctioning
NBAR
You can use the NAM Traffic Analyzer to view Network Based Application Recognition (NBAR) data.
To view the NBAR data collected for a switch or router, select Analyze > Managed Device > NBAR.
If NBAR is not enabled on your switch or router, you will see a message stating that you cannot see
NBAR information without an IOS version that supports NBAR. After you acquire the correct IOS
version, you can enable the feature under Setup > Managed Devices > NBAR Protocol Discovery.
Media
The NAM 5.0 Traffic Analyzer menu selections for Analyzing Media are:
•
RTP Streams, page 3-38
•
Voice Call Statistics, page 3-39
•
Calls Table, page 3-40
•
RTP Conversation, page 3-42
User Guide for the Cisco Network Analysis Module (NAM) Traffic Analyzer, 5.0
OL-22617-01
3-37
Chapter 3
Monitoring and Analysis
Media
RTP Streams
Purpose
The RTP Streams window shows you three pieces of information:
RTP Stream Information
•
Source IP Address and Port: IP address and UDP port of the originator of the RTP stream.
•
Destination IP Address and Port: Ip address and UDP port of the receiver of the RTP stream.
•
SSRC: Synchronization source number as it appeared in the RTP header of the RTP stream.
•
codec: encoding decoding format of the RTP stream.
RTP Stream Stats Summary
This shows you the summary of the RTP stream for the entire duration of RTP stream.
•
Duration: duration of the RTP stream. This may not be the entire duration of the stream. It depends
on the viewing time interval of the window which launched this RTP stream detail window.
•
Worst / Duration Weighted / Max MOS: the lowest score among per-interval reports, the score of all
per-munite interval reports that takes duration into account, and the highest score among per-interval
reports of the stream.
Note
•
Duration-weighted is calculated with the following formula:
SUM (per-minute-mos * duration) / SUM (duration)
Worst / Duration Weighted / Min Jitter: the largest jitter among per-interval reports, the jitter that
takes into account of the duration of all per-interval reports, and the smallest jitter values among
per-interval reports of the stream.
Note
Duration-weighted are used with the following formula:
SUM(per-interval-jitter * duration) / SUM(duration)
•
Worst / Overall / Min Actual Packet Loss: Loss percent of RTP packets that are not seen by NAM
and RTP packets that arrived beyond the buffer capability of the receiving end point. This includes
the highest percentile among per-interval reports, the sum of packets loss against total packets of all
per-interval reports, and the lowest percentile loss among per-interval reports.
•
Worst / Overall / Min Actual Packet Loss: Similar to above, but the percent loss only includes RTP
packets that were not seen by the NAM.
•
Worst / Total / Min Concealment Seconds: Number of seconds in which NAM detected packet loss
during the duration of the stream. This includes lowest concealment seconds among per-interval
reports, total concealment seconds of the entire duration of the stream, and highest concealment
seconds among per-minute stream reports.
•
Severe Concealment Seconds: Similar to above; severe condition is met when the seconds have more
than 5 percent loss.
User Guide for the Cisco Network Analysis Module (NAM) Traffic Analyzer, 5.0
3-38
OL-22617-01
Chapter 3
Monitoring and Analysis
Media
RTP Stream Stats Details
This table shows the per-interval stats calculated by NAM at each interval. The columns of the tables are:
•
Report Time: time when the stats were calculated. This is the end time of the interval.
•
Report Duration: the stream duration during the report interval.
•
Worst MOS: the lowest score of the stream among 3-second MOS score. NAM internally evaluates
the MOS value of the stream every 3 seconds. This is the lowest score among them.
•
Average MOS: average score of the 3-second score values during the duration of the stream in the
interval. This value is used in deriving the Duration Weighted MOS value in NAM.
•
Jitter: variation of packet arrival time compare to the expected time.
•
Actual Packet Loss percentile: percentile of packets that are not seen by NAM.
•
Adjusted Packet Loss percentile: percentile of packets that include the actual packets lost an packets
that had arrived too late to get into buffer prior to paying back at the endpoint.
•
Concealment Seconds: number of seconds in which the NAM sees packet loss.
•
Severe Concealment Seconds: number of seconds in which the NAM detected more 5 percent of
packet loss.
•
Packets: total packets NAM have seen for the interval.
Monitoring RTP Streams
To monitor the RTP streams, choose Analyze > Media > RTP Streams. You can also arrive at this page
by:
•
From the RTP Conversation table, clicking on a specific stream
•
From the Call Detail window, clicking on the stream that is associated with the call
On this screen, at least one of the following is required: Site, data source, or VLAN.
The five charts available on this screen are:
•
RTP Streams: Number of streams that fall in the quality bands of excellent, good, fair, and poor
during the selected interval.
•
Top N Source End Points: Endpoints that generated the lowest duration weighted MOS during the
selected interval.
•
Top N Destination Endpoints: Endpoints that experienced the lowest duration weighted MOS
during the selected interval.
•
Top N RTP streams: RTP streams that have the lowest duration weighted MOS during the selected
interval.
•
Top N RTP streams by Adjusted Packet Loss: RTP streams that have the highest overall adjusted
packet loss percent during the selected interval.
Voice Call Statistics
To monitor voice quality, choose Analyze > Media > Voice Call Statistics. The charts will provide an
overview of voice quality.
The charts available are:
User Guide for the Cisco Network Analysis Module (NAM) Traffic Analyzer, 5.0
OL-22617-01
3-39
Chapter 3
Monitoring and Analysis
Media
•
Voice Call Statistics: Number of calls per signaling protocol (SCCP, SIP, MGCP, and H.323) at each
interval during the selected interval.
•
Top N End Points by Jitter (ms): Endpoints that have the largest average of endpoint reported jitter
during the selected interval.
•
Top N End Points by Packet Loss (%): Endpoints that have the largest average of endpoint
reported packet loss during the selected interval.
•
Top N Calls by Jitter (ms): Calls that have the longest endpoint-reported jitter during the selected
interval.
•
Top N Calls by Packet Loss (%): Calls that have the most endpoint reported packet loss percent
during the selected interval.
Calls Table
The Calls Table shows you calls that the NAM detected by inspecting voice signaling protocols’ payload.
For this table to have data, the NAM must see:
•
SCCP protocol: Call Information message of the call.
•
SIP protocol: SIP INVITE message of the the call. Note that SIP protocol will be detected as per
call leg.
•
H.323 protocol: Call SETUP of the call.
•
MGCP protocol: Create connection message of the call. Note that MGCP will be detected per call
leg.
Note
SIP and MGCP will be detected per call leg. Each call could be 2 or more parties. Each party has
its own call leg from the call party to control entity, e.g. Cisco Call Manager or MGCP gateway.
Any information that is not detected by NAM will be displayed as "-" or blank on the GUI screen.
To view the active calls, choose Analyze > Media > Detailed Views > Call Table. The Calls Table and
RTP Streams for the Selected Call Table display. These tables show a list of all currently active calls.
Note
Some values in the Calls table are not available until the end of the call, and Cisco Unified
Communications Manager must be configured to have the IP phones send out the call status and quality
information.
Note
All calculated metrics in Table 3-21, Calls Table, are based on a one minute interval.
Table 3-21 provides descriptions of the fields of the Calls Table.
Table 3-21
Calls Table
Field
Description
Calling Number
Calling number as it appears in the signaling protocol.
Called Number
Called number as it appears in the signaling protocol.
User Guide for the Cisco Network Analysis Module (NAM) Traffic Analyzer, 5.0
3-40
OL-22617-01
Chapter 3
Monitoring and Analysis
Media
Table 3-21
Calls Table (continued)
Field
Description
Calling Host Address
RTP receiving address of the calling party detected by the NAM
from inspecting the call signaling protocol.
Calling Port
RTP receiving port of the calling party detected by NAM from
inspecting call signaling protocol.
Calling Alias
Calling party name detected by NAM from inspecting call signaling
protocol.
Called Host Address
IP address of the phone receiving the call.
Called Port
Port of the phone receiving the call.
Called Alias
Alias name, MGCP endpoint ID, or SIP URI of the called party
phone.
Calling Reported Jitter (ms)
Jitter value reported by calling party at the end of the call.
Calling Reported Packet Loss
(%)
Percentage of packet loss reported by calling party at the end of the
call.
Start Time
Time when the call was detected to start.
End Time
Time when the call was detected to end.
Duration
Duration of the call.
Note
When the call signaling’s call tear down sequence is not
detected by the NAM, the NAM will assume:
- the call ended after 3 hours in low call volume per interval
- the call ended after 1 hour in high call volume per interval
(high call volume is defined as call table filled up during the
interval.)
Called Reported Jitter (ms)
Jitter value reported by called party at the end of the call.
Called Reported Pkt Loss (%)
Percentage of packet loss reported by called party at the end of the
call.
If you click on a call row in the table, in the RTP Streams for the Selected Call display at the bottom of
the page you will see all streams that are associated with the call. It will display the RTP streams that:
Note
•
have source address and port matched the call’s calling host address and calling port or called host
address and called port
•
have destination address and port that matched the call’s calling host address and calling port or
called address and called port
There is a delay of two minutes of RTP streams statistics. As the result, there may not be any RTP stream
information of the call.
The RTP Streams of the Selected Call table shows the overall RTP streams statistics that are calculated
by the NAM. You can use this information to compare the views of the call endpoints and the NAM
regarding the call’s qualities. The columns of the RTP Stream are described in Table 3-22.
User Guide for the Cisco Network Analysis Module (NAM) Traffic Analyzer, 5.0
OL-22617-01
3-41
Chapter 3
Monitoring and Analysis
Media
Table 3-22
RTP Streams for the Selected Call table
Field
Purpose
Source Address
IP Address of the originator of the RTP stream
Source Port
UDP port of the originator of the RTP stream
Destination Address
IP address of the receiver of the RTP stream
Destination Port
UDP port of the receiver of the RTP stream
Codec
Encoding decoding format/algorithm of the RTP
stream
SSRC
Synchronization source number as it appear in the
RTP header
Duration Weighted MOS
NAM calculated score that takes into account of the
duration of the stream
Duration Weighted Jitter
Jitter that takes into account of the duration of the
RTP stream among all per-interval reports
Overall Adjusted Packet Loss
Percentile of adjust packets lost against total packets
of all per-interval RTP reports.
You can see more detailed information about each RTP stream by selecting the RTP stream and clicking
on the RTP Stream Details button. A pop up window will show more detailed information of the stream
displayed.
RTP Conversation
To get detailed information about RTP conversations, choose Analyze > Media > Detailed Views > RTP
Conversations. This table shows you the overview of RTP streams analyzed by NAM during the selected
interval. You can drill-down to each stream to get stream statistics, which are analyzed by the NAM at
each interval. To get more detailed information, you can:
•
Click on the RTP stream for which you want to see more information.
•
Click on the “RTP Stream Details” context menu. A pop up window will show you the detailed
information of the stream.
The columns of the RTP Conversation tables are described in Table 3-23, RTP Conversations Table.
Table 3-23
RTP Conversations Table
Field
Purpose
Start Time
Time when the RTP stream was discovered by the NAM
Source Address
IP Address of the originator of the RTP stream
Source Port
UDP port of the originator of the RTP stream
Destination Address
IP address of the receiver of the RTP stream
Destination Port
UDP port of the receiver of the RTP stream
Codec
Encoding decoding format/algorithm of the RTP stream
User Guide for the Cisco Network Analysis Module (NAM) Traffic Analyzer, 5.0
3-42
OL-22617-01
Chapter 3
Monitoring and Analysis
Media
Table 3-23
RTP Conversations Table (continued)
Field
Purpose
SSRC
Synchronization source number as it appear in the RTP
header
Duration Weighted MOS
NAM calculated score that takes into account of the
duration of the stream
User Guide for the Cisco Network Analysis Module (NAM) Traffic Analyzer, 5.0
OL-22617-01
3-43
Chapter 3
Monitoring and Analysis
Media
User Guide for the Cisco Network Analysis Module (NAM) Traffic Analyzer, 5.0
3-44
OL-22617-01
CH A P T E R
4
Capturing and Decoding Packet Data
The Capture feature of the NAM Traffic Analyzer allows you to set up multiple sessions for capturing,
filtering, and decoding packet data, manage the data in a file control system, and display the contents of
the packets.
Note
Capture does not apply to the NAM Virtual Service Blades.
This chapter contains the following sections:
•
Sessions, page 4-2
– Software Filters, page 4-7
– Hardware Assisted Filters, page 4-12
•
Files, page 4-15
•
Viewing Packet Decode Information, page 4-20.
Quick Capture
From the Context menu of many of the dashboard bar charts which show Applications or Hosts or
VLANs. you can start a capture. For example, when you click on an Application in a bar chart (as shown
in Figure 4-1) and choose “Capture,” the following is done automatically:
•
A memory-based capture session is created
•
A software filter is created using that application
•
The capture session is started
•
The decode window pops open and you can immediately see packets being captured
User Guide for the Cisco Network Analysis Module (NAM) Traffic Analyzer, 5.0
OL-22617-01
4-1
Chapter 4
Capturing and Decoding Packet Data
Sessions
Figure 4-1
Quick Capture
Sessions
The purpose of Capture Sessions is to capture, filter, and decode packet data, manage the data in a file
control system, and display the contents of the packets. The captured packets can then be decoded and
analyzed on the NAM for more efficient problem isolation.
As shown in Figure 4-2, network packets coming into NAM must pass at least one hardware filter in
order to go on to the next step. If no hardware filters are configured, all packets pass through. See
Hardware Assisted Filters, page 4-12 for more information about hardware filters.
Note
Hardware filters apply only to the Cisco 2200 Series Appliances.
Note
Custom Capture Filters are not available in the NAM Traffic Analyzer 5.0 release.
Packets must then pass at least one software filter in that particular session to be saved by that session.
If no software filters are configured for a session, then all packets are captured.
For each hardware and software filter, every field you configure must match if the packet is to pass
through that filter. The more fields you configure inside a filter, the more specific that filter is, and
therefore fewer packets will pass through it.
User Guide for the Cisco Network Analysis Module (NAM) Traffic Analyzer, 5.0
4-2
OL-22617-01
Chapter 4
Capturing and Decoding Packet Data
Sessions
Figure 4-2
NAM Capture Sessions
Network Packets
Session 1
Session 2
Session 3
Software Filter A
Software Filter B
Software Filter C
Memory
Files
199546
Hardware Filter 1
Hardware Filter 2
Hardware Filter 3
This section contains the following subjects:
•
Viewing Capture Sessions, page 4-3
•
Configuring Capture Sessions, page 4-4
•
Software Filters, page 4-7
Viewing Capture Sessions
To access the basic operations for capturing, viewing and decoding packet data on the NAM, choose
Capture > Packet Capture/Decode > Sessions.
The Capture Sessions window shows the list of capture sessions. If none have been configured, the list
will be blank.
Capture Session Fields, Table 4-1, describes the Capture Sessions fields.
Table 4-1
Capture Session Fields
Operation
Description
Name
Name of the capture session
Start Time
Time the capture was last started. You can stop and restart the capture as
many times as necessary.
Size (MB)
Size of the session
Note
Capture to files indicates the capture is being stored in one or more
files and is a clickable link to those files.
User Guide for the Cisco Network Analysis Module (NAM) Traffic Analyzer, 5.0
OL-22617-01
4-3
Chapter 4
Capturing and Decoding Packet Data
Sessions
Table 4-1
Capture Session Fields (continued)
Operation
Description
Packets
Number of packets
State
The current status of the capture:
•
Running—Packet capture is in progress
•
Stopped—Packet capture is stopped. Captured packets remain in
buffer, but no new packets are captured
•
Full (Cisco 2200 Series appliances only)—The memory or file is full,
and no new packets will be captured.
Table 4-2, Buttons in the Capture Session Operations Window describes the operations that you can
perform from the Capture Sessions window.
Table 4-2
Buttons in the Capture Session Operations Window
Operation
Description
Create
Create a new capture session. See Configuring Capture Sessions, page 4-4.
Edit
Edit the settings of the selected capture.
Delete
Delete a selected session.
Start
Start capturing to a selected session. The number in the Packets column for
that session will start to rise.
Stop
Stop capturing to the selected session (no packets will go through). Capture
data remains in the capture memory buffer, but no new data is stored. Click
Start to resume the capture.
Clear
Clear captured data from memory.
Decode
Display details of the capture session.
Save to File
Save a session to a file on the NAM hard disk. See Files, page 4-15.
Configuring Capture Sessions
You can configure up to ten capture sessions. As part of configuring a capture session, you can also
create software filters, if desired (see Creating a Software Filter, page 4-8).
To configure a new capture session:
Step 1
Choose Capture > Packet/Capture Decode > Sessions.
Step 2
Click the Create button to set up a new capture. The NAM Traffic Analyzer displays the Configure
Capture Session window (shown in Figure 4-3). The Capture Settings window provides a field for you
to enter a name for the capture and four status indicators described in Table 4-3.
User Guide for the Cisco Network Analysis Module (NAM) Traffic Analyzer, 5.0
4-4
OL-22617-01
Chapter 4
Capturing and Decoding Packet Data
Sessions
Figure 4-3
Configure Capture Session Window
Step 3
Table 4-3
Enter information in the Capture Settings Fields (Table 4-3) as appropriate.
Capture Settings Fields
Field
Description
Usage Notes
Name
Name of the capture
Enter a capture name.
Packet Slice Size
(bytes)
The slice size in bytes; used to
limit the size of the captured
packets.
Enter a value of 64 or higher. Enter zero (0) to not perform slicing.
If you have a small session but want to capture as many packets as
possible, use a small slice size.
If the packet size is larger than the specified slice size, the packet is
sliced before it is saved in the capture session. For example, if the
packet is 1000 bytes and slice size is 200 bytes, only the first 200
bytes of the packet is stored in the capture session.
Capture Source
Data-Port or ERSPAN
Choose the capture source (check one or more check boxes):
•
Data-port: This accepts SPAN, RSPAN, and VACL capture. For
NME-NAM, internal, external, or both.
•
ERSPAN: Locally terminated is recommended.
User Guide for the Cisco Network Analysis Module (NAM) Traffic Analyzer, 5.0
OL-22617-01
4-5
Chapter 4
Capturing and Decoding Packet Data
Sessions
Table 4-3
Capture Settings Fields (continued)
Field
Description
Usage Notes
Storage Type:
Memory
Check to store captures in
memory
Enter values for Memory Size for this capture. Enter a number from
1 up to your platform maximum. If system memory is low, the actual
session size allocated might be less than the number specified here.
See Table 4-4 for maximum session sizes for each NAM platform.
The NAM Traffic Analyzer will grant less memory than requested if
the available memory is less than requested.
Check (if desired) Wrap when Full to enable continuous capture
(when the session is full, older packet data is removed to make room
for new incoming packets). If you do not check Wrap when Full, the
capture will end when the amount of data reaches size of session.
Storage Type: File(s)
File Size (MB)
Enter a value for File Size (file size can be from 1 to 2 GB or up to 10
GB for the NAM appliances). About 400MB of free disk space is
reserved for working files. If available disk space is below 400 MB,
you will not be able to start new capture-to-disk sessions. See
Table 4-4, Maximum Capture Session Sizes for NAM Platforms.
Number of Files
Enter a value for Number Of Files to use for continuous capture.
Rotate Files
Check the Rotate Files check box to rotate files in continuous capture.
Available only for remote storage or NAM 2200 Series appliances.
See section Capture Data Storage, page 2-18, for information about
configuring remote storage.
The Rotate Files option can only be used with remote storage or the
NAM 2200 Series appliance’s local disk. See the section Capture
Data Storage, page 2-18, for information about configuring remote
storage.
If you choose the Rotate Files option, when you reach the highest
number file, the earliest file is overwritten. For example, if you
specify No. Files to 10, file CaptureA_1 is overwritten after the
NAM writes capture data to file CaptureA_10. To determine the most
recent capture, check each file’s time stamp.
File Location
Choose a location from File Location. Local disk is the default, or
choose a previously configured remote storage location. You can add
(NFS and iSCSI) remote storage locations by going to
Administration > System > Capture Data Storage.
Table 4-4 lists the hardware platforms NAM 5.0supports and their maximum session size. This is the
maximum capture memory buffer size for all capture sessions together, not individually.
Table 4-4
Maximum Capture Session Sizes for NAM Platforms
NAM Platform
Maximum Session
Size
WS-SVC-NAM-1
125 MB
WS-SVC-NAM-1 with memory upgrade (MEM-C6KNAM-2GB)
500 MB
WS-SVC-NAM-1-250S
200 MB
User Guide for the Cisco Network Analysis Module (NAM) Traffic Analyzer, 5.0
4-6
OL-22617-01
Chapter 4
Capturing and Decoding Packet Data
Sessions
Table 4-4
Maximum Capture Session Sizes for NAM Platforms (continued)
NAM Platform
Maximum Session
Size
WS-SVC-NAM-2
300 MB
WS-SVC-NAM-2 with memory upgrade (MEM-C6KNAM-2GB)
500 MB
WS-SVC-NAM-2-250S
500 MB
NAM2204-RJ45
2 GB
NAM2204-SFP
2 GB
NAM2220
10 GB
NME-NAM-80S
132 MB
NME-NAM-120S
300 MB
When capturing to multiple files, a suffix is added to the file name. For example, the first file for a
capture named CaptureA would be labeled as CaptureA_1 the second CaptureA_2, and so on.
Note
Step 4
When configuring capture to disk sessions, it is important to keep track of your free disk space and
manage your capture files. The NAM Traffic Analyzer allows you to create more capture files than you
have the free disk space to store. For example, you might have 400 MB of free disk space when you set
up two capture sessions that each store 160 MB of capture files. A little later, before the previous capture
sessions have each written 160 MB of data, you might notice you still have 160 MB of free disk space
and set up another capture session to store an addition 120 MB of capture files. You will then eventually
run out of disk space, causing all active capture sessions to end with errors.
Click the Submit button to finish configuration for this session, or configure Software Filters for this
session (see the next section, Software Filters, page 4-7).
Software Filters
You can create and save specialized filters that will disregard everything except the information you are
interested in when you capture data (see Figure 4-2). Starting in NAM Traffic Analyzer Release 5.0, you
can configure multiple software filters for each session (up to six). This allows you to narrow in on the
traffic that you are interested in, and it also saves resources (either memory or disk space).
If you create a session and then start it, you cannot edit the session without stopping it. If you edit a
session containing already captured data, you will get a warning saying that the session will be cleared
and the data removed. If you ignore the warning and add a filter to the session, and submit it, the new
filter settings will be used.
The application filter can be used to filter on the highest layer of the protocol parsing; that is usually a
layer 4 protocol (based on port). If you want to filter on the transport protocol (for example, UDP or
TCP), you will need to use the “IP Protocol” selector. Selecting, for example, TCP in the “IP Protocol”
selector will filter on all packets using TCP.
See these topics for help setting up and managing software filters:
•
Creating a Software Filter, page 4-8
•
Editing a Software Capture Filter, page 4-11
User Guide for the Cisco Network Analysis Module (NAM) Traffic Analyzer, 5.0
OL-22617-01
4-7
Chapter 4
Capturing and Decoding Packet Data
Sessions
Creating a Software Filter
You can define a software filter to filter based on any of the following:
•
Source host address
•
Destination host address
•
Network encapsulation
•
VLAN or VLAN range
•
Application
•
Source port or port range
•
Destination port or port range
To create a software capture filter:
Step 1
Choose Capture > Packet Capture/Decode > Sessions.
The Configure Capture Session dialog box is displayed.
Step 2
The bottom half of the screen displays any configured Software Filters. Click the Create button at the
bottom of the Software Filters area to create a new software filter.
The Software Filter Dialog (Figure 4-4) displays.
Figure 4-4
Step 3
Software Filter Dialog
Enter information in each of the fields as appropriate. See Table 4-5 for descriptions of the fields.
User Guide for the Cisco Network Analysis Module (NAM) Traffic Analyzer, 5.0
4-8
OL-22617-01
Chapter 4
Capturing and Decoding Packet Data
Sessions
Table 4-5
Software Filter Dialog Box
Field
Description
Usage Notes
Name
Enter a name of the new filter.
Source Address /
Mask
Source address of the packets.
•
For IP, IPIP4, GRE.IP, or GTP.IPv4 addresses, enter a valid
IPv4 address in dotted-quad format n.n.n.n, where n is 0 to
255. The default (if blank) is 255.255.255.255.
•
For IPv6 or GTP.IPv6 addresses, enter a valid IPv6 address in
any allowed IPv6 address format. For example:
– 1080::8:800:200C:417A
– ::FFF:129.144.52.38
Note
See RFC 2373 for valid text representations.
For MAC address, enter hh hh hh hh hh hh, where hh is a
hexadecimal number from 0 to 9 or a to f. The default is
ff ff ff ff ff ff.
The mask applied to the source
address.
•
•
•
If a bit in the Source Mask is
set to 1, the corresponding bit
in the address is relevant.
For IP, IPIP4, GRE.IP, or GTP.IPv4 addresses, enter a valid
IPv4 address in dotted-quad format n.n.n.n, where n is 0 to
255. The default (if blank) is 255.255.255.255.
•
If a bit in the Source Mask is
set to 0, the corresponding bit
in the address is ignored.
For IPv6 or GTP.IPv6 addresses, enter a valid IPv6 address in
any allowed IPv6 address format. The default mask (if blank)
for IPv6 addresses is ffff:ffff:ffff:ffff:ffff:ffff:ffff:ffff
Note
See RFC 2373 for valid text representations.
For MAC address, enter hh hh hh hh hh hh, where hh is a
hexadecimal number from 0 to 9 or a to f. The default is
ff ff ff ff ff ff.
User Guide for the Cisco Network Analysis Module (NAM) Traffic Analyzer, 5.0
OL-22617-01
4-9
Chapter 4
Capturing and Decoding Packet Data
Sessions
Table 4-5
Software Filter Dialog Box (continued)
Field
Description
Destination Address /
Mask
Destination address of the packets.
Usage Notes
•
For IP, IPIP4, GRE.IP, or GTP.IPv4 addresses, enter a valid
IPv4 address in dotted-quad format n.n.n.n, where n is 0 to
255. The default (if blank) is 255.255.255.255.
•
For IPv6 or GTP.IPv6 addresses, enter a valid IPv6 address in
any allowed IPv6 address format. For example:
– 1080::8:800:200C:417A
Note
See RFC 2373 for valid text representations.
For MAC address, enter hh hh hh hh hh hh, where hh is a
hexadecimal number from 0 to 9 or a to f. The default is
ff ff ff ff ff ff.
The mask applied to the destination
address.
•
•
Network
Encapsulation
If a bit in the Dest. Mask is set
to 1, the corresponding bit in
the address is relevant.
For IP, IPIP4, GRE.IP, or GTP.IPv4 addresses, enter a valid
IPv4 address in dotted-quad format n.n.n.n, where n is 0 to
255. The default (if blank) is 255.255.255.255.
•
For IPv6 or GTP.IPv6 addresses, enter a valid IPv6 address in
any allowed IPv6 address format. The default mask (if blank)
for IPv6 addresses is ffff:ffff:ffff:ffff:ffff:ffff:ffff:ffff
If a bit in the Dest. Mask is set
to 0, the corresponding bit in
Note
See RFC 2373 for valid text representations.
the address is ignored.
For MAC address, enter hh hh hh hh hh hh, where hh is a
hexadecimal number from 0 to 9 or a to f. The default is
ff ff ff ff ff ff.
The protocol to match with the
packet.
Both Directions
(check box)
•
Choose the protocol from the drop-down list.
•
Choose MAC to use the source/ destination MAC address of
the packets.
•
Choose IP to use the source/destination IP addresses of the
packets.
•
Choose IPIP4 for IP addresses including those tunneled over
IP protocol 4.
•
Choose GRE.IP for IP addresses including those tunneled
over GRE.
•
Choose IPv6 for addresses using IP version 6.
•
Choose GTP.IPv4 for IPv4 address for tunneled packet over
GTP.
•
Choose GTP.IPv6 for IPV6 address for tunneled packet over
GTP.
This check box indicates whether
If the source is host A and the destination is host B, enabling both
the filter is applied to traffic in both directions filters packets from A to B and B to A.
directions.
If the source is host A and the destination is not specified,
enabling both directions filters packets both to and from host A.
The “both directions” check box also affects the ports and not
only the addresses (the same logic applies).
User Guide for the Cisco Network Analysis Module (NAM) Traffic Analyzer, 5.0
4-10
OL-22617-01
Chapter 4
Capturing and Decoding Packet Data
Sessions
Table 4-5
Software Filter Dialog Box (continued)
Field
Description
Usage Notes
VLAN Identifier(s)
The 12-bit field specifying the
Choose a VLAN Range or enter from one to four individual
VLAN to which the packet belongs. VLAN IDs.
For better performance, use as narrow a range as possible. The
VLAN ID can range from 1-4095.
Application1
Select the Application radio button Select one or more protocols to capture from the Application
to filter by application.
drop-down list.
Use Shift + Click to select multiple protocols.
Port
Select the Port radio button to filter In the Source Port(s) field, enter one or more ports separated by
by Port.
commas.
In the Destination Port(s) field, enter one or more ports separated
by commas.
From the IP Protocol pull-down menu, choose TCP, UDP, or
SCTP. No selection (default) means that any will be allowed.
1. The application filter can be used to filter on the highest layer of the protocol parsing; that is usually a layer 4 protocol (based on port). If you want to
filter on the transport protocol (for example, UDP or TCP), you will need to use the “IP Protocol” selector. Selecting, for example, TCP in the “IP
Protocol” selector will filter on all packets using TCP.
Note
The parameters described in the table above are independently evaluated by the NAM.
Therefore, the NAM will allow you to enter parameters that are contradictory, but you will not
be able to get meaningful results if they do not match.
For example, the parameters Network Encapsulation and Source/Destination Address are
independently evaluated. If a filter is specified with contradicting parameters such as “Network
Encapsulation=IP4” and “Source Address=an IPv6 address”, it will never match any traffic, and
the result will be 0 packets captured.
Step 4
Click the Submit button to create the filter, or click Cancel to close the dialog box without creating a
software filter.
Editing a Software Capture Filter
To edit software capture filters:
Step 1
Choose Capture > Packet Capture/Decode > Sessions.
The Software Filters box is displayed at the bottom of the page.
Step 2
Choose the filter to edit, then click Edit.
The Software Filter dialog box (see Table 4-5 on page 4-9) is displayed.
Step 3
Enter information in each of the fields as appropriate.
Step 4
Do one of the following:
•
To apply the changes, click Submit.
User Guide for the Cisco Network Analysis Module (NAM) Traffic Analyzer, 5.0
OL-22617-01
4-11
Chapter 4
Capturing and Decoding Packet Data
Sessions
•
To cancel the changes, click Cancel.
Hardware Assisted Filters
Hardware Assisted Capture enables you to improve capture performance by providing hardware-specific
filters to help you eliminate as much extraneous traffic as possible. The packets filtered out by hardware
filters are not processed by the NAM, and therefore capture performance improves.
Choose Capture > Sessions to view the status and settings of the hardware assisted capture feature of
the Cisco NAM. It will appear at the bottom of the page, in the Hardware Filters section.
Note
Hardware filters apply only to the Cisco 2200 Series Appliances.
Software filters add flexibility to your filtering, but a Hardware Assisted Capture Session is most
efficient when you use only hardware filters. The less traffic requiring software filtering, the more
efficient the filtering.
Configuring a Hardware Filter
The Hardware Filters window displays the status and settings of the Hardware-Assisted Capture if a
capture has been defined. To configure a capture:
Step 1
Choose Capture > Packet Capture/Decode > Sessions.
Step 2
At the bottom of the screen, in the Hardware Filters section, click the Create button.
Step 3
Enter a name in the Name field.
Step 4
Choose one of the following types of filters from the Type drop-down list:
•
VLAN
•
VLAN and IP
•
IP
•
IP and TCP/UDP
•
IP and Payload Data
•
Payload Data
User Guide for the Cisco Network Analysis Module (NAM) Traffic Analyzer, 5.0
4-12
OL-22617-01
Chapter 4
Capturing and Decoding Packet Data
Sessions
The list is also shown in Figure 4-5.
Figure 4-5
Hardware Filter Type
Step 5
Data fields will then appear that correspond with the type of hardware filter you selected. Fill in the
desired fields. See the following sections for more specific information.
Step 6
Click Submit to complete the configuration of the capture session. Otherwise, click Reset to revert to
the previous settings, or click Cancel to abort.
VLAN
To configure a VLAN hardware filter:
Step 1
Enter a Filter Name.
Step 2
From the Type drop-down menu, choose VLAN.
Step 3
Choose either the Range or Individuals radio button. For Range, enter a range of VLANs. For
Individuals, enter up to four individual VLANs.
Step 4
Click the Submit button.
VLAN and IP
To configure a VLAN and IP hardware filter:
Step 1
Enter a Filter Name.
Step 2
From the Type drop-down menu, choose VLAN and IP.
Step 3
Enter the ID of the desired VLAN. The VLAN ID can range from 1-4095.
Step 4
Enter a Source Address / Mask (optional).
Step 5
Enter a Destination Address / Mask (optional).
Step 6
Choose a Layer 4 Protocol (optional).
User Guide for the Cisco Network Analysis Module (NAM) Traffic Analyzer, 5.0
OL-22617-01
4-13
Chapter 4
Capturing and Decoding Packet Data
Sessions
Step 7
Click Submit.
IP
To configure an IP hardware filter:
Step 1
Enter a Filter Name.
Step 2
From the Type drop-down menu, choose IP.
Step 3
Enter a Source Address / Mask (optional).
Step 4
Enter a Destination Address / Mask (optional).
Step 5
Choose a Layer 4 IP Protocol (optional)
Step 6
Click Submit.
IP and TCP/UDP
To configure an IP and TCP/UDP hardware filter:
Step 1
Enter a Filter Name.
Step 2
From the Type drop-down menu, choose IP and TCP/UDP
Step 3
Enter a Source Address / Mask (optional).
Step 4
Enter a Destination Address / Mask (optional).
Step 5
Choose an IP Protocol, either TCP or UDP.
Step 6
Enter a TCP/UDP Source Port (optional).
Step 7
Enter a TCP/UDP Destination Port (optional).
Step 8
Click Submit.
IP and Payload Data
To configure an IP and Payload Data hardware filter:
Step 1
Enter a Filter Name.
Step 2
From the Type drop-down menu, choose IP and Payload Data.
Step 3
Enter a Source Address / Mask (optional).
Step 4
Enter a Destination Address / Mask (optional).
Step 5
Choose an IP Protocol, either TCP or UDP.
Step 6
Enter the values for Payload Data:
•
Enter an Offset from 1-1023. The offset is relative to the beginning of the payload (Layer 5).
•
Enter a Value of up to four bytes (eight hex characters).
User Guide for the Cisco Network Analysis Module (NAM) Traffic Analyzer, 5.0
4-14
OL-22617-01
Chapter 4
Capturing and Decoding Packet Data
Files
•
Step 7
Note
Step 8
Enter a Mask of up to four bytes (eight hex characters).
Repeat Step 6 for up to four payload data segments.
Only one payload segment (one row) is required. Be careful not to create overlapping payload segments.
If overlapping segments have different values the filter will never match anything due to the inherent
AND logic.
Click Submit.
Payload Data
To configure a Payload Data hardware filter:
Step 1
Enter a Filter Name.
Step 2
From the Type drop-down menu, choose Payload Data.
Step 3
Choose an IP Protocol, either TCP or UDP.
Step 4
Enter the values for Payload Data:
Step 5
Note
Step 6
•
Enter an Offset from 1-1023. The offset is relative to the beginning of the payload (Layer 5).
•
Enter a Value of up to four bytes (eight hex characters).
•
Enter a Mask of up to four bytes (eight hex characters).
Repeat Step 4 for up to four payload data segments.
Only one payload segment (one row) is required. Be careful not to create overlapping payload segments.
If overlapping segments have different values the filter will never match anything due to the inherent
AND logic.
Click Submit.
Files
Use the Files option to decode, download, rename, convert/merge, delete, analyze, or error-scan saved
capture files. See the section Sessions, page 4-2 and Table 4-2 for information about how to save capture
sessions to files. You can download files in either .enc or .pcap file formats. See Preferences, page 5-13,
for information about setting the download file format.
Caution
If you have capture files with a state of Full and the NAM is rebooted, the capture will be triggered again
and these files may be overwritten by the new capture. If you want to retain the file, save the file before
rebooting.
Choose Capture > Packet Capture/Decode > Files to display the Capture Files window. The Capture
Files window shows the following information:
User Guide for the Cisco Network Analysis Module (NAM) Traffic Analyzer, 5.0
OL-22617-01
4-15
Chapter 4
Capturing and Decoding Packet Data
Files
•
Name:
•
Size:
•
Date:
•
State:
•
Location:
If you are using a Cisco 2200 Series appliance, the NAM will create a xxx.pcap file. If you click on the
download button, a xxx.pcap file will be created regardless of whether you accept the download action
or cancel it (a xxx.pcap file will be created once the download button is clicked). This is why one capture
using an appliance could have an extra file compared with a capture from another NAM platform.
Table 4-6
Buttons in the Capture Files Operations Window
Operation
Description
Decode
Display the packets in a file.
Download
Download a file to your computer in .enc or .pcap file format.
Note
Do not add a file suffix when you provide the filename. The suffix
.pcap is added automatically.
Note
.capture to .pcap conversion will occur when you download a
capture file. You will need to manually delete the .pcap file when
it is done.
Rename
Give the file a new name. A dialog box displays and asks you to enter the
new name for the selected capture file.
Merge or
Convert/Merge
Merge packets of files.(in chronological order). A dialog box displays and
asks you to enter the new name for the merged capture files. Enter a name
for the merged capture files and choose OK.
Note
Merged files cannot exceed 2 GB.
On the Cisco NAM 2200 Series appliances, this button is called
“Convert/Merge.” This can be used to convert one .capture file to a .pcap
file, so the Error Scan and the Analyze functions can be performed on that
converted file. Otherwise, Analyze and Error Scan cannot be performed on
a .capture file which only shows up on appliances.
Delete
Delete files.
Analyze
View statistical analysis of the selected capture. See Analyzing Capture
Files, page 4-17.
Errors Scan
View more information about the file (Packed ID, Protocol, Severity,
Group, and Description). From here you can also decode the packet. For
more information see Error Scan, page 4-17.
User Guide for the Cisco Network Analysis Module (NAM) Traffic Analyzer, 5.0
4-16
OL-22617-01
Chapter 4
Capturing and Decoding Packet Data
Files
Note
Capture files on the NAM 2200 Series appliances are stored in native NAM format. You can convert the
capture file format to .pcap using the Convert/Rename/Merge button on the Capture > Packet
Capture/Decode > Files window.
Analyzing Capture Files
The Capture Files window (Capture > Packet Capture/Decode > Files) enables you to obtain various
statistics including traffic rate (bytes/second) over a capture period, lists of hosts, conversations, and
applications associated with network traffic.
This window also enables you to drill-down for a more detailed look at a particular set of network traffic.
The pane above the Traffic over Time graph displays the time shown in the graph in the From: and To:
fields. It also provides fields for Protocol and Host/subnet, and a Drill-Down button.
Note
After clicking the Drill-Down button, the Host Statistics results table will display both source and
destination hosts, if either the source or destination host of the traffic belongs to the Host/Subnet that
you had specified.
Each slice in the Traffic over Time graph displays the amount of traffic for the amount of time set in
the Granularity of the capture file.
You can view more detail about a specific time frame by entering the time in the From: and To: fields
and choosing Drill-Down. You can also drill-down on a specific Protocol or Host/subnet address.
Table 4-7 describes the different areas of the capture analysis window.
Table 4-7
Capture Analysis Window Fields
Field
Description
Capture Overview
Provides a summary of the displayed capture including number of packets
captured, bytes captured, average packet size, capture start time, duration of
capture, and data transfer rate (both bytes and bits per second)
Traffic over Time
Displays a graphic image of network traffic (KB/second)
Protocol Statistics
Displays packets and bytes transferred for each protocol
Hosts Statistics
Displays packets and bytes transferred for each host address
Error Scan
Note
This feature is available for .pcap files, but not for .capture files.
The Capture Errors and Warnings Information screen shows warnings and errors, and packet
irregularities. From this screen, you can launch the Packet Decode Window, where you can drill-down
to packet details (select a row in the table and click the Decode Packet button).
To get to the Capture Errors and Warnings Information screen, choose Capture > Packet
Capture/Decode > Files. Highlight a file and click the Errors scan button.
User Guide for the Cisco Network Analysis Module (NAM) Traffic Analyzer, 5.0
OL-22617-01
4-17
Chapter 4
Capturing and Decoding Packet Data
Files
The Error Scan screen is shown in Figure 4-6.
Figure 4-6
Error Scan Screen
The fields are described in Table 4-8.
Table 4-8
Error Scan Screen Descriptions
Field
Description
Packet ID
ID of the packet in the capture file.
Protocol
Protocol the packet arrived on.
Severity
Warn: Warning; for example, an application returned an unusual error
code
Error: A serious problem, such as malformed packets
Group
Checksum: A checksum was invalid
Sequence: Protocol sequence is problematic
Response Code: Problem with the application response code
Request Code: An application request
Undecoded: Dissector incomplete or data can’t be decoded
Reassemble: Problems while reassembling
Malformed: Malformed packet or dissector has a bug; dissection of this
packet aborted
Description
Description of the error or warning
Downloading Capture Files
The following procedure describes how to download a capture file to your computer. You can only
download one capture file at a time.
Step 1
Choose Capture > Packet Capture/Decode > Files.
User Guide for the Cisco Network Analysis Module (NAM) Traffic Analyzer, 5.0
4-18
OL-22617-01
Chapter 4
Capturing and Decoding Packet Data
Files
Step 2
Choose a capture file from the list of captures.
Step 3
Click Download.
A File Download dialog box displays and asks “Do you want to save this file?”
Figure 4-7
Step 4
Download Capture File Dialog Box
Click Save.
A Save As dialog box opens and provides a way for you to rename and save the file at a location of your
choice.
Deleting a Capture File
To delete a capture file:
Step 1
Choose Capture > Packet Capture/Decode > Files.
Step 2
Choose a capture file from the list of captures.
Step 3
Click Delete.
A dialog box displays and asks “Delete the following file(s)?” and displays the file name.
Step 4
Click OK to delete the file or Cancel to allow the file to remain.
Deleting Multiple Files
To delete all capture files at once:
Step 1
Choose Capture > Packet Capture/Decode > Files.
Step 2
Highlight a row in the list of captures, and then hold down the Shift key and select another row. All rows
inbetween will also be selected.
You can also hold down the Ctrl key and click to select individual rows.
User Guide for the Cisco Network Analysis Module (NAM) Traffic Analyzer, 5.0
OL-22617-01
4-19
Chapter 4
Capturing and Decoding Packet Data
Viewing Packet Decode Information
Step 3
Click the Delete button.
A dialog box displays and asks “Delete all capture file(s)?”
Step 4
Click OK to delete all the files or Cancel to allow them to remain.
Viewing Packet Decode Information
After some packets or files have been captured, you can use the Packet Decoder to view the packet
contents.
The Packet Decoder window has four parts:
•
Packet Decoder operations
•
Packet browser pane
•
Protocol decode (see Viewing Detailed Protocol Decode Information, page 4-22)
•
Packet hexadecimal dump
To view packet decode information:
Step 1
Choose Capture > Packet Capture/Decode > Sessions, or Capture > Packet Capture/Decode > Files
(depending on which type you would like to decode).
Step 2
Choose a capture session or file, and then click the Decode button. The Packet Decoder window displays.
Table 4-9 describes the packet decoder operations (buttons on the NAM Traffic Analyzer - Packet
Decoder screen.
Table 4-9
Packet Decoder Operations
Button
Description
Stop
Stop packet loading
Prev
Load and decode the previous block of packets from the NAM
Next
Load and decode the next block of packets from the NAM
Go To
Load and decode a block of packets starting from the specified packet number.
Display Filter
Launch the Display Filter dialog. See Filtering Packets Displayed in the Packet
Decoder, page 4-21.
TCP Stream
Follow the TCP stream of the selected TCP packet.
Note
This might take a long time depending on the traffic pattern.
User Guide for the Cisco Network Analysis Module (NAM) Traffic Analyzer, 5.0
4-20
OL-22617-01
Chapter 4
Capturing and Decoding Packet Data
Viewing Packet Decode Information
Table 4-10 describes the columns displayed in the packet browser pane.
Table 4-10
Packet Browser
Field
Description
Pkt
Packet numbers, listed numerically in capture sequence. If the decode (display) filter is active, the packet
numbers might not be consecutive.
Time
Time the packet was captured relative to the first packet displayed (not the first packet in the session).
Note
To see the absolute time, see the Detail window.
Size
Size of the packet, in bytes.
Source
Packet source, which might be displayed as hostname, IP, IPX, or MAC address.
Note
To turn hostname resolution on and off for IP addresses, choose the Setup tab and change this setting
under Preferences.
Destination
Packet destination, which might be displayed as hostname, IP, IPX, or MAC address.
Protocol
Top-level protocol of the packet.
Info
Brief text information about the packet contents.
Browsing Packets in the Packet Decoder
You can use the packet browser to browse the list of captured packets and do the following:
Note
•
Filter by protocol, IP address, MAC address, and custom display filter.
•
Use the Next, Previous, and Go To buttons to load packets from the capture session.
The capture must be paused or stopped for you to use these features.
Filtering Packets Displayed in the Packet Decoder
To filter packets displayed in the packet decoder:
Step 1
From the Packet Decoder window, click the Display Filter button. The Packet Decoder - Display Filter
Window displays.
Step 2
Do the following:
•
Choose a Filter Mode:
– Inclusive displays packets that match the condition(s.)
– Exclusive displays packets that do not match the condition(s).
•
Choose an Address Filter:
– IP address filters on IP address.
– MAC Address filter on MAC address.
– Source allows you to specify the source address, or leave it blank if not applicable.
User Guide for the Cisco Network Analysis Module (NAM) Traffic Analyzer, 5.0
OL-22617-01
4-21
Chapter 4
Capturing and Decoding Packet Data
Viewing Packet Decode Information
– Destination allows you to specify the destination address, or leave it blank if not applicable.
– Both Directions allows you to match of packets travelling in both directions.
•
Define a Protocol Filter.
– Click Match any to display packets that match any of the protocols or fields
or
– Click Match all to display packets that match all of the protocols or fields.
– Choose a protocol from the Protocols list.
Note
You can enter the first few letters of the protocol name to go directly to the protocol. If you make
a typo, press ESC or SPACE to reset.
– Choose a protocol field from the Fields list, then specify the field value if applicable.
•
Step 3
Choose a Custom Filter. See Custom Display Filters, page 4-23 for how to set up a custom display
filter.
Click OK to apply the filter and close the window.
Click Submit to apply the filter and keep the window open.
Click Clear Filter to clear all of the fields.
Click Cancel to close the window without any action.
Viewing Detailed Protocol Decode Information
To view detailed protocol information:
Step 1
Highlight the packet number about which you want more information.
Detailed information about that packet is displayed in the Protocol Decode and hexadecimal dump panes
at the bottom of the window.
Note
Step 2
Note
Tip
If you highlight the details in the Protocol Decode pane, the corresponding bytes are highlighted in the
hexadecimal dump pane below it.
To review the information, use the scrolling bar in the lower panes.
When you decode SCCP traffic, the NAM lists the protocol as skinny, not SCCP.
•
Protocols are color coded both in the Packet Browser and the Protocol Decode pane.
•
Choose the protocol name in the Protocol Decode pane to collapse and expand protocol information.
User Guide for the Cisco Network Analysis Module (NAM) Traffic Analyzer, 5.0
4-22
OL-22617-01
Chapter 4
Capturing and Decoding Packet Data
Viewing Packet Decode Information
•
To adjust the size of any of the panes, click and drag the pane frame up or down.
Using Alarm-Triggered Captures
You can configure multiple alarm-triggered captures that start and stop automatically by alarm events
you define.
To set up an alarm-triggered capture:
Step 1
Create an alarm event from the Setup > Alarms > Alarm Events window.
Configure an Alarm Event for the type of event for which you want to capture data. See Alarm Action
Configuration, page 2-37, for more information.
Step 2
Set a threshold for the event from the Setup > Alarms > Alarm Thresholds window.
Configure the threshold of parameters of interest in the associated Alarm Event. See Thresholds,
page 2-39, for more information.
Step 3
Set up a capture session from the Capture > Packet Capture/Decode > Sessions window. Click Create.
Choose the Start Event and/or the Stop Event for the associated Alarm Event. See Configuring Capture
Sessions, page 4-4, for more information.
Custom Display Filters
Use custom display filters to create and save customized filters to use in the Decode window to limit
which packets are to be displayed.
See these topics for help setting up and managing custom display filters:
•
Creating Custom Display Filters, page 4-23
•
Editing Custom Display Filters, page 4-26
•
Deleting Custom Display Filters, page 4-27
Creating Custom Display Filters
To create custom display filters:
Step 1
Choose Capture > Packet Capture/Decode > Sessions.
The Hardware Filters box is displayed at the bottom of the page.
Step 2
Click Create.
The Custom Decode Filter Dialog Box, Table 4-11, displays.
Step 3
Enter information in each of the fields as appropriate.
User Guide for the Cisco Network Analysis Module (NAM) Traffic Analyzer, 5.0
OL-22617-01
4-23
Chapter 4
Capturing and Decoding Packet Data
Viewing Packet Decode Information
Table 4-11
Custom Decode Filter Dialog Box
Field
Description
Usage Notes
Filter Name
The name of the capture filter.
Enter the name of the filter to be created.
Description
The description of the capture filter.
Enter a description of the filter.
Protocol
The protocol to match with the packet.
Choose a protocol from the list. (Select All to match all
packets regardless of protocol.)
Address
(MAC or IP)
Indicates whether to filter by MAC or IP
address.
Choose MAC to filter using the source/destination MAC
address of the packets.
Choose IP to filter using the source/destination addresses of
the packets.
Both Directions
Indicates whether the filter is applied to traffic If the source is host A and the destination is host B, enabling
in both directions.
both directions filters packets from A to B and B to A.
If the source is host A and the destination is not specified,
enabling both directions filters packets both to and from host
A.
Offset
The offset (in bytes) from the Base where
packet data-matching begins.
Enter a decimal number.
Base
The base from which the offset is calculated.
Choose absolute or a protocol.
If you select absolute, the offset is calculated
from the absolute beginning of the packet (for
example, the beginning of the Ethernet
frame).
If you select protocol, the offset is calculated
from the beginning of the protocol portion of
the packet. If the packet does not contain the
protocol, the packet fails this match.
User Guide for the Cisco Network Analysis Module (NAM) Traffic Analyzer, 5.0
4-24
OL-22617-01
Chapter 4
Capturing and Decoding Packet Data
Viewing Packet Decode Information
Table 4-11
Custom Decode Filter Dialog Box (continued)
Field
Description
Usage Notes
Data Pattern
The data to be matched with the packet.
Enter hh hh hh ..., where hh are hexadecimal numbers from
0-9 or a-f.
Leave blank if not applicable.
Filter Expression
An advanced feature to set up complex filter
conditions.
See Tips for Creating Custom Decode Filter Expressions,
page 4-25.
The simplest filter allows you to check for the
existence of a protocol or field. For example,
to see all packets that contain the IPX
protocol, you can use the simple filter
expression ipx.
Step 4
Do one of the following:
•
To create the filter, click Submit.
•
To cancel filter creation, click Cancel.
Tips for Creating Custom Decode Filter Expressions
You can construct custom decode filter expressions using the following logical and comparison operators
listed in Table 4-12.
Table 4-12
Logical and Comparison Operators
Operator
Meaning
and
Logical AND
or
Logical OR
xor
Logical XOR
not
Logical NOT
==
Equal
!=
Not equal
>
Greater than
You can also group subexpressions within parentheses. You can use the following fields in filter
expressions:
Field
Filter By
eth.addr
eth.src
eth.dst
MAC address
ip.addr
ip.src
ip.dst
IP address
Format
hh:hh:hh:hh:hh:hh,
where h is a hexadecimal number from 0 to 9 or a
to f.
, where n is a number from 0 to 255 and s is a
0-32 hostname that does not contain a hyphen.
n.n.n.n or n.n.n.n/s
User Guide for the Cisco Network Analysis Module (NAM) Traffic Analyzer, 5.0
OL-22617-01
4-25
Chapter 4
Capturing and Decoding Packet Data
Viewing Packet Decode Information
Field
Filter By
Format
tcp.port
tcp.srcport
tcp.dstport
TCP port number
A decimal number from 0 to 65535.
udp.port
udp.srcport
udp.dstport
UDP port number
A decimal number from 0 to 65535.
protocol
Protocol
Click the Protocol list in the Custom Decode Filter dialog box to see the
list of protocols on which you can filter.
protocol [offset:length]
Protocol data pattern
hh:hh:hh:hh...,
offset
where hh is a hexadecimal number fro 0 to 9 or a to f.
and length are decimal numbers.
offset starts at 0 and is relative to the beginning of the protocol
portion of the packet.
frame.pkt_len
Packet length
A decimal number that represents the packet length, not the truncated
capture packet length.
Examples of Custom Decode Filter Expressions
•
To match SNMP packets from 111.122.133.144, enter:
snmp and (ip.src == 111.122.133.144)
•
To match IP packets from the 111.122 Class B network, enter:
ip.addr == 111.122.0.0/16
•
To match TCP packets to and from port 80, enter:
tcp.port == 80
•
The TOS value is stored in byte 1 (the second byte) in the IP header. To match the IP packet with
the TOS value 16 (0x10), enter:
ip[1:1] == 10
•
The TCP acknowledgement number is stored in bytes 8 through 11 in the TCP header. To match the
TCP packet with acknowledgement number 12345678 (0xBC614E), enter:
tcp[8:4] == 00:BC:61:4E
Note
You can use a filter expression with other fields in the Custom Decode Filter dialog box. In this case, the
filter expression is ANDed with other conditions.
Invalid or conflicting filter expressions result in no packet match.
Editing Custom Display Filters
To edit custom display filters:
Step 1
Choose Capture > Packet Capture/Decode > Display Filters.
Step 2
Choose the filter to edit, then click Edit.
Step 3
Change the information in each of the fields as appropriate.
User Guide for the Cisco Network Analysis Module (NAM) Traffic Analyzer, 5.0
4-26
OL-22617-01
Chapter 4
Capturing and Decoding Packet Data
Viewing Packet Decode Information
Step 4
Do one of the following:
•
To apply the changes, click Submit.
•
To clear the page of your changes, click Reset.
•
To exit the page without applying the changes, click Cancel.
Deleting Custom Display Filters
To delete custom display filters:
Step 1
Choose Capture > Packet Capture/Decode > Display Filters.
Step 2
Choose the filter to delete, then click Delete.
Step 3
In the confirmation dialog box, do one of the following:
•
To delete the filter, click OK.
•
To cancel, click Cancel.
User Guide for the Cisco Network Analysis Module (NAM) Traffic Analyzer, 5.0
OL-22617-01
4-27
Chapter 4
Capturing and Decoding Packet Data
Viewing Packet Decode Information
User Guide for the Cisco Network Analysis Module (NAM) Traffic Analyzer, 5.0
4-28
OL-22617-01
CH A P T E R
5
User and System Administration
This chapter provides information about performing user and system administration tasks and generating
diagnostic information for obtaining technical assistance.
This chapter contains the following sections:
•
System Administration, page 5-1 describes menu options that enable you to perform system
administrative tasks and manage the NAM Traffic Analyzer.
•
Diagnostics, page 5-14 describes menu options that help you diagnose and troubleshoot problems.
•
User Administration, page 5-16 describes how you configure either a local database or provide
information for a TACACS+ database for user authentication and authorization. This section also
describes the current user session window.
System Administration
The System option of the Administration menu provides access to the following functions:
•
Resources, page 5-2
•
Network Parameters, page 5-2
•
SNMP Agent, page 5-3
•
System Time, page 5-5
•
E-Mail Setting, page 5-7
•
Web Data Publication, page 5-8
•
Capture Data Storage, page 5-8
•
Syslog Setting, page 5-12
•
SNMP Trap Setting, page 5-12
•
Preferences, page 5-13
User Guide for the Cisco Network Analysis Module (NAM) Traffic Analyzer, 5.0
OL-22617-01
5-1
Chapter 5
User and System Administration
System Administration
Resources
Choose Administration > System > Resources to view the System Overview window. Table 5-1
describes the fields of the System Overview window for a NAM Traffic Analyzer with multiple CPUs
such as the Cisco NAM 2220 appliance.
Table 5-1
System Overview
Field
Description
Date
Current date and time synchronized with the switch,
router, or NTP server.
Hostname
NAM hostname.
IP Address
NAM IP address.
System Uptime
Length of time the host has been running uninterrupted.
CPU Utilization
Percentage of CPU resources being consumed by the
NAM. Average, at top, indicates the average CPU usage
of all CPUs. Each individual CPU in a multi-CPU
platform is listed separately.
Memory Utilization
Percentage of memory resources being consumed by the
NAM.
Memory Total
Total amount of system memory.
Disk Usage
Shows root, config, and data partitions with their total
and free space.
Data Files
Shows the amount of disk space used up by the
performance data base files ("DB") and the packet capture
to disk ("capture" files).
NIC Statistics
Shows the health and usage information on the data ports,
where the NAM receives most of the traffic to be
analyzed. It shows the number of packets received (rx
pkts), number of bytes received (rx bytes) and number of
packets lost or dropped (rx lost). The first number shows
cumulative counts since the start of the NAM, and the
second one shows the same counters for the last ten
seconds.
Network Parameters
To view and set network parameters:
Step 1
Choose Administration > System > Network Parameters.
The Network Parameters screen displays.
Step 2
Enter or change the information detailed in Table 5-2.
User Guide for the Cisco Network Analysis Module (NAM) Traffic Analyzer, 5.0
5-2
OL-22617-01
Chapter 5
User and System Administration
System Administration
NAM 5.0 does not support using IPv6 for the network parameter IP address.
Note
Table 5-2
Step 3
Network Parameters Dialog Box
Field
Description
IP Address
NAM IP address.
IP Broadcast
NAM broadcast address.
Subnet Mask
NAM subnet mask.
IP Gateway
NAM IP gateway address.
Host Name
NAM hostname.
Domain name
NAM domain name.
Nameservers
NAM nameserver address or addresses.
Do one of the following:
•
To save the changes, click Submit.
•
To cancel the changes, click Reset.
SNMP Agent
An SNMP Agent is a network management software module that resides in a managed device. It has
local knowledge of management information and translates that information into a form compatible with
SNMP.
With NAM Traffic Analyzer 5.0, you have the ability to manage devices with SNMPv3. The NAM polls
the managed device to get its basic health and interface stats. For NAM blades (WS-SVC-NAM-1,
WS-SVC-NAM-2 platforms), the managed device is the switch in which the NAM is inserted, and the
NAM software negotiates with the switch to use SNMPv2c and a community string to do the polling.
This community string is only valid for use with the NAM. For security purposes, the switch associates
the community string with the NAM's IP address only, and no other SNMP application can use this
community string to communicate with the switch. For more information about community strings, see
Working with NAM Community Strings, page 5-4.
Also, to further alleviate any security concerns, the SNMP exchanges between WS-SVC-NAM-1 or
WS-SVC-NAM-2 and the switch take place on an internal backplane bus. These SNMP packets are not
visible on any network, nor any interface outside of the switch. It is a completely secure out-of-band
channel inside the switch.
For other platforms, such as Cisco 2200 Series appliances, you can type in any IP address and use it as
the managed device. In this case, the managed device may only want to use SNMPv3 since it is more
secure.
Note
For a WAAS appliance, SNMPv3 is not required. It is contained within the same chassis, and the NAM
Traffic Analyzer uses an internal communications channel, so security is not an issue and the SNMPv3
option is not needed.
User Guide for the Cisco Network Analysis Module (NAM) Traffic Analyzer, 5.0
OL-22617-01
5-3
Chapter 5
User and System Administration
System Administration
To view and set the NAM SNMP Agent:
Step 1
Choose Administration > System > SNMP Agent.
Step 2
Enter or change the information on the NAM SNMP screen. The fields are detailed in Table 5-3.
Step 3
Table 5-3
System SNMP Dialog Box
Field
Description
Contact
The name of the person responsible for the NAM.
Name
The name of the NAM.
Location
The physical location of the switch or router in which the NAM
is installed.
Do one of the following:
•
To save the changes, click Submit.
•
To cancel the changes, click Reset.
Working with NAM Community Strings
You use community strings so that other applications can send SNMP get and set requests to the NAM,
set up collections, poll data, and so on.
Creating NAM Community Strings
To create the NAM community strings:
Step 1
Choose Administration > System > SNMP Agent.
At the bottom of the window, the NAM Community Strings Dialog Box displays.
Step 2
Click Create.
The SNMP Agent Dialog Box displays.
Step 3
Enter the community string (use a meaningful name).
Step 4
Enter the community string again in the Verify Community field.
Step 5
Assign read-only or read-write permissions using the following criteria:
Step 6
•
Read-only allows only read access to SNMP MIB variables (get).
•
Read-write allows full read and write access to SNMP MIB variables (get and set).
Do one of the following:
•
To make the changes, click Submit.
•
To cancel, click Reset.
User Guide for the Cisco Network Analysis Module (NAM) Traffic Analyzer, 5.0
5-4
OL-22617-01
Chapter 5
User and System Administration
System Administration
Deleting NAM Community Strings
To delete the NAM community strings:
Step 1
Choose Administration > System > SNMP Agent.
At the bottom of the window, the NAM Community Strings Dialog Box displays.
Step 2
Caution
Select an entry, then click Delete.
Deleting the NAM community strings blocks SNMP requests to the NAM from outside SNMP agents.
The community string is deleted.
Testing the Router Community Strings
Before the router can send information to the NAM using SNMP, the router community strings set in the
NAM Traffic Analyzer must match the community strings set on the actual router. The Router
Parameters dialog box displays the router name, hardware, Supervisor engine software version, system
uptime, location, and contact information.
The local router IP address and the SNMP community string must be configured so that the NAM can
communicate with the local router.
To set the community strings on the router, use the router CLI. For information on using the CLI, see the
documentation that accompanied your device.
Caution
The router community string you enter must match the read-write community strings on the router.
Otherwise you cannot communicate with the router.
To test router community strings:
Step 1
Choose Setup > Managed Device > Device Information.
The Device Information dialog box displays.
Step 2
Enter the Device's Community String.
Step 3
Click Test Connectivity.
Step 4
Wait for a while for NAM to communicate with the Device. If it comes back OK, then click on Submit.
System Time
The NAM Traffic Analyzer gets the UTC (GMT) time from one of two sources, depending on its the
NAM type. All NAMs can be set up to get their time from an external NTP server. Following is the
second option per NAM type:
•
WS-SVC-NAM-1 and WS-SVC-NAM-2 can get their time from the switch.
•
NME-NAMs can get their time from the router.
User Guide for the Cisco Network Analysis Module (NAM) Traffic Analyzer, 5.0
OL-22617-01
5-5
Chapter 5
User and System Administration
System Administration
•
Caution
Cisco 2200 Series appliances can get their time from a local CLI clock set command.
Both the client computer and the NAM server must have the time set accurately for their respective time
zones. If either the client or the server time is wrong, then the data shown in the GUI will be wrong.
After the NAM acquires the time, you can set the local time zone using the NAM System Time
configuration screen. You can configure the NAM system time by using one of the following methods:
•
Synchronizing the NAM System Time with the Switch or Router, page 5-6
This option is valid only for WS-SVC-NAM-1, WS-SVC-NAM-2, and NME-NAMs.
•
Synchronizing the NAM System Time Locally, page 5-6
This option is valid only for Cisco NAM 2200 Series appliances.
•
Configuring the NAM System Time with an NTP Server, page 5-7
Synchronizing the NAM System Time with the Switch or Router
Note
This section is valid only for WS-SVC-NAM-1, WS-SVC-NAM-2, and NME-NAMs.
To configure the NAM system time from the switch or router:
Step 1
Choose Administration > System > System Time.
Step 2
Choose the Switch or Router radio button.
Step 3
Select the Region and local time zone from the lists.
Step 4
Do one of the following:
•
To save the changes click Submit.
•
To leave the configuration unchanged, click Reset.
Synchronizing the NAM System Time Locally
Note
This section is valid only for Cisco NAM 2200 Series appliances.
To configure the NAM system time locally using the NAM appliance command line:
Step 1
Log into the NAM appliance command line interface.
Step 2
Set the clock using the CLI clock set command.
clock set <hh:mm:ss:> <mm/dd/yyyy>
Step 3
On the NAM appliance GUI, choose Administration > System > System Time.
Step 4
Click the Local radio button.
Step 5
Select the Region and local time zone from the lists.
User Guide for the Cisco Network Analysis Module (NAM) Traffic Analyzer, 5.0
5-6
OL-22617-01
Chapter 5
User and System Administration
System Administration
Step 6
Do one of the following:
•
To save the changes click Submit.
•
To leave the configuration unchanged, choose Reset.
Configuring the NAM System Time with an NTP Server
To configure the NAM system time with an NTP server:
Step 1
On the NAM appliance GUI, choose Administration > System > System Time.
Step 2
Choose the NTP Server radio button.
Step 3
Enter one or two NTP server names or IP address in the NTP server name/IP Address text boxes.
Step 4
Select the Region and local time zone from the lists.
Step 5
Do one of the following:
•
To save the changes, click Submit.
•
To leave the configuration unchanged, click Reset.
E-Mail Setting
You can configure the NAM to provide e-mail notification of alarms and to e-mail reports. The following
procedure describes how to configure the NAM for e-mail notifications.
Step 1
Choose Administration > System > E-Mail Setting.
Step 2
The Mail Configuration Window displays. Table 5-4 describes the Mail Configuration Options.
Table 5-4
Mail Configuration Options
Field
Description
Enable Mail
Enables e-mail of reports and notification of alarms
External Mail Server
Distinguished name of external mail server
Send Test Mail
List e-mail addresses for up to three e-mail recipients
Mail Alarm to
This recipient will receive alarm notifications and scheduled exports.
Step 3
Check the Enable Mail check box.
Step 4
Enter the distinguished name of the External Mail Server.
Step 5
Put an e-mail address in the Send Test Mail to field (optional). A test e-mail will be sent to this recipient.
Step 6
Put an e-mail address in the Mail Alarm to field. Alarm notifications and Exports will be sent to this
recipient.
User Guide for the Cisco Network Analysis Module (NAM) Traffic Analyzer, 5.0
OL-22617-01
5-7
Chapter 5
User and System Administration
System Administration
Step 7
Click Submit to save your modifications, or click Reset to clear the dialog of any characters you entered
or restore the previous settings.
Web Data Publication
Web Data Publication allows general web users and websites to access (or link to) selected NAM monitor
and report screens without a login session.
Web Data Publication can be open or restricted using Access Control List (ACL) and/or publication
code. The publication code, if required, must be present in the URL address or cookie to enable access
to published data. Figure 5-1 shows the Web Data Publication Window.
Figure 5-1
Web Data Publication Window
To enable Web Data Publishing:
Step 1
Choose Administration > System > Web Data Publication.
Step 2
Check the Enable Web Data Publication check box.
Step 3
Enter a Publication Code (Optional). This is the pass code required in a URL’s cookie to access the
published page. For example, a publication code set to abc123 would be able to access the following
published window:
http://<nam-hostname>/application-analysis/index?publicationcode=abc123
Step 4
Enter an ACL Permit IP Address/Subnets to permit only those IP addresses or subnets access to web
publications. No entry provides open access to all.
Step 5
Click Submit to enable web publishing, or click Reset to clear the dialog of any characters you entered.
Capture Data Storage
Use the Capture Data Storage option to set up remote file systems to store capture data. You must set up
the capture data storage locations prior to setting up data captures. Choose Administration > Capture
Data Storage to open the Capture Data Storage window.
This section provides the following:
•
Creating NFS Storage Locations, page 5-9
•
Editing NFS Storage Locations, page 5-10
User Guide for the Cisco Network Analysis Module (NAM) Traffic Analyzer, 5.0
5-8
OL-22617-01
Chapter 5
User and System Administration
System Administration
•
Creating iSCSI Storage Locations, page 5-11
•
Editing iSCSI Storage Locations, page 5-11
Creating NFS Storage Locations
The NFS server must be configured properly to allow NAM to write data to it. The NAM accesses the
NFS directories with UID=80 (www) and UID=0 (root). The NFS directories must be fully accessible
by these UIDs.
One way to do this is to use the NFS option all_squash to map these UIDs to anonuid=<userID>, where
< userID> is a local user ID with full access rights to the NFS directories.
Configuring the NFS Server
The following example shows how to set up an NFS directory (/home/SomeUserName) in a Linux
server for a NAM (at IP address 1.1.1.2) to store capture data. To set up an NFS server directory to store
capture data:
Step 1
Locate a UID that has read and write access to the target NFS directory.
For example, if the target NFS directory is /home/SomeUserName, open the /etc/password file and
search for a user entry that contains something like the following:
SomeUserName:x:503:503::/home/SomeUserName:/bin/tcsh
In this example, the UID is 503.
Step 2
Edit the /etc/exports file and add a line like the following:
/home/SomeUserName
Step 3
1.1.1.2/255.255.255.255(rw,all_squash,anonuid=503)
Activate the change:
/usr/bin/exportfs -a
Note
If the NFS directory contains subdirectories that are not writable by the NAM, these subdirectories will
not be listed in NAM capture screens.
Configuring the NFS Storage Location on the NAM
The following procedure describes how to create an NFS storage location by specifying a remote file
system partition.
Step 1
Choose Administration > System > Capture Data Storage.
The Capture Data Storage window displays and lists any capture data storage locations already
configured.
Step 2
Click Create NFS.
Step 3
Enter the requested parameters in the New NFS Storage window.
Table 5-5 describes the NFS Storage location parameters.
User Guide for the Cisco Network Analysis Module (NAM) Traffic Analyzer, 5.0
OL-22617-01
5-9
Chapter 5
User and System Administration
System Administration
Table 5-5
Step 4
NFS Storage Location Parameters
Field
Description
Name
Name of the remote file system entry
Server
DNS name of the remote file system entry
Directory
Pathname of the remote file system partition
Basic NFS Options
Each fields shows a default value. If you need to
use values other than those available in the menus,
use Advanced NFS Options.
Protocol
Choose TCP or UDP
Timeout
You can set the timeout to a value from 0.1
seconds to 1.0 seconds
NFS Version
Choose from NFS versions 1-4
Retries
Choose from 1-5 retries
Advanced NFS Options
This field contains the default values for creating
an NFS storage location. You can edit the text to
use NFS options that are outside the ranges in the
pull-down menus of the Basic NFS Options.
Click Submit to create the NFS storage location. Otherwise click Reset to remove your entries or
Cancel to cancel the change.
Editing NFS Storage Locations
The following procedure describes how to edit an existing NFS storage location.
Note
Step 1
If you have set up capture sessions that use the NFS file system entry you want to edit (or modify), you
must delete those capture sessions before editing the NFS file system entry. You can find active capture
sessions by chooseing Capture > Sessions, then choose each capture that is running and choose Status.
If the capture is using the filesystem to be edited, click Clear.
Choose Administration > System > Capture Data Storage.
The Capture Data Storage window displays and lists any capture data storage locations already
configured.
Step 2
Click to select the NFS storage location you want to modify and click Edit.
The Edit Remote Storage Entry window displays the parameters of the select NFS storage location.
Step 3
Modify the parameters as desired.
Table 5-5 describes the NFS Storage location parameters.
Step 4
Click Submit to change the parameters of the NFS storage location. Otherwise click Reset to remove
all of the entries, or click Cancel to cancel the change.
User Guide for the Cisco Network Analysis Module (NAM) Traffic Analyzer, 5.0
5-10
OL-22617-01
Chapter 5
User and System Administration
System Administration
Creating iSCSI Storage Locations
The following procedure describes how to create an iSCSI storage location for storing NAM capture
data.
Step 1
Choose Administration > System > Capture Data Storage.
The Capture Data Storage window displays and lists any capture data storage locations already
configured.
Step 2
Click Create iSCSI.
Step 3
Enter the requested parameters in the New iSCSI Storage window.
Table 5-6 describes the iSCSI Storage location parameters.
Table 5-6
Step 4
Note
iSCSI Storage Location Parameters
Field
Description
Name
Name of the remote storage entry
Server
DNS hostnam or IP address of the iSCSI server.
Target Name
iSCSI target name configured on the remote iSCSI server
Click Submit to create the iSCSI storage location. Otherwise click Reset to remove your entries or
Cancel to cancel the change.
Before the new iSCSI storage entry takes effect, you must reboot the NAM system.
Editing iSCSI Storage Locations
The following procedure describes how to edit an existing iSCSI storage location.
Note
Step 1
If you have set up capture sessions that use the iSCSI file system entry you want to edit (or modify), you
must delete those capture sessions before editing the iSCSI file system entry. You can find active capture
sessions by clicking Capture > File, and then checking the State of each file to see if the capture is using
the filesystem to be edited. If yes, click Clear.
Choose Administration > System > Capture Data Storage.
The Capture Data Storage window displays and lists any capture data storage locations already
configured.
Step 2
Click to select the iSCSI storage location you want to modify and click Edit.
The selected iSCSI storage location parameters window displays
Step 3
Modify the parameters as desired.
Table 5-6 describes the iSCSI storage location parameters.
User Guide for the Cisco Network Analysis Module (NAM) Traffic Analyzer, 5.0
OL-22617-01
5-11
Chapter 5
User and System Administration
System Administration
Step 4
Note
Click Submit to change the iSCSI storage location parameters. Otherwise click Reset to remove your
entries or Cancel to cancel the change.
Before the changes to the iSCSI storage entry take effect, you must reboot the NAM system.
Syslog Setting
NAM syslogs are created for alarm threshold events, voice threshold events, or system alerts. You can
specify whether syslog messages should be logged locally on the NAM, on a remote host, or both. You
can use the NAM Traffic Analyzer to view the local NAM syslogs.
If logging on a remote host, in most Unix-based systems, the syslog collector that handles the incoming
syslog messages uses the facility field to determine what file to write the message to, and it will use a
facility called “local2.” Check the syslog collector configuration to ensure that "local2" is handled
properly.
To set up the NAM syslog:
Step 1
Choose Administration > System > Syslog Setting.
The NAM Syslog Setting window displays.
Step 2
In the Remote Server Names field, enter the IP address or DNS name of up to five remote systems where
syslog messages are logged. Each address you enter receives syslog messages from all three alarms
(Alarm Thresholds, Voice Signaling Thresholds, and System).
Step 3
Click Submit to save your changes, or click Reset to cancel.
SNMP Trap Setting
Traps are used to store alarms triggered by threshold crossing events. When an alarm is triggered, you
can trap the event and send it to a separate host. Trap-directed notifications can result in substantial
savings of network and agent resources by eliminating the need for frivolous SNMP requests.
These topics help you set up and manage NAM traps:
•
Creating a NAM Trap Destination, page 5-12
•
Editing a NAM Trap Destination, page 5-13
•
Deleting a NAM Trap Destination, page 5-13
Creating a NAM Trap Destination
To create a NAM trap destination:
Step 1
Choose Administration > System > SNMP Trap Setting.
The SNMP Trap Setting window displays.
User Guide for the Cisco Network Analysis Module (NAM) Traffic Analyzer, 5.0
5-12
OL-22617-01
Chapter 5
User and System Administration
System Administration
Step 2
Click the Create button.
Step 3
In the “Community” field, enter the community string set in the NAM Thresholds.
Step 4
In the “IP Address” field, enter the IP address to which the trap is sent if the alarm and trap community
strings match.
Step 5
In the “UDP Port” field, enter the UDP port number.
Step 6
Click Submit to save your changes, or click Reset to cancel and leave the configuration unchanged.
Editing a NAM Trap Destination
To edit a NAM trap destination:
Step 1
Choose Administration > System > SNMP Trap Setting.
The NAM Trap Destinations page displays.
Step 2
Select the trap to edit, then click Edit.
The Edit Trap dialog box displays.
Step 3
Make the necessary changes.
Step 4
Click Submit to save your changes, or click Reset to remove any entry.
Deleting a NAM Trap Destination
To delete an existing trap, simply select it from the Traps table, then click Delete.
Preferences
Choose Administration > System > Preferences to configure characteristics for NAM 5.0 such as NAM
display, audit trail, and file format preferences. Table 5-7 describes the fields of the Preferences window.
Table 5-7
Preferences
Field
Description
Refresh Interval (60-3600 sec)
Amount of time between refresh of information on
dashboards.
Top N Entries (1-10)
Number of colored bars on the Top N charts.
Perform IP Host Name Resolution
Wherever an IP address is displayed, it will get translated
to a hostname via DNS lookup.
Data Displayed In
Data displayed in Bytes or Bits.
International Notation
Choose the way you would like numbers displayed.
User Guide for the Cisco Network Analysis Module (NAM) Traffic Analyzer, 5.0
OL-22617-01
5-13
Chapter 5
User and System Administration
Diagnostics
Table 5-7
Preferences (continued)
Field
Description
Audit Trail
The Audit Trail option displays a listing of recent critical
activities that have been recorded in an internal syslog log
file. Syslog messages can also be sent to an external log.
Capture File Download Format
Choose ENC (.enc) or PCAP (.pcap) format for captured
files.
Diagnostics
The Diagnostics option of the Administration menu provides tools to aid in troubleshooting. You can
use these tools when you have a problem that might require assistance from the Cisco Technical
Assistance Center (TAC). There are options for:
•
System Alerts, page 5-14
•
Audit Trail, page 5-14
•
Tech Support, page 5-15
System Alerts
You can view any failures or problems that the NAM Traffic Analyzer has detected during normal
operations. To view System Alerts, choose Administration > Diagnostics > System Alerts.
Each alert includes a date, the time the alert occurred, and a message describing the alert. The NAM
displays up to one thousand (1,000) of the most-recent alerts. If more than 1,000 alerts have occurred,
you need to use the NAM CLI command show tech support to see all of the alerts.
If you notice an alert condition and troubleshoot and attempt to solve the condition causing the alert, you
might want to click Clear to remove the list of alerts to see if additional alerts occur.
Audit Trail
The Audit Trail option displays a listing of recent critical activities that have been recorded in an internal
syslog log file. Syslog messages can also be sent to an external log.
The following user activities are logged in the audit trail:
•
All CLI commands
•
User logins (including failed attempts)
•
Unauthorized access attempts
•
SPAN changes
•
NDE data source changes
•
Enabling and disabling data collections
•
Starting and stopping captures
•
Adding and deleting users
Each log entry will contain the following:
User Guide for the Cisco Network Analysis Module (NAM) Traffic Analyzer, 5.0
5-14
OL-22617-01
Chapter 5
User and System Administration
Diagnostics
•
User ID
•
Time stamp
•
IP address (in case of remote web access)
•
Activity description
To access the audit trail window:
Step 1
Choose Administration > Diagnostics > Audit Trail.
The Audit Trail Window displays.
The Audit Trail window provides a way to view the user access log and filter entries based on time, user,
(IP address) from or activity. The internal log files are rotated after reaching certain size limit.
Tech Support
The NAM syslog records NAM system alerts that contain event descriptions and date and time stamps,
indicating unexpected or potentially noteworthy conditions. This feature generates a potentially
extensive display of the results of various internal system troubleshooting commands and system logs.
This information is unlikely to be meaningful to the average user. It is intended to be used by the Cisco
TAC for debugging purposes. You are not expected to understand this information; instead, you should
save the information and attach it to an email message to the Cisco TAC.
Before you can view the Tech-Support page, you must enable the System Config user privilege on the
Administration > Users > Local Database page. For more information on editing user privileges, see
Editing a User, page 5-18.
Note
You can also view this information from the NAM CLI. For information on using the NAM CLI, see
Cisco Network Analysis Module Command Reference, for NME-NAM devices, the Network Analysis
Module (NME-NAM) feature module.
To view tech support:
Step 1
Choose Administration > Diagnostics > Tech Support.
After a few minutes, extensive diagnostic information is generated and displayed in the Diagnostics Tech
Support Window.
Step 2
To save the information, either select File > Save As... from the browser menu, or scroll to the bottom,
click on NAM-logs.tar.bz2, and save it to your local PC.
Downloading Core Files
To download core files from the Tech-Support page, scroll down to the Core Files section and click on
the filename.
User Guide for the Cisco Network Analysis Module (NAM) Traffic Analyzer, 5.0
OL-22617-01
5-15
Chapter 5
User and System Administration
User Administration
User Administration
The User Administration option of the Administration menu provides the following options:
•
Local Database, page 5-16
•
Establishing TACACS+ Authentication and Authorization, page 5-19
•
Configuring a TACACS+ Server to Support NAM Authentication and Authorization, page 5-20
•
Current User Sessions, page 5-22
Local Database
When you first install the NAM Traffic Analyzer, you use the NAM command-line interface (CLI) to
enable the HTTP server and establish a username and password to access the NAM for the first time.
After setting up the initial user accounts, you can create additional accounts, enabling or disabling
different levels of access independently for each user.
Table 5-8 provides information about User Privileges and describes each privilege.
Table 5-8
User Privileges
Privilege
Access Level
AccountMgmt
Enables a user to create, delete, and edit user accounts.
SystemConfig
Enables a user to edit basic NAM system parameters such as IP address,
gateway, HTTP port, and so on.
Capture
Enables a user to perform packet captures and manage capture sessions
Use the NAM Traffic Analyzer protocol decode.
AlarmConfig
Enables a user to create, delete, and edit alarms on the switch/router and
NAM.
MonitorConfig
Enables a user to create, delete, and edit the following:
MonitorView
•
Collections and reports
•
Protocol directory entries
•
Protocol groups
•
URL-based applications
Enables a user to view monitoring data and reports (granted to all users).
For additional information about creating and editing users, see Creating a New User, page 5-17 and
Editing a User, page 5-18.
Recovering Passwords
You can recover passwords by using CLI commands on the switch or router. A user with appropriate
privileges can reset the NAM CLI and passwords to the factory default state.
User Guide for the Cisco Network Analysis Module (NAM) Traffic Analyzer, 5.0
5-16
OL-22617-01
Chapter 5
User and System Administration
User Administration
For information on resetting the NAM passwords on 6500 Series NAMs, see Catalyst 6500 Series Switch
and Cisco 7600 Series Internet Router Network Analysis Module Installation and Configuration Note:
http://www.cisco.com/en/US/docs/net_mgmt/network_analysis_module_software/5.0/switch/confi
guration/guide/switchcfg.html
For information on resetting the NAM passwords on Branch Routers (NME-NAM) devices, see the
Network Analysis Module (NME-NAM) Installation and Configuration Note.
http://www.cisco.com/en/US/docs/net_mgmt/network_analysis_module_software/5.0/branch_rout
er/configuration/guide/BRincfg_50.html
For information on resetting the NAM passwords on a Cisco NAM 2200 Series Appliance, see the Cisco
NAM Appliances Installation and Configuration Note(2220)
http://www.cisco.com/en/US/docs/net_mgmt/network_analysis_module_appliance/5.0/2220/instcf
g2220.html
or the Cisco NAM Appliances Installation and Configuration Note, 5.0 (2204)
http://www.cisco.com/en/US/docs/net_mgmt/network_analysis_module_appliance/5.0/2204/instcf
g2204.html
If you have forgotten NAM Traffic Analyzer administrator password, you can recover it using one of
these methods:
•
If other users have account management permission, delete the user for whom you have forgotten
the password; then create a new one by logging in as that other user by choosing Admin > Users >
Local Database.
•
If no other local users are configured other than the user for whom you have forgotten the password,
use the NAM rmwebusers CLI command; then enable http or https to prompt for the creation of a
NAM Traffic Analyzer user.
Changing Predefined NAM User Accounts on the Switch or Router
The predefined root and guest NAM user accounts (accessible through either a switch or router session
command or a Telnet login to the NAM CLI) are static and independent of the NAM Traffic Analyzer.
You cannot change these static accounts nor can you add other CLI-based users with the NAM Traffic
Analyzer.
Creating a New User
To create a new user:
Step 1
Choose Administration > Users > Local Database.
The GUI displays the users in the local database. Checks indicate the privileges each user has for the
functions listed.
Step 2
Click Create.
The GUI displays the New User Dialog Box.
Step 3
Enter the information required to create new user and select each privilege to grant to the user. See
Table 5-8 for an explanation of user privileges. Table 5-9 describes the fields in the New User Dialog
Box.
User Guide for the Cisco Network Analysis Module (NAM) Traffic Analyzer, 5.0
OL-22617-01
5-17
Chapter 5
User and System Administration
User Administration
Table 5-9
New User Dialog Box
Field
Description
Usage Notes
Name
The account name
Enter the user’s account name.
Password
Verify Password
The account password
Enter a password that adheres to your
site security policies.
Privileges
Privileges associated with this account
Select each privilege to grant to the user.
Usernames and passwords cannot exceed 32 characters and can be alphanumeric. The following special
characters are not allowed:
'!' '@' '#' '$' '%' '^' '&' '*' '(' ')'
Step 4
•
Greater than (<)
•
Less than (>)
•
Comma (,)
•
Period (.)
•
Double quote (")
•
Single quote (')
•
Left or right parentheses
•
Other special characters (!,@,$,%,^,&,*)
Click Submit to create the user or Reset to clear the dialog of any characters you entered.
Editing a User
To edit a user’s configuration:
Step 1
Choose Administration > Users > Local Database.
The Users table displays.
Step 2
Select the username.
Step 3
Click Edit.
Step 4
In the Modify Users dialog box, change whatever information is necessary.
Click Submit to save your changes, or click Reset to clear the dialog of any characters you entered and
restore the previous settings.
Deleting a User
To delete a user:
Step 1
Choose the Administration > Users > Local Database.
The Users table displays.
User Guide for the Cisco Network Analysis Module (NAM) Traffic Analyzer, 5.0
5-18
OL-22617-01
Chapter 5
User and System Administration
User Administration
Step 2
Select the username.
Step 3
Click Delete.
Note
If you delete user accounts while users are logged in, they remain logged in and retain their privileges.
The session remains in effect until they log out. Deleting an account or changing permissions in
mid-session affects only future sessions. To force off a user who is logged in, restart the NAM.
Establishing TACACS+ Authentication and Authorization
Terminal Access Controller Access Control System (TACACS) is an authentication protocol that
provides remote access authentication, authorization, and related services such as event logging. With
TACACS, user passwords and privileges are administered in a central database instead of an individual
switch or router to provide scalability.
TACACS+ is a Cisco Systems enhancement that provides additional support for authentication and
authorization.
When a user logs into the NAM Traffic Analyzer, TACACS+ determines if the username and password
are valid and what the access privileges are.
To establish TACACS+ authentication and authorization:
Step 1
Choose Administration > Users > TACACS+. The TACACS+ Authentication and Authorization Dialog
Box displays.
Step 2
Enter or select the appropriate information in the TACACS+ Authentication and Authorization Dialog
Box (Table 5-10).
Table 5-10
TACACS+ Authentication and Authorization Dialog Box
Field
Usage Notes
Enable TACACS+ Authentication and
Authorization
Determines whether TACACS+ authentication and
authorization is enabled.
•
To enable, check the check box.
•
To disable, uncheck the check box.
Primary TACACS+ Server
Enter the IP address of the primary server.
Backup TACACS+ Server
Enter the IP address of the backup server
(optional).
Note
If the primary server does not respond
after 30 seconds, the backup server will be
contacted.
Secret Key
Enter the TACACS+ password.
Verify Secret Key
Reenter the TACACS+ password.
User Guide for the Cisco Network Analysis Module (NAM) Traffic Analyzer, 5.0
OL-22617-01
5-19
Chapter 5
User and System Administration
User Administration
Step 3
Tip
Do one of the following:
•
To save the changes, click Submit.
•
To cancel, click Reset.
If you cannot log into the NAM Traffic Analyzer with TACACS+ configured, verify that you entered the
correct TACACS+ server name and secret key.
Configuring a TACACS+ Server to Support NAM Authentication and
Authorization
In addition to enabling the TACACS+ option, you must configure your TACACS+ server so that it can
authenticate and authorize NAM Traffic Analyzer users.
Note
Configuration methods vary depending on the type of TACACS+ server you use.
Continue to the next section, Configuring a Cisco ACS TACACS+ Server.
Configuring a Cisco ACS TACACS+ Server
For Windows NT and 2000 Systems
To configure a Cisco ACS TACACS+ server:
Step 1
Note
Log into the ACS server.
The NAM Traffic Analyzer Release 5.0 supports ACS versions 5.1 and 4.2.
Step 2
Click Network Configuration.
Step 3
Click Add Entry.
Step 4
For the Network Access Server, enter the NAM hostname and IP address.
Step 5
Enter the secret key.
Note
The secret key must be the same as the one configured on the NAM.
Step 6
In the Authenticate Using field, select TACACS+.
Step 7
Click Submit/Restart.
User Guide for the Cisco Network Analysis Module (NAM) Traffic Analyzer, 5.0
5-20
OL-22617-01
Chapter 5
User and System Administration
User Administration
Adding a NAM User or User Group
To add a NAM user or user group:
Step 1
Click User Setup.
Step 2
Enter the user login name.
Step 3
Click Add/Edit.
Step 4
Enter the user data.
Step 5
Select User Setup.
Step 6
Enter a user password.
Step 7
If necessary, assign a user group.
Step 8
In the TACACS+ settings:
a.
Select Shell.
b.
Select IOS Command.
c.
Select Permit.
d.
Select Command.
e.
Enter web.
f.
In the Arguments field, enter:
permit
permit
permit
permit
permit
permit
Step 9
capture
system
collection
account
alarm
view
In Unlisted Arguments, select Deny.
Configuring a Generic TACACS+ Server
To configure a generic TACACS+ server:
Step 1
Specify the NAM IP address as a Remote Access Server.
Step 2
Configure a secret key for the TACACS+ server to communicate with the NAM.
Note
Step 3
The secret key must be the same as the one configured on the NAM.
For each user or group to be allowed access to the NAM, configure the following TACACS+ parameters:
User Guide for the Cisco Network Analysis Module (NAM) Traffic Analyzer, 5.0
OL-22617-01
5-21
Chapter 5
User and System Administration
User Administration
Parameter
Enter
service
shell
cmd
web
cmd-arg
One or more the following:
accountmgmt
system
capture
alarm
collection
view
password authentication
method—Password Authentication
Protocol (PAP)
pap
Current User Sessions
The Current User Sessions table is a record of the users who are logged into the application. The user
session times out after 30 minutes of inactivity. After a user session times out, that row is removed from
the table.
To view the current user sessions table:
Step 1
Choose Administration > Users > Current Users.
The Current User Sessions Table (Table 5-11) displays.
Table 5-11
Current User Sessions Table
Field
Description
User ID
The user ID used to log into the NAM.
From
The name of the machine the user logged in from.
Login Time
The time the user logged in.
Last Activity
The time stamp of the last user activity.
User Guide for the Cisco Network Analysis Module (NAM) Traffic Analyzer, 5.0
5-22
OL-22617-01
CH A P T E R
6
NAM Traffic Analyzer 5.0 Usage Scenarios
This chapter describes usage scenarios for the Cisco Network Analysis Module Traffic Analyzer,
Release 5.0.
This chapter contains the following sections:
Deployment
•
Deploying NAMs in the Branch, page 6-2
•
Deploying NAMs for Voice/Video applications, page 6-2
•
Deploying NAMs for WAN Optimization, page 6-2
•
Deploying Multi-NAM Consolidation, page 6-2
•
Autodiscovery Capabilities of NAM, page 6-3
•
Creating Custom Applications, page 6-3
•
Utilizing Sites to Create a Geographically Familiar Deployment, page 6-3
•
Integrating NAM with Third Party Reporting Tools, page 6-3
•
Integrating NAM with LMS, page 6-4
Monitoring
•
Understanding Traffic Patterns at the Network Layer, page 6-4
•
Understanding Traffic patterns for DiffServ-Enabled Networks, page 6-4
•
Using NAM to Evaluate Application-Level Performance Monitoring for TCP-Interactive
Applications, page 6-4
•
Using NAM to Evaluate Application-Level Performance Monitoring for UDP Realtime
Applications, page 6-5
•
Using NAM to Evaluate Potential Impact of WAN Optimization Prior to Deployment, page 6-5
Troubleshooting
•
Using NAM for Problem Isolation, page 6-5
•
Using NAM for SmartGrid Visibility, page 6-6
User Guide for the Cisco Network Analysis Module (NAM) Traffic Analyzer, 5.0
OL-22617-01
6-1
Chapter 6
NAM Traffic Analyzer 5.0 Usage Scenarios
Deployment
Deployment
Deploying NAMs in the Branch
A NAM Traffic Analyzer deployed in the branch will provide a detailed view of the traffic traversing to
and from the branch. The NAM can monitor and analyze the traffic locally, and troubleshoot issues
related to application response time, voice degradation, and overall network performance, and you will
be able to see these results by accessing the NAM web interface.
There are many advantages of this deployment. First, outside of a branch deployment, there is no ability
to view response time or monitor voice. Second, deploying the NAM in the branch also eliminates the
need to send RSPAN, ERSPAN or NetFlow across the WAN link (the result is less network traffic).
Third, you can set up some features that you could not elsewhere, such as alerts from the NAM and
packet capture. Fourth, you can more quickly troubleshoot network problems.
See related content Response Time Summary, page 3-5 and Analyze, Response Time, page 3-19.
Deploying NAMs for Voice/Video applications
The NAM Traffic Analyzer's ability to monitor voice applications provides an extra benefit. The NAM
monitors and analyzes Real-time Transport Protocol (RTP) streams and alerts you when MOS, Jitter, and
Packet Loss degrades below the threshold setting.
The NAM can be integrated with the Cisco Unified Communications Management Suite (CUCMS), so
that NAM will report the MOS, Jitter, and Packet Loss measurements to Cisco Unified Service Monitor
(SM).
See related content Analyzing Traffic, RTP Streams, page 3-38
See related content Setting Voice Signaling Thresholds, page 2-46
Deploying NAMs for WAN Optimization
If you are deploying WAN optimization and already have NAMs in the network, the WAAS from the
corporate side and branch can be sent to the NAM for analysis of the traffic before and after optimization.
NAM also provides a breakdown of the optimization regarding application response time. The response
times are broken down into client LAN and WAN segments, and server LAN and WAN segments.
If you are deploying WAN optimization using WAVE-574 or WAE-674 and you have limited real estate
in the closet, the NAM WAAS Virtual Blade can be deployed on the WAVE-574 or WAE-674 for analysis
of traffic before and after optimization on the WAAS headend and branch devices.
See related content WAN Optimization, page 3-17.
Deploying Multi-NAM Consolidation
In a multiple-NAM environment, all of the NAMs can be configured to forward NetFlow v9 data to one
of the NAMs, which can then be used as a NetFlow collector. Using a “central” NAM like this results in
consolidated reporting and problem isolation. This functionality is limited to top hosts, conversations,
and applications.
Use the IP Address and Port of the “Central NAM” on Setup > Data Export > NetFlow.
User Guide for the Cisco Network Analysis Module (NAM) Traffic Analyzer, 5.0
6-2
OL-22617-01
Chapter 6
NAM Traffic Analyzer 5.0 Usage Scenarios
Deployment
See related content Data Export, NetFlow, page 2-49.
Autodiscovery Capabilities of NAM
If you are an existing NAM 4.x user, you will not need to configure the SPAN sessions, and they will be
auto-created on the NAM (not on the device). If you are a new 5.0 user, you will need to configure SPAN
or NetFlow.
SPAN or NetFlow must be already configured on the device to forward traffic to NAM for auto creating
the data source.
See related content Data Sources, page 2-9.
Creating Custom Applications
NAM identifies applications/protocols based on the TCP/UDP port number, so if there are applications
using custom ports, the NAM can be configured to identify those applications by name instead of the
port.
See related content Applications, page 2-67.
Utilizing Sites to Create a Geographically Familiar Deployment
SPAN sessions are recommended for directing traffic to the NAM. SPAN provides the data needed for
NAM to analyze traffic for application response time, Real-time Transport Protocol, hosts,
conversations, and more. NetFlow v9 can be directed to the same NAM from other devices for analysis
on applications, hosts and conversations.
NAM 5.0 provides the ability to logically segment the network based on IP subnet, data source and
VLAN by creating sites. The recommendation is creating sites based in IP subnet. As an example, a
NAM is connected and monitoring traffic on a distribution switch which has traffic from San Jose, San
Francisco and Sacramento traversing through it. Each site is using unique IP subnets, so in NAM 5.0 the
network can be broken down into three sites (SJ, SF and Sacramento) based on the IP subnets. This
allows you to view traffic per site instead of viewing all the traffic, making it harder to identify and
troubleshoot issues.
See related content Sites, page 2-58.
See related content Site Definition Rules, page 2-59.
Integrating NAM with Third Party Reporting Tools
The NAM Traffic Analyzer Release 5.0 integrates with the CA NetQoS SuperAgent for the purpose of
aggregating Application Response Times.
The NAM Traffic Analyzer Release 5.0 also integrates with CompuWare Vantage and InfoVista 5View
for Host, Conversation, RTP, and Response Time.
See the NAM 5.0 API Programmer’s Guide for configuring NAM and exporting data from the NAM.
See related content Response Time Summary, page 3-5.
User Guide for the Cisco Network Analysis Module (NAM) Traffic Analyzer, 5.0
OL-22617-01
6-3
Chapter 6
NAM Traffic Analyzer 5.0 Usage Scenarios
Monitoring
Integrating NAM with LMS
The NAM Traffic Analyzer GUI can be placed on the LMS (LAN Management Suite) 4.0 dashboard and
accessed thru the LMS GUI. See technical documentation for LMS on http://www.cisco.com.
Monitoring
Understanding Traffic Patterns at the Network Layer
The data gathered by the NAM 5.0 Traffic Analyzer is stored in a database, allowing you to examine the
traffic trends for any application, host, conversation, and to analyze DSCP, RTP, voice signaling, and
response time.
The values for average Application Response Times can be used to create thresholds, which will trigger
alerts if those thresholds are exceeded, and you can also configure these alerts to trigger packet capture.
This allows you to be proactive in identifying and troubleshooting issues in the network.
The Historical Analysis feature also allows you to see charts over time in the past, with which you can
get a trending pattern for a host, critical application, or server that you're tracking. For example, using
the Interactive Report window on the left, you can choose to see data for the past several days, or past
several weeks. Based on that data, you can create Trigger thresholds for 20% higher. Once you have
exceeded that threshold, you will get an alert, and the NAM triggers packet capture.
See Application Response Time, page 3-22.
See Alarm Actions, page 2-36.
See Thresholds, page 2-39.
Understanding Traffic patterns for DiffServ-Enabled Networks
You can analyze the traffic at Analyze > Traffic > DSCP, and use the Interactive Report window on the
left to choose a particular DSCP group to focus on. After selecting it, you will see the charts populate.
See DSCP Groups, page 2-64.
Using NAM to Evaluate Application-Level Performance Monitoring for
TCP-Interactive Applications
Application Performance Response Time Analysis provides up to 45 metrics. You can configure
thresholds based on many of these metrics, and receive an alert when the thresholds are passed.
Thresholds should be set for critical applications or servers using Average Server Response Time, or
Average Transaction Time, or Average Network Time and Average Server Network Time. These
thresholds will help identify where the problem lies in the application performance, and show whether
the problem is a server or network issue. Depending on the alarm, you can access the NAM Traffic
Analyzer to see the applications and clients accessing the server, or to check the devices in the traffic
path monitoring device and interface utilization.
See Application Response Time, page 3-22.
See Thresholds, page 2-39.
User Guide for the Cisco Network Analysis Module (NAM) Traffic Analyzer, 5.0
6-4
OL-22617-01
Chapter 6
NAM Traffic Analyzer 5.0 Usage Scenarios
Troubleshooting
Using NAM to Evaluate Application-Level Performance Monitoring for UDP
Realtime Applications
The NAM Traffic Analyzer monitors RTP streams: When a phone call ends, the endpoints calculate the
information and send it to the Call Manager. If a NAM is along that path, it will intercept it.
The NAM monitors and analyzes RTP streams and voice calls statistics from the endpoint. The voice
calls statistics from the endpoint is used in conjunction with the RTP stream to correlate the phone
number with the IP address of the endpoint. Alerting is based on analysis of the RTP streams for MOS,
Jitter, and Packet Loss.
See Voice Signaling/RTP Stream Monitoring, page 2-2.
See Analyzing Traffic, RTP Streams, page 3-38.
See Table 2-37, Voice Monitor Setup Window.
Using NAM to Evaluate Potential Impact of WAN Optimization Prior to
Deployment
If an application that is supposed to be optimized is displayed in pass through traffic, check the WAN
acceleration device (WAE) configuration.
The NAM analyzes the traffic and identifies top talkers in Analyze > WAN Optimization > Top
Talkers, displaying applications and network links (Sites) that will benefit from deploying WAN
optimization. After the WAN optimization devices have been deployed, the WAAS can be directed to the
NAM for analysis to display the breakdown of the optimization regarding application response time. The
response times are broking down into client LAN and WAN segments, and server LAN and WAN
segments.
Troubleshooting
Using NAM for Problem Isolation
The alarm details (found in the NAM Traffic Analyzer Release 5.0 under Monitor > Overview > Alarm
Summary) provides information you can use to drill-down on the threshold that was violated. You may
also receive this alarm in e-mail (Setup > Alarms > E-mail). An example of the alarm is:
2010 SEPT 28 9:17:0:Application:Exceeded rising value(1000);packets;60653;Site(San Jose),
Application(http)
After receiving this alarm, you can access the NAM GUI to view the application in site San Jose to
determine why there was a spike. Click on Analyze > Traffic > Application; in the Interactive Report
window on the left, change Site to “San Jose,” Application to “HTTP,” and Time Range to the range when
the alert was received. This will display all the hosts using this protocol. You can see the Top hosts and
verify there are no unauthorized hosts accessing this application. You can also access Analyze > Traffic
> Host to view which conversations are chatty, and therefore causing the increase traffic for this
application.
User Guide for the Cisco Network Analysis Module (NAM) Traffic Analyzer, 5.0
OL-22617-01
6-5
Chapter 6
NAM Traffic Analyzer 5.0 Usage Scenarios
Troubleshooting
If the alarm is for an Application Response Time issue, you can access Monitor > Response Time
Summary or Analyze > Response Time > Application to drill-down on what hosts are accessing the
application. Identify the application server and view what other applications are hosted and all the clients
accessing that server.
See Monitor: Response Time Summary, page 3-5.
See Analyze: Response Time, page 3-19.
Using NAM for SmartGrid Visibility
The NAM Traffic Analyzer will not recognize the IEC 60870 protocol out of the box (this is one of the
main protocols used by power distribution companies). You will have to add a custom protocol, because
it is a specific port you will be using. When you choose Setup > Classification > Application
Configuration, you will see all hosts using that application. It will be identified as a Telnet application.
User Guide for the Cisco Network Analysis Module (NAM) Traffic Analyzer, 5.0
6-6
OL-22617-01
A P P E N D I X
A
Troubleshooting
This appendix addresses some common issues you might encounter while using NAM Traffic Analyzer
5.0.
It contains the following sections:
•
General NAM Issues, page A-1
•
Error Messages, page A-2
•
Packet Drops, page A-2
•
NAM Not Responding, page A-2
•
NAM Behavior, page A-3
•
WAAS Troubleshooting, page A-3
General NAM Issues
Q. What information should I collect and what else should I do when the NAM is not responding?
A. Determine the answers to the following questions and gather the following information:
•
Does session from the switch/router CLI work?
•
Does ping over EOBC (127 subnet) work?
•
Does ping to the management IP address work?
•
Collect output of show tech-support command from both the NAM and the switch or router.
•
Collect core files.
•
Check if NAM is seated correctly in chassis
•
Reset NAM
•
Reset into maintenance image or helper
•
Clear the configuration
•
Reinstall the application image (possibly with the repartition option --install)
User Guide for the Cisco Network Analysis Module Traffic Analyzer, 4.1
OL-19530-02
A-1
Appendix A
Troubleshooting
Error Messages
Error Messages
Q. I’m waiting for the graphical data to populate on a dashboard. What does this red error “Request
Error -- Please Try Again” mean?
A. This means an internal error has occurred, or the login session may have timed out.
Q. I’m waiting for the graphical data to populate on a dashboard. What does this red error “Query
resulted in no data” mean?
A. The NAM does not have any data for the specified time frame and specified filter. Go to the
Interactive Report (on the left side of the screen) and click the Filter button to check the filter
settings and data sources to make sure the NAM is getting data.
Q. What does the message “Client or NAM time is incorrect” mean?
A. The browser or client time and the NAM time must be synched to avoid this error.
Packet Drops
Q. How can I find out using the CLI if packets are being dropped?
A. The following CLI command shows packet drops at different layers of the NAM system at 5 minute
intervals and up to the last 24 hours:
[email protected]# show pkt-drop-counters Hour-0
Start time of the hour: 2010-11-05 13:00 PDT
Time
hardware pkts droped
FM pkts dropped
13:05
3548
0
13:10
3354
0
13:15
2843
0
13:20
2629
0
13:25
3592
0
13:30
3298
0
13:35
1823
0
13:40
2549
0
00:00
0
0
00:00
0
0
00:00
0
0
00:00
0
0
ART pkts dropped
0
0
0
0
0
0
0
0
0
0
0
0
NAM Not Responding
Q. Why is my NAM Blade not responding?
A. Do the following:
•
Check the NAM IP configuration (using the CLI command show ip)
•
Check VLAN configuration of management port on Sup:
analysis module <slot> management-port access-vlan <#>
•
Does the session from the switch/router work?
User Guide for the Cisco Network Analysis Module Traffic Analyzer, 4.1
A-2
OL-19530-02
Appendix A
Troubleshooting
NAM Behavior
•
Does a ping to NAM mgmt IP address work?
•
What is the module status on Sup/router?
show modules CLI
NAM Behavior
Q. Why is the browser behaving strangely? It is displaying data for no apparent reason.
A. Clear the browser cache, close the browser, and open a new session and try again. Also, make sure
you are using a browser that is supported with NAM 5.0 (see the NAM Traffic Analyzer 5.0 Release
Notes).
Q. Why is the NAM performance lower than expected?
A. Disk capture will reduce the NAM performance considerably. It is due to the disk input/output
speed. You will see a warning on the screen in the top right corner.
WAAS Troubleshooting
Q. Why is no WAAS data seen on the Monitor screens?
A. Perform the following steps:
•
Use the NAM GUI to verify that the Monitored Servers list is configured with the correct server IP
addresses.
•
Use the NAM GUI to verify that WAAS data sources have data collection enabled for applicable
segments.
•
Use the WAAS CLI “show statistics flow filters” to verify that the servers have active traffic flows
that are optimized and monitored.
•
Use the WAAS CLI “show statistics flow mon tcpstat” to verify that WAAS Flow Agent exports
flow data to the correct NAM IP address.
Q. The WAAS is not sending data to the NAM, and the reports are not showing any values.
A. The WAAS will not send data unless filtering is enabled on the NAM. Enable filtering at Setup >
Data Sources > WAAS > Monitored Servers, and check the “Filter Response Time for all Data
Sources by Monitored Servers” check box.
User Guide for the Cisco Network Analysis Module Traffic Analyzer, 4.1
OL-19530-02
A-3
Appendix A
Troubleshooting
WAAS Troubleshooting
User Guide for the Cisco Network Analysis Module Traffic Analyzer, 4.1
A-4
OL-19530-02
A P P E N D I X
B
Supported MIB Objects
Supported MIBs
Table B-1 lists the MIB objects supported by the supervisor engine and the NAM.
Table B-1
Supervisor Engine Module and NAM RMON Support
Module
Object Identifier (OID) and Description
Source
Supervisor
Engine
...mib-2(1).rmon(16).statistics(1).etherStatsTable(1)
...mib-2(1).rmon(16).statistics(1).tokenRingMLStats
Table(2)...mib-2(1).rmon(16).statistics(1).tokenRing
PStatsTable(3)
RFC 2819 (RMON-MIB)
RFC 1513
(TOKEN-RING-RMON MIB)
RFC 1513
(TOKEN-RING-RMON MIB)
Counters for packets, octets, broadcasts, errors, etc.
RFC 2819 (RMON-MIB)
RFC 2819 (RMON-MIB)
RFC 1513
(TOKEN-RING-RMON MIB)
RFC 1513
Periodically samples and saves statistics group counters (TOKEN-RING-RMON MIB)
for later retrieval.
Supervisor
Engine
...mib-2(1).rmon(16).history(2).historyControlTable(1)
...mib-2(1).rmon(16).history(2).etherHistoryTable(2)
...mib-2(1).rmon(16).history(2).tokenRingMLHistory
Table(3)...mib-2(1).rmon(16).history(2).tokenRingPHis
toryTable(4)
Supervisor
Engine
...mib-2(1).rmon(16).alarm(3)
Supervisor
Engine
RFC 2819 (RMON-MIB)
A threshold that can be set on critical RMON variables
for network management.
...mib-2(1).rmon(16).event(9)
RFC 2819 (RMON-MIB)
Generates SNMP traps when an Alarms group threshold
is exceeded and logs the events.
User Guide for the Cisco Network Analysis Module Traffic Analyzer, 5.0
OL-22617-01
B-1
Appendix B
Supported MIB Objects
Supported MIBs
Table B-1
Supervisor Engine Module and NAM RMON Support (continued)
Module
Object Identifier (OID) and Description
Source
Supervisor
Engine
...mib-2(1).rmon(16).tokenRing(10).ringStation
ControlTable(1)
...mib-2(1).rmon(16).tokenRing(10).ringStation
Table(2)
...mib-2(1).rmon(16).tokenRing(10).ringStation
OrderTable(3)
...mib-2(1).rmon(16).tokenRing(10).ringStationConfig
ControlTable(4)
...mib-2(1).rmon(16).tokenRing(10).ringStationConfig
Table(5)
...mib-2(1).rmon(16).tokenRing(10).sourceRouting
StatsTable(6)
RFC 1513
(TOKEN-RING-RMON MIB)
RFC 1513
(TOKEN-RING-RMON MIB)
RFC 1513
(TOKEN-RING-RMON MIB)
RFC 1513
(TOKEN-RING-RMON MIB)
RFC 1513
(TOKEN-RING-RMON MIB)
RFC 1513
(TOKEN-RING-RMON MIB)
Aggregates detailed Token Ring statistics.
Supervisor
Engine
...mib-2(1).rmon(16).probeConfig(19).
RFC 2021 (RMON2-MIB)
Supervisor
Engine
...ciscoMgmt(9).ciscoNbarProtocolDiscoveryMIB(244) CISCO-NBAR-PROTOCOL-DIS
COVER-MIB
.cnpdMIBObjects(1).cnpdStatus(1)
Displays a list of agent capabilities and configurations.
Indicates per interface whether nbar protocol discovery
is enabled.
Supervisor
Engine
...ciscoMgmt(9).ciscoNbarProtocolDiscoveryMIB
(244).cnpdMIBObjects(1).cnpdAllStats(2)
CISCO-NBAR-PROTOCOL-DIS
COVER-MIB
Statistics per interface for nbar protocol discovery.
Supervisor
Engine
...ciscoMgmt(9).ciscoProcessMIB(109).ciscoProcessM CISCO-PROCESS-MIB
IBObjects(1).cpmCPU(1).cpmCPUTotalTable(10.cpm
CPUTotalEntry(1)
CPU Statistics
Supervisor
Engine
...cisco(9).workgroup(5).ciscoStackMib(1).systemGrp
(1).sysTrafficPeak(19)
CISCO-STACK-MIB
Peak traffic meter value
Supervisor
Engine
..cisco(9).workgroup(5).ciscoStackMib(1).systemGrp
(1).sysTrafficPeakTime(20)
CISCO-STACK-MIB
Time since last peak traffic meter value occurred.
Supervisor
Engine
...ciscoMgmt(9).ciscoMemoryPoolMIB(48).cisco
MemoryPoolEntry(1)
CISCO-MEMORY-POOLMIB
Free and Largest block of contiguous memory
Supervisor
Engine
...mgmt(20.mib-2(1).entityMIB(47).entityMIBObjects( ENTITY-MIB
1).entityPhysical(1)
Text description of physical entity.
Supervisor
Engine
...ciscoMgmt(9).ciscoEnvMonMib(13).ciscoEnvMon
Objects(10)
CISCO-ENVMON-MIB
Power, Temperature and Fan Status
User Guide for the Cisco Network Analysis Module Traffic Analyzer, 5.0
B-2
OL-22617-01
Appendix B
Supported MIB Objects
Supported MIBs
Table B-1
Module
Supervisor
Engine
Supervisor Engine Module and NAM RMON Support (continued)
Object Identifier (OID) and Description
Source
...cisco(9).workgroup(5).ciscoStackMIB(1).ciscoStatck CISCO-STACK-MIB
MIBConformance(31).ciscoStaticMIBGroups(20.
chassisGroup(3)
Collection of objects providing information about the
chassis of the device.
Supervisor
Engine
...ciscoMgmt(9).ciscoCat6kCrossbarMIB(217).cisco
Cat6kXbarMIBObjects(1)
CISCO-CAT6K-CROSSBARMIB
Crossbar statistics.
Supervisor
Engine
CISCO-SWITCH-ENGINE
...ciscoMgmt(9).ciscoMIBObjects(1).cseMIBObjects
(1).cseTcamUsage(9).cseTcamUsageTable(1).cseTcam
UsageEntry(1)
Description of the resource type, total amount of TCAM
allocated for that type as well as the amount of allocated
resource that has been used up.
User Guide for the Cisco Network Analysis Module Traffic Analyzer, 5.0
OL-22617-01
B-3
Appendix B
Supported MIB Objects
Supported MIBs
User Guide for the Cisco Network Analysis Module Traffic Analyzer, 5.0
B-4
OL-22617-01
INDEX
custom display filters, setting up
A
deleting
administration (see system administration)
alarm thresholds, setting
NAM thresholds
deleting
editing
4-27
4-26
packet decode information, viewing
2-39
4-20
protocol decode information, viewing
2-48
editing
5-1
4-23
4-22
cautions
2-48
regarding
switch thresholds
2-49
NAM community strings, deleting
syslog, setting up
5-12
switch string and read-write community string
matching 5-5
ART
3-24, 3-27
Audit trail
5-5
community switch strings, setting and viewing
5-14
5-5
configuring NAM Traffic Analyzer
community switch strings, setting and viewing
C
5-5
data collection, setting up
voice data, collecting
capture
error scan
data sources, setting up
4-17
maximum buffer size
4-6
Capture data
2-6
deleting a SPAN session
2-9
2-8
NetFlow, configuring on devices
NetFlow records, understanding
4-15
analyze
SPAN sources (table)
4-17
configuring
Consecutive Packets Loss threshold
external reporting
downloading to a file
4-15
capture settings, configuring
custom display filters
4-23
2-18
2-17
2-2
Console
1-13, 4-1
capture buffer
creating
2-4
VACL, configuring on WAN interfaces
4-4
4-3
capturing data
2-19
VACL, configuring on LAN VLANs
4-2
viewing
2-20
2-4
traffic directing methods (table)
capture sessions
about
2-9
creating a SPAN session
editing a SPAN session
5-8
capture files
about
2-9
traffic, directing for spanning
Capture buffer
storage
2-76
4-4
Continuous capture
2-55
4-6
creating
custom display filters
NAM traps
4-23
5-12
User Guide for the Cisco Network Analysis Module (NAM) Traffic Analyzer, 5.0
OL-22617-01
IN-1
Index
protocol
directing traffic for spanning
2-68
SPAN sessions
Custom captures
methods (table)
2-6
custom display filters, managing
4-23
deleting
4-27
editing
devices running Cisco IOS
2-20
2-21
devices supporting multi-layer switching
cache 2-21
devices supporting NDE export
4-26
setting up
2-4
NetFlow, configuring on devices
4-8
creating
2-9
2-22
devices supporting NDE v8 aggregations
4-23
devices supporting vi aggregations
NAMs in a device slot
D
2-21
2-21
2-22
NetFlow devices, managing
testing
dashboards
Alarm Summary
overview
SPAN session
3-6
1-2
Performance Overview
3-5
Response Time Summary
Traffic Analysis
2-28
creating
2-6
deleting
2-9
editing
3-5
2-8
SPAN sources (table)
3-4
2-4
VACL, configuring on LAN VLANs
data collection
VACL, configuring on WAN interfaces
setting up
voice data
Drill-Down button
2-76
data export from NAM
data export to NAM
2-17
4-17
DSCP groups, managing
2-49
setting up
1-13
data sources, setting up
2-64
2-9
deleting
E
custom display filters
4-27
DiffServ profiles
2-66, 2-70
NAM thresholds
2-48
NAM traps
protocols
2-70
2-66, 2-70
NAM thresholds
2-48
protocols
5-14
EMail alarms
system alerts, capturing
Enabling
system alerts, viewing
DiffServ profile, managing
5-14
5-13
2-69
SPAN sessions
configuration information, monitoring and
capturing 5-15
5-15
4-26
DiffServ profiles
NAM traps
2-9
diagnostics, generating
editing
custom display filters
5-13
SPAN sessions
2-38
voice monitoring
Encapsulation
2-8
2-77
2-73
creating
2-64, 2-70
Encapsulation Configuration
deleting
2-66, 2-70
ERSPAN
editing
2-18
2-66, 2-70
2-73
2-17
configuring as datasource
2-10
User Guide for the Cisco Network Analysis Module (NAM) Traffic Analyzer, 5.0
IN-2
OL-22617-01
Index
sending data directly to NAM
External reporting console
detail
2-17
IPESP
2-55
IPIP4
3-12, 3-30
2-73
2-73
IP tunnel encapsulations
F
Filtering
audit trail
IP
M
5-15
Monitored servers filters
4-14
IP and Payload Data
IP and TCP/UDP
Payload data
VLAN and IP
2-73
2-81
Monitoring
4-14
Application response times
4-14
3-27
monitoring
4-15
port traffic
4-13
Filter Response Time for all Data Sources by Monitored
Servers 2-81
traffic
1-15
1-13
monitoring data
voice
3-14
Multiple WAAS segments
G
viewing response time
3-18
GPRS (General Packet Radio Service) Tunneling
Protocol 2-73
GREIP
GTP
N
2-73
2-73
NAM
alarm thresholds
H
deleting
Hardware Assisted Capture
4-12
hardware filters
configuring
help
A-1
diagnostics, generating for technical assistance
configuration information, monitoring and
capturing 5-15
system alerts, capturing
system alerts, viewing
I
IGMP
1-15
interface data, viewing
editing
2-48
setting
2-39
community strings, working with
4-12
(see also troubleshooting)
2-48
5-15
5-14
5-14
creating
5-4
deleting
5-5
5-4
SNMP system groups, setting and viewing
system time, setting
5-3
5-5
configuring with an NTP server
5-7
synchronizing with switch or router
5-6
traps
creating
5-12
deleting
5-13
editing
5-13
setting
5-12
navigation and control elements
1-6
User Guide for the Cisco Network Analysis Module (NAM) Traffic Analyzer, 5.0
OL-22617-01
IN-3
Index
NetFlow
Refresh button
configuring on devices
Cisco IOS
Creating SPAN session
2-20
response time
2-21
multi-layer switching cache
NAMs in a device slot
NDE export
application
2-21
client
2-22
3-23
network
2-21
devices, managing
server
3-23
3-22
3-23
response time data, viewing
2-28
exporting data
3-22
client-server
2-22
NDE v8 aggregations
testing
2-7
reports
1-15
interfaces, understanding
records, understanding
server
2-19
RTP Stream Monitoring
2-19
NetFlow Data Export from NAM
NetFlow Data Export to NAM
3-25
2-2
2-49
2-4
network parameters, setting and viewing
5-2
NFS Server
S
SCCP traffic
Configuring for capture data storage
5-9
4-22
Server Response Time table, using
reports
3-25
sessions
O
SPAN
overview of NAM Traffic Analyzer
navigation and control elements
1-14, 2-3, 2-10
setting
1-6
alarm thresholds
NAM thresholds
2-39
switch thresholds
P
syslog
2-49
5-12
Packet Loss threshold
2-2
community switch strings
passwords, recovering
5-16
NAM SNMP system groups
network parameters
port traffic
monitoring
5-3
5-2
sites
1-15
defining
protocol directory
2-61
definition rules
managing
creating protocols
2-68
editing
deleting protocols
2-70
overview
editing protocols
2-69
2-59
2-63
1-2
SPAN
sessions
R
recovering passwords
5-5
1-14, 2-3, 2-10
creating
2-6
deleting
2-9
editing
5-16
2-8
spanning, directing traffic for
2-9
User Guide for the Cisco Network Analysis Module (NAM) Traffic Analyzer, 5.0
IN-4
OL-22617-01
Index
methods (table)
user privileges (table)
2-4
NetFlow, configuring on devices
Cisco IOS
users, creating new
2-20
users, deleting
2-21
multi-layer switching cache
NAMs in a device slot
NDE export
system resources, viewing
System alerts
2-21
NetFlow devices, managing
viewing
deleting
2-9
editing
5-15
5-14
T
2-8
SPAN sources (table)
2-4
TAC (Technical Assistance Center)
VACL, configuring
(see also troubleshooting)
on LAN VLANs
2-18
on WAN interfaces
SPAN states
5-2
5-14
capturing
SPAN session
2-6
A-1
TACACS+
2-17
authentication and authorization, establishing
2-6
server, configuring to support NAM
switch
secret key, requirements for
alarm thresholds
setting
(see also troubleshooting)
2-4
5-20
5-20
syslog alarm threshold, setting up
5-14
configuration information, monitoring and
capturing 5-15
5-12
system alerts, capturing
5-1
diagnostics, generating for technical assistance
overview of system administration tasks
system alerts, viewing
5-14
testing NetFlow devices
5-1
NAM community strings, working with
5-4
traffic analysis
traffic sources
monitoring
1-13
NAM system time, setting
troubleshooting
A-1
5-5
network parameters, setting and viewing
system resources, viewing
5-2
5-15
5-14
2-28
1-13
NAM SNMP system group, setting and
viewing 5-3
switch, cannot communicate with
5-5
5-2
overview of user administration tasks
passwords, recovering
A-1
diagnostics, generating for
2-4
system administration
5-19
technical assistance, obtaining
2-49
Switch Remote SPAN
Switch SPAN
5-22
system alerts
2-28
creating
5-18
user sessions table, viewing
2-22
2-22
NDE v8 aggregations
testing
5-17
5-18
users, editing
2-21
5-16
5-16
U
5-16
predefined NAM user accounts, changing
5-17
user
TACACS+ authentication and authorization,
establishing 5-19
administration (see system administration)
TACACS+ server, configuring to support
NAM 5-20
sessions table, viewing
privileges (table)
5-1
5-16
5-22
User Guide for the Cisco Network Analysis Module (NAM) Traffic Analyzer, 5.0
OL-22617-01
IN-5
Index
V
VACL
1-14, 2-17
VLAN access control list
1-14, 2-17
VACL, configuring
on LAN VLANs
2-18
on WAN interfaces
2-17
viewing
community switch strings
DiffServ data
5-5
3-12
NAM SNMP system groups
network parameters
5-3
5-2
response time data
server
3-25
system alerts
5-14
system resources
5-2
user sessions table
voice data
5-22
3-14
Viewing audit trail
5-14
Virtual Switch Software (VSS)
2-58
VLAN access control list
VACL
1-14, 2-17
voice data
collecting
viewing
2-76
3-14
Voice signaling thresholds
2-47
VSS
see Virtual Switch Software
2-3
W
WAAS data sources
3-18
User Guide for the Cisco Network Analysis Module (NAM) Traffic Analyzer, 5.0
IN-6
OL-22617-01