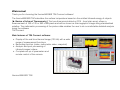
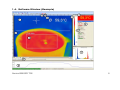
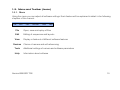
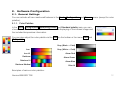
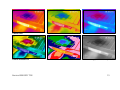
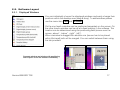
1
Software for infrared camera thermoIMAGER 160 Operators manual thermoIMAGER TIM Connect Content Content........................................................................................ 2 Welcome! .................................................................................... 4 Warranty ...................................................................................... 5 1. Getting Started ................................................................. 6 1.1. Software Installation................................................6 1.2. Choice of Camera...................................................7 1.3. Choice of Language ...............................................7 1.4. Software Window (Example)...................................8 1.5. Menu and Toolbar (Icons) ....................................10 1.5.1. Menu................................................................10 1.5.2. Toolbar (Icons) ................................................11 2. Software Configuration................................................... 12 2.1. General Settings ...................................................12 2.1.1. Color Palettes ..................................................12 2.1.2. Temperature Unit ............................................14 2.1.3. Temperature Range of Reference Bar............14 2.1.4. Displayed Frame Rate ....................................15 2.1.5. Change of Title Bar .........................................16 2.1.6. Optimization of Software.................................16 2.2. Software Layout ....................................................17 2.2.1. Displayed Windows.........................................17 2.2.2. View Bars.........................................................18 2.2.3. Information Within Image ................................18 2.2.4. Temperatures in Digital Displays ....................19 2.2.5. Layout Management .......................................20 2.2.6. Assign / Remove Layouts ...............................21 2.2.7. Further Information..........................................21 2.3. Arranging of Thermal Image.................................22 2.3.1. Mirroring of Displayed Image..........................22 2.3.2. Rotation of Displayed Image ..........................22 2.3.3. Zooming in Areas of the Displayed Image .....22 thermoIMAGER TIM 2.4. Imager Configuration............................................24 2.4.1. Calibration Files ..............................................24 2.4.2. Correction of Camera Calibration...................24 2.4.3. Emissivity, Transmissivity, Ambient Temperature....................................................25 2.4.4. Reference Temperature ..................................26 2.4.5. Changing the Optics.......................................28 2.4.6. Changing the Temperature Range.................28 2.5. Imager Interfaces..................................................29 2.5.1. General............................................................29 2.5.2. Process Interface (PIF) ...................................30 2.6. Imager Interfaces..................................................32 2.6.1. Interprocess Communication (IPC) ................32 2.6.2. Comport ..........................................................32 2.7. Start Options .........................................................33 2.7.1. Overview of Start Options ...............................33 2.7.2. Start of Multiple Software / Imager Instances 34 3. Data Capturing ...............................................................35 3.1. Open Files.............................................................35 3.2. Replay of Files ......................................................35 3.2.1. Control Panel...................................................35 3.2.2. Replay Options ...............................................36 3.3. Editing Video Sequences .....................................37 3.4. Saving Files...........................................................38 3.4.1. Setting the Recording Frame Rate .................38 3.4.2. Setting the Recording Modes.........................39 3.4.3. Temporary Recording File ..............................40 3.4.4. Saving Radiometric Video Sequences or AVI Files .................................................................41 3.4.5. Saving Image Data as Radiometric Snapshot or Text File .......................................................42 3.4.6. Saving Text File of the Temperature / Time Diagram...........................................................45 3.4.7. Location and Filename Templates of Triggered Recordings ......................................................45 3.4.8. Display of Snapshots in a Separate Window .46 3.4.9. Saving Images or Screenshots to Clipboard .46 4. Data Processing............................................................. 47 4.1. Measure Areas ......................................................47 4.2. Temperature Profile ..............................................52 4.3. Temperature Time Diagram..................................55 4.4. Histogram..............................................................58 4.5. Extended Measuring Colors .................................60 4.6. Image Subtraction.................................................61 4.7. Relative Extreme Values .......................................62 4.8. Alarms ...................................................................63 4.9. 3D Display of Thermal Image ...............................65 5. Visual Camera (TIM200 only) ......................................... 66 5.1. Enabling the Visual Camera .................................66 5.2. Monitoring Modus.................................................66 5.3. Cross-fading Modus .............................................67 6. Linescanner Mode ......................................................... 71 6.1. General Information ..............................................71 6.2. Basic Settings .......................................................72 6.2.1. Linescanner Configuration Menu....................72 6.2.2. Choosing the Layout .......................................72 6.2.3. Rotating of the Image......................................72 6.2.4. Activating the Linescanner..............................73 6.2.5. Positioning of the Line (Linescanner Sighting View) ................................................................73 6.2.6. Layout Configuration of the Sighting View Mode ...............................................................74 6.3. Data Evaluation of the Scanned Line ...................75 6.3.1. Linescannner View ..........................................75 6.3.2. Triggered Display of Lines ..............................76 6.3.3. Snapshot Configuration ..................................78 thermoIMAGER TIM 7. Further Information .........................................................79 7.1. Activating Software Messages .............................79 7.2. System Requirements ..........................................81 7.3. About Software .....................................................81 7.4. Overview Shortcuts...............................................82 Welcome! Thank you for choosing the thermoIMAGER TIM Connect software! The thermoIMAGER TIM calculates the surface temperature based on the emitted infrared energy of objects [► Basics of Infrared Thermometry]. The two-dimensional detector (FPA - focal plain array) allows a measurement of 160 x 120 or 382 x 288 pixels and will be shown as thermographic image using standardized palettes. The radiometric processing of the picture data enables the user to do a comfortable detailed analysis using the software TIM Connect. Main features of TIM Connect software: Display of the real time thermal image (120 Hz) with a wide range of measurement functions Recording function (video, radiometric video, snapshot) Analysis and post processing of infrared images/ videos Complete set up of parameters and remote control of the camera thermoIMAGER TIM Warranty All products manufactured by MICRO-EPSILON Messtechnik GmbH & Co KG are warranted against defective materials and workmanship for a period of one (1) year from the delivery date of the original purchase, provided such products have been under normal storage, use and service, and in accordance with MICRO-EPSILON Messtechnik GmbH & Co KG instruction. This warranty expires in case of inappropriate use of all delivered components. All products not manufactured by MICRO-EPSILON Messtechnik GmbH & Co KG included in systems delivered by MICRO-EPSILON Messtechnik GmbH & Co KG to the original purchaser carry the warranty, if any, of the particular supplier only and MICRO-EPSILON Messtechnik GmbH & Co KG has no responsibility whatsoever for such products. MICRO-EPSILON Messtechnik GmbH & Co KG shall not be liable for any use of the software thermoIMAGER TIM Connect including data recording. MICRO-EPSILON Messtechnik GmbH & Co KG does not carry liability for error-free operation of the software in any hardware and operating system. The warranty is not expressed for possible quality changes, errors when presenting the software, occurring defects during operation or insufficiencies in certain applications. The user is liable for any defects or data processing insufficiencies when in using the software. MICRO-EPSILON Messtechnik GmbH & Co KG has no other liability inside the scope of supply other than mentioned above. MICRO-EPSILON Messtechnik GmbH & Co KG shall not be liable for any business loss or claim for compensation, loss of the computer software, possible loss of data, additional costs for replacement software, claims of third parties or other occurring costs or failures and deficits. The MICRO-EPSILON software is protected by copyright and is not allowed to be changed or sold to third parties. Note Read the manual carefully before you start the device. The manufacturer reserves the right to change the herein described specifications in case of technical advance of the product. thermoIMAGER TIM 5 1. Getting Started 1.1. Software Installation Please install at first the software TIM Connect from the CD. The CD contains the software application, the specific calibration data of the imager as well as some sample files. These data will be installed automatically. Note Before installing the new software please uninstall earlier versions of the TIM Connect. If you want to uninstall the software from your system please use the uninstall icon in the start menu. Insert the installation CD into the according drive on your computer. If the autorun option is activated the installation wizard will start automatically. Otherwise please start setup.exe from the CD-ROM. Follow the instructions of the wizard until the installation is finished. The installation wizard will place a launch icon on the desktop and in the start menu: [Start]\Programs\MICRO-EPSILON GmbH u Co KG\TIM Connect. Now you can connect the infrared imager into an USB port (USB 2.0) of your PC. After the software has been started, you should see the live image from the camera inside a window on your PC screen. The sharpness of the image can be adjusted by turning the exterior lens ring at the camera. thermoIMAGER TIM 6 1.2. Choice of Camera In case you are using more than one TIM simultaneously (e.g. via USB hub) please select the required TIM from the list in the Devices menu. 1.3. Choice of Language In the Tools and Language menu you can choose from a variety of available languages. Note In case your language is not provided you will find a translation tool on the software CD delivered with the camera. thermoIMAGER TIM 7 1.4. Software Window (Example) thermoIMAGER TIM 8 1 IR image from the camera 2 Temperature profile: Shows the temperatures along max. 2 lines at any size and position in the image. 3 Reference bar: Shows the scaling of temperature within the color palette. 4 Temperature of measure area: Analyses the temperature according to the selected shape, e.g. average temperature of the rectangle. The value is shown inside the IR image and the control displays. 5 Control displays: Displays all temperature values in the defined measure areas like Cold Spots, Hot Spots, temperature at cursor, internal temperature and chip temperature. Alarm settings: Bar showing the defined temperature thresholds for low alarm value (blue arrow) and high alarm value (red arrow). The color of numbers within control displays changes to red (when temperature above the high alarm value) and to blue (when temperature below the low alarm value). 6 7 Histogram: Shows the statistic distribution of single temperature values. 8 Automatic / manual scaling of the palette (displayed temperature range): Man., </> (min, max), 1σ : 1 Sigma, 3σ : 3 Sigma 9 Icon for quick access to Image Subtraction function 10 Icon enabling switching between color palettes thermoIMAGER TIM 9 1.5. Menu and Toolbar (Icons) 1.5.1. Menu Using the menu you can adjust all software settings. Each feature will be explained in detail in the following chapters of this manual: File Open, save and replay of files Edit Editing of sequences and layouts View Display or fade-out of different software features Devices Choice of camera and self-referencing Tools Additional settings of camera and software parameters Help Information about software thermoIMAGER TIM 10 1.5.2. Toolbar (Icons) The most important features of the software can be activated directly via the toolbar. You can redesign the toolbar according to your preferences (see section 2.2.2). Available toolbar icons are following: Configuration Open Previous palette Next palette Save Reference bar Play Histogram Pause Stop Record Copy snapshot to clipboard Save snapshot Copy screenshot to clipboard Save screenshot Full screen thermoIMAGER TIM Temperature profile (horizontal) Temperature profile (vertical) Temperature time diagram Digital display (main measure area) Digital display (mouse cursor) Snapshot history Image subtraction Image subtraction from file Enable linescanner Linescanner view Ù Sighting view Linescanner configuration Flag Alarm 3D Chart Digital display group Visible Video Close all tools Toggle between min, mean, max IR/Visible Fusion 11 2. Software Configuration 2.1. General Settings You can activate all here mentioned features in the Tools, Configuration and Genera menu (except for color palettes). 2.1.1. Color Palettes In the Tools, Configuration, Measuring colors and Standard palette menu you can choose from a list of color palettes to achieve ideal displaying of the infrared image and the included temperature information. You can also adjust the color palette via the Icon on the toolbar or the menu View and Shift palette. Gray (Black = Cold) Iron Gray (White = Cold) Iron Hi Alarm Red Rainbow Alarm Green Rainbow Hi Alarm Blue Rainbow Medical Blue Hi Examples of various color palettes: thermoIMAGER TIM 12 Palette Iron Palette Rainbow Palette Blue Hi Palette Rainbow Hi Palette Rainbow Medical Palette Gray (Black = Cold) thermoIMAGER TIM 13 2.1.2. Temperature Unit When setting the Temperature unit you can choose between Celsius (°C) and Fahrenheit (°F). 2.1.3. Temperature Range of Reference Bar Via Min. and Max. settings you can allocate colors to temperature values within the reference bar . These are the following options: Manual The upper and the lower border can be determined individually. </> The software continuously defines the upper and the lower border based on the hottest and coldest pixel in the image. 1σ The mean value of all pixels in the image will be continuously calculated. Based on the mean value one standard deviation (1 sigma) sets the limits of reference bar. 3σ The mean value of all pixels in the image will be continuously calculated. Based on the mean value three standard deviations (3 sigma) set the limits of reference bar. thermoIMAGER TIM 14 2.1.4. Displayed Frame Rate The option Reduce displayed frames defines what frame rate is used to display the image. Typically, the specification is in Hertz (Hz, images per second). The maximum frame rate of the imager is 120 Hz. The camera supplies the software all images all the time. Reducing frame rate means that some images will not be considered. The specified algorithm defines which images will be displayed or not: Off The displayed frame rate will be 120 Hz. Skipping The remaining images will be skipped by the defined frame rate, which means at 10 Hz that every 10th image will be displayed. Average The images will be averaged by the defined frame rate, which means at 10 Hz that 10 images result in one averaged image. Minimum E.g. at 10 Hz 10 single images compose one image where only lowest value pixels will be considered. Maximum Ext. Averaging E.g. at 10 Hz 10 single images compose one image where only highest value pixels will be considered. The images will be averaged by the defined frame rate as well as the averaging time, which means at 10 Hz and 50 % of frame time that just 50 % of 10 images (thus 5 images) will compose a new averaged image. thermoIMAGER TIM 15 Note A reduced frame rate means a less loaded computer in terms of data processing. Therefore, please adjust the displayed frame rate according to your application as well as to the performance of your computer. 2.1.5. Change of Title Bar The Application title bar option enables the individual setting of title bar. The setting Default displays the standard software name „Optris TIM Connect“. Using the setting User defined you can specify an individual name. The option Instance name is important if starting several cameras and software on one computer. The option Revision name is disabling the display of software version in the title bar. 2.1.6. Optimization of Software The display of the thermal image in the main window of the software can be adjusted according to the performance of the computer. Using a slow computer it is recommended to choose the option Performance and to deactivate all other options (display will be enlarged from 160 x 120 pixels to only 320 x 240 pixels). Choosing the option Quality and High-speed temperature calculation the display will be enlarged from 160 x 120 pixels to 640 x 480 pixels. If Keep aspect ratio is selected the aspect ratio will be maintained. The option Prevent screensaver is suppressing the screensaver functionality of your computer. thermoIMAGER TIM 16 2.2. Software Layout 2.2.1. Displayed Windows You can individually choose the displayed windows and easily change their positions within the desktop area (drag & drop). To add windows please use the menu item View and Windows. On the one hand a window can be positioned separately on the screen. On the other hand a window can be set at a fixed position in the software. The location can be determined using the positioning field (mouse over the arrows „above“, „below“, „right“, „left“). When a window is dragged into another one (mouse has to be placed within title head) both will be merged. You can switch between them using the tab provided. Separate window and window with positioning field to place it into the software individually. thermoIMAGER TIM 17 2.2.2. View Bars For individual display of software you can show or hide single bars in the software window. There is the possibility to Show all bars or Hide all bars by one click. Note All icons shown on the toolbar can be individually selected via the option Customize tool bar… (Please see also 1.5.2). 2.2.3. Information Within Image Using the menu View and Image Information you can decide, which information you would like to see inside the infrared image window. Via Reference bar you can set the position of the temperature scale within the infrared image window. thermoIMAGER TIM 18 The menu item Use contrast color can be used for highlighting particular information within the IR image. Display of thermal image without and with contrast colors 2.2.4. Temperatures in Digital Displays The menu option View and Digital display group temperatures allows the user to define which temperature control displays will be shown in the application window Temperatures (see section 2.2.1). The shown pre-defined values can also be displayed in the temperature time diagram (see section 4.3). Furthermore, the alarm configuration can be based on these temperatures (see section 4.8) thermoIMAGER TIM 19 2.2.5. Layout Management In the menu item View and Layouts you can manage pre-designed or your own image layouts. If you want to use an alternative layout you must activate it under Load layout. You can save your own layouts with user-defined names. Note Before you click Save layout you must add new layout name into the field provided. thermoIMAGER TIM 20 2.2.6. Assign / Remove Layouts In the menu item Edit and Assign layout to current file you can save files with a new layout setting. Using Remove layout from current file it is possible to configure a file in a way that it has no associated layout pattern. When you play it again the layout of the previously played file will be used. Note To confirm the changes as explained above you must always save the file. Please use the menu File and Save or the Icon on the toolbar. 2.2.7. Further Information Independent whether other programs are running on your PC the TIM Connect software can always be kept in the foreground. To activate this feature please use View and Always on top. All other applications will now run in the background. The thermal image of the main window can be displayed in a full screen mode. Please use the menu File and Full screen or the Icon on the toolbar to change the display size. thermoIMAGER TIM 21 2.3. Arranging of Thermal Image The thermal image within the main window of the software can be displayed in various ways using the menu Tools, Configuration and IR Image arranging. 2.3.1. Mirroring of Displayed Image Sometimes, depending on the fitting position of the TIM, it is useful to Mirror the camera image horizontally or vertically. Either the image will be adjusted by the menu mentioned above or under Tools and Mirror. 2.3.2. Rotation of Displayed Image By tagging an icon it is possible to Rotate the thermal image into a different position. Alternatively, a manual adjustment can be done by defining a User defined angle. The Resulting size of thermal image will be shown below. 2.3.3. Zooming in Areas of the Displayed Image Using the Zoom option a defined measure area within the image can be enlarged in the main window. The option can be activated by tagging Zoom enabled. The Resulting size of thermal image will be shown below. thermoIMAGER TIM 22 Rotation and zooming of a defined measure area. thermoIMAGER TIM 23 2.4. Imager Configuration 2.4.1. Calibration Files The menu Tools, Extended and Reimport calibration files enables to boot the calibration data for the currently connected TIM. 2.4.2. Correction of Camera Calibration Due to the thermal drift of bolometers all measuring IR cameras need an offset correction every few minutes. This correction is done by a motor driven motion of a blackened metal piece (so called flag) in the front of the image sensor. In this way each image element is referenced with the same temperature. During those offset calibrations thermal cameras do not measure (self referencing within 250 ms). In order to minimize this disturbing effect the offset correction can be initiated manually or by an external control pin at a suitable point of time. In the Devices and Refresh flag menu or via the Icon on the toolbar the Flag (Shutter) can be refreshed manually. The automatic correction of camera can also be set by defining minimum or maximum intervals via the menu Tools, Configuration and Device. The options Flag automatic and Min. Interval control that the flag will not be released before a given time period even though it might be required by the imager. If the Max. Interval is defined the flag will always be released after a certain time period even if not required by the imager. thermoIMAGER TIM 24 Using the option Flag operation while recording and Use flag the correction is activated even if the camera is recording. If Avoid flag is chosen the camera will not be corrected while recording. The option Use flag while skipped frames is suitable at slow data capturing (3 Hz or less) as the correction will take place automatically between two recorded images (correction time app. 250 ms). Note The manual or automatic flag functionality is not available if the flag is externally controlled, e.g. via the process interface input (please also see 2.5). Note The flag can be also used to protect the detector from potentially dangerous radiation (for example laser radiation). 2.4.3. Emissivity, Transmissivity, Ambient Temperature Using the menu Tools, Configuration and Device the Emissivity and the Transmissivity (IR-window compensation) can be set. The transmissivity is referring to the loss of radiation if an object’s surface is measured by looking through a suitable window. Knowing the Ambient temperature is inevitable for a correct temperature measurement. The ambient temperature value is delivered by the camera’s internal sensor by default. Alternatively, the value can be set as a fixed value. thermoIMAGER TIM 25 Note In case that the emissivity and / or the ambient temperature values are controlled through the Process Interface (PIF) the here defined values will be ignored (please also see 2.5). The display of actual values will be shown in the status bar. 2.4.4. Reference Temperature The detector of the thermoIMAGER has a thermal drift over the time and must be corrected by self referencing. At applications where a high measurement accuracy is needed, the thermal image can be corrected permanently by setting a reference temperature. Using the menu Tools, Configuration, Device and Reference temperature several options for manual or automatic correction can be set. If there is an area within a thermal image having a constant temperature value (e.g. black body) the Source can be defined as a Fixed value. By the option Compare with measuring area the area with constant temperatures can be determined. The known reference value can be set within Fixed value. If the temperatures are changing slightly within the defined area due to a thermal drift, the whole image will be corrected by a certain factor. Alternatively, the correction can be done by an external value (e.g. via connected pyrometer) by choosing the process interface PIF in (please also see 2.5). thermoIMAGER TIM 26 There are several Fitting modes to adjust the thermal image: Auto The software is choosing the best way of correcting the image (offset or gain). Offset This kind of correction is recommended if there are big temperature differences between the reference temperature value and the thermal image. Gain This kind of correction is recommended if there are small temperature differences between the reference temperature value and the thermal image. The option Consider flag is decreasing the influence of the camera’s correction (high temperature steps) onto the display of the reference temperature. It is recommended to activate this option. thermoIMAGER TIM 27 2.4.5. Changing the Optics Using the menu Tools, Configuration and Device the Optics depending on the camera configuration must be chosen. As a standard the camera can be delivered with a 6 °, 23 ° or 48 ° lens. If the camera is ordered with several additional lenses the currently used optics must be chosen in this menu. The option Radial Distortion Correction enables the alteration of the original shape of the image delivered by the TIM (barrel distortion correction). If the camera features a 48 ° lens the option is activated by default, the other lenses generally do not need to be corrected. 2.4.6. Changing the Temperature Range Using the menu Tools, Configuration and Device the most suitable Temperature range for the process can be set. The TIM features temperature range from -20 °C to 100 °C, from 0 °C to 250 °C and from 150 °C to 900 °C. thermoIMAGER TIM 28 2.5. Imager Interfaces 2.5.1. General The TIM is equipped with a process interface (cable with integrated electronics and terminal block), which can be programmed via the software as an Analog Input (AI) and Digital Input (DI) in order to control the camera or as an Analog Output (AO) in order to control the process. The signal level is always 0 -10 V. The process interface can be activated choosing the following options: Analog Input (AI): Analog Output (AO): Digital Input (DI): Emissivity, ambient temperature, reference temperature, flag control, triggered recording, triggered snapshots, triggered linescanner, uncommitted value Main area temperature, internal temperature, flag status, alarm, failsafe flag control, triggered recording, triggered snapshots, triggered linescanner Configuration Process Interface (PIF) thermoIMAGER TIM 29 2.5.2. Process Interface (PIF) Using Tools, Configuration and Device PIF menu you can activate the Process interface (AI) as an input. The emissivity, ambient temperature value and reference temperature can be scaled between 0 -10 V. For the other options you need to define a voltage value as a Threshold [V] – the option is activated if the value is above this threshold. If the box is tagged the threshold value below will activate the action. Using Tools, Configuration and Device PIF menu you can activate the Process interface (AO) as an output. The chosen mode will be scaled between 0 -10 V or the status of the mode will be set by thresholds. Using Tools, Configuration and Device PIF menu you can activate the Process interface (DI). The mode will be defined by the voltage signal. If Low active is untagged the mode will be initiated by the upper voltage signal. If Low active is chosen the mode will be initiated by the low voltage signal. Note You can use the process interfaces AI, AO and DI simultaneously. thermoIMAGER TIM 30 The process interface has an integrated failsafe mode. This allows to control conditions like interruption of cables, shut-down of the software etc. and to give out these conditions as an alarm. Interruption USB cable to camera Interruption data cable camera - PIF Interruption power supply PIF Shut-down of TIMConnect software Crash of TIMConnect Software 1) Standard Process interface TM-PIF-TIM √ √ √ √ - Industrial Process interface TM-PIF500V-TIM √ √ √ √ √ Failsafe output 0 V at analog output (AO) Open contact (alarm relay) Controlled conditions on camera and software 1) It is possible that some malfunctions of the software under certain circumstances cannot be detected. Therefore a 100% software crash control cannot be guaranteed. The failsafe function can be activated in the Analog Output settings. The checkbox Stop fail-safe pulse on alarm must be activated, if the analog output should be used in addition as an alarm output for a temperature alarm. In case of an alarm the alternating fail-safe pulse signal will stop and the set voltage level will be given out as constant value. (Industrial PIF only) thermoIMAGER TIM 31 2.6. Imager Interfaces 2.6.1. Interprocess Communication (IPC) Tools, Configuration, External Communication and Interprocess Communication (IPC) enables you to embed colors, temperatures or ADU values into other applications via Dynamic Link Library (DLL). 2.6.2. Comport You can activate the feature in the Tools, Configuration, External Communication and Comport menu. If selected the data values sent out by the camera can be transmitted via specified Port. The baud rate can be changed accordingly. Note You will find more details on using IPC und Comport on the CD provided. thermoIMAGER TIM 32 2.7. Start Options 2.7.1. Overview of Start Options TIM Connect software can be started with additional starting parameters using the command line. Please change the linkage in the software settings via the launch icon on the desktop. Behind the command line please add a space character and the required command parameter, e.g. "C:\Program\MICRO-EPSILON GmbH u Co KG\TIM Connect\Imager.exe" /? Starting the software via the launch icon you will get an overview of possible commands: thermoIMAGER TIM 33 Note Using the parameter Invisible the software can only be closed via the Task Manager and Processes. 2.7.2. Start of Multiple Software / Imager Instances In case you are using more than one TIM simultaneously each imager can be linked to one software instance. In order to setup a further software instance please follow the steps below: 1.) Duplicate the software icon at the desktop 2.) Change the name of the new software icon at the desktop, e.g. „Imager1“ 3.) Option: Change the instance name using the start parameter . "C:\Program\MICRO-EPSILON GmbH u Co KG\TIM Connect\Imager.exe" /Name=Imager1 (please see section 2.1.5) 4.) Start the imager using the new software instance In order to set up the last step please use the menu Tools, Configuration and Device and select in Application start the favoured imager for the respective software instance. Starting the software via the new desktop icon the linked imager will be displayed automatically. Note Each imager can be linked to a one software instance only. thermoIMAGER TIM 34 3. Data Capturing 3.1. Open Files Via the menu File and Open or the Icon on the toolbar you can open all files which can be processed by the software. Note Via the menu File and Reopen you can easily reopen captured files if the option in 3.4.6 is activated. 3.2. Replay of Files 3.2.1. Control Panel In order to replay a video sequence you can use different options in the File menu or at the control panel. The video control panel contains: Start Rewind Previous image Next image Forward thermoIMAGER TIM End Play Pause Play in loop Play selection only 35 3.2.2. Replay Options Via the menu Tools, Configuration, Playing and Playing options you can modify the play rate of recorded video sequences. This feature ensures that you can replay a video of a fast process in slow motion in order to analyze it in more details. Additionally, you can define to replay a recorded video in a loop (Infinitive loop playing) or to play selection only. To define a selection the position marks on the time bar needs to be set. All mentioned settings can also be changed via the control panels below the main window. Note The replay settings only refer to the current file shown in the main window. All definitions, however, can be saved in an individual layout assigned to the file. The software allows to change measurement parameters later on. Via the menu Tools, Configuration, Playing and While playing use this alternative values and settings you can adjust the parameters Emissivity, Ambient temperature and Transmissivity to the measurement conditions. Above that, via Disable recorded reference temperature you can deactivate reference value stored in the file. thermoIMAGER TIM 36 3.3. Editing Video Sequences The selected video can be edited by using Trim to selection and Cut out selection options in the Edit menu. A time bar tool is shown on the bottom of the image. Set the position marks on the time bar to select the beginning and end of the video sequence you want to be edited. 1 The not selected video sequence parts (bright grey) will be deleted by choosing Trim to selection option. The selected video sequence (dark grey) will remain. 2 The selected video sequence (dark grey) will be deleted by choosing Cut out selection option. thermoIMAGER TIM 37 3.4. Saving Files 3.4.1. Setting the Recording Frame Rate The camera’s maximum frame rate of 120 Hz can be reduced. Using Tools, Configuration, Recording and Recording frame rate the speed of the data capturing can be set. Typically, the specification is in Hertz (Hz, images per second). The software gets the full frame rate from camera. That is why you need to define what to do with the images which are left if choosing a reduced frame rate. There are several alternatives to set in the Mode option: Off The recording frame rate will be 120 Hz. Skipping The remaining images will be skipped by the defined frame rate, which means that at 10 Hz every 10th image will be recorded. Average The images will be averaged by the defined frame rate, which means at 10 Hz that 10 images result in one averaged image. Minimum E.g. at 10 Hz 10 single images compose one image where only lowest value pixels will be considered. Maximum E.g. at 10 Hz 10 single images compose one image where only highest value pixels will be considered. Ext. Averaging The images will be averaged by the defined frame rate as well as the averaging time, which means at 10 Hz and 200 ms that just the first 2 images out of 10 images will thermoIMAGER TIM 38 compose a new averaged image. Recording frame rate referring to 1 pixel 3.4.2. Setting the Recording Modes If desired the Recording time limit sets fixed recording time in seconds. After reaching the time limit the software stops the recording. If activating Radiometric recording the temperature value of each pixel as well as information on defined measure areas are recorded. Videos containing these data (RAVI files) allow users to do a detailed post-analysis anytime later. Moreover, new measure areas and alarms can be created in addition to recorded data when doing the analysis. thermoIMAGER TIM 39 Note If Radiometric Recording is not activated the images will be saved as standard AVI file only containing color information. A later conversion of a RAVI file into an AVI file and vice versa is not possible. Choosing the option Save after recording is stopped the images will be saved without further notice. If the option Play after recording is stopped is activated the saved images will be played automatically in the main window. Note The status of recording is displayed at the bottom notice bar. The background color will turn RED when recording. 3.4.3. Temporary Recording File Choose the directory for saving your temporarily recorded video file. Note Every new record will overwrite the previous one. thermoIMAGER TIM 40 3.4.4. Saving Radiometric Video Sequences or AVI Files Video sequences can both be saved as a radiometric file (RAVI) or as a non-radiometric file (AVI). RAVI files contain all temperature as well as measure area information. Note If Radiometric Recording (please see section 3.4.2) is not activated the images will be saved as standard AVI file only containing color information. A later conversion of a RAVI file into an AVI file and vice versa is not possible. For saving a video sequence you can use either the menu File and Record / Stop or the available Icon on the toolbar. If the video sequence includes the expected content you can save it via the menu File and Save or the Icon on the toolbar. thermoIMAGER TIM 41 3.4.5. Saving Image Data as Radiometric Snapshot or Text File Snapshots are single, radiometric images based on a video sequence, this means they are contain all temperature as well as measure area information. Thus the images can always be analyzed in detail later on. Snapshots can be captured via the menu File and Snapshot or via the Icon on the toolbar. Using the settings in the menu Tools, Configuration and Snapshots / Copy to clipboard you can define how a snapshot is copied into the clipboard or stored on the computer. Either the snapshot will be saved in the Genuine resolution corresponding to the camera’s resolution of 160 x 120 pixels (small image) or using Draw overlay information the software saves the snapshot including all information shown in the main window. The resolution of the image is based on the defined size within the main window (please see section 2.1.6). Note The option Genuine resolution (must be checked for real time snapshots) needs to be chosen if you want to save and display (snapshot history) the identical snapshot. Otherwise, the camera image taken before the snapshot will be displayed in the history. If the option Open a file dialog is tagged you will always be asked about the location, the file name and the file type before saving a snapshot. Having chosen the option Generate filename by template the snapshots location and name will be generated based on the settings in the menu Tools, Configuration and Trig. Recording / Snapshots (please see section 3.4.6). thermoIMAGER TIM 42 In the Tools, Configuration and Trig. Recording / Snapshots menu you define the File type for triggered snapshots. The option Max. triggered snapshots in history window sets the number of displayed snapshots in the separate window Snapshot history (please see section 2.2.1). If Ignore last snapshot for history is activated only the latest snapshot will be displayed in the Snapshot history window if a new snapshot is captured. There are the following options to save image data: TIFF (*.tiff) Saving of image (snapshot) as radiometric picture in TIFF format. Text (Image data) (*csv) Saving of image (snapshot) as Text format to edit information in Excel. Text (Temp. profile data) (*csv) Saving of temperature profile data only as Text format to edit information in Excel. Note The JPEG and TIFF files are saved as radiometric files and can be analyzed in detail with the TIM Connect software. Furthermore, they can also be displayed in any standard program like Photoshop showing the color information within the image. thermoIMAGER TIM 43 Analysis of thermal image in Excel via *.csv file export and display of pixel data in 3D thermoIMAGER TIM 44 3.4.6. Saving Text File of the Temperature / Time Diagram Via the menu File and Saving temp/time diagram data the data of diagram can be saved in a text file (*.dat) for further analysis. 3.4.7. Location and Filename Templates of Triggered Recordings In the Tools, Configuration and Trig. Recording / Snapshots menu you can define a Prefix for filename. The software is using this prefix if saving a sequence or snapshot. The path defines the storage location of all files and can be changed here. Once recorded the file is saved under name including prefix, current date and time stamp. Note Using the option Create link in „reopen file“ list for triggered video sequences and snapshots the files can easily be reopened via the menu File and Reopen. The data capturing includes all information like measure areas and temperature displays of the main window if the option Save layout together with triggered video sequences and snapshots is tagged. thermoIMAGER TIM 45 3.4.8. Display of Snapshots in a Separate Window In the menu View, Windows and Snapshot history you can activate a window in order to display all triggered snapshots (please also see section 2.2.1). 3.4.9. Saving Images or Screenshots to Clipboard Using the File and Copy to clipboard menu or the Icon on the toolbar the image of the main window can be copied to the clipboard in order to paste it into different programs such as MS Word. Alternatively, you can also copy the whole software window (screenshot) to the clipboard using the File , Screenshot and Copy to clipboard menu. Note The whole software window can also be saved using the File, Screenshot and Save menu or the Icon on the toolbar. thermoIMAGER TIM 46 4. Data Processing 4.1. Measure Areas 4.1.1. General Settings Measure areas for temperature analysis can be defined, edited and deleted using the menu Tools, Configuration and Measure areas. Using New / Delete buttons you can create a new measure area (measure point / rectangle) or delete existing measure areas. Press Up / Down to position individual measure areas within the list. 1 measure area from the list can be appointed as the Main measure area. The temperature of the main area can be displayed in the main window or converted into an electrical signal to be transmitted via the Process Interface (PIF) By selecting Show in image measure areas can be displayed in the infrared image. Ticking the Show grippers / Show gripper labels enables you to change the position or the size of defined measure areas by using the mouse. Selecting the option Show name at location you can define the position of the name attached to particularly measure area (set the position in the drawing). thermoIMAGER TIM 47 Available measure areas (modes) are: Position (X, Y) User defined rectangle Measure point (1x1) Measure point (3x3) Measure point (5x5) Any measure area can be renamed individually in the Name field. The Mode option allows you to define the type of area as measure point or rectangle. The temperature of the main measure area can be displayed in the main window. Available value types are Minimum, Mean value or Maximum. It is also possible to use the Icon on the toolbar. thermoIMAGER TIM 48 In the Position section the exact position of the measure area within the main window can be defined. If desired the area can represent a Hot spot (spot or area with highest mean temperature in the image) or a Cold spot (spot or area with lowest mean temperature in the image). Using Center you will be moving the measure area into the middle of the main window, using Standard size the rectangle will be set in a predefined size. Using Bind to temperature profile you can assign each measure area to one of the two temperature profile (Profile 1 / Profile 2). The position of the measure area and the profile can be determined by the option Location [%]. The size ratio can be defined by the option Min. Size. Measure area assigned to a temperature profile (measure point) thermoIMAGER TIM Measure area assigned to a temperature profile (rectangle) 49 4.1.2. Excluding Hot and Cold Spot Areas Using the menu Tools, Configuration, Measure areas and Edit excluded areas of hotspots/coldspots you can exclude existing or potential hot or cold spots from data analysis. Within the user defined areas of the image the spots will not be taken into consideration. A new area can be edited via the button Add a new spot exclude area or deleted via the button Remove this spot exclude area. The excluded area can be selected from already existing user defined areas in the drop down list or can be defined using coordinates. If you select the option Show spot exclude areas in image the areas will be shown in the main window. thermoIMAGER TIM 50 4.1.3. Individual Emissivity Values of Measure Areas In case of measuring several materials different emissivity values can be set within the image. Using the menu Tools, Configuration, Measure areas and Emissivity the individual emissivity values can be defined. The display of the changing temperature values within the measure areas will remain linked to the colors of the reference bar. thermoIMAGER TIM 51 4.2. Temperature Profile Up to 2 temperature profiles which graphically reproduce the temperature development can be generated. The profiles are labeled as Profile 1 and Profile 2. The position and size of the profiles can be defined via the coordinates Begin (P1) and End (P2). Select Show in image if you want the profiles to be displayed in the infrared image in the main window. Alternatively, this setting can be made by choosing the menu View and Image information (please see section 2.2.3). The position and size of the profiles can be also defined by dragging the grippers at the end of the lines within the image of the main window. To do that the option Show grippers must be chosen. Show gripper labels display coordinate labels (start point P1 and end point P2). thermoIMAGER TIM 52 The temperature profiles can be displayed in additional windows (please see section 2.2.1). Using the options Show in horizontal diagram and Show in vertical diagram the profiles can be assigned to the horizontal and / or vertical diagram window. The option Range allows you to choose between automatic or manual adjustment of the temperature scaling within the diagram. There are two possibilities of displaying the profile Curve in the profile diagram. Using the option Assign to image the profile curve fills only the parts corresponding with the actual length of the profile in the image. Using the option Full range the profile curve fills the whole profile diagram independent from the size of the profile. The profile curve assigned to the image (Display in separate window) thermoIMAGER TIM The profile curve assigned to the full range of the diagram (Display in separate window) 53 Use Bind measure areas to profile to assign various measure areas to a temperature profile. If the position of the profile is changed all the measure areas will also be moved. The respective profile can be chosen via the option Assign measure areas to. Prefix for measure area name enables the individual labeling of measure areas. The measure area type can be defined under the Mode options. Number of measure areas to create as well as the Width [% of profile length] and Minimum height [pixels] can also be specified. Via the Measure mode you can determine the way of displaying the minimum, maximum or mean temperature in the digital display window (please see section 2.2.1). The option Delete existing measure areas of this temperature profile eliminates the defined settings of a profile. Save the settings by pressing the Create button. 3 rectangles and 3 measure points are assigned to temperature profile 1 and 2. thermoIMAGER TIM 54 4.3. Temperature Time Diagram 4.3.1. General Settings In the Tools, Configuration and Temp/Time Diagram menu you can display the temperature over time for each configured measure area as well as for predefined values (please also see 2.2.4). The Show options define if a certain temperature value is displayed or not. If the Graph is shown you can decide whether to illustrate the Name or not. If activating the option Auto range the respective graph is influencing the auto ranging of the diagram. If the option is not chosen the scaling is based on the other temperature values. In the menu Pen, the Width of the graph as well as its Color can be individually configured. A further option is to define the time scaling of the diagram at a minimum [sec.]. If activating When replaying set initial time to length of video the time scaling is adjusted to the length of the stored video sequence loaded into the software. thermoIMAGER TIM 55 In the diagram measuring settings you can define the maximum of data (Max. data count) which is displayed in the diagram. 1.000 x 10.000 results in 10.000.000 (ten millions) data values; the needed Memory will be calculated automatically. Using the option Auto (device framerate) the Recording time is calculated based on the frame rate of the camera (please also see 3.4.1). Independent from the frame rate of the camera you can individually set the number of data. If you choose the option User defined you can put into the box Diagram resolution the rate of displayed data (time interval). Via the arrows the interval can be increased or decreased. 4.3.2. Scaling of Diagram Axes 6 7 8 9 10 11 1 2 thermoIMAGER TIM 3 4 5 56 Control elements of the time axis 1 Scroll bar to choose time segment. 2 Zoom (increase) into the diagram. The temperature axis will remain. 3 Zoom (decrease) into the diagram. The temperature axis will remain. 4 Whole range: Display of whole time axis, e.g. of a stored video sequence. 5 H: Hold/ C: Continue: Any activation of the H control element will stop the further actualization of the measurement graph. The measurement itself continues in the background. To return to the current measurement graph please press the C control element. During the stopped status any parts of the diagram can be selected. With the zoom in-button + these parts can be stretched (enlarged) and with the zoom out-button – clinched (minimized). Control elements of the temperature axis 6 7 Global scaling: The temperature range of the diagram will automatically be adapted to the respective peak values. The range will remain as set during the whole measurement. Local scaling: The temperature range of the diagram will be adapted dynamically to the respective peak values. After the respective peak has left the diagram in the further process of the measurement, the range will be readapted. This option enables an optimum display of the temperature graph. 8 Scroll bar to choose temperature segment. 9 Zoom (increase) into the diagram. The time axis will remain. thermoIMAGER TIM 57 10 Zoom (decrease) into the diagram. The time axis will remain. 11 Whole range: Display of whole temperature range which is set in the camera. 4.4. Histogram The Histogram feature shows the distribution of pixel intensity values within a thermal image. The X-axis of the histogram represents the pixel intensity and the Y-axis represents the percent of color count for each pixel intensity value. In the Tools, Configuration and Histogram menu you can adjust various settings. The given Temperature range and Quantity range can be generated by the software or by the user by defining the minimum/maximum temperature value respectively minimum/maximum quantity. thermoIMAGER TIM 58 Further options are: Display current temperature If activated the red line will show the current temperature at the mouse in the graph. Display mean and sigma value: Average temperature and statistical deviation 1σ (1 Sigma) will be displayed. Use palette colors You can choose between colored or black/white presentation. Class size Number of values measured which should be affiliated to one class for common colored display. thermoIMAGER TIM 59 4.5. Extended Measuring Colors The Tools, Configuration, Measuring colors and Extended Measuring colors menus offer you the possibility to change the pixel color within the image if the temperature Range reaches predefined low and/or high temperature values. Doing this you can visualize temperature gradients. Furthermore, the display of isotherms (colored display of temperature group) is possible. Via the Threshold definition you can set two temperature values. The individual display of pixel located over (High), between (Mid) or below (Low) the thresholds can be defined by specific isotherm (Color) or by an alternative color palette (Alt. Palette). Using Alt. palette the colors correspond to the temperature borders in the reference bar option. You will see the range of the palette which was defined by the thresholds. With Ext. Alt. Palette you can individually define the start and end point of the extended alternative color palette within the overall reference bar. thermoIMAGER TIM 60 4.6. Image Subtraction Once you have activated the feature by using Image subtraction in the Devices menu or via the Icon on the toolbar, an image is saved in the background and a temperature difference is calculated and displayed for all the following images. Image subtraction is not activated. The current averaged temperature of the measure area is displayed in the right top corner. After activating the image subtraction function the current temperature difference compared to the previous image is displayed. Alternatively, you can load a previously saved radiometric image (.jpg or .tiff) using Image subtraction from file in the Devices menu or via the Icon on the toolbar in order to use it as a template for the image subtraction. thermoIMAGER TIM 61 4.7. Relative Extreme Values Within the Tools, Configuration and Extended measurement menu it is possible to exclude pixel within the thermal image from data analysis. Using Ignore pixels with temperatures a temperature can be set as lowest (below) or highest (above) value. In case of analyzing an image using measure areas (For measure areas) the calculation of e.g. the mean value is not taking values below or above the set limits into account. For hot/cold spots localization determines that all pixels with the defined values are excluded from search. For </> temperature ranging means that all pixels with the respective temperature do not influence e.g. the automatic scaling of temperature-time-diagram. thermoIMAGER TIM 62 4.8. Alarms In the Tools, Configuration and Alarms menu you can define an alarm for each configured measure area as well as for the predefined values (please also see 2.2.4). The alarm values can be displayed as figures in the digital display or in a graphical way as a bar. For the latter you need to activate the option Show Graph Bar. Regarding the bar you can define via Display ranges the Min. and Max. value (temperature borders). With Alarms the Low and High thresholds can be set which finally defines the displayed color. If the high alarm value is reached or exceeded the color of bar changes to red. If the measured temperature reaches or goes below the lower alarm value the color of bar changes to blue. Temperatures in between the defined thresholds are displayed green. Note If the alarm value is reached the digit/bar color will change from green to red (high alarm) or blue (low alarm). thermoIMAGER TIM 63 If a temperature value shall be used as alarm you need to tag the Alarm option. If active, the alarm can also be put out via the Process Interface (PIF) using the Alarm to PIF option. Note If activating the alarm a red alarm button on the toolbar appears. You can deactivate the visual and acoustic alarm by clicking on the alarm button. The alarm will stay deactivate until the alarm value is reached again. In the Alarm configuration window you can set an audible alarm. In the Interval [sec] input box you can specify the time interval the sound appears. Via the path to sound file you can browse an individual *.wav file The acoustic alarm signalization can be repeated in defined intervals setting the Interval [sec]. Using the option Recording on alarm you can specify a Delay [sec]. The recording starts after the delay time is over. In the Duration [sec] box the recording time of the video sequence can be set. thermoIMAGER TIM 64 Furthermore, a recording can be stopped via Abort recording if alarm condition drops out. If this option is not chosen the recording will be finished based on the time in the duration box. With the Snapshot on alarm option you can set a Delay [sec] time before an alarm will trigger the storage of an image. 4.9. 3D Display of Thermal Image Thermal images can be displayed in real time as 3 dimensional images. The 3D chart is displayed in a separate window. To add the software window please use the menu item View and Windows or the Icon on the toolbar thermoIMAGER TIM 65 5. Visual Camera (TIM200 only) 5.1. Enabling the Visual Camera The TIM200 thermal imager features a visual camera. With the help of BI-SPECTRAL technology, the visual image (VIS) can be combined with a thermal image (IR). Both can be finally captured time synchronously. The visual camera can be enabled in the Tools, Configuration and General menu via the option „Use visible camera“. The menu Tools, Configuration and Device displays the Video formats depending on the current imager’s configuration. The thermal image (160 x 120 pixels) will be shown with 96 images per second (96 Hz), the visual image (640 x 480 pixels) with 32 Hz. 5.2. Monitoring Modus The monitoring modus is used to have an easy orientation at the point of measurement. In this modus the visual image is displayed in a separate window. To add the separate software window please use the menu item View and Windows or the Icon on the toolbar. thermoIMAGER TIM 66 Note The rectangle within the visual image shows the area covered by the thermal image. In order to cover a big area the wide-angle lens is used, to cover a smaller area the telephoto lens. In the View, Image Information and IR rectangle menu it is possible to hide the displayed rectangle. 5.3. Cross-fading Modus 5.3.1. General The cross-fading modus is used in order to highlight critical temperatures at the point of measurement. In this modus the thermal image is faded into the visual image. The cross-fading modus can be enabled in the Tools, Configuration and General menu via the option IR/Visible fusion. Alternatively, you can use the menu item View and IR/Visible fusion or the Icon on the toolbar. Note The area covered by the thermal image within the visual image is limited by a rectangle. In order to hide the frame of the rectangle use the View, Image Information and IR rectangle menu. thermoIMAGER TIM 67 5.3.2. Transparency of Thermal Image The thermal image can smoothly be faded into the visual image (0 … 100 %). To set the transparency value please use the Tools, Configuration, Measuring colors menu and Standard palette / Transparency [%]. 0% 50 % 100 % The thermal image is fully faded into the visual image. The thermal image is partly (50 %) faded into the visual image. Using this setting the ideal relation of both images can be defined (please see section 5.3.3). The thermal image is fully transparent and will not be shown in the visual image. Cross-fading of thermal image and visual image by 0 % setting thermoIMAGER TIM Cross-fading of thermal image and visual image by 50 % setting Cross-fading of thermal image and visual image by 100 % setting 68 5.3.3. Moving the Thermal within the Visual Image Due to the different optical axis of visual and thermal channel the relation of both images needs to be optimized. If moving the cursor to the edges of the rectangle‘s frame the grippers can be used to adjust the size of thermal image or to move the image completely (hold STRG synchronously). Adjustment of thermal image by dragging to the top right Adjustment of thermal image by dragging to the top Ideal adjustment of thermal image to the visual image Note The ideal relation of both images can be set easily by fading the thermal image into the visual image by 50 % (please see section 5.3.2). thermoIMAGER TIM 69 5.3.4. Cross-fading of Defined Temperatures The cross-fading modus can be combined with the Extended Measuring colors option (e.g. for isothermal display of temperatures, also see section 4.5). To set the level of fading this option into the visual image use the Tools, Configuration, Measuring colors and Extended Measuring colors / Transparency [%] menus: 0% 50 % The set option is fully faded into the visual image. The set option is partly (50 %) faded into the visual image. The set option is fully transparent and will not be shown in the visual 100 % image. Isothermal cross-fading by 50 % setting thermoIMAGER TIM Isothermal cross-fading by 0 % setting 70 6. Linescanner Mode 6.1. General Information The TIM Connect software comes with a linescanner function. The linescanner mode is generally used for continuous processes with moving objects under test, such as measurement of rotary kilns or measurement of great lots at conveyor belts (batch process). Overview of the advantages: 1 2 3 4 5 Simple monitoring of process with limited optical access Indirect visualization of heat distribution within ovens via camera installation at the oven exit Extension of number of pixel from 160 pixel up to 200 pixel through use of picture diagonal 120 Hz data recording of unlimited lines which-in turn can produce thermal images of any resolution 60 ° FOV as a line for detailed process analysis such as at wide conveyor belts thermoIMAGER TIM 71 6.2. Basic Settings 6.2.1. Linescanner Configuration Menu All the settings related to the linescanner mode can be done through the Linescanner configuration menu. You will find the menu under Tools, Linescanner mode and Linescanner settings or as an Icon on the tool bar. 6.2.2. Choosing the Layout Before you configure the Linescanner mode a suitable layout (e. g. alignment of application windows) should be chosen or created. You will find more details in chapter 2.2. 6.2.3. Rotating of the Image For some application is it of advantage to increase the number of pixels per line from 160 to 200 by changing the view angle. To do so go to Rotate menu (see chapter 2.3.2) According to the chosen angle the camera has to be mounted under defined angle, too. thermoIMAGER TIM 72 6.2.4. Activating the Linescanner In order to configure the Linescanner it is necessary to activate the Linescanner mode under Tools, Linescanner mode and Enable Linescanner or using the Icon on the tool bar. Note There are two view options available under Linescanner mode. Linescanner sighting view is showing the position of the line and self-trigger area within the infrared image taken by the camera. Linescanner view delivers the resulting infrared image based on temperature readings for selected lines. 6.2.5. Positioning of the Line (Linescanner Sighting View) The pre-defined position of the line can be seen in the Linescanner sighting view. To access the view go to Tools, Linescanner mode and Linescanner sighting view or use the Icon provided. Note This icon enables to switch between Linescanner sighting view and Linescanner view. To define the position of the line within the infrared image go to Linescanner configuration application window (see 6.2.1) in the Source menu. In the Lines taken from source section using First row and Last row field you can specify how many lines are to be considered during the measurement. Number 1 stands for the first line from the top in the infrared image. If more than one line should be taken from the source the Direction menu enables to choose the direction in which they will be measured and consequently displayed in Linescanner sighting view mode. You can choose thermoIMAGER TIM 73 from 4 different direction options provided (see below image X scan top-down (rows) and scan bottom-up (rows) and image Y scan left to right (columns) and scan right to left (columns). 6.2.6. Layout Configuration of the Sighting View Mode The displayed linescanner sighting views visualize the 4 possibilites how to capture and finally represent multiple lines in the linescanner view You can make further modifications to the Sighting view mode using Extended menu. If you go to Sighting view you can define following modifications: Show source scanning lines, show self triggering area or Hide all tool windows. Alternative temperature range for sighting view option enables switching to temperature range different from the one used for the measurement. It is sometimes helpful to configure the linescanner when process is stopped using one temperature range where as different temperature range is defined to examine running process. thermoIMAGER TIM 74 6.3. Data Evaluation of the Scanned Line 6.3.1. Linescannner View In the linescanner view readings will displayed as an infrared image. To activate this view mode you can use the icon provided. Note This icon enables to switch between Linescanner sighting view and Linescanner view. Presentation of the scanned lines can be further defined in Linescanner configuration application window (see 6.2.1) under Presentation. Direction option defines in which direction the scanned lines will be displayed. Scanned lines can be displayed as Top-down, Bottom-up, Left to right or Right to left. Presentation of scanned lines in the Linescanner view: Top-down, Bottom-up, Left to right and Right to left. In lines you can enter how many lines will be displayed in the Linescanner view. Number of lines will also define after how many lines the infrared image will be reloaded (Linescan). History [sec] input field determines the time frame the scanned lines s based on the duration of the process cycle observed. If you tick the Auto sync box the value will be provided thermoIMAGER TIM 75 automatically using an external trigger input (see 6.3.2). In Resulting linerate (Hz) field calculated frame rate of each line will appear automatically. Keep aspect ratio option will adjust width of each line so that all lines will appear within the infrared image. 6.3.2. Triggered Display of Lines Triggering signal can be used to control how the scanned lines will be arranged within the Linescanner view. In the General menu under Linescanner configuration (see 6.2.1) there are two options provided. Continuous mode will apply predefined values to display the scanned lines. No triggering signal will be used to control the linescanner presentation. External triggered option enables using an external triggering signal to control arranging of the scanned lines. Number of lines being reloaded after this signal is defined under Lines und History [sec] (see 6.3.1). Further settings can be specified: In Flag operation if you activate Avoid during scan before auto-snapshots refreshing of flag will not be executed during the linescan (see also 2.4.2). thermoIMAGER TIM 76 If activated Avoid re-triggering during scan will not allow to run a new linescan cycle while a previous cycle trigger by recent signal is not finished. Note For external triggering it is necessary to do modifications of the standard configuration on the Process Interface (PIF). You will find more details in the chapter 2.5. Using the Self triggered option it is possible to use a triggering signal provided by software to control arranging of the scanned lines. Number of lines being reloaded after this signal is defined under Lines und History [sec] (see 6.3.1). Further modifications can be carried out: First of all Trigger area within the infrared image needs to be specified. In Left, Right, Top and Bottom position of particular corner needs to be selected. Switch to Linescanner sighting view mode to see the visualization of the triggered area for your reference. thermoIMAGER TIM 77 Within the trigger area Trigger thresholds temperatures can be set to trigger the linescan cycle. Holdoff time [s] determines time frame within new signal should be neglected (e. g. if a signal from the heat source in the background is triggered). Under Flag operation and Avoid during scan can be set that refreshing of flag will not be executed during the linescan (see also 2.4.2). Force after scan will execute the flag once given number of scanned lines is provided. 6.3.3. Snapshot Configuration To document the measurement results a complete linescan can be saved as snapshot. You will find the Auto snapshots settings options in the Linescanner configuration (see 6.2.1). Using Auto snapshots and Do snapshots any… you can specify after how many linescans a snapshot should be captured and saved. Do snapshots with complete linescans only will not save a snapshot of a linescan that has been interrupted. thermoIMAGER TIM 78 7. Further Information 7.1. Activating Software Messages At some point a warning message will appear when performing an action that would cause changes to software settings. To prevent unintended changes you can activate or deactivate these messages by using Tools, Extended and Options. Note If a message appears you can disable the window by choosing „Never ask me again“. Using the menu Options you can activate the appearance of the window again. thermoIMAGER TIM 79 Important options are: Warning if unsaved data exists Ask for keeping measuring objects… Ask for stopping triggered recordings… thermoIMAGER TIM If activated a reminder will appear to warn you on unsaved data or setups before shutting down the software You can choose to maintain already created measure areas and temperature profile lines, if you rotate or zoom the displayed image. By rotating or zooming the measure areas and temperature profile lines will not be related to the old position in the image anymore. They can be kept, however, if resetting the image. Opening the configuration dialog you will be asked whether to close a triggered data capturing or not. The message intends to prevent changing trigger settings by accident. 80 7.2. System Requirements Minimum system requirements: Windows XP (Service Pack 3) USB 2.0-interface Hard disc with at least 30 MByte free space At least 256 MByte RAM CD-ROM-drive Recommended system requirements: Windows 7 At least 2 GB hard disk storage for IR videos At least 2 GB RAM 7.3. About Software In the Help and About submenu you will find the version name of TIM Connect software you are currently running. thermoIMAGER TIM 81 7.4. Overview Shortcuts F1 Alt+F1 Snapshot Copy snapshot to clipboard F2 Record F3 Stop Alt+F4 Exit F5 Refresh flag F6 Save screenshot Alt+F6 F10 Copy screenshot to clipboard Acknowledge alarm thermoIMAGER TIM 82 Alt+P Ctrl+Alt+P Alt+Enter Next palette Previous palette Full screen Alt+S Image subtraction Alt+H Horizontal mirror Alt+V Vertical mirror Ctrl+Alt+S Image subtraction from file Ctrl+L Line scanner sighting view Ctrl+Alt+L Enable line scanner thermoIMAGER TIM 83 MICRO-EPSILON MESSTECHNIK GmbH & Co. KG Königbacher Str. 15 · 94496 Ortenburg / Germany Tel. +49 (0) 8542 / 168-0 · Fax +49 (0) 8542 / 168-90 [email protected] · www.micro-epsilon.com X9751243-B021053HDR *X9751243-B02*