1
System Identification Toolbox™ 7
User’s Guide
Lennart Ljung
How to Contact The MathWorks
Web
Newsgroup
www.mathworks.com/contact_TS.html Technical Support
www.mathworks.com
comp.soft-sys.matlab
[email protected]
[email protected]
[email protected]
[email protected]
[email protected]
Product enhancement suggestions
Bug reports
Documentation error reports
Order status, license renewals, passcodes
Sales, pricing, and general information
508-647-7000 (Phone)
508-647-7001 (Fax)
The MathWorks, Inc.
3 Apple Hill Drive
Natick, MA 01760-2098
For contact information about worldwide offices, see the MathWorks Web site.
System Identification Toolbox™ User’s Guide
© COPYRIGHT 1988–2008 by The MathWorks, Inc.
The software described in this document is furnished under a license agreement. The software may be used
or copied only under the terms of the license agreement. No part of this manual may be photocopied or
reproduced in any form without prior written consent from The MathWorks, Inc.
FEDERAL ACQUISITION: This provision applies to all acquisitions of the Program and Documentation
by, for, or through the federal government of the United States. By accepting delivery of the Program
or Documentation, the government hereby agrees that this software or documentation qualifies as
commercial computer software or commercial computer software documentation as such terms are used
or defined in FAR 12.212, DFARS Part 227.72, and DFARS 252.227-7014. Accordingly, the terms and
conditions of this Agreement and only those rights specified in this Agreement, shall pertain to and govern
the use, modification, reproduction, release, performance, display, and disclosure of the Program and
Documentation by the federal government (or other entity acquiring for or through the federal government)
and shall supersede any conflicting contractual terms or conditions. If this License fails to meet the
government’s needs or is inconsistent in any respect with federal procurement law, the government agrees
to return the Program and Documentation, unused, to The MathWorks, Inc.
Trademarks
MATLAB and Simulink are registered trademarks of The MathWorks, Inc. See
www.mathworks.com/trademarks for a list of additional trademarks. Other product or brand
names may be trademarks or registered trademarks of their respective holders.
Patents
The MathWorks products are protected by one or more U.S. patents. Please see
www.mathworks.com/patents for more information.
Revision History
April 1988
July 1991
May 1995
November 2000
April 2001
July 2002
June 2004
March 2005
September 2005
March 2006
September 2006
March 2007
September 2007
March 2008
October 2008
First printing
Second printing
Third printing
Fourth printing
Fifth printing
Online only
Sixth printing
Online only
Seventh printing
Online only
Online only
Online only
Online only
Online only
Online only
Revised for Version 5.0 (Release 12)
Revised for Version 5.0.2 (Release 13)
Revised for Version 6.0.1 (Release 14)
Revised for Version 6.1.1 (Release 14SP2)
Revised for Version 6.1.2 (Release 14SP3)
Revised for Version 6.1.3 (Release 2006a)
Revised for Version 6.2 (Release 2006b)
Revised for Version 7.0 (Release 2007a)
Revised for Version 7.1 (Release 2007b)
Revised for Version 7.2 (Release 2008a)
Revised for Version 7.2.1 (Release 2008b)
About the Developers
About the Developers
System Identification Toolbox™ software is developed in association with the
following leading researchers in the system identification field:
Lennart Ljung. Professor Lennart Ljung is with the Department of
Electrical Engineering at Linköping University in Sweden. He is a recognized
leader in system identification and has published numerous papers and books
in this area.
Qinghua Zhang. Dr. Qinghua Zhang is a researcher at Institut National
de Recherche en Informatique et en Automatique (INRIA) and at Institut de
Recherche en Informatique et Systèmes Aléatoires (IRISA), both in Rennes,
France. He conducts research in the areas of nonlinear system identification,
fault diagnosis, and signal processing with applications in the fields of energy,
automotive, and biomedical systems.
Peter Lindskog. Dr. Peter Lindskog is employed by NIRA Dynamics
AB, Sweden. He conducts research in the areas of system identification,
signal processing, and automatic control with a focus on vehicle industry
applications.
Anatoli Juditsky. Professor Anatoli Juditsky is with the Laboratoire Jean
Kuntzmann at the Université Joseph Fourier, Grenoble, France. He conducts
research in the areas of nonparametric statistics, system identification, and
stochastic optimization.
About the Developers
Contents
Data Processing
1
Ways to Process Data for System Identification . . . . . . .
1-2
Importing Data into the MATLAB Workspace . . . . . . . .
Types of Data You Can Model . . . . . . . . . . . . . . . . . . . . . . .
Support for Data with Uniform and Nonuniform Sampling
Intervals . . . . . . . . . . . . . . . . . . . . . . . . . . . . . . . . . . . . . .
Importing Time-Domain Data into MATLAB . . . . . . . . . . .
Importing Time-Series Data into MATLAB . . . . . . . . . . . .
Importing Frequency-Domain Data into MATLAB . . . . . .
Importing Frequency-Response Data into MATLAB . . . . .
1-5
1-5
Representing Data in the GUI . . . . . . . . . . . . . . . . . . . . . .
Types of Data You Can Import into the GUI . . . . . . . . . . . .
Importing Time-Domain Data into the GUI . . . . . . . . . . . .
Importing Frequency-Domain Data into the GUI . . . . . . . .
Importing Frequency-Response Data into the GUI . . . . . .
Importing Data Objects into the GUI . . . . . . . . . . . . . . . . .
Specifying the Data Sampling Interval . . . . . . . . . . . . . . . .
Specifying Estimation and Validation Data . . . . . . . . . . . .
Preprocessing Data Using Quick Start . . . . . . . . . . . . . . . .
Creating Data Sets from a Subset of Signal Channels . . . .
Creating Multiexperiment Data Sets in the GUI . . . . . . . .
Viewing Data Properties . . . . . . . . . . . . . . . . . . . . . . . . . . . .
Renaming Data and Changing Display Color . . . . . . . . . . .
Distinguishing Data Types in the GUI . . . . . . . . . . . . . . . .
Organizing Data Icons . . . . . . . . . . . . . . . . . . . . . . . . . . . . .
Deleting Data Sets in the GUI . . . . . . . . . . . . . . . . . . . . . . .
Exporting Data from the GUI to the MATLAB
Workspace . . . . . . . . . . . . . . . . . . . . . . . . . . . . . . . . . . . . .
1-6
1-6
1-7
1-8
1-10
1-13
1-13
1-15
1-18
1-21
1-25
1-28
1-29
1-30
1-31
1-33
1-40
1-41
1-43
1-43
1-44
1-45
Representing Time- and Frequency-Domain Data Using
iddata Objects . . . . . . . . . . . . . . . . . . . . . . . . . . . . . . . . . . . 1-47
iddata Constructor . . . . . . . . . . . . . . . . . . . . . . . . . . . . . . . . 1-47
iddata Properties . . . . . . . . . . . . . . . . . . . . . . . . . . . . . . . . . . 1-50
vii
viii
Contents
Creating Multiexperiment Data at the Command Line . . .
Subreferencing iddata Objects . . . . . . . . . . . . . . . . . . . . . . .
Modifying Time and Frequency Vectors . . . . . . . . . . . . . . .
Naming, Adding, and Removing Data Channels . . . . . . . . .
Concatenating iddata Objects . . . . . . . . . . . . . . . . . . . . . . .
1-53
1-55
1-59
1-63
1-65
Representing Frequency-Response Data Using idfrd
Objects . . . . . . . . . . . . . . . . . . . . . . . . . . . . . . . . . . . . . . . . .
idfrd Constructor . . . . . . . . . . . . . . . . . . . . . . . . . . . . . . . . . .
idfrd Properties . . . . . . . . . . . . . . . . . . . . . . . . . . . . . . . . . . .
Subreferencing idfrd Objects . . . . . . . . . . . . . . . . . . . . . . . .
Concatenating idfrd Objects . . . . . . . . . . . . . . . . . . . . . . . . .
See Also . . . . . . . . . . . . . . . . . . . . . . . . . . . . . . . . . . . . . . . . .
1-67
1-67
1-68
1-70
1-71
1-74
Analyzing Data Quality Using Plots . . . . . . . . . . . . . . . . .
Supported Data Plots . . . . . . . . . . . . . . . . . . . . . . . . . . . . . .
Plotting Data in the System Identification Tool GUI . . . . .
Plotting Data at the Command Line . . . . . . . . . . . . . . . . . .
1-75
1-75
1-75
1-81
Getting Advice About Your Data . . . . . . . . . . . . . . . . . . . .
1-84
Selecting Subsets of Data . . . . . . . . . . . . . . . . . . . . . . . . . . .
Why Select Subsets of Data? . . . . . . . . . . . . . . . . . . . . . . . .
Selecting Data Using the GUI . . . . . . . . . . . . . . . . . . . . . . .
Selecting Data at the Command Line . . . . . . . . . . . . . . . . .
1-86
1-86
1-87
1-89
Handling Missing Data and Outliers . . . . . . . . . . . . . . . . .
Handling Missing Data . . . . . . . . . . . . . . . . . . . . . . . . . . . . .
Handling Outliers . . . . . . . . . . . . . . . . . . . . . . . . . . . . . . . . .
Example – Extracting and Modeling Specific Data
Segments . . . . . . . . . . . . . . . . . . . . . . . . . . . . . . . . . . . . . .
See Also . . . . . . . . . . . . . . . . . . . . . . . . . . . . . . . . . . . . . . . . .
1-90
1-90
1-91
Subtracting Trends from Signals (Detrending) . . . . . . .
What Is Detrending? . . . . . . . . . . . . . . . . . . . . . . . . . . . . . . .
When to Detrend Data . . . . . . . . . . . . . . . . . . . . . . . . . . . . .
When Not to Detrend Data . . . . . . . . . . . . . . . . . . . . . . . . . .
GUI and Command-Line Alternatives for Detrending
Data . . . . . . . . . . . . . . . . . . . . . . . . . . . . . . . . . . . . . . . . . .
How to Detrend Data Using the GUI . . . . . . . . . . . . . . . . . .
How to Detrend Data at the Command Line . . . . . . . . . . . .
1-94
1-94
1-94
1-95
1-92
1-93
1-96
1-96
1-97
.....
1-98
Resampling Data . . . . . . . . . . . . . . . . . . . . . . . . . . . . . . . . . .
What Is Resampling? . . . . . . . . . . . . . . . . . . . . . . . . . . . . . .
Resampling Data Using the GUI . . . . . . . . . . . . . . . . . . . . .
Resampling Data at the Command Line . . . . . . . . . . . . . . .
Resampling Data Without Aliasing Effects . . . . . . . . . . . . .
See Also . . . . . . . . . . . . . . . . . . . . . . . . . . . . . . . . . . . . . . . . .
1-100
1-100
1-101
1-101
1-103
1-106
Filtering Data . . . . . . . . . . . . . . . . . . . . . . . . . . . . . . . . . . . . .
Supported Filters . . . . . . . . . . . . . . . . . . . . . . . . . . . . . . . . .
Choosing to Prefilter Your Data . . . . . . . . . . . . . . . . . . . . . .
How to Filter Data Using the GUI . . . . . . . . . . . . . . . . . . . .
How to Filter Data at the Command Line . . . . . . . . . . . . . .
See Also . . . . . . . . . . . . . . . . . . . . . . . . . . . . . . . . . . . . . . . . .
1-107
1-107
1-107
1-108
1-111
1-114
Generating Data Using Simulation . . . . . . . . . . . . . . . . . .
Commands for Generating and Simulating Data . . . . . . . .
Example – Creating Data with Periodic Inputs . . . . . . . . .
Example – Generating Data Using Simulation . . . . . . . . . .
Simulating Data Using Other MathWorks Products . . . . .
1-115
1-115
1-116
1-117
1-118
How to Add Detrended Values to the Model Output
Transforming Between Time- and Frequency-Domain
Data . . . . . . . . . . . . . . . . . . . . . . . . . . . . . . . . . . . . . . . . . . . . 1-119
Transforming Data Domain in the GUI . . . . . . . . . . . . . . . . 1-119
Transforming Data Domain at the Command Line . . . . . . 1-126
Manipulating Complex-Valued Data . . . . . . . . . . . . . . . . . 1-131
Supported Operations for Complex Data . . . . . . . . . . . . . . . 1-131
Processing Complex iddata Signals at the Command
Line . . . . . . . . . . . . . . . . . . . . . . . . . . . . . . . . . . . . . . . . . . 1-131
Choosing Your System Identification Strategy
2
Recommended Model Estimation Sequence . . . . . . . . . .
2-2
ix
Supported Models for Time- and Frequency-Domain
Data . . . . . . . . . . . . . . . . . . . . . . . . . . . . . . . . . . . . . . . . . . . .
Supported Models for Time-Domain Data . . . . . . . . . . . . . .
Supported Models for Frequency-Domain Data . . . . . . . . .
2-4
2-4
2-5
Supported Continuous-Time and Discrete-Time
Models . . . . . . . . . . . . . . . . . . . . . . . . . . . . . . . . . . . . . . . . .
2-7
Commands for Model Estimation . . . . . . . . . . . . . . . . . . . .
2-9
Creating Model Structures at the Command Line . . . . .
About System Identification Toolbox Model Objects . . . . . .
When to Construct a Model Structure Independently of
Estimation . . . . . . . . . . . . . . . . . . . . . . . . . . . . . . . . . . . . .
Commands for Constructing Model Structures . . . . . . . . . .
Model Properties . . . . . . . . . . . . . . . . . . . . . . . . . . . . . . . . . .
See Also . . . . . . . . . . . . . . . . . . . . . . . . . . . . . . . . . . . . . . . . .
2-11
2-11
Modeling Multiple-Output Systems . . . . . . . . . . . . . . . . . .
About Modeling Multiple-Output Systems . . . . . . . . . . . . .
Modeling Multiple Outputs Directly . . . . . . . . . . . . . . . . . .
Modeling Multiple Outputs as a Combination of
Single-Output Models . . . . . . . . . . . . . . . . . . . . . . . . . . . .
Improving Multiple-Output Estimation Results by
Weighing Outputs During Estimation . . . . . . . . . . . . . .
2-21
2-21
2-22
2-12
2-13
2-14
2-20
2-22
2-23
Linear Model Identification
3
Identifying Frequency-Response Models . . . . . . . . . . . . .
What Is a Frequency-Response Model? . . . . . . . . . . . . . . . .
Data Supported by Frequency-Response Models . . . . . . . .
How to Estimate Frequency-Response Models in the
GUI . . . . . . . . . . . . . . . . . . . . . . . . . . . . . . . . . . . . . . . . . .
How to Estimate Frequency-Response Models at the
Command Line . . . . . . . . . . . . . . . . . . . . . . . . . . . . . . . . .
Options for Computing Spectral Models . . . . . . . . . . . . . . .
Options for Frequency Resolution . . . . . . . . . . . . . . . . . . . .
Spectral Analysis Algorithm . . . . . . . . . . . . . . . . . . . . . . . . .
x
Contents
3-2
3-2
3-3
3-3
3-5
3-5
3-6
3-8
..............
3-11
Identifying Impulse-Response Models . . . . . . . . . . . . . . .
What Is Time-Domain Correlation Analysis? . . . . . . . . . . .
Data Supported by Correlation Analysis . . . . . . . . . . . . . . .
How to Estimate Correlation Models Using the GUI . . . . .
How to Estimate Correlation Models at the Command
Line . . . . . . . . . . . . . . . . . . . . . . . . . . . . . . . . . . . . . . . . . .
How to Compute Response Values . . . . . . . . . . . . . . . . . . . .
How to Identify Delay Using Transient-Response Plots . . .
Algorithm for Correlation Analysis . . . . . . . . . . . . . . . . . . .
3-14
3-14
3-15
3-15
Understanding Spectrum Normalization
Identifying Low-Order Transfer Functions (Process
Models) . . . . . . . . . . . . . . . . . . . . . . . . . . . . . . . . . . . . . . . . .
What Is a Process Model? . . . . . . . . . . . . . . . . . . . . . . . . . . .
Data Supported by a Process Model . . . . . . . . . . . . . . . . . . .
How to Estimate Process Models Using the GUI . . . . . . . .
Estimating Process Models at the Command Line . . . . . . .
Options for Specifying the Process-Model Structure . . . . .
Options for Multiple-Input Models . . . . . . . . . . . . . . . . . . .
Options for the Disturbance Model Structure . . . . . . . . . . .
Options for Frequency-Weighing Focus . . . . . . . . . . . . . . . .
Options for Initial States . . . . . . . . . . . . . . . . . . . . . . . . . . .
3-16
3-18
3-18
3-20
3-22
3-22
3-23
3-23
3-29
3-35
3-36
3-37
3-38
3-39
Identifying Input-Output Polynomial Models . . . . . . . .
What Are Black-Box Polynomial Models? . . . . . . . . . . . . . .
Data Supported by Polynomial Models . . . . . . . . . . . . . . . .
Preliminary Step – Estimating Model Orders and Input
Delays . . . . . . . . . . . . . . . . . . . . . . . . . . . . . . . . . . . . . . . .
How to Estimate Polynomial Models in the GUI . . . . . . . .
How to Estimate Polynomial Models at the Command
Line . . . . . . . . . . . . . . . . . . . . . . . . . . . . . . . . . . . . . . . . . .
Options for Multiple-Input and Multiple-Output ARX
Orders . . . . . . . . . . . . . . . . . . . . . . . . . . . . . . . . . . . . . . . .
Option for Frequency-Weighing Focus . . . . . . . . . . . . . . . . .
Options for Initial States . . . . . . . . . . . . . . . . . . . . . . . . . . .
Algorithms for Estimating Polynomial Models . . . . . . . . . .
Example – Estimating Models Using armax . . . . . . . . . . . .
3-41
3-41
3-48
Identifying State-Space Models . . . . . . . . . . . . . . . . . . . . .
What Are State-Space Models? . . . . . . . . . . . . . . . . . . . . . .
Data Supported by State-Space Models . . . . . . . . . . . . . . . .
3-73
3-73
3-77
3-49
3-57
3-60
3-64
3-65
3-66
3-66
3-67
xi
Supported State-Space Parameterizations . . . . . . . . . . . . .
Preliminary Step – Estimating State-Space Model
Orders . . . . . . . . . . . . . . . . . . . . . . . . . . . . . . . . . . . . . . . .
How to Estimate State-Space Models in the GUI . . . . . . . .
How to Estimate State-Space Models at the Command
Line . . . . . . . . . . . . . . . . . . . . . . . . . . . . . . . . . . . . . . . . . .
How to Estimate Free-Parameterization State-Space
Models . . . . . . . . . . . . . . . . . . . . . . . . . . . . . . . . . . . . . . . .
How to Estimate State-Space Models with Canonical
Parameterization . . . . . . . . . . . . . . . . . . . . . . . . . . . . . . .
How to Estimate State-Space Models with Structured
Parameterization . . . . . . . . . . . . . . . . . . . . . . . . . . . . . . .
How to Estimate the State-Space Equivalent of ARMAX
and OE Models . . . . . . . . . . . . . . . . . . . . . . . . . . . . . . . . .
Options for Frequency-Weighing Focus . . . . . . . . . . . . . . . .
Options for Initial States . . . . . . . . . . . . . . . . . . . . . . . . . . .
Algorithms for Estimating State-Space Models . . . . . . . . .
Refining Linear Parametric Models . . . . . . . . . . . . . . . . .
When to Refine Models . . . . . . . . . . . . . . . . . . . . . . . . . . . . .
What You Specify to Refine a Model . . . . . . . . . . . . . . . . . .
How to Refine Linear Parametric Models in the GUI . . . . .
How to Refine Linear Parametric Models at the Command
Line . . . . . . . . . . . . . . . . . . . . . . . . . . . . . . . . . . . . . . . . . .
3-78
3-79
3-84
3-87
3-90
3-91
3-93
3-100
3-100
3-101
3-101
3-103
3-103
3-103
3-104
3-105
Extracting Parameter Values from Linear Models . . . . 3-108
Extracting Dynamic Model and Noise Model
Separately . . . . . . . . . . . . . . . . . . . . . . . . . . . . . . . . . . . . . . 3-110
Transforming Between Discrete-Time and
Continuous-Time Representations . . . . . . . . . . . . . . . .
Why Transform Between Continuous and Discrete
Time? . . . . . . . . . . . . . . . . . . . . . . . . . . . . . . . . . . . . . . . . .
Using the c2d, d2c, and d2d Commands . . . . . . . . . . . . . . .
Specifying Intersample Behavior . . . . . . . . . . . . . . . . . . . . .
How d2c Handles Input Delays . . . . . . . . . . . . . . . . . . . . . .
Effects on the Noise Model . . . . . . . . . . . . . . . . . . . . . . . . . .
3-112
3-112
3-112
3-114
3-114
3-115
Transforming Between Linear Model
Representations . . . . . . . . . . . . . . . . . . . . . . . . . . . . . . . . . 3-117
xii
Contents
Subreferencing Model Objects . . . . . . . . . . . . . . . . . . . . . .
What Is Subreferencing? . . . . . . . . . . . . . . . . . . . . . . . . . . . .
Limitation on Supported Models . . . . . . . . . . . . . . . . . . . . .
Subreferencing Specific Measured Channels . . . . . . . . . . .
Subreferencing Measured and Noise Models . . . . . . . . . . .
Treating Noise Channels as Measured Inputs . . . . . . . . . .
3-119
3-119
3-119
3-119
3-120
3-122
Concatenating Model Objects . . . . . . . . . . . . . . . . . . . . . . .
About Concatenating Models . . . . . . . . . . . . . . . . . . . . . . . .
Limitation on Supported Models . . . . . . . . . . . . . . . . . . . . .
Horizontal Concatenation of Model Objects . . . . . . . . . . . .
Vertical Concatenation of Model Objects . . . . . . . . . . . . . . .
Concatenating Noise Spectral Data of idfrd Objects . . . . . .
See Also . . . . . . . . . . . . . . . . . . . . . . . . . . . . . . . . . . . . . . . . .
3-124
3-124
3-124
3-125
3-125
3-126
3-127
Merging Model Objects . . . . . . . . . . . . . . . . . . . . . . . . . . . . . 3-128
Nonlinear Black-Box Model Identification
4
Supported Data for Estimating Nonlinear Black-Box
Models . . . . . . . . . . . . . . . . . . . . . . . . . . . . . . . . . . . . . . . . .
4-2
Supported Nonlinear Black-Box Models . . . . . . . . . . . . .
4-3
Identifying Nonlinear ARX Models . . . . . . . . . . . . . . . . . .
Supported Data for Nonlinear ARX Models . . . . . . . . . . . .
Definition of the Nonlinear ARX Model . . . . . . . . . . . . . . . .
Using Regressors . . . . . . . . . . . . . . . . . . . . . . . . . . . . . . . . . .
Nonlinearity Estimators for Nonlinear ARX Models . . . . .
How to Estimate Nonlinear ARX Models in the GUI . . . . .
How to Estimate Nonlinear ARX Models at the Command
Line . . . . . . . . . . . . . . . . . . . . . . . . . . . . . . . . . . . . . . . . . .
4-4
4-4
4-4
4-6
4-9
4-10
Identifying Hammerstein-Wiener Models . . . . . . . . . . . .
Supported Data for Estimating Hammerstein-Wiener
Models . . . . . . . . . . . . . . . . . . . . . . . . . . . . . . . . . . . . . . . .
Definition of the Hammerstein-Wiener Model . . . . . . . . . .
4-15
4-11
4-15
4-15
xiii
Nonlinearity Estimators for Hammerstein-Wiener
Models . . . . . . . . . . . . . . . . . . . . . . . . . . . . . . . . . . . . . . . .
How to Estimate Hammerstein-Wiener Models in the
GUI . . . . . . . . . . . . . . . . . . . . . . . . . . . . . . . . . . . . . . . . . .
How to Estimate Hammerstein-Wiener Models at the
Command Line . . . . . . . . . . . . . . . . . . . . . . . . . . . . . . . . .
Supported Nonlinearity Estimators . . . . . . . . . . . . . . . . .
Types of Nonlinearity Estimators . . . . . . . . . . . . . . . . . . . .
Creating Custom Nonlinearities . . . . . . . . . . . . . . . . . . . . .
4-17
4-18
4-20
4-25
4-25
4-26
Refining Nonlinear Black-Box Models . . . . . . . . . . . . . . . 4-28
How to Refine Nonlinear Black-Box Models in the GUI . . . 4-28
How to Refine Nonlinear Black-Box Models at the Command
Line . . . . . . . . . . . . . . . . . . . . . . . . . . . . . . . . . . . . . . . . . . 4-29
Extracting Parameter Values from Nonlinear Black-Box
Models . . . . . . . . . . . . . . . . . . . . . . . . . . . . . . . . . . . . . . . . . 4-30
Nonlinear ARX Parameter Values . . . . . . . . . . . . . . . . . . . . 4-30
Hammerstein-Wiener Parameter values . . . . . . . . . . . . . . . 4-31
Next Steps After Estimating Nonlinear Black-Box
Models . . . . . . . . . . . . . . . . . . . . . . . . . . . . . . . . . . . . . . . . .
Computing Linear Approximations of Nonlinear
Black-Box Models . . . . . . . . . . . . . . . . . . . . . . . . . . . . . . .
Why Compute a Linearize Approximation of a Nonlinear
Model? . . . . . . . . . . . . . . . . . . . . . . . . . . . . . . . . . . . . . . . .
Choosing Your Linear Approximation Approach . . . . . . . .
Linear Approximation of Nonlinear Black-Box Models for a
Given Input . . . . . . . . . . . . . . . . . . . . . . . . . . . . . . . . . . . .
Tangent Linearization of Nonlinear Black-Box Models . . .
Computing Operating Points for Nonlinear Black-Box
Models . . . . . . . . . . . . . . . . . . . . . . . . . . . . . . . . . . . . . . . .
xiv
Contents
4-32
4-33
4-33
4-33
4-34
4-35
4-35
ODE Parameter Estimation (Grey-Box
Modeling)
5
Supported Grey-Box Models . . . . . . . . . . . . . . . . . . . . . . . .
5-2
Data Supported by Grey-Box Models . . . . . . . . . . . . . . . .
5-3
Choosing idgrey or idnlgrey Model Object . . . . . . . . . . .
5-4
Estimating Linear Grey-Box Models . . . . . . . . . . . . . . . . .
Specifying the Linear Grey-Box Model Structure . . . . . . . .
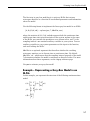
Example – Representing a Grey-Box Model in an M-File . .
Example – Estimating a Continuous-Time Grey-Box Model
for Heat Diffusion . . . . . . . . . . . . . . . . . . . . . . . . . . . . . . .
Example – Estimating a Discrete-Time Grey-Box Model
with Parameterized Disturbance . . . . . . . . . . . . . . . . . . .
5-6
5-6
5-7
5-12
Estimating Nonlinear Grey-Box Models . . . . . . . . . . . . . .
Supported Nonlinear Grey-Box Models . . . . . . . . . . . . . . . .
Nonlinear Grey-Box Demos and Examples . . . . . . . . . . . . .
Specifying the Nonlinear Grey-Box Model Structure . . . . .
Constructing the idnlgrey Object . . . . . . . . . . . . . . . . . . . . .
Using pem to Estimate Nonlinear Grey-Box Models . . . . .
Options for the Estimation Algorithm . . . . . . . . . . . . . . . . .
5-16
5-16
5-16
5-17
5-18
5-19
5-20
After Estimating Grey-Box Models . . . . . . . . . . . . . . . . . .
5-23
5-9
Time Series Model Identification
6
What Are Time-Series Models? . . . . . . . . . . . . . . . . . . . . . .
6-2
Preparing Time-Series Data . . . . . . . . . . . . . . . . . . . . . . . .
6-3
Estimating Time-Series Power Spectra . . . . . . . . . . . . . .
6-4
xv
How to Estimate Time-Series Power Spectra Using the
GUI . . . . . . . . . . . . . . . . . . . . . . . . . . . . . . . . . . . . . . . . . .
How to Estimate Time-Series Power Spectra at the
Command Line . . . . . . . . . . . . . . . . . . . . . . . . . . . . . . . . .
6-4
6-5
Estimating AR and ARMA Models . . . . . . . . . . . . . . . . . . .
Definition of AR and ARMA Models . . . . . . . . . . . . . . . . . . .
Estimating Polynomial Time-Series Models in the GUI . . .
Estimating AR and ARMA Models at the Command
Line . . . . . . . . . . . . . . . . . . . . . . . . . . . . . . . . . . . . . . . . . .
6-10
Estimating State-Space Time-Series Models . . . . . . . . . .
Definition of State-Space Time-Series Model . . . . . . . . . . .
Estimating State-Space Models at the Command Line . . .
6-12
6-12
6-12
Example – Identifying Time-Series Models at the
Command Line . . . . . . . . . . . . . . . . . . . . . . . . . . . . . . . . . .
6-14
Estimating Nonlinear Models for Time-Series Data . . .
6-15
6-7
6-7
6-7
Recursive Techniques for Model Identification
7
xvi
Contents
What Is Recursive Estimation? . . . . . . . . . . . . . . . . . . . . . .
7-2
Commands for Recursive Estimation . . . . . . . . . . . . . . . .
7-3
Algorithms for Recursive Estimation . . . . . . . . . . . . . . . .
Types of Recursive Estimation Algorithms . . . . . . . . . . . . .
General Form of Recursive Estimation Algorithm . . . . . . .
Kalman Filter Algorithm . . . . . . . . . . . . . . . . . . . . . . . . . . .
Forgetting Factor Algorithm . . . . . . . . . . . . . . . . . . . . . . . .
Unnormalized and Normalized Gradient Algorithms . . . . .
7-6
7-6
7-6
7-8
7-10
7-11
Data Segmentation . . . . . . . . . . . . . . . . . . . . . . . . . . . . . . . .
7-14
Model Analysis
8
Overview of Model Validation and Plots . . . . . . . . . . . . .
When to Validate Models . . . . . . . . . . . . . . . . . . . . . . . . . . .
Ways to Validate Models . . . . . . . . . . . . . . . . . . . . . . . . . . .
Data for Validating Models . . . . . . . . . . . . . . . . . . . . . . . . .
Supported Model Plots . . . . . . . . . . . . . . . . . . . . . . . . . . . . .
Plotting Models in the GUI . . . . . . . . . . . . . . . . . . . . . . . . . .
Getting Advice About Models . . . . . . . . . . . . . . . . . . . . . . . .
Using Model Output Plots to Validate and Compare
Models . . . . . . . . . . . . . . . . . . . . . . . . . . . . . . . . . . . . . . . . .
Supported Model Types . . . . . . . . . . . . . . . . . . . . . . . . . . . .
What Does a Model Output Plot Show? . . . . . . . . . . . . . . . .
Choosing Simulated or Predicted Output . . . . . . . . . . . . . .
How to Plot Model Output Using the GUI . . . . . . . . . . . . . .
Displaying the Confidence Interval . . . . . . . . . . . . . . . . . . .
How to Plot and Compare Model Output at the Command
Line . . . . . . . . . . . . . . . . . . . . . . . . . . . . . . . . . . . . . . . . . .
Using Residual Analysis Plots to Validate Models . . . . .
What Is Residual Analysis? . . . . . . . . . . . . . . . . . . . . . . . . .
Supported Model Types . . . . . . . . . . . . . . . . . . . . . . . . . . . .
What Does the Residuals Plot Show? . . . . . . . . . . . . . . . . .
Displaying the Confidence Interval . . . . . . . . . . . . . . . . . . .
How to Plot Residuals Using the GUI . . . . . . . . . . . . . . . . .
How to Plot Residuals at the Command Line . . . . . . . . . . .
Example – Examining Model Residuals . . . . . . . . . . . . . . .
Using Impulse- and Step-Response Plots to Validate
Models . . . . . . . . . . . . . . . . . . . . . . . . . . . . . . . . . . . . . . . . .
Supported Models . . . . . . . . . . . . . . . . . . . . . . . . . . . . . . . . .
How Transient Response Helps to Validate Models . . . . . .
What Does a Transient Response Plot Show? . . . . . . . . . . .
How to Plot Impulse and Step Response Using the GUI . .
Displaying the Confidence Interval . . . . . . . . . . . . . . . . . . .
How to Plot Impulse and Step Response at the Command
Line . . . . . . . . . . . . . . . . . . . . . . . . . . . . . . . . . . . . . . . . . .
Using Frequency-Response Plots to Validate Models . .
8-2
8-2
8-2
8-4
8-4
8-5
8-7
8-8
8-8
8-8
8-9
8-11
8-13
8-14
8-16
8-16
8-17
8-17
8-18
8-19
8-21
8-21
8-24
8-24
8-24
8-25
8-26
8-29
8-30
8-32
xvii
What Is Frequency Response? . . . . . . . . . . . . . . . . . . . . . . .
How Frequency Response Helps to Validate Models . . . . .
What Does a Frequency-Response Plot Show? . . . . . . . . . .
How to Plot Bode Plots Using the GUI . . . . . . . . . . . . . . . .
How to Plot Bode and Nyquist Plots at the Command
Line . . . . . . . . . . . . . . . . . . . . . . . . . . . . . . . . . . . . . . . . . .
8-32
8-33
8-34
8-35
Creating Noise-Spectrum Plots . . . . . . . . . . . . . . . . . . . . .
Supported Models . . . . . . . . . . . . . . . . . . . . . . . . . . . . . . . . .
What Does a Noise Spectrum Plot Show? . . . . . . . . . . . . . .
Displaying the Confidence Interval . . . . . . . . . . . . . . . . . . .
How to Plot the Noise Spectrum Using the GUI . . . . . . . . .
How to Plot the Noise Spectrum at the Command Line . . .
8-40
8-40
8-40
8-41
8-42
8-45
Using Pole-Zero Plots to Validate Models . . . . . . . . . . . .
Supported Models . . . . . . . . . . . . . . . . . . . . . . . . . . . . . . . . .
What Does a Pole-Zero Plot Show? . . . . . . . . . . . . . . . . . . .
How to Plot Model Poles and Zeros Using the GUI . . . . . .
How to Plot Poles and Zeros at the Command Line . . . . . .
Reducing Model Order Using Pole-Zero Plots . . . . . . . . . . .
8-47
8-47
8-47
8-48
8-50
8-51
Using Nonlinear ARX Plots to Validate Models . . . . . . .
About Nonlinear ARX Plots . . . . . . . . . . . . . . . . . . . . . . . . .
How to Plot Nonlinear ARX Plots Using the GUI . . . . . . . .
Configuring the Nonlinear ARX Plot . . . . . . . . . . . . . . . . . .
Axis Limits, Legend, and 3-D Rotation . . . . . . . . . . . . . . . .
How to Plot Nonlinear ARX Plots at the Command Line . .
8-52
8-52
8-52
8-53
8-54
8-55
Using Hammerstein-Wiener Plots to Validate
Models . . . . . . . . . . . . . . . . . . . . . . . . . . . . . . . . . . . . . . . . .
About Hammerstein-Wiener Plots . . . . . . . . . . . . . . . . . . . .
How to Create Hammerstein-Wiener Plots in the GUI . . .
How to Plot Hammerstein-Wiener Plots at the Command
Line . . . . . . . . . . . . . . . . . . . . . . . . . . . . . . . . . . . . . . . . . .
Plotting Nonlinear Block Characteristics . . . . . . . . . . . . . .
Plotting Linear Block Characteristics . . . . . . . . . . . . . . . . .
Using Akaike’s Criteria to Validate Models . . . . . . . . . . .
Definition of FPE . . . . . . . . . . . . . . . . . . . . . . . . . . . . . . . . . .
Computing FPE . . . . . . . . . . . . . . . . . . . . . . . . . . . . . . . . . . .
Definition of AIC . . . . . . . . . . . . . . . . . . . . . . . . . . . . . . . . . .
Computing AIC . . . . . . . . . . . . . . . . . . . . . . . . . . . . . . . . . . .
xviii
Contents
8-38
8-56
8-56
8-56
8-58
8-58
8-59
8-61
8-61
8-62
8-62
8-63
Computing Model Uncertainty . . . . . . . . . . . . . . . . . . . . . .
Why Analyze Model Uncertainty? . . . . . . . . . . . . . . . . . . . .
What Is Model Covariance? . . . . . . . . . . . . . . . . . . . . . . . . .
Viewing Model Uncertainty Information . . . . . . . . . . . . . . .
8-64
8-64
8-64
8-65
Troubleshooting Models . . . . . . . . . . . . . . . . . . . . . . . . . . . .
About Troubleshooting Models . . . . . . . . . . . . . . . . . . . . . . .
Model Order Is Too High or Too Low . . . . . . . . . . . . . . . . . .
Nonlinearity Estimator Produces a Poor Fit . . . . . . . . . . . .
Substantial Noise in the System . . . . . . . . . . . . . . . . . . . . .
Unstable Models . . . . . . . . . . . . . . . . . . . . . . . . . . . . . . . . . .
Missing Input Variables . . . . . . . . . . . . . . . . . . . . . . . . . . . .
Complicated Nonlinearities . . . . . . . . . . . . . . . . . . . . . . . . .
8-67
8-67
8-67
8-68
8-69
8-69
8-70
8-71
Next Steps After Getting an Accurate Model . . . . . . . . .
8-72
Simulation and Prediction
9
...............
9-2
Simulation and Prediction in the GUI . . . . . . . . . . . . . . .
9-4
Example – Simulating Model Output with Noise at the
Command Line . . . . . . . . . . . . . . . . . . . . . . . . . . . . . . . . . .
9-5
Example – Simulating a Continuous-Time State-Space
Model at the Command Line . . . . . . . . . . . . . . . . . . . . . .
9-6
Predicting Model Output at the Command Line . . . . . .
9-7
Specifying Initial States . . . . . . . . . . . . . . . . . . . . . . . . . . . .
When to Specify Initial States . . . . . . . . . . . . . . . . . . . . . . .
Setting Initial States to Zero . . . . . . . . . . . . . . . . . . . . . . . .
Setting Initial States to Equilibrium Values . . . . . . . . . . . .
Estimating Initial States from the Data . . . . . . . . . . . . . . .
9-8
9-8
9-8
9-9
9-9
Simulating Versus Predicting Output
xix
Using Identified Models in Control Design
10
Using Models with Control System Toolbox Software . .
How Control System Toolbox Software Works with
Identified Models . . . . . . . . . . . . . . . . . . . . . . . . . . . . . . .
Using balred to Reduce Model Order . . . . . . . . . . . . . . . . . .
Compensator Design Using Control System Toolbox
Software . . . . . . . . . . . . . . . . . . . . . . . . . . . . . . . . . . . . . . .
Converting Models to LTI Objects . . . . . . . . . . . . . . . . . . . .
Viewing Model Response Using the LTI Viewer . . . . . . . . .
Combining Model Objects . . . . . . . . . . . . . . . . . . . . . . . . . . .
Example – Using System Identification Toolbox Software
with Control System Toolbox Software . . . . . . . . . . . . . .
10-2
10-2
10-3
10-3
10-4
10-5
10-6
10-6
Using System Identification Toolbox Blocks
11
xx
Contents
System Identification Toolbox Block Library . . . . . . . . .
11-2
Opening the System Identification Toolbox Block
Library . . . . . . . . . . . . . . . . . . . . . . . . . . . . . . . . . . . . . . . . .
11-3
Preparing Data . . . . . . . . . . . . . . . . . . . . . . . . . . . . . . . . . . . .
11-4
Identifying Linear Models . . . . . . . . . . . . . . . . . . . . . . . . . .
11-5
Simulating Model Output . . . . . . . . . . . . . . . . . . . . . . . . . .
When to Use Simulation Blocks . . . . . . . . . . . . . . . . . . . . . .
Summary of Simulation Blocks . . . . . . . . . . . . . . . . . . . . . .
Specifying Initial Conditions for Simulation . . . . . . . . . . . .
11-6
11-6
11-6
11-7
Example – Simulating a Model Using Simulink
Software . . . . . . . . . . . . . . . . . . . . . . . . . . . . . . . . . . . . . . . .
11-9
Using the System Identification Tool GUI
12
Steps for Using the System Identification Tool GUI . . .
12-2
Starting and Managing GUI Sessions . . . . . . . . . . . . . . . .
What Is a System Identification Tool Session? . . . . . . . . . .
Starting a New Session in the GUI . . . . . . . . . . . . . . . . . . .
Description of the System Identification Tool Window . . . .
Opening a Saved Session . . . . . . . . . . . . . . . . . . . . . . . . . . .
Saving, Merging, and Closing Sessions . . . . . . . . . . . . . . . .
Deleting a Session . . . . . . . . . . . . . . . . . . . . . . . . . . . . . . . . .
Getting Help in the GUI . . . . . . . . . . . . . . . . . . . . . . . . . . . .
Exiting the System Identification Tool GUI . . . . . . . . . . . .
12-3
12-3
12-4
12-5
12-6
12-6
12-7
12-7
12-8
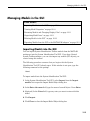
Managing Models in the GUI . . . . . . . . . . . . . . . . . . . . . . . .
Importing Models into the GUI . . . . . . . . . . . . . . . . . . . . . .
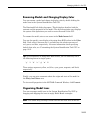
Viewing Model Properties . . . . . . . . . . . . . . . . . . . . . . . . . . .
Renaming Models and Changing Display Color . . . . . . . . .
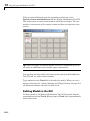
Organizing Model Icons . . . . . . . . . . . . . . . . . . . . . . . . . . . .
Deleting Models in the GUI . . . . . . . . . . . . . . . . . . . . . . . . .
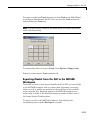
Exporting Models from the GUI to the MATLAB
Workspace . . . . . . . . . . . . . . . . . . . . . . . . . . . . . . . . . . . . .
12-9
12-9
12-10
12-11
12-11
12-12
12-13
Working with Plots in the System Identification Tool
GUI . . . . . . . . . . . . . . . . . . . . . . . . . . . . . . . . . . . . . . . . . . . .
Identifying Data Sets and Models on Plots . . . . . . . . . . . . .
Changing and Restoring Default Axis Limits . . . . . . . . . . .
Selecting Measured and Noise Channels in Plots . . . . . . . .
Grid, Line Styles, and Redrawing Plots . . . . . . . . . . . . . . . .
Opening a Plot in a MATLAB Figure Window . . . . . . . . . .
Printing Plots . . . . . . . . . . . . . . . . . . . . . . . . . . . . . . . . . . . .
12-15
12-15
12-16
12-18
12-19
12-19
12-20
Customizing the System Identification Tool GUI . . . . .
Types of GUI Customization . . . . . . . . . . . . . . . . . . . . . . . .
Displaying Warnings While You Work . . . . . . . . . . . . . . . .
Saving Session Preferences . . . . . . . . . . . . . . . . . . . . . . . . .
Modifying idlayout.m . . . . . . . . . . . . . . . . . . . . . . . . . . . . . .
12-21
12-21
12-21
12-21
12-22
xxi
Index
xxii
Contents
1
Data Processing
• “Ways to Process Data for System Identification” on page 1-2
• “Importing Data into the MATLAB Workspace” on page 1-5
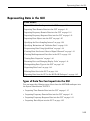
• “Representing Data in the GUI” on page 1-13
• “Representing Time- and Frequency-Domain Data Using iddata Objects”
on page 1-47
• “Representing Frequency-Response Data Using idfrd Objects” on page 1-67
• “Analyzing Data Quality Using Plots” on page 1-75
• “Getting Advice About Your Data” on page 1-84
• “Selecting Subsets of Data” on page 1-86
• “Handling Missing Data and Outliers” on page 1-90
• “Subtracting Trends from Signals (Detrending)” on page 1-94
• “Resampling Data” on page 1-100
• “Filtering Data” on page 1-107
• “Generating Data Using Simulation” on page 1-115
• “Transforming Between Time- and Frequency-Domain Data” on page 1-119
• “Manipulating Complex-Valued Data” on page 1-131
1
Data Processing
Ways to Process Data for System Identification
The following tasks help to prepare your data for identifying models from data:
Import data into the MATLAB workspace
Before you can begin identifying models, you must import your data into the
MATLAB® workspace. You can import the data from external data files, create
data by simulation, or manually create data arrays at the command line.
For more information about importing data into MATLAB, see “Importing
Data into the MATLAB Workspace” on page 1-5.
After you import the data, you must represent it for system identification.
Represent data for system identification
You can represent data as variables in the MATLAB workspace by doing
one of the following:
• For working in the GUI, import data into the System Identification Tool
GUI.
See “Representing Data in the GUI” on page 1-13.
• For working at the command line, create an iddata or idfrd object.
For time-domain or frequency-domain data, see “Representing Time- and
Frequency-Domain Data Using iddata Objects” on page 1-47.
For frequency-response data, see “Representing Frequency-Response Data
Using idfrd Objects” on page 1-67.
Simulate data
As an alternative to using measured data, you can simulate data with and
without noise.
To learn how to create data sets using simulation, see “Generating Data
Using Simulation” on page 1-115.
1-2
Ways to Process Data for System Identification
Plot and analyze data
You can analyze your data by doing either of the following:
• Plotting data to examine both time- and frequency-domain behavior.
See “Analyzing Data Quality Using Plots” on page 1-75.
• Using the advice command to analyze the data for the presence of constant
offsets and trends, delay, feedback, and signal excitation levels.
See “Getting Advice About Your Data” on page 1-84.
Preprocess data
Review the data characteristics for any of the following features to determine
if there is a need for preprocessing:
• Missing or faulty values (also known as outliers). For example, you might
see gaps that indicate missing data, values that do not fit with the rest of
the data, or noninformative values.
See “Handling Missing Data and Outliers” on page 1-90.
• Offsets and drifts in signal levels (low-frequency disturbances).
See “Subtracting Trends from Signals (Detrending)” on page 1-94 for
information about subtracting means and linear trends, and “Filtering
Data” on page 1-107 for information about filtering.
• High-frequency disturbances above the frequency interval of interest for
the system dynamics.
See “Resampling Data” on page 1-100 for information about decimating and
interpolating values, and “Filtering Data” on page 1-107 for information
about filtering.
Select a subset of your data
You can use data selection as a way to clean the data and exclude parts
with noisy or missing information. You can also use data selection to create
independent data sets for estimation and validation.
1-3
1
Data Processing
To learn more about selecting data, see “Selecting Subsets of Data” on page
1-86.
Combine data from multiple experiments
You can combine data from multiple experiments into a single data set.
The model you estimate from a multiple-experiment data set describes the
average system that represents these experiments.
To learn more about creating multiple-experiment data sets, see “Creating
Multiexperiment Data Sets in the GUI” on page 1-33 or “Creating
Multiexperiment Data at the Command Line” on page 1-53.
1-4
Importing Data into the MATLAB® Workspace
Importing Data into the MATLAB Workspace
In this section...
“Types of Data You Can Model” on page 1-5
“Support for Data with Uniform and Nonuniform Sampling Intervals” on
page 1-6
“Importing Time-Domain Data into MATLAB” on page 1-6
“Importing Time-Series Data into MATLAB” on page 1-7
“Importing Frequency-Domain Data into MATLAB” on page 1-8
“Importing Frequency-Response Data into MATLAB” on page 1-10
Types of Data You Can Model
For linear models, you can identify both time- and frequency-domain data
with single or multiple inputs and outputs. Time-domain data can be either
real or complex.
For nonlinear models, this toolbox supports only time-domain data.
Time-domain data is one or more input variables u(t) and one or more output
variables y(t), sampled as a function of time.
Frequency-domain data is the Fourier transform of the input and output
time-domain signals.
Frequency-response data, also called frequency-function data, represents
complex frequency-response values for a linear system characterized by its
transfer function G. You can measure frequency-response data values directly
using a spectrum analyzer, for example.
Time-series data, which contains one or more outputs y(t) and no measured
input, can be time-domain or frequency-domain data.
1-5
1
Data Processing
Note If your data is complex valued, see “Manipulating Complex-Valued
Data” on page 1-131 for information about supported operations for complex
data.
Support for Data with Uniform and Nonuniform
Sampling Intervals
A sampling interval is the time between successive data samples.
The System Identification Toolbox product provides limited support for
nonuniformly sampled data. For more information about specifying uniform
and nonuniform time vectors, see “Constructing an iddata Object for
Time-Domain Data” on page 1-48.
Note The System Identification Tool GUI only supports uniformly sampled
data.
Importing Time-Domain Data into MATLAB
Time-domain data consists of one or more input variables u(t) and one or more
output variables y(t), sampled as a function of time. If there is no output data,
see “Importing Time-Series Data into MATLAB” on page 1-7.
You must import your time-domain data into the MATLAB workspace as
the following variables:
• Input data
For single-input/single-output (SISO) data, the input must be a column
vector.
For a data set with Nu inputs and NT samples (measurements), the input is
an NT-by-Nu matrix.
• Output data
For single-input/single-output (SISO) data, the output must be a column
vector.
1-6
Importing Data into the MATLAB® Workspace
For a data set with Ny outputs and NT samples (measurements), the output
is an NT-by-Ny matrix.
• Sampling time interval
If you are working with uniformly sampled data, use the actual sampling
interval from your experiment. Each data value is assigned a sample time,
which is calculated from the start time and the sampling interval. If you
are working with nonuniformly sampled data at the command line, you
can specify a vector of time instants using the iddata SamplingInstants
property, as described in “Constructing an iddata Object for Time-Domain
Data” on page 1-48.
For more information about importing data into the MATLAB workspace, see
the MATLAB documentation.
After you import data, you can import it into the System Identification Tool
GUI or create a data object for working at the command line. For more
information about importing data into the GUI, see “Importing Time-Domain
Data into the GUI” on page 1-15. To learn more about creating a data object,
see “Representing Time- and Frequency-Domain Data Using iddata Objects”
on page 1-47.
Importing Time-Series Data into MATLAB
Time-series data is time-domain or frequency-domain data that consist of one
or more outputs y(t) with no corresponding input.
You must import your time-series data into the MATLAB workspace as the
following variables:
• Output data
-
For single-input/single-output (SISO) data, the output must be a column
vector.
-
For a data set with Ny outputs and NT samples (measurements), the
output is an NT-by-Ny matrix.
• Sampling time interval
1-7
1
Data Processing
-
If you are working with uniformly sampled data, use the actual
sampling interval in your experiment. Each data value is assigned a
sample time, which is calculated from the start time and the sampling
interval. If you are working with nonuniformly sampled data at the
command line, you can specify a vector of time instants using the iddata
SamplingInstants property, as described in “Constructing an iddata
Object for Time-Domain Data” on page 1-48.
For more information about importing data into the MATLAB workspace, see
the MATLAB documentation.
After you import data, you can import it into the System Identification Tool
GUI or create a data object for working at the command line. For more
information about importing data into the GUI, see “Importing Time-Domain
Data into the GUI” on page 1-15. To learn more about creating a data object,
see “Representing Time- and Frequency-Domain Data Using iddata Objects”
on page 1-47.
For information about estimating time-series model parameters, see Chapter
6, “Time Series Model Identification”.
Importing Frequency-Domain Data into MATLAB
• “What Is Frequency-Domain Data?” on page 1-8
• “How to Import Frequency-Domain Data into MATLAB” on page 1-9
What Is Frequency-Domain Data?
Frequency-domain data is the Fourier transform of the input and output
time-domain signals. For continuous-time signals, the Fourier transform over
the entire time axis is defined as follows:
∞
Y (iw) =
∫
y(t) e−iwt dt
−∞
∞
U (iw) =
1-8
1
2π
∫ u(t)e
−∞
− iwt
dt
Importing Data into the MATLAB® Workspace
In the context of numerical computations, continuous equations are replaced
by their discretized equivalents to handle discrete data values. For a
discrete-time system with a sampling interval T, the frequency-domain output
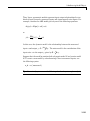
Y(eiw) and input U(eiw) is the time-discrete Fourier transform (TDFT):
N
Y (eiwT ) = T ∑ y(kT ) e−iwkT
k=1
In this example, k = 1,2,...,N, where N is the number of samples in the
sequence.
Note This form only discretizes the time. The frequency is continuous.
When the frequencies are not equally spaced, it is useful to also discretize
the frequencies in the Fourier transform. The resulting discrete Fourier
transform (DFT) of time-domain data is:
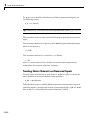
Y (eiwnT ) =
N
∑ y(kT )e−iw kT
n
k=1
2πn
wn =
T
n = 0, 1, 2,…, N − 1
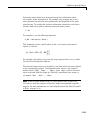
The DFT is useful because it can be calculated very efficiently using the fast
Fourier transform (FFT) method. Fourier transforms of the input and output
data are complex values.
How to Import Frequency-Domain Data into MATLAB
You must import your frequency-domain data as the following variables:
• Input data
-
For single-input/single-output (SISO) data, the input must be a column
vector.
-
For a data set with Nu inputs and Nf frequencies, the input is an
Nf-by-Nu matrix.
1-9
1
Data Processing
• Output data
-
For single-input/single-output (SISO) data, the output must be a column
vector.
-
For a data set with Ny outputs and Nf frequencies, the output is an
Nf-by-Ny matrix.
• Frequency values
Must be a column vector.
For more information about importing data into the MATLAB workspace, see
the MATLAB documentation.
After you import data, you can import it into the System Identification
Tool GUI or create a data object for working at the command line. For
more information about importing data into the GUI, see “Importing
Frequency-Domain Data into the GUI” on page 1-18. To learn more about
creating a data object, see “Representing Time- and Frequency-Domain Data
Using iddata Objects” on page 1-47.
Importing Frequency-Response Data into MATLAB
• “What Is Frequency-Response Data?” on page 1-10
• “How to Import Frequency-Response Data into the Software” on page 1-11
What Is Frequency-Response Data?
Frequency-response data, also called frequency-function data, consists of
complex frequency-response values for a linear system characterized by
its transfer function G. You can measure frequency-response data values
directly using a spectrum analyzer, for example, which provides a compact
representation of the input and the output (compared to storing input and
output independently).
The transfer function G is an operator that takes the input u of a linear
system to the output y:
y = Gu
1-10
Importing Data into the MATLAB® Workspace
For a continuous-time system, the transfer function relates the Laplace
transforms of the input U(s) and output Y(s):
Y (s) = G(s)U (s)
In this case, the frequency function G(iw) is the transfer function evaluated
on the imaginary axis s=iw.
For a discrete-time system sampled with a time interval T, the transfer
function relates the Z-transforms of the input U(z) and output Y(z):
Y ( z) = G( z)U ( z)
In this case, the frequency function G(eiwT) is the transfer function G(z)
evaluated on the unit circle. The argument of the frequency function G(eiwT)
is scaled by the sampling interval T to make the frequency function periodic
with the sampling frequency 2π T .
For a sinusoidal input to the system, the output is also a sinusoid with the
same frequency. The frequency-response data magnifies the amplitude of
the input by G and shifts its phase by ϕ = arg G . Because the frequency
function is evaluated at the sinusoid frequency, the values of the frequency
function at a specific frequency describe the response of the linear system to
an input at that frequency.
Frequency-response data represents a (nonparametric) model of the
relationship between the input and the outputs as a function of frequency.
You might use such a model, which consists of a table of values, to study
the system frequency response. However, you cannot use this model for
simulation and prediction and must create a parametric model from the
frequency-response data.
How to Import Frequency-Response Data into the Software
There are two ways to represent frequency-response data for system
identification. The first approach lets you manipulate the data using both
System Identification Tool GUI and the command line. The second approach
is only used for working with data in the System Identification Tool GUI.
1-11
1
Data Processing
You must import your frequency-response data into the MATLAB workspace
as the following variables:
• In System Identification Tool GUI or MATLAB Command Window,
represent complex-valued G(eiw).
For single-input single-output (SISO) systems, the frequency function is
a column vector.
For a data set with Nu inputs, Ny outputs, and Nf frequencies, the frequency
function is an Ny-by-Nu-by-Nf array.
• In System Identification Tool GUI only, represent amplitude G and phase
shift ϕ = arg G .
For single-input single-output (SISO) systems, the amplitude and the
phase must each be a column vector.
For a data set with Nu inputs, Ny outputs, and Nf frequencies, the amplitude
and the phase must each be an Ny-by-Nu-by-Nf array.
• Frequency values must be a column vector.
For more information about importing data into the MATLAB workspace, see
the MATLAB documentation.
After you import data into the MATLAB workspace, you can import it into
the System Identification Tool GUI or create a data object for working at the
command line. For more information about importing data into the GUI, see
“Importing Frequency-Response Data into the GUI” on page 1-21. To learn
more about creating a data object, see “Representing Frequency-Response
Data Using idfrd Objects” on page 1-67.
1-12
Representing Data in the GUI
Representing Data in the GUI
In this section...
“Types of Data You Can Import into the GUI” on page 1-13
“Importing Time-Domain Data into the GUI” on page 1-15
“Importing Frequency-Domain Data into the GUI” on page 1-18
“Importing Frequency-Response Data into the GUI” on page 1-21
“Importing Data Objects into the GUI” on page 1-25
“Specifying the Data Sampling Interval” on page 1-28
“Specifying Estimation and Validation Data” on page 1-29
“Preprocessing Data Using Quick Start” on page 1-30
“Creating Data Sets from a Subset of Signal Channels” on page 1-31
“Creating Multiexperiment Data Sets in the GUI” on page 1-33
“Viewing Data Properties” on page 1-40
“Renaming Data and Changing Display Color” on page 1-41
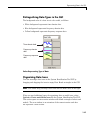
“Distinguishing Data Types in the GUI” on page 1-43
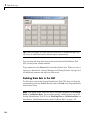
“Organizing Data Icons” on page 1-43
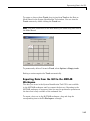
“Deleting Data Sets in the GUI” on page 1-44
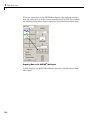
“Exporting Data from the GUI to the MATLAB Workspace” on page 1-45
Types of Data You Can Import into the GUI
You can import the following types of data from the MATLAB workspace into
the System Identification Tool GUI:
• “Importing Time-Domain Data into the GUI” on page 1-15
• “Importing Frequency-Domain Data into the GUI” on page 1-18
• “Importing Frequency-Response Data into the GUI” on page 1-21
• “Importing Data Objects into the GUI” on page 1-25
1-13
1
Data Processing
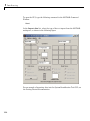
To open the GUI, type the following command in the MATLAB Command
Window:
ident
In the Import data list, select the type of data to import from the MATLAB
workspace, as shown in the following figure.
For an example of importing data into the System Identification Tool GUI, see
the Getting Started documentation.
1-14
Representing Data in the GUI
Importing Time-Domain Data into the GUI
Before you can import time-domain data into the System Identification Tool
GUI, you must import the data into the MATLAB workspace, as described in
“Importing Time-Domain Data into MATLAB” on page 1-6.
Note Your time-domain data must be sampled at equal time intervals. The
input and output signals must have the same number of data samples.
To import data into the GUI:
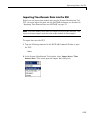
1 Type the following command in the MATLAB Command Window to open
the GUI:
ident
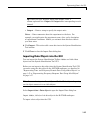
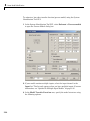
2 In the System Identification Tool window, select Import data > Time
domain data. This action opens the Import Data dialog box.
1-15
1
Data Processing
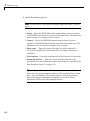
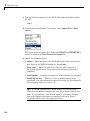
3 Specify the following options:
Note For time series, only import the output signal and enter [] for the
input.
• Input — Enter the MATLAB variable name (column vector or matrix)
or a MATLAB expression that represents the input data. The expression
must evaluate to a column vector or matrix.
• Output — Enter the MATLAB variable name (column vector or
matrix) or a MATLAB expression that represents the output data. The
expression must evaluate to a column vector or matrix.
• Data name — Enter the name of the data set, which appears in
the System Identification Tool window after the import operation is
completed.
• Starting time — Enter the starting value of the time axis for time plots.
• Sampling interval — Enter the actual sampling interval in the
experiment. For more information about this setting, see “Specifying the
Data Sampling Interval” on page 1-28.
Tip The System Identification Toolbox product uses the sampling
interval during model estimation and to set the horizontal axis on time
plots. If you transform a time-domain signal to a frequency-domain
signal, the Fourier transforms are computed as discrete Fourier
transforms (DFTs) using this sampling interval.
1-16
Representing Data in the GUI
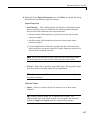
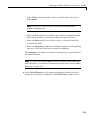
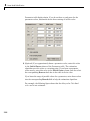
4 (Optional) In the Data Information area, click More to expand the dialog
box and enter the following settings:
Input Properties
• InterSample — This setting specifies the behavior of the input signals
between samples when you transform the resulting models between
discrete-time and continuous-time representations.
– zoh (zero-order hold) maintains a piecewise-constant input signal
between samples.
– foh (first-order hold) maintains a piecewise-linear input signal
between samples.
– bl (bandwidth-limited behavior) specifies that the continuous-time
input signal has zero power above the Nyquist frequency (equal to the
inverse of the sampling interval).
Note See the d2c and c2d reference pages for more information about
transforming between discrete-time and continuous-time models.
• Period — Enter Inf to specify a nonperiodic input. For a periodic input,
type the period of the input signal in your experiment.
Note If your data is periodic, always include a whole number of periods
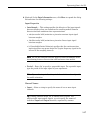
for model estimation.
Channel Names
• Input — Enter a string to specify the name of one or more input
channels.
Tip Naming channels helps you to identify data in plots. For
multivariable input-output signals, you can specify the names of
individual Input and Output channels, separated by commas.
1-17
1
Data Processing
• Output — Enter a string to specify the name of one or more output
channels.
Physical Units of Variables
• Input — Enter a string to specify the input units.
Tip When you have multiple inputs and outputs, enter a
comma-separated list of Input and Output units corresponding to each
channel.
• Output — Enter a string to specify the output units.
Notes — Enter comments about the experiment or the data. For
example, you might enter the experiment name, date, and a description
of experimental conditions. Models you estimate from this data inherit
your data notes.
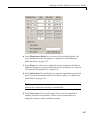
5 Click Import. This action adds a new data icon to the System Identification
Tool window.
6 Click Close to close the Import Data dialog box.
Importing Frequency-Domain Data into the GUI
Frequency-domain data consists of Fourier transforms of time-domain data (a
function of frequency).
Before you can import frequency-domain data into the System Identification
Tool GUI, you must import the data into the MATLAB workspace, as
described in “Importing Frequency-Domain Data into MATLAB” on page 1-8.
Note The input and output signals must have the same number of data
samples.
To import data into the GUI:
1-18
Representing Data in the GUI
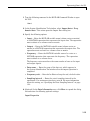
1 Type the following command in the MATLAB Command Window to open
the GUI:
ident
2 In the System Identification Tool window, select Import data > Freq.
domain data. This action opens the Import Data dialog box.
3 Specify the following options:
• Input — Enter the MATLAB variable name (column vector or matrix)
or a MATLAB expression that represents the input data. The expression
must evaluate to a column vector or matrix.
• Output — Enter the MATLAB variable name (column vector or
matrix) or a MATLAB expression that represents the output data. The
expression must evaluate to a column vector or matrix.
• Frequency — Enter the MATLAB variable name of a vector or a
MATLAB expression that represents the frequency. The expression
must evaluate to a column vector.
The frequency vector must have the same number of rows as the input
and output signals.
• Data name — Enter the name of the data set, which appears in
the System Identification Tool window after the import operation is
completed.
• Frequency unit — Enter Hz for Hertz or keep the rad/s default value.
• Sampling interval — Enter the actual sampling interval in the
experiment. For continuous-time data, enter 0. For more information
about this setting, see “Specifying the Data Sampling Interval” on page
1-28.
4 (Optional) In the Data Information area, click More to expand the dialog
box and enter the following optional settings:
Input Properties
1-19
1
Data Processing
• InterSample — This setting specifies the behavior of the input signals
between samples when you transform the resulting models between
discrete-time and continuous-time representations.
– zoh (zero-order hold) maintains a piecewise-constant input signal
between samples.
– foh (first-order hold) maintains a piecewise-linear input signal
between samples.
– bl (bandwidth-limited behavior) specifies that the continuous-time
input signal has zero power above the Nyquist frequency (equal to the
inverse of the sampling interval).
Note See the d2c and c2d reference page for more information about
transforming between discrete-time and continuous-time models.
• Period — Enter Inf to specify a nonperiodic input. For a periodic input,
type the period of the input signal in your experiment.
Note If your data is periodic, always include a whole number of periods
for model estimation.
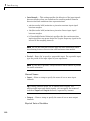
Channel Names
• Input — Enter a string to specify the name of one or more input
channels.
Tip Naming channels helps you to identify data in plots. For
multivariable input and output signals, you can specify the names of
individual Input and Output channels, separated by commas.
• Output — Enter a string to specify the name of one or more output
channels.
Physical Units of Variables
1-20
Representing Data in the GUI
• Input — Enter a string to specify the input units.
Tip When you have multiple inputs and outputs, enter a
comma-separated list of Input and Output units corresponding to each
channel.
• Output — Enter a string to specify the output units.
Notes — Enter comments about the experiment or the data. For
example, you might enter the experiment name, date, and a description
of experimental conditions. Models you estimate from this data inherit
your data notes.
5 Click Import. This action adds a new data icon to the System Identification
Tool window.
6 Click Close to close the Import Data dialog box.
Importing Frequency-Response Data into the GUI
• “Prerequisite” on page 1-21
• “Importing Complex-Valued Frequency-Response Data” on page 1-21
• “Importing Amplitude and Phase Frequency-Response Data” on page 1-23
Prerequisite
Before you can import frequency-response data into the System Identification
Tool GUI, you must import the data into the MATLAB workspace, as described
in “Importing Frequency-Response Data into MATLAB” on page 1-10.
Importing Complex-Valued Frequency-Response Data
To import frequency-response data consisting of complex-valued frequency
values at specified frequencies:
1 Type the following command in the MATLAB Command Window to open
the GUI:
1-21
1
Data Processing
ident
2 In the System Identification Tool window, select Import data > Freq.
domain data. This action opens the Import Data dialog box.
3 In the Data Format for Signals list, select Freq. Function (Complex).
4 Specify the following options:
• Freq. Func. — Enter the MATLAB variable name or a MATLAB
expression that represents the complex frequency-response data G(eiw).
• Frequency — Enter the MATLAB variable name of a vector or a
MATLAB expression that represents the frequency. The expression
must evaluate to a column vector.
• Data name — Enter the name of the data set, which appears in
the System Identification Tool window after the import operation is
completed.
• Frequency unit — Enter Hz for Hertz or keep the rad/s default value.
• Sampling interval — Enter the actual sampling interval in the
experiment. For continuous-time data, enter 0. For more information
about this setting, see “Specifying the Data Sampling Interval” on page
1-28.
5 (Optional) In the Data Information area, click More to expand the dialog
box and enter the following optional settings:
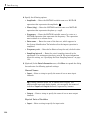
Channel Names
• Input — Enter a string to specify the name of one or more input
channels.
Tip Naming channels helps you to identify data in plots. For
multivariable input and output signals, you can specify the names of
individual Input and Output channels, separated by commas.
• Output — Enter a string to specify the name of one or more output
channels.
1-22
Representing Data in the GUI
Physical Units of Variables
• Input — Enter a string to specify the input units.
Tip When you have multiple inputs and outputs, enter a
comma-separated list of Input and Output units corresponding to each
channel.
• Output — Enter a string to specify the output units.
Notes — Enter comments about the experiment or the data. For
example, you might enter the experiment name, date, and a description
of experimental conditions. Models you estimate from this data inherit
your data notes.
6 Click Import. This action adds a new data icon to the System Identification
Tool window.
7 Click Close to close the Import Data dialog box.
Importing Amplitude and Phase Frequency-Response Data
To import frequency-response data consisting of amplitude and phase values
at specified frequencies:
1 Type the following command in the MATLAB Command Window to open
the GUI:
ident
2 In the System Identification Tool window, select Import data > Freq.
domain data. This action opens the Import Data dialog box.
3 In the Data Format for Signals list, select Freq. Function
(Amp/Phase).
1-23
1
Data Processing
4 Specify the following options:
• Amplitude — Enter the MATLAB variable name or a MATLAB
expression that represents the amplitude G .
• Phase (deg) — Enter the MATLAB variable name or a MATLAB
expression that represents the phase ϕ = arg G .
• Frequency — Enter the MATLAB variable name of a vector or a
MATLAB expression that represents the frequency. The expression
must evaluate to a column vector.
• Data name — Enter the name of the data set, which appears in
the System Identification Tool window after the import operation is
completed.
• Frequency unit — Enter Hz for Hertz or keep the rad/s default value.
• Sampling interval — Enter the actual sampling interval in the
experiment. For continuous-time data, enter 0. For more information
about this setting, see “Specifying the Data Sampling Interval” on page
1-28.
5 (Optional) In the Data Information area, click More to expand the dialog
box and enter the following optional settings:
Channel Names
• Input — Enter a string to specify the name of one or more input
channels.
Tip Naming channels helps you to identify data in plots. For
multivariable input and output signals, you can specify the names of
individual Input and Output channels, separated by commas.
• Output — Enter a string to specify the name of one or more output
channels.
Physical Units of Variables
• Input — Enter a string to specify the input units.
1-24
Representing Data in the GUI
Tip When you have multiple inputs and outputs, enter a
comma-separated list of Input and Output units corresponding to each
channel.
• Output — Enter a string to specify the output units.
Notes — Enter comments about the experiment or the data. For
example, you might enter the experiment name, date, and a description
of experimental conditions. Models you estimate from this data inherit
your data notes.
6 Click Import. This action adds a new data icon to the System Identification
Tool window.
7 Click Close to close the Import Data dialog box.
Importing Data Objects into the GUI
You can import the System Identification Toolbox iddata and idfrd data
objects into the System Identification Tool GUI.
Before you can import a data object into the System Identification Tool GUI,
you must create the data object in the MATLAB workspace, as described in
“Representing Time- and Frequency-Domain Data Using iddata Objects” on
page 1-47 or “Representing Frequency-Response Data Using idfrd Objects”
on page 1-67.
Note You can also import a Control System Toolbox™ frd object. Importing
an frd object converts it to an idfrd object.
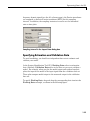
Select Import data > Data object to open the Import Data dialog box.
Import iddata, idfrd, or frd data object in the MATLAB workspace.
To import a data object into the GUI:
1-25
1
Data Processing
1 Type the following command in the MATLAB Command Window to open
the GUI:
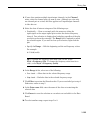
ident
2 In the System Identification Tool window, select Import data > Data
object.
This action opens the Import Data dialog box. IDDATA or IDFRD/FRD is
already selected in the Data Format for Signals list.
3 Specify the following options:
• Object — Enter the name of the MATLAB variable that represents the
data object in the MATLAB workspace. Press Enter.
• Data name — Enter the name of the data set, which appears in
the System Identification Tool window after the import operation is
completed.
• Starting time — Enter the starting value of the time axis for time plots.
• Sampling interval — Enter the actual sampling interval in the
experiment. For more information about this setting, see “Specifying the
Data Sampling Interval” on page 1-28.
Tip The System Identification Toolbox product uses the sampling
interval during model estimation and to set the horizontal axis on time
plots. If you transform a time-domain signal to a frequency-domain
signal, the Fourier transforms are computed as discrete Fourier
transforms (DFTs) using this sampling interval.
1-26
Representing Data in the GUI
4 (Optional) In the Data Information area, click More to expand the dialog
box and enter the following optional settings:
Input Properties
• InterSample — This setting specifies the behavior of the input signals
between samples when you transform the resulting models between
discrete-time and continuous-time representations.
– zoh (zero-order hold) maintains a piecewise-constant input signal
between samples.
– foh (first-order hold) maintains a piecewise-linear input signal
between samples.
– bl (bandwidth-limited behavior) specifies that the continuous-time
input signal has zero power above the Nyquist frequency (equal to the
inverse of the sampling interval).
Note See the d2c and c2d reference page for more information about
transforming between discrete-time and continuous-time models.
• Period — Enter Inf to specify a nonperiodic input. For a periodic input,
type the period of the input signal in your experiment.
Note If your data is periodic, always include a whole number of periods
for model estimation.
Channel Names
• Input — Enter a string to specify the name of one or more input
channels.
Tip Naming channels helps you to identify data in plots. For
multivariable input and output signals, you can specify the names of
individual Input and Output channels, separated by commas.
1-27
1
Data Processing
• Output — Enter a string to specify the name of one or more output
channels.
Physical Units of Variables
• Input — Enter a string to specify the input units.
Tip When you have multiple inputs and outputs, enter a
comma-separated list of Input and Output units corresponding to each
channel.
• Output — Enter a string to specify the output units.
Notes — Enter comments about the experiment or the data. For
example, you might enter the experiment name, date, and a description
of experimental conditions. Models you estimate from this data inherit
your data notes.
5 Click Import. This action adds a new data icon to the System Identification
Tool window.
6 Click Close to close the Import Data dialog box.
Specifying the Data Sampling Interval
When you import data into the GUI, you must specify the data sampling
interval.
The sampling interval is the time between successive data samples in your
experiment and must be the numerical time interval at which your data is
sampled in any units. For example, enter 0.5 if your data was sampled every
0.5 s, and enter 1 if your data was sampled every 1 s.
You can also use the sampling interval as a flag to specify continuous-time
data. When importing continuous-time frequency domain or
frequency-response data, set the Sampling interval to 0.
The sampling interval is used during model estimation. For time-domain
data, the sampling interval is used together with the start time to calculate
the sampling time instants. When you transform time-domain signals to
1-28
Representing Data in the GUI
frequency-domain signals (see the fft reference page), the Fourier transforms
are computed as discrete Fourier transforms (DFTs) for this sampling
interval. In addition, the sampling instants are used to set the horizontal
axis on time plots.
Sampling Interval in the Import Data dialog box
Specifying Estimation and Validation Data
To avoid overfitting, you should use independent data sets to estimate and
validate your model.
In the System Identification Tool GUI, Working Data refers to estimation
data. Similarly, Validation Data refers to the data set you use to validate a
model. For example, when you plot the model output and residual-analysis
plots, the input to the model is the input signal from the validation data set.
These plots compare model output to the measured output in the validation
data set.
To specify Working Data, drag and drop the corresponding data icon into the
Working Data rectangle, as shown in the following figure.
1-29
1
Data Processing
Similarly, to specify Validation Data, drag and drop the corresponding data
icon into the Validation Data rectangle.
Preprocessing Data Using Quick Start
As a preprocessing shortcut, select Preprocess > Quick start to
simultaneously perform the following four actions:
• Subtract the mean value from each channel.
Note For information about when to subtract mean values from the data,
see “Subtracting Trends from Signals (Detrending)” on page 1-94.
• Split data into two parts.
• Specify the first part as estimation data for models (or Working Data).
• Specify the second part as Validation Data.
1-30
Representing Data in the GUI
Creating Data Sets from a Subset of Signal Channels
You can create a new data set in the System Identification Tool GUI by
extracting subsets of input and output channels from an existing data set.
To create a new data set from selected channels:
1 In the System Identification Tool GUI, drag the icon of the data from which
you want to select channels to the Working Data rectangle.
2 Select Preprocess > Select channels to open the Select Channels dialog
box.
The Inputs list displays the input channels and the Outputs list displays
the output channels in the selected data set.
1-31
1
Data Processing
3 In the Inputs list, select one or more channels in any of following ways:
• Select one channel by clicking its name.
• Select adjacent channels by pressing the Shift key while clicking the
first and last channel names.
• Select nonadjacent channels by pressing the Ctrl key while clicking
each channel name.
Tip To exclude input channels and create time-series data, clear all
selections by holding down the Ctrl key and clicking each selection. To
reset selections, click Revert.
4 In the Outputs list, select one or more channels in any of following ways:
• Select one channel by clicking its name.
• Select adjacent channels by pressing the Shift key while clicking the
first and last channel names.
• Select nonadjacent channels by pressing the Ctrl key while clicking
each channel name.
Tip To reset selections, click Revert.
5 In the Data name field, type the name of the new data set. Use a name
that is unique in the Data Board.
6 Click Insert to add the new data set to the Data Board in the System
Identification Tool GUI.
7 Click Close.
1-32
Representing Data in the GUI
Creating Multiexperiment Data Sets in the GUI
• “Why Create Multiexperiment Data?” on page 1-33
• “Limitations on Data Sets” on page 1-33
• “Merging Data Sets” on page 1-33
• “Extracting Specific Experiments from a Multiexperiment Data Set into a
New Data Set” on page 1-37
Why Create Multiexperiment Data?
You can create a time-domain or frequency-domain data set in the System
Identification Tool GUI that includes several experiments. Identifying models
for multiexperiment data results in an average model.
Experiments can mean data that was collected during different sessions, or
portions of the data collected during a single session. In the latter situation,
you can create multiexperiment data by splitting a single data set into
multiple segments that exclude corrupt data, and then merge the good data
segments.
Limitations on Data Sets
You can only merge data sets that have all of the following characteristics:
• Same number of input and output channels.
• Different names. The name of each data set becomes the experiment name
in the merged data set.
• Same input and output channel names.
• Same data domain (that is, time-domain data or frequency-domain data
only).
Merging Data Sets
You can merge data sets using the System Identification Tool GUI.
1-33
1
Data Processing
Note Before merging several segments of the same data set, verify that
the time vector of each data starts at the time when that data segment was
actually measured (relative to the other data sets).
For example, suppose that you want to combine the data sets tdata, tdata2,
tdata3, tdata4 shown in the following figure.
GUI Contains Four Data Sets to Merge
1-34
Representing Data in the GUI
To merge data sets in the GUI:
1 In the Operations area, select <–Preprocess > Merge experiments
from the drop-down menu to open the Merge Experiments dialog box.
1-35
1
Data Processing
2 In the System Identification Tool window, drag a data set icon to the Merge
Experiments dialog box (to the drop them here to be merged rectangle).
The name of the data set is added to the List of sets.
tdata and tdata2 to Be Merged
Tip To empty the list, click Revert.
3 Repeat step 2 for each data set you want to merge. Go to the next step
after adding data sets.
4 In the Data name field, type the name of the new data set. This name
must be unique in the Data Board.
1-36
Representing Data in the GUI
5 Click Insert to add the new data set to the Data Board in the System
Identification Tool window.
Data Board Now Contains tdatam with Merged Experiments
6 Click Close to close the Merge Experiments dialog box.
Tip To get information about a data set in the System Identification Tool
GUI, right-click the data icon to open the Data/model Info dialog box.
Extracting Specific Experiments from a Multiexperiment Data
Set into a New Data Set
When a data set already consists of several experiments, you can extract
one or more of these experiments into a new data set, using the System
Identification Tool GUI.
For example, suppose that tdatam consists of four experiments.
To create a new data set that includes only the first and third experiments
in this data set:
1-37
1
Data Processing
1 In the System Identification Tool window, drag and drop the tdatam data
icon to the Working Data rectangle.
tdatam Is Set to Working Data
2 In the Operations area, select Preprocess > Select experiments from
the drop-down menu to open the Select Experiment dialog box.
1-38
Representing Data in the GUI
3 In the Experiments list, select one or more data sets in either of the
following ways:
• Select one data set by clicking its name.
• Select adjacent data sets by pressing the Shift key while clicking the
first and last names.
• Select nonadjacent data sets by pressing the Ctrl key while clicking
each name.
4 In the Data name field, type the name of the new data set. This name
must be unique in the Data Board.
5 Click Insert to add the new data set to the Data Board in the System
Identification Tool GUI.
6 Click Close to close the Select Experiment dialog box.
1-39
1
Data Processing
Viewing Data Properties
You can get information about each data set in the System Identification Tool
GUI by right-clicking the corresponding data icon.
The Data/model Info dialog box opens. This dialog box describes the contents
and the properties of the corresponding data set. It also displays any
associated notes and the command-line equivalent of the operations you used
to create this data.
Tip To view or modify properties for several data sets, keep this window
open and right-click each data set in the System Identification Tool GUI. The
Data/model Info dialog box updates as you select each data set.
Data object
description
History of
syntax that
created this
object
1-40
Representing Data in the GUI
To displays the data properties in the MATLAB Command Window, click
Present.
Renaming Data and Changing Display Color
You can rename data and change its display color by double-clicking the data
icon in the System Identification Tool GUI.
The Data/model Info dialog box opens. This dialog box describes both the
contents and the properties of the data. The object description area displays
the syntax of the operations you used to create the data in the GUI.
The Data/model Info dialog box also lets you rename the data by entering a
new name in the Data name field.
You can also specify a new display color using three RGB values in the Color
field. Each value is between 0 to 1 and indicates the relative presence of
red, green, and blue, respectively. For more information about specifying
default data color, see “Customizing the System Identification Tool GUI” on
page 12-21.
Tip As an alternative to using three RGB values, you can enter any one of
the following letters in single quotes:
'y' 'r' 'b' 'c' 'g' 'm' 'k'
These strings represent yellow, red, blue, cyan, green, magenta, and black,
respectively.
1-41
1
Data Processing
Data object
description
History of
syntax that
created this
object
Information About the Data
You can enter comments about the origin and state of the data in the Diary
And Notes area. For example, you might want to include the experiment
name, date, and the description of experimental conditions. When you
estimate models from this data, these notes are associated with the models.
Clicking Present display the portions of this information in the MATLAB
Command Window.
1-42
Representing Data in the GUI
Distinguishing Data Types in the GUI
The background color of a data icon is color-coded, as follows:
• White background represents time-domain data.
• Blue background represents frequency-domain data.
• Yellow background represents frequency-response data.
Time-domain data
Frequency-domain
data
Frequency-response
data
Colors Representing Type of Data
Organizing Data Icons
You can rearrange data icons in the System Identification Tool GUI by
dragging and dropping the icons to empty Data Board rectangles in the GUI.
Note You cannot drag and drop a data icon into the model area on the right.
When you need additional space for organizing data or model icons, select
Options > Extra model/data board in the System Identification Tool GUI.
This action opens an extra session window with blank rectangles for data and
models. The new window is an extension of the current session and does
not represent a new session.
1-43
1
Data Processing
Tip When you import or create data sets and there is insufficient space for
the icons, an additional session window opens automatically.
You can drag and drop data between the main System Identification Tool
GUI and any extra session windows.
Type comments in the Notes field to describe the data sets. When you save a
session, as described in “Saving, Merging, and Closing Sessions” on page 12-6,
all additional windows and notes are also saved.
Deleting Data Sets in the GUI
To delete data sets in the System Identification Tool GUI, drag and drop the
corresponding icon into Trash. Moving items to Trash does not permanently
delete these items.
Note You cannot delete a data set that is currently designated as Working
Data or Validation Data. You must first specify a different data set in the
System Identification Tool GUI to be Working Data or Validation Data, as
described in “Specifying Estimation and Validation Data” on page 1-29.
1-44
Representing Data in the GUI
To restore a data set from Trash, drag its icon from Trash to the Data or
Model Board in the System Identification Tool window. You can view the
Trash contents by double-clicking the Trash icon.
Note You must restore data to the Data Board; you cannot drag data icons to
the Model Board.
To permanently delete all items in Trash, select Options > Empty trash.
Exiting a session empties the Trash automatically.
Exporting Data from the GUI to the MATLAB
Workspace
The data you create in the System Identification Tool GUI is not available
in the MATLAB workspace until you export the data set. Exporting to the
MATLAB workspace is necessary when you need to perform an operation on
the data that is only available at the command line.
To export a data set to the MATLAB workspace, drag and drop the
corresponding icon to the To Workspace rectangle.
1-45
1
Data Processing
When you export data to the MATLAB workspace, the resulting variables
have the same name as in the System Identification Tool GUI. For example,
the following figure shows how to export the time-domain data object data.
Exporting Data to the MATLAB® Workspace
In this example, the MATLAB workspace contains a variable named data
after export.
1-46
Representing Time- and Frequency-Domain Data Using iddata Objects
Representing Time- and Frequency-Domain Data Using
iddata Objects
In this section...
“iddata Constructor” on page 1-47
“iddata Properties” on page 1-50
“Creating Multiexperiment Data at the Command Line” on page 1-53
“Subreferencing iddata Objects” on page 1-55
“Modifying Time and Frequency Vectors” on page 1-59
“Naming, Adding, and Removing Data Channels” on page 1-63
“Concatenating iddata Objects” on page 1-65
iddata Constructor
• “Requirements for Constructing an iddata Object” on page 1-47
• “Constructing an iddata Object for Time-Domain Data” on page 1-48
• “Constructing an iddata Object for Frequency-Domain Data” on page 1-49
Requirements for Constructing an iddata Object
To construct an iddata object, you must have already imported data into the
MATLAB workspace, as described in “Importing Data into the MATLAB
Workspace” on page 1-5.
1-47
1
Data Processing
Constructing an iddata Object for Time-Domain Data
Use the following syntax to create a time-domain iddata object data:
data = iddata(y,u,Ts)
You can also specify additional properties, as follows:
data = iddata(y,u,Ts,'Property1',Value1,...,'PropertyN',ValueN)
For more information about accessing object properties, see “iddata
Properties” on page 1-50.
In this example, Ts is the sampling time, or the time interval, between
successive data samples. For uniformly sampled data, Ts is a scalar value
equal to the sampling interval of your experiment. The default time unit is
seconds, but you can specify any unit string using the TimeUnit property.
For more information about iddata time properties, see “Modifying Time
and Frequency Vectors” on page 1-59.
For nonuniformly sampled data, specify Ts as [], and set the value of the
SamplingInstants property as a column vector containing individual time
values. For example:
data = iddata(y,u,Ts,[],'SamplingInstants',TimeVector)
Where TimeVector represents a vector of time values.
Note You can modify the property SamplingInstants by setting it to a new
vector with the length equal to the number of data samples.
To represent time-series data, use the following syntax:
ts_data = iddata(y,[],Ts)
where y is the output data, [] indicates empty input data, and Ts is the
sampling interval.
1-48
Representing Time- and Frequency-Domain Data Using iddata Objects
The following example shows how to create an iddata object using
single-input/single-output (SISO) data from dryer2.mat. The input and
output each contain 1000 samples with the sampling interval of 0.08 second.
load dryer2
data = iddata(y2,u2,0.08)
% Load input u2 and output y2.
% Create iddata object.
MATLAB returns the following output:
Time domain data set with 1000 samples.
Sampling interval: 0.08
Outputs
y1
Unit (if specified)
Inputs
u1
Unit (if specified)
The default channel name 'y1' is assigned to the first and only output
channel. When y2 contains several channels, the channels are assigned
default names 'y1','y2','y2',...,'yn'. Similarly, the default channel
name 'u1' is assigned to the first and only output channel. For more
information about naming channels, see “Naming, Adding, and Removing
Data Channels” on page 1-63.
Constructing an iddata Object for Frequency-Domain Data
Frequency-domain data is the Fourier transform of the input and output
signals at specific frequency values. To represent frequency-domain data, use
the following syntax to create the iddata object:
data = iddata(y,u,Ts,'Frequency',w)
'Frequency' is an iddata property that specifies the frequency values w,
where w is the frequency column vector that defines the frequencies for
calculating the Fourier transform values of y and u. Ts is the time interval
between successive data samples in seconds. w, y, and u have the same
number of rows.
1-49
1
Data Processing
Note You must specify the frequency vector for frequency-domain data.
For more information about iddata time and frequency properties, see
“Modifying Time and Frequency Vectors” on page 1-59.
To specify a continuous-time system, set Ts to 0.
You can specify additional properties when you create the iddata object, as
follows:
data = iddata(y,u,Ts,'Property1',Value1,...,'PropertyN',ValueN)
For more information about accessing object properties, see “iddata
Properties” on page 1-50.
iddata Properties
To view the properties of the iddata object, use the get command. For
example, type the following commands at the prompt:
load dryer2
data = iddata(y2,u2,0.08);
get(data)
1-50
% Load input u2 and output y2
% Create iddata object
% Get property values of data
Representing Time- and Frequency-Domain Data Using iddata Objects
MATLAB returns the following object properties and values:
Domain:
Name:
OutputData:
y:
OutputName:
OutputUnit:
InputData:
u:
InputName:
InputUnit:
Period:
InterSample:
Ts:
Tstart:
SamplingInstants:
TimeUnit:
ExperimentName:
Notes:
UserData:
'Time'
[]
[1000x1 double]
'Same as OutputData'
{'y1'}
{''}
[1000x1 double]
'Same as InputData'
{'u1'}
{''}
Inf
'zoh'
0.0800
[]
[1000x0 double]
''
'Exp1'
[]
[]
For a complete description of all properties, see the iddata reference page or
type idprops iddata at the prompt.
You can specify properties when you create an iddata object using the
constructor syntax:
data = iddata(y,u,Ts,'Property1',Value1,...,'PropertyN',ValueN)
To change property values for an existing iddata object, use the set command
or dot notation. For example, to change the sampling interval to 0.05, type
the following at the prompt:
set(data,'Ts',0.05)
or equivalently:
data.ts = 0.05
Property names are not case sensitive. You do not need to type the entire
property name if the first few letters uniquely identify the property.
1-51
1
Data Processing
Tip You can use data.y as an alternative to data.OutputData to access the
output values, or use data.u as an alternative to data.InputData to access
the input values.
An iddata object containing frequency-domain data includes
frequency-specific properties, such as Frequency for the frequency vector and
Units for frequency units (instead of Tstart and SamplingIntervals).
To view the property list, type the following command sequence at the prompt:
% Load input u2 and output y2
load dryer2;
% Create iddata object
data = iddata(y2,u2,0.08);
% Take the Fourier transform of the data
% transforming it to frequency domain
data = fft(data)
% Get property values of data
get(data)
1-52
Representing Time- and Frequency-Domain Data Using iddata Objects
MATLAB returns the following object properties and values:
Domain:
Name:
OutputData:
y:
OutputName:
OutputUnit:
InputData:
u:
InputName:
InputUnit:
Period:
InterSample:
Ts:
Units:
Frequency:
TimeUnit:
ExperimentName:
Notes:
UserData:
'Frequency'
[]
[501x1 double]
'Same as OutputData'
{'y1'}
{''}
[501x1 double]
'Same as InputData'
{'u1'}
{''}
Inf
'zoh'
0.0800
'rad/s'
[501x1 double]
''
'Exp1'
[]
[]
Creating Multiexperiment Data at the Command Line
• “Why Create Multiexperiment Data Sets?” on page 1-53
• “Limitations on Data Sets” on page 1-54
• “Merging Data Sets” on page 1-54
• “Adding Experiments to an Existing iddata Object” on page 1-54
Why Create Multiexperiment Data Sets?
You can create iddata objects that contain several experiments. Identifying
models for an iddata object with multiple experiments results in an average
model.
In the System Identification Toolbox product, experiments can either
mean data collected during different sessions, or portions of the data
collected during a single session. In the latter situation, you can create a
1-53
1
Data Processing
multiexperiment iddata object by splitting the data from a single session into
multiple segments to exclude bad data, and merge the good data portions.
Note The idfrd object does not support the iddata equivalent of
multiexperiment data.
Limitations on Data Sets
You can only merge data sets that have all of the following characteristics:
• Same number of input and output channels.
• Same input and output channel names.
• Same data domain (that is, time-domain data or frequency-domain data).
Merging Data Sets
Create a multiexperiment iddata object by merging iddata objects, where
each contains data from a single experiment or is a multiexperiment data set.
For example, you can use the following syntax to merge data:
load iddata1
% Loads iddata object z1
load iddata3
% Loads iddata object z3
z = merge(z1,z3) % Merges experiments z1 and z3 into
% the iddata object z
These commands create an iddata object that conatains two experiments,
where the experiments are assigned default names 'Exp1' and 'Exp2',
respectively.
Adding Experiments to an Existing iddata Object
You can add experiments individually to an iddata object as an alternative
approach to merging data sets.
For example, to add the experiments in the iddata object dat4 to data, use
the following syntax:
data(:,:,:,'Run4') = dat4
1-54
Representing Time- and Frequency-Domain Data Using iddata Objects
This syntax explicitly assigns the experiment name 'Run4' to the new
experiment. The ExperimentName property of the iddata object stores
experiment names.
For more information about subreferencing experiments in a multiexperiment
data set, see “Subreferencing Experiments” on page 1-58.
Subreferencing iddata Objects
• “Subreferencing Input and Output Data” on page 1-55
• “Subreferencing Data Channels” on page 1-56
• “Subreferencing Experiments” on page 1-58
Subreferencing Input and Output Data
Subreferencing data and its properties lets you select data values and assign
new data and property values.
Use the following general syntax to subreference specific data values in
iddata objects:
data(samples,outputchannels,inputchannels,experimentname)
In this syntax, samples specify one or more sample indexes, outputchannels
and inputchannels specify channel indexes or channel names, and
experimentname specifies experiment indexes or names.
For example, to retrieve samples 5 through 30 in the iddata object data and
store them in a new iddata object data_sub, use the following syntax:
data_sub = data([5:30])
You can also use logical expressions to subreference data. For example, to
retrieve all data values that fall between sample instants 1.27 and 9.3 in the
iddata object data and assign them to data_sub, use the following syntax:
data_sub = data(data.sa>1.27&data.sa<9.3)
1-55
1
Data Processing
Note You do not need to type the entire property name. In this example, sa
in data.sa uniquely identifies the SamplingInstants property.
You can retrieve the input signal from an iddata object using the following
commands:
u = get(data,'InputData')
or
data.InputData
or
data.u
% u is the abbreviation for InputData
Similarly, you can retrieve the output data using
data.OutputData
or
data.y
% y is the abbreviation for OutputData
Subreferencing Data Channels
Use the following general syntax to subreference specific data channels in
iddata objects:
data(samples,outputchannels,inputchannels,experimentname)
In this syntax, samples specify one or more sample indexes, outputchannels
and inputchannels specify channel indexes or channel names, and
experimentname specifies experiment indexes or names.
To specify several channel names, you must use a cell array of name strings.
1-56
Representing Time- and Frequency-Domain Data Using iddata Objects
For example, suppose the iddata object data contains three output channels
(named y1, y2, and y3), and four input channels (named u1, u2, u3, and u4).
To select all data samples in y3, u1, and u4, type the following command at
the prompt:
% Use a cell array to reference
% input channels 'u1' and 'u4'
data_sub = data(:,'y3',{'u1','u4'})
or equivalently
% Use channel indexes 1 and 4
% to reference the input channels
data_sub = data(:,3,[1 4])
Tip Use a colon (:) to specify all samples or all channels, and the empty
matrix ([]) to specify no samples or no channels.
If you want to create a time-series object by extracting only the output data
from an iddata object, type the following command:
data_ts = data(:,:,[])
You can assign new values to subreferenced variables. For example, the
following command assigns the first 10 values of output channel 1 of data to
values in samples 101 through 110 in the output channel 2 of data1. It also
assigns the first 10 values of input channel 1 of data to values in samples 101
through 110 in the input channel 3 of data1.
data(1:10,1,1) = data1(101:110,2,3)
1-57
1
Data Processing
Subreferencing Experiments
Use the following general syntax to subreference specific experiments in
iddata objects:
data(samples,outputchannels,inputchannels,experimentname)
In this syntax, samples specify one or more sample indexes, outputchannels
and inputchannels specify channel indexes or channel names, and
experimentname specifies experiment indexes or names.
When specifying several experiment names, you must use a cell array of name
strings. The iddata object stores experiments name in the ExperimentName
property.
For example, suppose the iddata object data contains five experiments with
default names, Exp1, Exp2, Exp3, Exp4, and Exp5. Use the following syntax to
subreference the first and fifth experiment in data:
data_sub = data(:,:,:,{'Exp1','Exp5'}) % Using experiment name
or
data_sub = data(:,:,:,[1 5])
% Using experiment index
Tip Use a colon (:) to denote all samples and all channels, and the empty
matrix ([]) to specify no samples and no channels.
Alternatively, you can use the getexp command. The following example
shows how to subreference the first and fifth experiment in data:
data_sub = getexp(data,{'Exp1','Exp5'}) % Using experiment name
or
data_sub = getexp(data,[1 5])
% Using experiment index
The following example shows how to retrieve the first 100 samples of output
channels 2 and 3 and input channels 4 to 8 of Experiment 3:
dat(1:100,[2,3],[4:8],3)
1-58
Representing Time- and Frequency-Domain Data Using iddata Objects
Modifying Time and Frequency Vectors
The iddata object stores time-domain data or frequency-domain data and has
several properties that specify the time or frequency values. To modify the
time or frequency values, you must change the corresponding property values.
Note You can modify the property SamplingInstants by setting it to a
new vector with the length equal to the number of data samples. For more
information, see “Constructing an iddata Object for Time-Domain Data” on
page 1-48.
The following tables summarize time-vector and frequency-vector properties,
respectively, and provides usage examples. In each example, data is an
iddata object.
Note Property names are not case sensitive. You do not need to type the
entire property name if the first few letters uniquely identify the property.
iddata Time-Vector Properties
Property
Description
Syntax Example
Ts
Sampling time interval.
To set the sampling
interval to 0.05:
• For a single
experiment, Ts is a
scalar value.
• For multiexperiement
data with Ne
experiments, Ts is
a 1-by-Ne cell array,
and each cell contains
the sampling interval
of the corresponding
experiment.
set(data,'ts',0.05)
or
data.ts = 0.05
1-59
1
Data Processing
iddata Time-Vector Properties (Continued)
Property
Description
Syntax Example
Tstart
Starting time of the
experiment.
To change starting time
of the first data sample to
24:
• For a single
experiment, Ts is a
scalar value.
• For multiexperiement
data with Ne
experiments, Ts is
a 1-by-Ne cell array,
and each cell contains
the sampling interval
of the corresponding
experiment.
1-60
data.Tstart = 24
Time units are set by the
property TimeUnit.
Representing Time- and Frequency-Domain Data Using iddata Objects
iddata Time-Vector Properties (Continued)
Property
Description
Syntax Example
SamplingInstants
Time values in the time
vector, computed from the
properties Tstart and Ts.
To retrieve the time
vector for iddata object
data, use:
• For a single
experiment,
get(data,'sa')
SamplingInstants
is an N-by-1 vector.
• For multiexperiement
data with Ne
experiments, this
property is a 1-by-Ne
cell array, and each
cell contains the
sampling instants
of the corresponding
experiment.
TimeUnit
Unit of time.
To plot the input data as
a function of time:
plot(data.sa,data.u)
Note sa is the first
two letters of the
SamplingInstants
property that uniquely
identifies this property.
To change the unit of the
time vector to msec:
data.ti = 'msec'
1-61
1
Data Processing
iddata Frequency-Vector Properties
Property
Description
Syntax Example
Frequency
Frequency values at
which the Fourier
transforms of the signals
are defined.
To specify 100 frequency
values in log space,
ranging between 0.1 and
100, use the following
syntax:
• For a single
experiment, Frequency
is a scalar value.
data.freq =
logspace(-1,2,100)
• For multiexperiement
data with Ne
experiments,
Frequency is a
1-by-Ne cell array,
and each cell contains
the frequencies of
the corresponding
experiment.
Units
Frequency unit must
have the following values:
If you specified the
TimeUnit as msec, your
frequency units must be:
• If the TimeUnit is
empty or s (seconds),
enter rad/s or Hz
• If the TimeUnit is any
string unit (other than
s), enter rad/unit.
For multiexperiement
data with Ne experiments,
Units is a 1-by-Ne cell
array, and each cell
contains the frequency
unit for each experiment.
1-62
data.unit=
'rad/msec'
Representing Time- and Frequency-Domain Data Using iddata Objects
Naming, Adding, and Removing Data Channels
• “What Are Input and Output Channels?” on page 1-63
• “Naming Channels” on page 1-63
• “Adding Channels” on page 1-64
• “Modifying Channel Data” on page 1-64
What Are Input and Output Channels?
A multivariate system might contain several input variables or several output
variables, or both. When an input or output signal includes several measured
variables, these variables are called channels.
Naming Channels
The iddata properties InputName and OutputName store one or more channel
names for the input and output signals. When you plot the data, you use
channel names to select the variable displayed on the plot. If you have
multivariate data, you should assign a name to each channel that describes
the measured variable. For more information about selecting channels on a
plot, see “Selecting Measured and Noise Channels in Plots” on page 12-18.
You can use the set command to specify the names of individual channels.
For example, suppose data contains two input channels (voltage and current)
and one output channel (temperature). To set these channel names, use the
following syntax:
set(data,'InputName',{'Voltage','Current'},
'OutputName','Temperature')
Tip You can also specify channel names as follows:
data.una = {'Voltage','Current')
data.yna = 'Temperature'
una is equivalent to the property InputName, and yna is equivalent to
OutputName.
1-63
1
Data Processing
If you do not specify channel names when you create the iddata object,
the toolbox assigns default names. By default, the output channels
are named 'y1','y2',...,'yn', and the input channels are named
'u1','u2',...,'un'.
Adding Channels
You can add data channels to an iddata object.
For example, consider an iddata object named data that contains an input
signal with four channels. To add a fifth input channel, stored as the vector
Input5, use the following syntax:
data.u(:,5) = Input5;
In this example, data.u(:,5) references all samples as (indicated by :) of the
input signal u and sets the values of the fifth channel. This channel is created
when assigning its value to Input5.
You can also combine input channels and output channels of several iddata
objects into one iddata object using concatenation. For more information, see
“Concatenating iddata Objects” on page 1-65.
Modifying Channel Data
After you create an iddata object, you can modify or remove specific input
and output channels, if needed. You can accomplish this by subreferencing
the input and output matrices and assigning new values.
For example, suppose the iddata object data contains three output channels
(named y1, y2, and y3), and four input channels (named u1, u2, u3, and u4).
To replace data such that it only contains samples in y3, u1, and u4, type
the following at the prompt:
data = data(:,3,[1 4])
The resulting data object contains one output channel and two input channels.
1-64
Representing Time- and Frequency-Domain Data Using iddata Objects
Concatenating iddata Objects
• “iddata Properties Storing Input and Output Data” on page 1-65
• “Horizontal Concatenation” on page 1-65
• “Vertical Concatenation” on page 1-66
iddata Properties Storing Input and Output Data
The InputData iddata property stores column-wise input data, and the
OutputData property stores column-wise output data. For more information
about accessing iddata properties, see “iddata Properties” on page 1-50.
Horizontal Concatenation
Horizontal concatenation of iddata objects creates a new iddata object
that appends all InputData information and all OutputData. This type of
concatenation produces a single object with more inputs and more outputs.
For example, the following syntax performs horizontal concatenation on the
iddata objects data1,data2,...,dataN:
data = [data1,data2,...,dataN]
This syntax is equivalent to the following longer syntax:
data.InputData =
[data1.InputData,data2.InputData,...,dataN.InputData]
data.OutputData =
[data1.OutputData,data2.OutputData,...,dataN.OutputData]
For horizontal concatenation, data1,data2,...,dataN must have the same
number of samples and experiments , and the sameTs and Tstart values.
The channels in the concatenated iddata object are named according to the
following rules:
• Combining default channel names. If you concatenate iddata objects
with default channel names, such as u1 and y1, channels in the new iddata
object are automatically renamed to avoid name duplication.
• Combining duplicate input channels. If data1,data2,...,dataN
have input channels with duplicate user-defined names, such that dataK
1-65
1
Data Processing
contains channel names that are already present in dataJ with J < K, the
dataK channels are ignored.
• Combining duplicate output channels. If data1,data2,...,dataN
have input channels with duplicate user-defined names, only the output
channels with unique names are added during the concatenation.
Vertical Concatenation
Vertical concatenation of iddata objects creates a new iddata object that
vertically stacks the input and output data values in the corresponding data
channels. The resulting object has the same number of channels, but each
channel contains more data points. For example, the following syntax creates
a data object such that its total number of samples is the sum of the samples
in data1,data2,...,dataN.
data = [data1;data2;... ;dataN]
This syntax is equivalent to the following longer syntax:
data.InputData =
[data1.InputData;data2.InputData;...;dataN.InputData]
data.OutputData =
[data1.OutputData;data2.OutputData;...;dataN.OutputData]
For vertical concatenation, data1,data2,...,dataN must have the same
number of input channels, output channels, and experiments.
1-66
Representing Frequency-Response Data Using idfrd Objects
Representing Frequency-Response Data Using idfrd
Objects
In this section...
“idfrd Constructor” on page 1-67
“idfrd Properties” on page 1-68
“Subreferencing idfrd Objects” on page 1-70
“Concatenating idfrd Objects” on page 1-71
“See Also” on page 1-74
idfrd Constructor
The idfrd represents complex frequency-response data. Before you can
create an idfrd object, you must import your data as described in “Importing
Frequency-Response Data into MATLAB” on page 1-10.
Note The idfrd object can only encapsulate one frequency-response data
set. It does not support the iddata equivalent of multiexperiment data.
Use the following syntax to create the data object fr_data:
fr_data = idfrd(response,f,Ts)
Suppose that ny is the number of output channels, nu is the number of
input channels, and nf is a vector of frequency values. response is an
ny-by-nu-by-nf 3-D array. f is the frequency vector that contains the
frequencies of the response.Ts is the sampling time, which is used when
measuring or computing the frequency response. If you are working with a
continuous-time system, set Ts to 0.
response(ky,ku,kf), where ky, ku, and kf reference the kth output, input,
and frequency value, respectively, is interpreted as the complex-valued
frequency response from input ku to output ky at frequency f(kf).
1-67
1
Data Processing
Note When you work at the command line, you can only create idfrd objects
from complex values of G(eiw). For a SISO system, response can be a vector.
You can specify object properties when you create the idfrd object using
the constructor syntax:
fr_data = idfrd(response,f,Ts,
'Property1',Value1,...,'PropertyN',ValueN)
idfrd Properties
To view the properties of the idfrd object, you can use the get command.
The following example shows how to create an idfrd object that contains
100 frequency-response values with a sampling time interval of 0.08 s and
get its properties:
% Create the idfrd data object
fr_data = idfrd(response,f,0.08)
% Get property values of data
get(fr_data)
1-68
Representing Frequency-Response Data Using idfrd Objects
response and f are variables in the MATLAB Workspace browser,
representing the frequency-response data and frequency values, respectively.
MATLAB returns the following object properties and values:
ans =
Name:
Frequency:
ResponseData:
SpectrumData:
CovarianceData:
NoiseCovariance:
Units:
Ts:
InputDelay:
EstimationInfo:
InputName:
OutputName:
InputUnit:
OutputUnit:
Notes:
UserData:
''
[100x1 double]
[1x1x100 double]
[]
[]
[]
'rad/s'
0.0800
0
[1x1 struct]
{'u1'}
{'y1'}
{''}
{''}
[]
[]
For a complete description of all idfrd object properties, see the idfrd
reference page or type idprops idfrd at the prompt.
To change property values for an existing idfrd object, use the set command
or dot notation. For example, to change the name of the idfrd object, type
the following command sequence at the prompt:
% Set the name of the f_data object
set(fr_data,'name','DC_Converter')
% Get fr_data properties and values
get(fr_data)
Property names are not case sensitive. You do not need to type the entire
property name if the first few letters uniquely identify the property.
1-69
1
Data Processing
If you import fr_data into the System Identification Tool GUI, this data has
the name DC_Converter in the GUI, and not the variable name fr_data.
MATLAB returns the following object properties and values:
ans =
Name:
Frequency:
ResponseData:
SpectrumData:
CovarianceData:
NoiseCovariance:
Units:
Ts:
InputDelay:
EstimationInfo:
InputName:
OutputName:
InputUnit:
OutputUnit:
Notes:
UserData:
'DC_Converter'
[100x1 double]
[1x1x100 double]
[]
[]
[]
'rad/s'
0.0800
0
[1x1 struct]
{'u1'}
{'y1'}
{''}
{''}
[]
[]
Subreferencing idfrd Objects
You can reference specific data values in the idfrd object using the following
syntax:
fr_data(outputchannels,inputchannels)
Reference specific channels by name or by channel index.
Tip Use a colon (:) to specify all channels, and use the empty matrix ([]) to
specify no channels.
1-70
Representing Frequency-Response Data Using idfrd Objects
For example, the following command references frequency-response data from
input channel 3 to output channel 2:
fr_data(2,3)
You can also access the data in specific channels using channel names. To list
multiple channel names, use a cell array. For example, to retrieve the power
output, and the voltage and speed inputs, use the following syntax:
fr_data('power',{'voltage','speed'})
To retrieve only the responses corresponding to frequency values between 200
and 300, use the following command:
fr_data_sub = fselect(fr_data,[200:300])
You can also use logical expressions to subreference data. For example, to
retrieve all frequency-response values between frequencies 1.27 and 9.3 in
the idfrd object fr_data, use the following syntax:
fr_data_sub = fselect(fr_data,fr_data.f>1.27&fr_data.f<9.3)
Note You do not need to type the entire property name. In this example, f in
fr_data.f uniquely identifies the Frequency property of the idfrd object.
Concatenating idfrd Objects
• “About Concatenating idfrd Models” on page 1-71
• “Horizontal Concatenation of idfrd Objects” on page 1-72
• “Vertical Concatenation of idfrd Objects” on page 1-72
• “Concatenating Noise Spectral Data of idfrd Objects” on page 1-73
About Concatenating idfrd Models
The horizontal and vertical concatenation of idfrd objects combine
information in the ResponseData properties of these objects. ResponseData is
an ny-by-nu-by-nf array that stores the response of the system, where ny is
1-71
1
Data Processing
the number of output channels, nu is the number of input channels, and nf is
a vector of frequency values (see “idfrd Properties” on page 1-68).
Horizontal Concatenation of idfrd Objects
The following syntax creates a new idfrd object data that contains the
horizontal concatenation of data1,data2,...,dataN:
data = [data1,data2,...,dataN]
data contains the frequency responses from all of the inputs in
data1,data2,...,dataN to the same outputs. The following diagram is a
graphical representation of horizontal concatenation of frequency-response
data. The (j,i,:) vector of the resulting response data represents the
frequency response from the ith input to the jth output at all frequencies.
u1
u2
Combined
inputs
Data 1
2-by-2-by-nf
u1
u2
u3
y1
y2
u3
Data 2
2-by-1-by-nf
Horizonal Concatenation
of Data 1 and Data 2
2-by-3-by-nf
y1
y2
y1
y2
Same
outputs
Note Horizontal concatenation of idfrd objects requires that they have
the same outputs and frequency vectors. If the output channel names are
different and their dimensions are the same, the concatenation operation uses
the names of output channels in the first idfrd object. Input channels must
have unique names.
Vertical Concatenation of idfrd Objects
The following syntax creates a new idfrd object data that contains the
vertical concatenation of data1,data2,...,dataN:
data = [data1;data2;... ;dataN]
1-72
Representing Frequency-Response Data Using idfrd Objects
The resulting idfrd object data contains the frequency responses from
the same inputs in data1,data2,...,dataN to all the outputs. The
following diagram is a graphical representation of vertical concatenation of
frequency-response data. The (j,i,:) vector of the resulting response data
represents the frequency response from the ith input to the jth output at all
frequencies.
u1
u2
Same
inputs
Data 1
2-by-2-by-nf
u1
u2
y1
u1
y2
u2
Vertical Concatenation
of Data 1 and Data 2
3-by-2-by-nf
Data 1
1-by-2-by-nf
y1
y2
y3
y3
Combined
outputs
Note Vertical concatenation of idfrd objects requires that they have the
same inputs and frequency vectors. If the input channel names are different
and their dimensions are the same, the concatenation operation uses the
names of input channels in the first idfrd object you listed. Output channels
must have unique names.
Concatenating Noise Spectral Data of idfrd Objects
When the idfrd objects contain the frequency-response data you measured
or constructed manually, the concatenation operation combines only the
ResponseData properties. Because the noise spectral data does not exist
(unless you also entered it manually), SpectralData is empty in both the
individual idfrd objects and the concatenated idfrd object.
However, when the idfrd objects are spectral models that you estimated, the
SpectralData property is not empty and contains the power spectra and
cross spectra of the output noise in the system. For each output channel, the
toolbox estimates one noise channel to explain the difference between the
output of the model and the measured output.
1-73
1
Data Processing
When the SpectralData property of individual idfrd objects is not empty,
horizontal and vertical concatenation handle SpectralData, as follows.
In case of horizontal concatenation, there is no meaningful way to combine the
SpectralData of individual idfrd objects and the resulting SpectralData
property is empty. An empty property results because each idfrd object has
its own set of noise channels, where the number of noise channels equals the
number of outputs. When the resulting idfrd object contains the same output
channels as each of the individual idfrd objects, it cannot accommodate the
noise data from all the idfrd objects.
In case of vertical concatenation, the toolbox concatenates individual noise
models diagonally. The following shows that data.SpectrumData is a block
diagonal matrix of the power spectra and cross spectra of the output noise in
the system:
⎛ data1.s
0 ⎞⎟
⎜
data.s = ⎜
⎟
⎜⎜
⎟
dataN .s ⎟⎠
⎝ 0
s in data.s is the abbreviation for the SpectrumData property name.
See Also
The following operations also create idfrd objects:
• Transforming iddata objects. For more information, see “Transforming
Between Frequency-Domain and Frequency-Response Data” on page 1-128.
• Estimating nonparametric models using etfe, spa, and spafdr. For more
information, see “Identifying Frequency-Response Models” on page 3-2.
• Converting the Control System Toolbox frd object. For more information,
see “Using Models with Control System Toolbox Software” on page 10-2.
1-74
Analyzing Data Quality Using Plots
Analyzing Data Quality Using Plots
In this section...
“Supported Data Plots” on page 1-75
“Plotting Data in the System Identification Tool GUI” on page 1-75
“Plotting Data at the Command Line” on page 1-81
Supported Data Plots
You can create the following plots of your data:
• Time plot — Shows data values as a function of time.
• Spectral plot — Shows a periodogram that is computed by taking the
absolute squares of the Fourier transforms of the data, dividing by the
number of data points, and multiplying by the sampling interval.
• Frequency-response plot — For frequency-response data, shows the
amplitude and phase of the frequency-response function on a Bode plot. For
time- and frequency-domain data, shows the empirical transfer function
estimate (see etfe) .
The plots you create using the System Identification Tool GUI provide
options that are specific to the System Identification Toolbox product, such
as selecting specific channel pairs in a multivariate signals or converting
frequency units between Hertz and radians per second.
The plots you create using the plot commands, such as plot, bode, and ffplot,
are displayed in the standard MATLAB Figure window, which provides
options for formatting, saving, printing, and exporting plots to a variety of file
formats. For more information, see the MATLAB Graphics documentation.
Plotting Data in the System Identification Tool GUI
• “How to Plot Data in the GUI” on page 1-76
• “Working with a Time Plot” on page 1-77
• “Working with a Data Spectra Plot” on page 1-78
1-75
1
Data Processing
• “Working with a Frequency Function Plot” on page 1-80
How to Plot Data in the GUI
After importing data into the System Identification Tool GUI, as described in
“Representing Data in the GUI” on page 1-13, you can plot the data.
To create one or more plots, select the corresponding check box in the Data
Views area of the System Identification Tool GUI.
An active data icon has a thick line in the icon, while an inactive data set
has a thin line. Only active data sets appear on the selected plots. To toggle
including and excluding data on a plot, click the corresponding icon in the
System Identification Tool GUI. Clicking the data icon updates any plots
that are currently open.
Thick lines indicate
active data sets
included in plots.
All three available
data plots are
selected.
In this example, data1 and data3fd are active and appear on the three
selected plots.
1-76
Analyzing Data Quality Using Plots
To close a plot, clear the corresponding check box in the System Identification
Tool GUI.
Tip To get information about working with a specific plot, select a help topic
from the Help menu in the plot window.
Working with a Time Plot
The Time plot only shows time-domain data. In this example, data1 is
displayed on the time plot because, of the three data sets, it is the only one
that contains time-domain input and output.
Time Plot of data1
1-77
1
Data Processing
Note You can plot several data sets with the same input and output channel
names. The plot displays data for all channels that have the same name. To
view a different input-output channel pair, select it from the Channel menu.
For more information about selecting different input and output pairs, see
“Selecting Measured and Noise Channels in Plots” on page 12-18.
The following table summarizes options that are specific to time plots, which
you can select from the plot window menus. For general information about
working with System Identification Toolbox plots, see “Working with Plots in
the System Identification Tool GUI” on page 12-15.
Time Plot Options
Action
Command
Toggle input display between
piece-wise continuous (zero-order
hold) and linear interpolation
(first-order hold) between samples.
Select Style > Staircase input for
zero-order hold or Style > Regular
input for first-order hold.
Note This option only affects the
display and not the intersample
behavior specified when importing
the data.
Working with a Data Spectra Plot
The Data spectra plot shows a periodogram or a spectral estimate of data1
and data3fd.
The periodogram is computed by taking the absolute squares of the Fourier
transforms of the data, dividing by the number of data points, and multiplying
by the sampling interval. The spectral estimate for time-domain data is a
smoothed spectrum calculated using spa. For frequency-domain data, the
Data spectra plot shows the absolute value of the square of the actual data.
1-78
Analyzing Data Quality Using Plots
The top axes show the input and the bottom axes show the output. The
vertical axis of each plot is labeled with the corresponding channel name.
Periodograms of data1 and data3fd
Data Spectra Plot Options
Action
Command
Toggle display between periodogram
and spectral estimate.
Select Options > Periodogram or
Options > Spectral analysis.
Change frequency units.
Select Style > Frequency (rad/s)
or Style > Frequency (Hz).
Toggle frequency scale between
linear and logarithmic.
Select Style > Linear frequency
scale or Style > Log frequency
scale.
Toggle amplitude scale between
linear and logarithmic.
Select Style > Linear amplitude
scale or Style > Log amplitude
scale.
1-79
1
Data Processing
Working with a Frequency Function Plot
For time-domain data, the Frequency function plot shows the empirical
transfer function estimate (etfe). For frequency-domain data, the plot shows
the ratio of output to input data.
The frequency-response plot shows the amplitude and phase plots of
the corresponding frequency response. For more information about
frequency-response data, see “Importing Frequency-Response Data into
MATLAB” on page 1-10.
Frequency Functions of data1 and data3fd
Frequency Function Plot Options
1-80
Action
Command
Change frequency units.
Select Style > Frequency (rad/s)
or Style > Frequency (Hz).
Analyzing Data Quality Using Plots
Frequency Function Plot Options (Continued)
Action
Command
Toggle frequency scale between
linear and logarithmic.
Select Style > Linear frequency
scale or Style > Log frequency
scale.
Toggle amplitude scale between
linear and logarithmic.
Select Style > Linear amplitude
scale or Style > Log amplitude
scale.
Plotting Data at the Command Line
The following table summarizes the commands available for plotting
time-domain, frequency-domain, and frequency-response data.
Commands for Plotting Data
Command
Description
Example
bode
For frequency-response data
only. Shows the magnitude
and phase of the frequency
response on a logarithmic
frequency scale of a Bode
plot.
To plot idfrd data:
bode(idfrd_data)
1-81
1
Data Processing
Commands for Plotting Data (Continued)
Command
Description
Example
ffplot
For frequency-response
data only. Shows the
magnitude and phase of
the frequency response on
a linear frequency scale
(hertz).
To plot idfrd data:
The type of plot corresponds
to the type of data.
For example, plotting
time-domain data generates
a time plot, and plotting
frequency-response
data generates a
frequency-response plot.
To plot iddata or idfrd
data:
plot
When plotting time- or
frequency-domain inputs
and outputs, the top axes
show the output and the
bottom axes show the input.
ffplot(idfrd_data)
plot(data)
Note For idfrd data, this
command is equivalent to
ffplot(data).
All plot commands display the data in the standard MATLAB Figure window.
For more information about working with the Figure window, see the
MATLAB Graphics documentation.
To plot portions of the data, you can subreference specific samples (see
“Subreferencing iddata Objects” on page 1-55 and “Subreferencing idfrd
Objects” on page 1-70. For example:
plot(data(1:300))
For time-domain data, to plot only the input data as a function of time, use
the following syntax:
plot(data(:,[],:)
1-82
Analyzing Data Quality Using Plots
When data.intersample = 'zoh', the input is piece-wise constant between
sampling points on the plot. For more information about properties, see the
iddata reference page.
You can generate plots of the input data in the time domain using:
plot(data.sa,data.u)
To plot frequency-domain data, you can use the following syntax:
semilogx(data.fr,abs(data.u))
In this case, sa is an abbreviation of the iddata property SamplingInstants.
Similarly, fr is an abbreviation of Frequency. u is the input signal.
Note The frequencies are linearly spaced on the plot.
When you specify to plot a multivariable iddata object, each input-output
combination is displayed one at a time in the same MATLAB Figure window.
You must press Enter to update the Figure window and view the next
channel combination. To cancel the plotting operation, press Ctrl+C.
Tip To plot specific input and output channels, use plot(data(:,ky,ku)),
where ky and ku are specific output and input channel indexes or names. For
more information about subreferencing channels, see “Subreferencing Data
Channels” on page 1-56.
To plot several iddata sets d1,...,dN, use plot(d1,...,dN). Input-output
channels with the same experiment name, input name, and output name
are always plotted in the same plot.
1-83
1
Data Processing
Getting Advice About Your Data
You can use the advice command to get information about your
time-domain or frequency-domain data. This command does not support
frequency-response data.
Note If you are using the System Identification Tool GUI, you must export
your data to the MATLAB workspace before you can use the advice command
on this data. For more information about exporting data, see “Exporting
Models from the GUI to the MATLAB Workspace” on page 12-13.
Suppose that data is an iddata object. advice(data) displays the following
information about the data in the MATLAB Command Window. Ask yourself
the following questions:
• Does it make sense to remove constant offsets and linear trends from the
data? See also detrend.
• What are the excitation levels of the signals and how does this affects the
model orders? See also pexcit.
• Is there an indication of output feedback in the data? See also feedback.
When feedback is present in the system, only prediction-error methods
work well for estimating closed-loop data.
To estimate the delay from the input to the output in the system (dead time)
by using the data, use the delayest command. You need to know the delay
when specifying a model structure for estimation.
1-84
Getting Advice About Your Data
The following example shows how to get information about your data.
Consider data from a single-input/single-output system sampled at 0.08 s.
Use these commands to load the data and estimate the delay in the system:
load dryer2
data=iddata(y2,u2,0.08)
delayest(data)
ans =
%
%
%
%
Load the sample input
and output data
Create iddata object
Estimate delay (dead time)
3
Use the following syntax to get advice about a data set:
advice(data)
% Get advice about the data
The results of using this command suggests your identification strategy.
1-85
1
Data Processing
Selecting Subsets of Data
In this section...
“Why Select Subsets of Data?” on page 1-86
“Selecting Data Using the GUI” on page 1-87
“Selecting Data at the Command Line” on page 1-89
Why Select Subsets of Data?
You can use data selection to create independent data sets for estimation
and validation.
You can also use data selection as a way to clean the data and exclude parts
with noisy or missing information. For example, when your data contains
missing values, outliers, level changes, and disturbances, you can select one
or more portions of the data that are suitable for identification and exclude
the rest.
If you only have one data set and you want to estimate linear models, you
should split the data into two portions to create two independent data sets for
estimation and validation, respectively. Splitting the data is selecting parts of
the data set and saving each part independently.
You can merge several data segments into a single multiexperiment data set
and identify an average model. For more information, see “Representing Data
in the GUI” on page 1-13 or “Representing Time- and Frequency-Domain Data
Using iddata Objects” on page 1-47.
Note Subsets of the data set must contain enough samples to adequately
represent the system, and the inputs must provide suitable excitation to the
system.
Selecting potions of frequency-domain data is equivalent to filtering the data.
For more information about filtering, see “Filtering Data” on page 1-107.
1-86
Selecting Subsets of Data
Selecting Data Using the GUI
• “Ways to Select Data in the GUI” on page 1-87
• “Selecting a Range for Time-Domain Data” on page 1-87
• “Selecting a Range of Frequency-Domain Data” on page 1-89
Ways to Select Data in the GUI
You can use System Identification Tool GUI to select ranges of data on a
time-domain or frequency-domain plot. Selecting data in the frequency
domain is equivalent to passband-filtering the data.
After you select portions of the data, you can specify to use one data segment
for estimating models and use the other data segment for validating models.
For more information, see “Specifying Estimation and Validation Data” on
page 1-29.
Note Selecting <–Preprocess > Quick start performs the following actions
simultaneously:
• Remove the mean value from each channel.
• Split the data into two parts.
• Specify the first part as estimation data (or Working Data).
• Specify the second part as Validation Data.
Selecting a Range for Time-Domain Data
You can select a range of data values on a time plot and save it as a new data
set in the System Identification Tool GUI.
Note Selecting data does not extract experiments from a data set containing
multiple experiments. For more information about multiexperiment data, see
“Creating Multiexperiment Data Sets in the GUI” on page 1-33.
1-87
1
Data Processing
To extract a subset of time-domain data and save it as a new data set:
1 Import time-domain data into the System Identification Tool GUI, as
described in “Representing Data in the GUI” on page 1-13.
2 Drag the data set you want to subset to the Working Data area.
3 If your data contains multiple I/O channels, in the Channel menu, select
the channel pair you want to view. The upper plot corresponds to the input
signal, and the lower plot corresponds to the output signal.
Although you view only one I/O channel pair at a time, your data selection
is applied to all channels in this data set.
4 Select the data of interest in either of the following ways:
• Graphically — Draw a rectangle on either the input-signal or the
output-signal plot with the mouse to select the desired time interval.
Your selection appears on both plots regardless of the plot on which you
draw the rectangle. The Time span and Samples fields are updated to
match the selected region.
• By specifying the Time span — Edit the beginning and the end times
in seconds. The Samples field is updated to match the selected region.
For example:
28.5 56.8
• By specifying the Samples range — Edit the beginning and the end
indices of the sample range. The Time span field is updated to match
the selected region. For example:
342 654
Note To clear your selection, click Revert.
5 In the Data name field, enter the name of the data set containing the
selected data.
6 Click Insert. This action saves the selection as a new data set and adds
it to the Data Board.
1-88
Selecting Subsets of Data
7 To select another range, repeat steps 4 to 6.
Selecting a Range of Frequency-Domain Data
Selecting a range of values in frequency domain is equivalent to filtering
the data. For more information about data filtering, see “Filtering
Frequency-Domain or Frequency-Response Data in the GUI” on page 1-110.
Selecting Data at the Command Line
Selecting ranges of data values is equivalent to subreferencing the data.
For more information about subreferencing time-domain and
frequency-domain data, see “Subreferencing iddata Objects” on page 1-55.
For more information about subreferencing frequency-response data, see
“Subreferencing idfrd Objects” on page 1-70.
1-89
1
Data Processing
Handling Missing Data and Outliers
In this section...
“Handling Missing Data” on page 1-90
“Handling Outliers” on page 1-91
“Example – Extracting and Modeling Specific Data Segments” on page 1-92
“See Also” on page 1-93
Handling Missing Data
Data acquisition failures sometimes result in missing measurements both in
the input and the output signals. When you import data that contains missing
values using the MATLAB Import Wizard, these values are automatically set
to NaN (“Not-a-Number”). NaN serves as a flag for nonexistent or undefined
data. When you plot data on a time-plot that contains missing values, gaps
appear on the plot where missing data exists.
You can use misdata to estimate missing values. This command linearly
interpolates missing values to estimate the first model. Then, it uses this
model to estimate the missing data as parameters by minimizing the output
prediction errors obtained from the reconstructed data. You can specify the
model structure you want to use in the misdata argument or estimate a
default-order model using the n4sid method. For more information, see the
misdata reference page.
Note You can only use misdata on time-domain data stored in an iddata
object. For more information about creating iddata objects, see “Representing
Time- and Frequency-Domain Data Using iddata Objects” on page 1-47.
For example, suppose y and u are output and input signals that contain NaNs.
This data is sampled at 0.2 s. The following syntax creates a new iddata
object with these input and output signals.
dat = iddata(y,u,0.2) % y and u contain NaNs
% representing missing data
1-90
Handling Missing Data and Outliers
Apply the misdata command to the new data object. For example:
dat1 = misdata(dat);
plot(dat,dat1)
% Check how the missing data
% was estimated on a time plot
Handling Outliers
Malfunctions can produce errors in measured values, called outliers. Such
outliers might be caused by signal spikes or by measurement malfunctions.
If you do not remove outliers from your data, this can adversely affect the
estimated models.
To identify the presence of outliers, perform one of the following tasks:
• Before estimating a model, plot the data on a time plot and identify values
that appear out of range.
• After estimating a model, plot the residuals and identify unusually large
values. For more information about plotting residuals, see “Using Residual
Analysis Plots to Validate Models” on page 8-16. Evaluate the original
data that is responsible for large residuals. For example, for the model
Model and validation data Data, you can use the following commands to
plot the residuals:
% Compute the residuals
E = resid(Model,Data)
% Plot the residuals
plot(E)
Next, try these techniques for removing or minimizing the effects of outliers:
• Extract the informative data portions into segments and merge them into
one multiexperiment data set (see “Example – Extracting and Modeling
Specific Data Segments” on page 1-92). For more information about
selecting and extracting data segments, see “Selecting Subsets of Data”
on page 1-86.
1-91
1
Data Processing
Tip The inputs in each of the data segments must be consistently exciting
the system. Splitting data into meaningful segments for steady-state
data results in minimum information loss. Avoid making data segments
too small.
• Manually replace outliers with NaNs and then use the misdata command
to reconstruct flagged data. This approach treats outliers as missing data
and is described in “Handling Missing Data” on page 1-90. Use this method
when your data contains several inputs and outputs, and when you have
difficulty finding reliable data segments in all variables.
• Remove outliers by prefiltering the data for high-frequency content because
outliers often result from abrupt changes. For more information about
filtering, see “Filtering Data” on page 1-107.
Note The estimation algorithm handles outliers automatically by assigning
a smaller weight to outlier data. A robust error criterion applies an error
penalty that is quadratic for small and moderate prediction errors, and is
linear for large prediction errors. Because outliers produce large prediction
errors, this approach gives a smaller weight to the corresponding data points
during model estimation. The value LimitError (see Algorithm Properties)
quantitatively distinguishes between moderate and large outliers.
Example – Extracting and Modeling Specific Data
Segments
The following example shows how to create a multiexperiment, time-domain
data set by merging only the accurate-data segments and ignoring the rest.
Modeling multiexperiment data sets produces an average model for the
different experiments.
You cannot simply concatenate the good data segments because the transients
at the connection points compromise the model. Instead, you must create a
multiexperiment iddata object, where each experiment corresponds to a good
segment of data, as follows:
1-92
Handling Missing Data and Outliers
% Plot the data in a MATLAB Figure window
plot(data)
% Create multiexperiment data set
% by merging data segments
datam = merge(data(1:340),...
data(500:897),...
data(1001:1200),...
data(1550:2000));
% Model the multiexperiment data set
% using "experiments" 1, 2, and 4
m =pem(getexp(datam,[1,2,4]))
% Validate the model by comparing its output to
% the output data of experiment 3
compare(getexp(datam,3),m)
See Also
To learn more about the theory of handling missing data and outliers, see the
chapter on preprocessing data in System Identification: Theory for the User,
Second Edition, by Lennart Ljung, Prentice Hall PTR, 1999.
1-93
1
Data Processing
Subtracting Trends from Signals (Detrending)
In this section...
“What Is Detrending?” on page 1-94
“When to Detrend Data” on page 1-94
“When Not to Detrend Data” on page 1-95
“GUI and Command-Line Alternatives for Detrending Data” on page 1-96
“How to Detrend Data Using the GUI” on page 1-96
“How to Detrend Data at the Command Line” on page 1-97
“How to Add Detrended Values to the Model Output” on page 1-98
What Is Detrending?
Detrending data removes mean values or linear trends from time-series and
input/output signals. If your data set includes multiple inputs and outputs,
detrending removes trends independently from each signal.
You can later restore the removed trend to simulated or predicted model
output, as described in “How to Add Detrended Values to the Model Output”
on page 1-98.
For more information about handling drifts in the data, see the chapter on
preprocessing data in System Identification: Theory for the User, Second
Edition, by Lennart Ljung, Prentice Hall PTR, 1999.
To learn more about preparing your data for system identification, see “Ways
to Process Data for System Identification” on page 1-2.
When to Detrend Data
You might want to detrend data before performing system identification, as
described in “Steps for Using This Toolbox”. For example, you can remove a
constant offset (zero-order trend) or drift (first-order, or linear, trend) from
your data before modeling. Removing a trend from the data enables you to
focus your analysis on the fluctuations in the data about the trend.
1-94
Subtracting Trends from Signals (Detrending)
For linear system identification, detrending steady-state data is useful
because arbitrary differences between the input and output signal levels
cannot be explained by a linear model.
For nonlinear black-box system identification, detrending data might be
helpful when signals vary around a large signal level, you might improve
computational accuracy by first removing the means.
When to Subtract the Mean Values
You can subtract mean values from your data when you have steady-state
(not transient) data. If you have steady-state data, it is usually sufficient
to identify linear models from signals measured relative to an equilibrium.
Thus, you can avoid modeling the absolute levels in physical units.
Tip When you know the mean levels that correspond to the actual physical
equilibrium, remove the equilibrium values instead of the mean value of
the signals for best results.
When to Subtract Linear Trends
When the mean levels drift during the experiment, you can eliminate this drift
by removing a linear trend or several piece-wise linear trends from the signals.
Signal drift is considered a low-frequency disturbance. If you know the drift
rate, you can also build a custom high-pass filter and apply it as described in
“Filtering Data” on page 1-107.
When Not to Detrend Data
Do not detrend your data when the physical levels are built into the underlying
model or when input integrators in the system require absolute signal levels.
In the case of estimating nonlinear ODE parameters (nonlinear grey-box
models), do not detrend the data to make sure that the models represent the
actual physical levels.
1-95
1
Data Processing
When you are working with transient data (such as step or impulse response),
do not remove the mean from the data. With transient data, when the output
at zero input is not zero, you might want to subtract the constant value
corresponding to the time before the input is applied.
For nonlinear black-box models, detrending data is not always necessary
because these models can include the trend as part of the model.
GUI and Command-Line Alternatives for Detrending
Data
You can detrend data using the System Identification Tool GUI and at the
command line (using the detrend command).
Both the GUI and the command line let you subtract the mean values and one
linear trend from time-domain signals.
However, the detrend command provides the following additional
functionality not available in the GUI:
• Subtracting several linear trends connected from time-domain data at
specified breakpoints. A breakpoint is a time value that defines the
discontinuities between successive linear trends.
• Subtract a mean value from frequency-domain data.
To learn how to detrend data, see one of the following:
• “How to Detrend Data Using the GUI” on page 1-96
• “How to Detrend Data at the Command Line” on page 1-97
How to Detrend Data Using the GUI
Before you can perform this task, you must import data into the System
Identification Tool GUI, as described in “Importing Time-Domain Data into
the GUI” on page 1-15.
1-96
Subtracting Trends from Signals (Detrending)
Tip (For linear modeling only) Select Preprocess > Quick start to perform
several data cleaning operations, including removing the mean value from
each signal, splitting data into two halves, specifying the first half as model
estimation data (or Working Data), and specifying the second half as model
Validation Data.
To detrend data using the GUI:
1 In the System Identification Tool, drag the data set you want to detrend to
the Working Data rectangle.
2 Determine if you want to remove both the mean values and the linear
trend from the data.
• If yes, select Preprocess > Remove trends. This creates a new data
set in the Data Board. You are finished.
• If no, go to step 3.
3 To remove constant offsets from the data, select Preprocess > Remove
means. This selection creates a new data set in the System Identification
Tool GUI.
Note When you estimate a model from detrended data, you should also
detrend the validation data in the same way.
How to Detrend Data at the Command Line
You can use the detrend command to perform the following operations:
• Subtract mean values from time-domain or frequency-domain data.
• Subtract one or more linear trends from time-domain data at specified
breakpoints, where a breakpoint is a time value that defines the
discontinuities between successive linear trends.
1-97
1
Data Processing
Before you can perform this task, you must represent your data as an iddata
object in the MATLAB workspace, as described in “Representing Time- and
Frequency-Domain Data Using iddata Objects” on page 1-47.
To remove mean values from each channel in data (which is an iddata
object), use the following syntax:
data = detrend(data);
To subtract one linear trend, use the following syntax:
data = detrend(data,1);
In this case, 1 indicates that a first-order trend is removed from each signal.
Note When you estimate a model from detrended data, you should also
detrend the validation data in the same way.
For more information about detrending options, see the detrend reference
page.
How to Add Detrended Values to the Model Output
Suppose that you estimated the model M using detrended data, where you
removed u0 and y0 from the input and output signals, respectively.
To simulate this model about nonzero equilibrium values:
1 Subtract u0 from the input signal you want to use to simulate the model.
For example, Unew=U-u0.
2 Simulate the model using the sim command and the input signal resulting
from step 1.
For example, Ysim = sim(M,Unew,INIT), where INIT specifies the initial
conditions of the simulation.
3 Add y0 to the simulated model output.
1-98
Subtracting Trends from Signals (Detrending)
For example, Ynew = Ysim+y0.
1-99
1
Data Processing
Resampling Data
In this section...
“What Is Resampling?” on page 1-100
“Resampling Data Using the GUI” on page 1-101
“Resampling Data at the Command Line” on page 1-101
“Resampling Data Without Aliasing Effects” on page 1-103
“See Also” on page 1-106
What Is Resampling?
Resampling data signals in the System Identification Toolbox product applies
an antialiasing (lowpass) FIR filter to the data and changes the sampling rate
of the signal by decimation or interpolation.
If your data is sampled faster than needed during the experiment, you can
decimate it without information loss. If your data is sampled more slowly
than needed, there is a possibility that you miss important information
about the dynamics at higher frequencies. Although you can resample the
data at a higher rate, the resampled values occurring between measured
samples do not represent measured information about your system. Instead
of resampling, repeat the experiment using a higher sampling rate.
Tip You should decimate your data when it contains high-frequency noise
outside the frequency range of the system dynamics.
Resampling takes into account how the data behaves between samples, which
you specify when you import the data into the System Identification Tool
GUI (zero-order or first-order hold). For more information about the data
properties you specify before importing the data, see “Representing Data in
the GUI” on page 1-13.
You can resample data using the System Identification Tool GUI or the
resample command. You can only resample time-domain data at uniform
time intervals.
1-100
Resampling Data
Resampling Data Using the GUI
Use the System Identification Tool GUI to resample time-domain data. To
specify additional options, such as the prefilter order, see “Resampling Data
at the Command Line” on page 1-101.
The System Identification Tool GUI uses idresamp to interpolate or decimate
the data. For more information about this command, type help idresamp at
the prompt.
To create a new data set by resampling the input and output signals:
1 Import time-domain data into the System Identification Tool GUI, as
described in “Representing Data in the GUI” on page 1-13.
2 Drag the data set you want to resample to the Working Data area.
3 In the Resampling factor field, enter the factor by which to multiply the
current sampling interval:
• For decimation (fewer samples), enter a factor greater than 1 to increase
the sampling interval by this factor.
• For interpolation (more samples), enter a factor less than 1 to decrease
the sampling interval by this factor.
Default = 1.
4 In the Data name field, type the name of the new data set. Choose a name
that is unique in the Data Board.
5 Click Insert to add the new data set to the Data Board in the System
Identification Toolbox window.
6 Click Close to close the Resample dialog box.
Resampling Data at the Command Line
Use resample to decimate and interpolate time-domain iddata objects. You
can specify the order of the antialiasing filter as an argument.
1-101
1
Data Processing
Note resample uses the Signal Processing Toolbox™ command, when this
toolbox is installed on your computer. If this toolbox is not installed, use
idresamp instead. idresamp only lets you specify the filter order, whereas
resample also lets you specify filter coefficients and the design parameters
of the Kaiser window.
To create a new iddata object datar by resampling data, use the following
syntax:
datar = resample(data,P,Q,filter_order)
In this case, P and Q are integers that specify the new sampling interval: the
new sampling interval is Q/P times the original one. You can also specify the
order of the resampling filter as a fourth argument filter_order, which is
an integer (default is 10). For detailed information about resample, see the
corresponding reference page.
For example, resample(data,1,Q) results in decimation with the sampling
interval modified by a factor Q.
The next example shows how you can increase the sampling rate by a factor of
1.5 and compare the signals:
plot(u)
ur = resample(u,3,2);
plot(u,ur)
When the Signal Processing Toolbox product is not installed, using resample
calls idresamp instead.
idresamp uses the following syntax:
datar = idresamp(data,R,filter_order)
In this case, R=Q/P, which means that data is interpolated by a factor P and
then decimated by a factor Q. To learn more about idresamp, type help
idresamp.
1-102
Resampling Data
The data.InterSample property of the iddata object is taken into account
during resampling (for example, first-order hold or zero-order hold). For more
information, see “iddata Properties” on page 1-50.
Resampling Data Without Aliasing Effects
Typically, you decimate a signal to remove the high-frequency contributions
that result from noise from the total energy. Ideally, you want to remove the
energy contribution due to noise and preserve the energy density of the signal.
The command resample performs the decimation without aliasing effects.
This command includes a factor of T to normalize the spectrum and preserve
the energy density after decimation. For more information about spectrum
normalization, see “Understanding Spectrum Normalization” on page 3-11.
If you use manual decimation instead of resample—by picking every fourth
sample from the signal, for example—the energy contributions from higher
frequencies are folded back into the lower frequencies. Because the total
signal energy is preserved by this operation and this energy must now be
squeezed into a smaller frequency range, the amplitude of the spectrum at
each frequency increases. Thus, the energy density of the decimated signal
is not constant.
1-103
1
Data Processing
The following example illustrates how resample avoids folding effects:
% Construct fourth-order MA-process
m0 = idpoly(1,[ ],[1 1 1 1]);
% Generate error signal
e = idinput(2000,'rgs');
e = iddata([],e,'Ts',1);
% Simulate the output using error signal
y = sim(m0,e);
% Estimate signal spectrum
g1 = spa(y);
% Estimate spectrum of modified signal including
% every fourth sample of the original signal.
% This command automatically sets Ts to 4.
g2 = spa(y(1:4:2000));
% Plot frequency response to view folding effects
ffplot(g1,g2)
% Estimate spectrum after prefiltering that does not
% introduce folding effects
g3 = spa(resample(y,1,4));
figure
ffplot(g1,g3)
1-104
Resampling Data
Folding Effects with Manual Decimation
1-105
1
Data Processing
Use resample to decimate the signal before estimating the spectrum and plot
the frequency response, as follows:
g3 = spa(resample(y,1,4));
figure
ffplot(g1,g3)
The following figure shows that the estimated spectrum of the resampled
signal has the same amplitude as the original spectrum. Thus, there is no
indication of folding effects when you use resample to eliminate aliasing.
No Folding Effects When Using resample
See Also
For a detailed discussion about handling disturbances, see the chapter on
preprocessing data in System Identification: Theory for the User, Second
Edition, by Lennart Ljung, Prentice Hall PTR, 1999.
1-106
Filtering Data
Filtering Data
In this section...
“Supported Filters” on page 1-107
“Choosing to Prefilter Your Data” on page 1-107
“How to Filter Data Using the GUI” on page 1-108
“How to Filter Data at the Command Line” on page 1-111
“See Also” on page 1-114
Supported Filters
You can filter the input and output signals through a linear filter before
estimating a model in the System Identification Tool GUI or at the command
line. How you want to handle the noise in the system determines whether it
is appropriate to prefilter the data.
The filter available in the System Identification Tool GUI is a fifth-order
(passband) Butterworth filter. If you need to specify a custom filter, use the
idfilt command.
Choosing to Prefilter Your Data
Prefiltering data can help remove high-frequency noise or low-frequency
disturbances (drift). The latter application is an alternative to subtracting
linear trends from the data, as described in “Subtracting Trends from Signals
(Detrending)” on page 1-94.
In addition to minimizing noise, prefiltering lets you focus your model on
specific frequency bands. The frequency range of interest often corresponds
to a passband over the breakpoints on a Bode plot. For example, if you are
modeling a plant for control-design applications, you might prefilter the data
to specifically enhance frequencies around the desired closed-loop bandwidth.
Prefiltering the input and output data through the same filter does not change
the input-output relationship for a linear system. However, prefiltering does
change the noise characteristics and affects the estimated model of the system.
1-107
1
Data Processing
To get a reliable noise model, avoid prefiltering the data. Instead, set
the Focus property of the estimation algorithm to Simulation. For more
information about the Focus property, see the Algorithm Properties
reference page.
Note When you prefilter during model estimation, the filtered data is used to
only model the input-to-output dynamics. However, the disturbance model is
calculated from the unfiltered data.
How to Filter Data Using the GUI
• “Filtering Time-Domain Data in the GUI” on page 1-108
• “Filtering Frequency-Domain or Frequency-Response Data in the GUI” on
page 1-110
Filtering Time-Domain Data in the GUI
The System Identification Tool GUI lets you filter time-domain data using a
fifth-order Butterworth filter by enhancing or selecting specific passbands.
To create a filtered data set:
1 Import time-domain data into the System Identification Tool GUI, as
described in “Representing Data in the GUI” on page 1-13.
2 Drag the data set you want you want to filter to the Working Data area.
3 Select <–Preprocess > Filter. By default, this selection shows a
periodogram of the input and output spectra (see the etfe reference page).
Note To display smoothed spectral estimates instead of the periodogram,
select Options > Spectral analysis. This spectral estimate is computed
using spa and your previous settings in the Spectral Model dialog box. To
change these settings, select <–Estimate > Spectral model in the System
Identification Tool GUI, and specify new model settings.
1-108
Filtering Data
4 If your data contains multiple input/output channels, in the Channel
menu, select the channel pair you want to view. Although you view only
one channel pair at a time, the filter applies to all input/output channels
in this data set.
5 Select the data of interest using one of the following ways:
• Graphically — Draw a rectangle with the mouse on either the
input-signal or the output-signal plot to select the desired frequency
interval. Your selection is displayed on both plots regardless of the plot
on which you draw the rectangle. The Range field is updated to match
the selected region. If you need to clear your selection, right-click the
plot.
• Specify the Range — Edit the beginning and the end frequency values.
For example:
8.5 20.0 (rad/s).
Tip To change the frequency units from rad/s to Hz, select
Style > Frequency (Hz). To change the frequency units from Hz to
rad/s, select Style > Frequency (rad/s).
6 In the Range is list, select one of the following:
• Pass band — Allows data in the selected frequency range.
• Stop band — Excludes data in the selected frequency range.
7 Click Filter to preview the filtered results. If you are satisfied, go to step 8.
Otherwise, return to step 5.
8 In the Data name field, enter the name of the data set containing the
selected data.
9 Click Insert to save the selection as a new data set and add it to the Data
Board.
10 To select another range, repeat steps 5 to 9.
1-109
1
Data Processing
Filtering Frequency-Domain or Frequency-Response Data in
the GUI
For frequency-domain and frequency-response data, filtering is equivalent to
selecting specific data ranges.
To select a range of data in frequency-domain or frequency-response data:
1 Import data into the System Identification Tool GUI, as described in
“Representing Data in the GUI” on page 1-13.
2 Drag the data set you want you want to filter to the Working Data area.
3 Select <–Preprocess > Select range. This selection displays one of the
following plots:
• Frequency-domain data — Plot shows the absolute of the squares of the
input and output spectra.
• Frequency-response data — Top axes show the frequency response
magnitude equivalent to the ratio of the output to the input, and the
bottom axes show the ratio of the input signal to itself, which has the
value of 1 at all frequencies.
4 If your data contains multiple input/output channels, in the Channel
menu, select the channel pair you want to view. Although you view only
one channel pair at a time, the filter applies to all input/output channels
in this data set.
5 Select the data of interest using one of the following ways:
• Graphically — Draw a rectangle with the mouse on either the
input-signal or the output-signal plot to select the desired frequency
interval. Your selection is displayed on both plots regardless of the plot
on which you draw the rectangle. The Range field is updated to match
the selected region.
If you need to clear your selection, right-click the plot.
• Specify the Range — Edit the beginning and the end frequency values.
For example:
8.5 20.0 (rad/s).
1-110
Filtering Data
Tip If you need to change the frequency units from rad/s to Hz, select
Style > Frequency (Hz). To change the frequency units from Hz to
rad/s, select Style > Frequency (rad/s).
6 In the Range is list, select one of the following:
• Pass band — Allows data in the selected frequency range.
• Stop band — Excludes data in the selected frequency range.
7 In the Data name field, enter the name of the data set containing the
selected data.
8 Click Insert. This action saves the selection as a new data set and adds
it to the Data Board.
9 To select another range, repeat steps 5 to 8.
How to Filter Data at the Command Line
• “Simple Passband Filter” on page 1-111
• “Defining a Custom Filter” on page 1-112
• “Causal and Noncausal Filters” on page 1-113
Simple Passband Filter
Use idfilt to apply passband and other custom filters to a time-domain or
a frequency-domain iddata object.
In general, you can specify any custom filter. Use this syntax to filter an
iddata object data using the filter called filter:
fdata = idfilt(data,filter)
In the simplest case, you can specify a passband filter for time-domain data
using the following syntax:
fdata = idfilt(data,[wl wh])
1-111
1
Data Processing
In this case, w1 and wh represent the low and high frequencies of the passband,
respectively.
You can specify several passbands, as follows:
filter=[[w1l,w1h];[ w2l,w2h]; ....;[wnl,wnh]]
The filter is an n-by-2 matrix, where each row defines a passband in radians
per second.
To define a stopband between ws1 and ws2, use
filter = [0 ws1; ws2 Nyqf]
where, Nyqf is the Nyquist frequency.
For time-domain data, the passband filtering is cascaded Butterworth filters of
specified order. The default filter order is 5. The Butterworth filter is the same
as butter in the Signal Processing Toolbox product. For frequency-domain
data, select the indicated portions of the data to perform passband filtering.
Defining a Custom Filter
Use idfilt to apply passband and other custom filters to a time-domain or
a frequency-domain iddata object.
In general, you can specify any custom filter. Use this syntax to filter an
iddata object data using the filter called filter:
fdata = idfilt(data,filter)
You can define a general single-input/single-output (SISO) system for filtering
time-domain or frequency-domain data. For frequency-domain only, you can
specify the (nonparametric) frequency response of the filter.
You use this syntax to filter an iddata object data using a custom filter
specified by filter:
fdata = idfilt(data,filter)
filter can be also any of the following:
1-112
Filtering Data
filter = idm
filter = {num,den}
filter = {A,B,C,D}
idm is a SISO idmodel or LTI object. For more information about LTI objects,
see the Control System Toolbox documentation.
{num,den} defines the filter as a transfer function as a cell array of numerator
and denominator filter coefficients.
{A,B,C,D} is a cell array of SISO state-space matrices.
Specifically for frequency-domain data, you specify the frequency response
of the filter:
filter = Wf
Here, Wf is a vector of real or complex values that define the filter
frequency response, where the inputs and outputs of data at frequency
data.Frequency(kf) are multiplied by Wf(kf). Wf is a column vector with
the length equal to the number of frequencies in data.
When data contains several experiments, Wf is a cell array with the length
equal to the number of experiments in data.
Causal and Noncausal Filters
For time-domain data, the filtering is causal by default. Causal filters
typically introduce a phase shift in the results. To use a noncausal zero-phase
filter (corresponding to filtfilt in the Signal Processing Toolbox product),
specify a third argument in idfilt:
fdata = idfilt(data,filter,'noncausal')
For frequency-domain data, the signals are multiplied by the frequency
response of the filter. With the filters defined as passband filters, this
calculation gives ideal, zero-phase filtering (“brick wall filters”). Frequencies
that have been assigned zero weight by the filter (outside the passband or
via frequency response) are removed.
1-113
1
Data Processing
When you apply idfilt to an idfrd data object, the data is first converted
to a frequency-domain iddata object (see “Transforming Between
Frequency-Domain and Frequency-Response Data” on page 1-128). The result
is an iddata object.
See Also
To learn how to filter data during linear model estimation instead, you can
set the Focus property of the estimation algorithm to Filter and specify the
filter characteristics. For more information about model properties, see the
Algorithm Properties reference page.
For more information about prefiltering data, see the chapter on preprocessing
data in System Identification: Theory for the User, Second Edition, by Lennart
Ljung, Prentice Hall PTR, 1999.
For practical examples of prefiltering data, see the section on posttreatment
of data in Modeling of Dynamic Systems, by Lennart Ljung and Torkel Glad,
Prentice Hall PTR, 1994.
1-114
Generating Data Using Simulation
Generating Data Using Simulation
In this section...
“Commands for Generating and Simulating Data” on page 1-115
“Example – Creating Data with Periodic Inputs” on page 1-116
“Example – Generating Data Using Simulation” on page 1-117
“Simulating Data Using Other MathWorks Products” on page 1-118
Commands for Generating and Simulating Data
You can generate input data and simulate output data using a specified
model structure.
Simulating output data requires that you have a parametric model. For more
information about commands for constructing models, see “Commands for
Constructing Model Structures” on page 2-13.
To generate input data, use idinput to construct a signal with the desired
characteristics, such as a random Gaussian or binary signal or a sinusoid.
idinput returns a matrix of input values.
The following table lists the commands you can use to simulate output data.
For more information about these commands, see the corresponding reference
pages.
Commands for Generating and Simulating Data
Command
Description
Example
iddata
Constructs an iddata
object with input
channels only.
To construct input data data, use the
following command:
data = iddata([ ],[u v])
u is the input data, and v is white noise.
1-115
1
Data Processing
Commands for Generating and Simulating Data (Continued)
Command
Description
idinput
Constructs a signal
with the desired
characteristics, such
as a random Gaussian
or binary signal or a
sinusoid, and returns a
matrix of input values.
sim
Simulates response data
based on existing linear
or nonlinear parametric
model in the MATLAB
workspace.
Example
u = iddata([],...
idinput(400,'rbs',[0 0.3]));
To simulate the model output y for a given
input, use the following command:
y = sim(m,data)
m is the model object name, and data is input
data matrix or iddata object.
Example – Creating Data with Periodic Inputs
1 Create a periodic input for two inputs and consisting of five periods, where
each period is 300 samples.
per_u = idinput([300 2 5])
2 Create an iddata object using the periodic input and leaving the output
empty.
u = iddata([],per_u,'Period',...
[300; 300]);
You can use the periodic input to simulate the output, and the use etfe to
compute the estimated response of the model.
% Construct polynomial model
m0 =idpoly([1 -1.5 0.7],[0 1 0.5]);
% Construct random binary input
u = idinput([10 1 150],'rbs');
1-116
Generating Data Using Simulation
% Construct input data and noise
u = iddata([],u,'Period',10);
e = iddata([],randn(1500,1));
% Simulate model output with noise
y = sim(m0,[u e])
% Estimate frequency response
g = etfe([y u])
% Generate Bode plot
bode(g,'x',m0)
For periodic input, etfe honors the period and computes the frequency
response using an appropriate frequency grid. In this case, the Bode plot
shows a good fit at the five excited frequencies.
Example – Generating Data Using Simulation
This example demonstrates how you can create input data and a model, and
then use the data and the model to simulate output data. You create the
ARMAX model and simulate output data with random binary input u.
1 Load the three-input and one-output sample data.
load iddata8
2 Construct an ARMAX model, using the following commands:
A = [1 -1.2 0.7];
B(1,:) = [0 1 0.5 0.1]; % first input
B(2,:) = [0 1.5 -0.5 0]; % second input
B(3,:) = [0 -0.1 0.5 -0.1]; % third input
C = [1 0 0 0 0];
Ts = 1;
m = idpoly(A,B,C,'Ts',1);
In this example, the leading zeros in the B matrix indicate the input delay
(nk), which is 1 for each input channel. The trailing zero in B(2,:) makes
the number of coefficients equal for all channels.
3 Construct pseudorandom binary data for input to the simulation.
u = idinput([200,3],'prbs');
1-117
1
Data Processing
4 Simulate the model output.
sim(m,u)
5 Compare model output to measured data to see how well the models
captures the underlying dynamics.
compare(z8,m)
Simulating Data Using Other MathWorks Products
You can also simulate data using the Simulink® and Signal Processing
Toolbox software. Data simulated outside the System Identification Toolbox
product must be in the MATLAB workspace. For more information about
simulating models using the Simulink software, see “Simulating Model
Output” on page 11-6.
1-118
Transforming Between Time- and Frequency-Domain Data
Transforming Between Time- and Frequency-Domain Data
In this section...
“Transforming Data Domain in the GUI” on page 1-119
“Transforming Data Domain at the Command Line” on page 1-126
Transforming Data Domain in the GUI
• “Transforming Time-Domain Data” on page 1-119
• “Transforming Frequency-Domain Data” on page 1-123
• “Transforming Frequency-Response Data” on page 1-124
• “See Also” on page 1-126
Transforming Time-Domain Data
In the System Identification Tool GUI, time-domain data has an icon with a
white background. You can transform time-domain data to frequency-domain
or frequency-response data. The frequency values of the resulting frequency
vector range from 0 to the Nyquist frequency fS = π Ts , where Ts is the
sampling interval.
Transforming from time-domain to frequency-response data is equivalent to
estimating a model from the data using the spafdr method.
1-119
1
Data Processing
1 In the System Identification Tool GUI, drag the icon of the data you want to
transform to the Working Data rectangle, as shown in the following figure.
1-120
Transforming Between Time- and Frequency-Domain Data
2 In the Operations area, select <–Preprocess > Transform data in the
drop-down menu to open the Transform Data dialog box.
1-121
1
Data Processing
3 In the Transform to drop-down list, select one of the following:
• Frequency Function — Create a new idfrd object using the spafdr
method. Go to step 4.
• Frequency Domain Data — Create a new iddata object using the fft
method. Go to step 6.
4 In the Frequency Spacing list, select the spacing of the frequencies at
which the frequency function is estimated:
• linear — Uniform spacing of frequency values between the endpoints.
• logarithmic — Base-10 logarithmic spacing of frequency values
between the endpoints.
5 In the Number of Frequencies field, enter the number of frequency
values.
6 In the Name of new data field, type the name of the new data set. This
name must be unique in the Data Board.
7 Click Transform to add the new data set to the Data Board in the System
Identification Tool GUI.
8 Click Close to close the Transform Data dialog box.
1-122
Transforming Between Time- and Frequency-Domain Data
Transforming Frequency-Domain Data
In the System Identification Tool GUI, frequency-domain data has an icon
with a green background. You can transform frequency-domain data to
time-domain or frequency-response (frequency-function) data.
Transforming from time-domain or frequency-domain data to
frequency-response data is equivalent to estimating a nonparametric model of
the data using the spafdr method.
1 In the System Identification Tool GUI, drag the icon of the data you want
to transform to the Working Data rectangle.
2 Select <–Preprocess > Transform data.
3 In the Transform to list, select one of the following:
• Frequency Function — Create a new idfrd object using the spafdr
method. Go to step 4.
• Time Domain Data — Create a new iddata object using the ifft
(inverse fast Fourier transform) method. Go to step 6.
4 In the Frequency Spacing list, select the spacing of the frequencies at
which the frequency function is estimated:
• linear — Uniform spacing of frequency values between the endpoints.
• logarithmic — Base-10 logarithmic spacing of frequency values
between the endpoints.
5 In the Number of Frequencies field, enter the number of frequency
values.
6 In the Name of new data field, type the name of the new data set. This
name must be unique in the Data Board.
7 Click Transform to add the new data set to the Data Board in the System
Identification Tool GUI.
8 Click Close to close the Transform Data dialog box.
1-123
1
Data Processing
Transforming Frequency-Response Data
In the System Identification Tool GUI, frequency-response data has an icon
with a yellow background. You can transform frequency-response data to
frequency-domain data (iddata object) or to frequency-response data with a
different frequency resolution.
When you select to transform single-input/single-output (SISO)
frequency-response data to frequency-domain data, the toolbox creates
outputs that equal the frequency responses, and inputs equal to 1. Therefore,
the ratio between the Fourier transform of the output and the Fourier
transform of the input is equal to the system frequency response.
For the multiple-input case, the toolbox transforms the frequency-response
data to frequency-domain data as if each input contributes independently to
the entire output of the system and then combines information. For example,
if a system has three inputs, u1, u2, and u3 and two frequency samples, the
input matrix is set to:
⎡1
⎢1
⎢
⎢0
⎢
⎢0
⎢0
⎢
⎢⎣0
0 0⎤
0 0 ⎥⎥
1 0⎥
⎥
1 0⎥
0 1⎥
⎥
0 1 ⎥⎦
In general, for nu inputs and ns samples (the number of frequencies), the
input matrix has nu columns and (ns ⋅ nu) rows.
Note To create a separate experiment for the response from each input,
see “Transforming Between Frequency-Domain and Frequency-Response
Data” on page 1-128.
When you transform frequency-response data by changing its frequency
resolution, you can modify the number of frequency values by changing
between linear or logarithmic spacing. You might specify variable frequency
spacing to increase the number of data points near the system resonance
1-124
Transforming Between Time- and Frequency-Domain Data
frequencies, and also make the frequency vector coarser in the region outside
the system dynamics. Typically, high-frequency noise dominates away
from frequencies where interesting system dynamics occur. The System
Identification Tool GUI lets you specify logarithmic frequency spacing, which
results in a variable frequency resolution.
Note The spafdr command lets you lets you specify any variable frequency
resolution.
1 In the System Identification Tool GUI, drag the icon of the data you want
to transform to the Working Data rectangle.
2 Select <–Preprocess > Transform data.
3 In the Transform to list, select one of the following:
• Frequency Domain Data — Create a new iddata object. Go to step 6.
• Frequency Function — Create a new idfrd object with different
resolution (number and spacing of frequencies) using the spafdr method.
Go to step 4.
4 In the Frequency Spacing list, select the spacing of the frequencies at
which the frequency function is estimated:
• linear — Uniform spacing of frequency values between the endpoints.
• logarithmic — Base-10 logarithmic spacing of frequency values
between the endpoints.
5 In the Number of Frequencies field, enter the number of frequency
values.
6 In the Name of new data field, type the name of the new data set. This
name must be unique in the Data Board.
7 Click Transform to add the new data set to the Data Board in the System
Identification Tool GUI.
8 Click Close to close the Transform Data dialog box.
1-125
1
Data Processing
See Also
For a description of time-domain, frequency-domain, and frequency-response
data, see “Importing Data into the MATLAB Workspace” on page 1-5.
To learn how to transform data at the command line instead of the GUI, see
“Transforming Data Domain at the Command Line” on page 1-126.
Transforming Data Domain at the Command Line
• “Supported Data Transformations” on page 1-126
• “Transforming Between Time and Frequency Domain” on page 1-127
• “Transforming Between Frequency-Domain and Frequency-Response
Data” on page 1-128
• “See Also” on page 1-130
Supported Data Transformations
The following table shows the different ways you can transform data from one
data domain to another. If the transformation is supported for a given row
and column combination in the table, the method used by the software is
listed in the cell at their intersection.
1-126
Original Data
Format
To Time Domain
(iddata object)
To Frequency
Domain
(iddata object)
To Frequency
Function
(idfrd object)
Time Domain
(iddata object)
No.
Yes, using fft.
Yes, using etfe,
spa, or spafdr.
Transforming Between Time- and Frequency-Domain Data
Original Data
Format
To Time Domain
(iddata object)
To Frequency
Domain
(iddata object)
To Frequency
Function
(idfrd object)
Frequency
Domain
(iddata object)
Yes, using ifft.
No.
Yes, using etfe,
spa, or spafdr.
Frequency
Function
(idfrd object)
No.
Yes. Calculation
creates
frequency-domain
iddata object
that has the
same ratio
between output
and input as the
original idfrd
object.
Yes. Calculates
a frequency
function with
different
resolution
(number and
spacing of
frequencies)
using spafdr.
Transforming Between Time and Frequency Domain
The iddata object stores time-domain or frequency-domain data. The
following table summarizes the commands for transforming data between
time and frequency domains.
1-127
1
Data Processing
Command
Description
Syntax Example
fft
Transforms time-domain
data to the frequency
domain.
To transform time-domain
iddata object t_data to
frequency-domain iddata
object f_data with N
frequency points, use:
You can specify N, the
number of frequency
values.
ifft
Transforms
frequency-domain data
to the time domain.
Frequencies are linear and
equally spaced.
f_data =
fft(t_data,N)
To transform
frequency-domainiddata
object f_data to
time-domain iddata
object t_data, use:
t_data =
ifft(f_data)
Transforming Between Frequency-Domain and
Frequency-Response Data
You can transform frequency-response data to frequency-domain data
(iddata object). The idfrd object represents complex frequency-response of
the system at different frequencies. For a description of this type of data, see
“Importing Frequency-Response Data into MATLAB” on page 1-10.
When you select to transform single-input/single-output (SISO)
frequency-response data to frequency-domain data, the toolbox creates
outputs that equal the frequency responses, and inputs equal to 1. Therefore,
the ratio between the Fourier transform of the output and the Fourier
transform of the input is equal to the system frequency response.
For information about changing the frequency resolution of frequency-response
data to a new constant or variable (frequency-dependent) resolution, see the
spafdr reference page. You might use this advanced feature to increase the
number of data points near the system resonance frequencies and make the
frequency vector coarser in the region outside the system dynamics. Typically,
1-128
Transforming Between Time- and Frequency-Domain Data
high-frequency noise dominates away from frequencies where interesting
system dynamics occur.
Note You cannot transform an idfrd object to a time-domain iddata object.
To transform an idfrd object with the name idfrdobj to a frequency-domain
iddata object, use the following syntax:
dataf = iddata(idfrdobj)
The resulting frequency-domain iddata object contains values at the same
frequencies as the original idfrd object.
For the multiple-input case, the toolbox represents frequency-response data
as if each input contributes independently to the entire output of the system
and then combines information. For example, if a system has three inputs,
u1, u2, and u3 and two frequency samples, the input matrix is set to:
⎡1
⎢1
⎢
⎢0
⎢
⎢0
⎢0
⎢
⎢⎣0
0 0⎤
0 0 ⎥⎥
1 0⎥
⎥
1 0⎥
0 1⎥
⎥
0 1 ⎥⎦
In general, for nu inputs and ns samples, the input matrix has nu columns
and (ns ⋅ nu) rows.
If you have ny outputs, the transformation operation produces an output
matrix has ny columns and (ns ⋅ nu) rows using the values in the complex
frequency response G(iw) matrix (ny-by-nu-by-ns). In this example, y1 is
determined by unfolding G(1,1,:), G(1,2,:), and G(1,3,:) into three
column vectors and vertically concatenating these vectors into a single column.
Similarly, y2 is determined by unfolding G(2,1,:), G(2,2,:), and G(2,3,:)
into three column vectors and vertically concatenating these vectors.
1-129
1
Data Processing
If you are working with multiple inputs, you also have the option of
storing the contribution by each input as an independent experiment in a
multiexperiment data set. To transform an idfrd object with the name
idfrdobj to a multiexperiment data set datf, where each experiment
corresponds to each of the inputs in idfrdobj
datf = iddata(idfrdobj,'me')
In this example, the additional argument 'me' specifies that multiple
experiments are created.
By default, transformation from frequency-response to frequency-domain
data strips away frequencies where the response is inf or NaN. To preserve
the entire frequency vector, use datf = iddata(idfrdobj,'inf'). For more
information, type help idfrd/iddata.
See Also
Transforming from time-domain or frequency-domain data to
frequency-response data is equivalent to creating a frequency-response model
from the data. For more information, see “Identifying Frequency-Response
Models” on page 3-2.
1-130
Manipulating Complex-Valued Data
Manipulating Complex-Valued Data
In this section...
“Supported Operations for Complex Data” on page 1-131
“Processing Complex iddata Signals at the Command Line” on page 1-131
Supported Operations for Complex Data
System Identification Toolbox estimation algorithms support complex data.
For example, the following estimation commands estimate complex models
from complex data: ar, armax, arx, bj, covf, ivar, iv4, oe, pem, spa, and
n4sid.
Model transformation routines, such as freqresp and zpkdata, work for
complex-valued models. However, they do not provide pole-zero confidence
regions. For complex models, the parameter variance-covariance information
refers to the complex-valued parameters and the accuracy of the real and
imaginary is not computed separately.
The display commands compare and plot also work with complex-valued
data and models, but only show the absolute values of the signals. To plot
the real and imaginary parts of the data separately, use plot(real(data))
and plot(imag(data)), respectively.
Processing Complex iddata Signals at the Command
Line
If the iddata object data contains complex values, you can use the following
commands to process the complex data and create a new iddata object.
Command
Description
abs(data)
Absolute value of complex signals in iddata object.
angle(data)
Phase angle (in radians) of each complex signals in
iddata object.
1-131
1
Data Processing
Command
Description
complex(data)
For time-domain data, this command makes the iddata
object complex—even when the imaginary parts are
zero. For frequency-domain data that only stores
the values for nonnegative frequencies, such that
realdata(data)=1, it adds signal values for negative
frequencies using complex conjugation.
imag(data)
Selects the imaginary parts of each signal in iddata
object.
isreal(data)
1 when data (time-domain or frequency-domain)
contains only real input and output signals, and returns
0 when data (time-domain or frequency-domain)
contains complex signals.
real(data)
Real part of complex signals in iddata object.
realdata(data)
Returns a value of 1 when data is a real-valued,
time-domain signal, and returns 0 otherwise.
For example, suppose that you create a frequency-domain iddata object Datf
by applying fft to a real-valued time-domain signal to take the Fourier
transform of the signal. The following is true for Datf:
isreal(Datf) = 0
realdata(Datf) = 1
1-132
2
Choosing Your System
Identification Strategy
• “Recommended Model Estimation Sequence” on page 2-2
• “Supported Models for Time- and Frequency-Domain Data” on page 2-4
• “Supported Continuous-Time and Discrete-Time Models” on page 2-7
• “Commands for Model Estimation” on page 2-9
• “Creating Model Structures at the Command Line” on page 2-11
• “Modeling Multiple-Output Systems” on page 2-21
2
Choosing Your System Identification Strategy
Recommended Model Estimation Sequence
System identification is an iterative process, where you identify models
with different structures from data and compare model performance. You
start by estimating the parameters of simple model structures. If the model
performance is poor, you gradually increase the complexity of the model
structure. Ultimately, you choose the simplest model that best describes
the dynamics of your system.
Another reason to start with simple model structures is that higher-order
models are not always more accurate. Increasing model complexity increases
the uncertainties in parameter estimates and typically requires more data
(which is common in the case of nonlinear models).
Note Model structure is not the only factor that determines model accuracy.
If your model is poor, you might need to preprocess your data by removing
outliers or filtering noise. For more information, see “Ways to Process Data
for System Identification” on page 1-2.
Estimate impulse-response and frequency-response models first to gain
insight into the system dynamics and assess whether a linear model is
sufficient. Then, estimate parametric models in the following order:
1 ARX polynomial and state-space models provide the simplest structures.
These models let you estimate the model order and noise dynamics.
In the System Identification Tool GUI. Select to estimate the ARX
linear parametric model and the state-space model using the N4SID
method.
At the command line. Use the arx and the n4sid commands.
For more information, see “Identifying Input-Output Polynomial Models”
on page 3-41 and “Identifying State-Space Models” on page 3-73.
2 ARMAX and BJ polynomial models provide more complex structures and
require iterative estimation. Try several model orders and keep the model
orders as low as possible.
2-2
Recommended Model Estimation Sequence
In the System Identification Tool GUI. Select to estimate the BJ and
ARMAX linear parametric models.
At the command line. Use the bj or armax commands.
For more information, see “Identifying Input-Output Polynomial Models”
on page 3-41.
3 Nonlinear ARX or Hammerstein-Wiener models provide nonlinear
structures. For more information, see Chapter 4, “Nonlinear Black-Box
Model Identification”.
For general information about choosing you model strategy, see “Choosing
Which Models to Estimate”. For information about validating models, see
“Overview of Model Validation and Plots” on page 8-2.
To learn more about refining estimated models, see “Refining Linear
Parametric Models” on page 3-103 and “Refining Nonlinear Black-Box
Models” on page 4-28.
2-3
2
Choosing Your System Identification Strategy
Supported Models for Time- and Frequency-Domain Data
In this section...
“Supported Models for Time-Domain Data” on page 2-4
“Supported Models for Frequency-Domain Data” on page 2-5
Supported Models for Time-Domain Data
Continuous-Time Models
You can directly estimate the following types of continuous-time models:
• Low-order transfer functions. See “Identifying Low-Order Transfer
Functions (Process Models)” on page 3-22.
• Input-output polynomial models. See “Identifying Input-Output Polynomial
Models” on page 3-41.
• State-space models. See “Identifying State-Space Models” on page 3-73.
To get a linear, continuous-time model of arbitrary structure for time-domain
data, you can estimate a discrete-time model, and then use d2c to transform
it to a continuous-time model.
Discrete-Time Models
You can estimate all linear and nonlinear models supported by the
System Identification Toolbox product as discrete-time models, except the
continuous-time transfer functions (process models). For more information
about process models, see “Identifying Low-Order Transfer Functions (Process
Models)” on page 3-22.
ODEs (Grey-Box Models)
You can estimate both continuous-time and discrete-time models from
time-domain data for linear and nonlinear differential and difference
equations. See Chapter 5, “ODE Parameter Estimation (Grey-Box Modeling)”.
2-4
Supported Models for Time- and Frequency-Domain Data
Nonlinear Models
You can estimate discrete-time Hammerstein-Wiener and nonlinear ARX
models from time-domain data. See Chapter 4, “Nonlinear Black-Box Model
Identification”.
You can also estimate nonlinear grey-box models from time-domain data. See
“Estimating Nonlinear Grey-Box Models” on page 5-16.
Supported Models for Frequency-Domain Data
There are two types of frequency-domain data:
• Continuous-time data
• Discrete-time data
You specify frequency-domain data as continuous- or discrete-time when you
either import data into the System Identification Tool GUI or create a System
Identification Toolbox data object. For more information about representing
your data as System Identification Toolbox data objects, see Chapter 1, “Data
Processing”.
To designate discrete-time data, you set the sampling interval of the data to
the experimental data sampling interval. To designate continuous-time data,
you must set the sampling interval of the data to zero. Setting the sampling
interval to zero corresponds to taking a Fourier transform of continuous-time
data.
Continuous-Time Models
You can estimate the following types of continuous-time models directly:
• Low-order transfer functions. See “Identifying Low-Order Transfer
Functions (Process Models)” on page 3-22.
• Input-output polynomial models. See “Identifying Input-Output Polynomial
Models” on page 3-41.
• State-space models.
From continuous-time frequency-domain data, you can estimate
continuous-time state-space models. From discrete-time frequency-domain
2-5
2
Choosing Your System Identification Strategy
data, you can estimate continuous-time black-box models with canonical
parameterization. See “Identifying State-Space Models” on page 3-73.
To get a linear, continuous-time model of arbitrary structure for
frequency-domain data, you can estimate a discrete-time model and use d2c
to transform it to a continuous-time model.
Discrete-Time Models
You can estimate only ARX and output-error (OE) polynomial models using
frequency-domain data. See “Identifying Input-Output Polynomial Models”
on page 3-41.
Other linear model structures include noise models, which are not supported
for frequency-domain data.
ODEs (Grey-Box Models)
For linear grey-box models, you can estimate both continuous-time and
discrete-time models from frequency-domain data.
Nonlinear grey-box models are supported only for time-domain data.
See Chapter 5, “ODE Parameter Estimation (Grey-Box Modeling)”.
Nonlinear Black-Box Models
Frequency-domain data is not relevant to nonlinear black-box models, which
support only time-domain data.
2-6
Supported Continuous-Time and Discrete-Time Models
Supported Continuous-Time and Discrete-Time Models
For linear and nonlinear ODEs (grey-box models), you can specify any
ordinary differential or difference equation to represent your continuous-time
or discrete-time model in state-space form, respectively. In the linear case,
both time-domain and frequency-domain data are supported. In the nonlinear
case, only time-domain data is supported.
For black-box models, the following tables summarize supported
continuous-time and discrete-time models.
Supported Continuous-Time Models
Model Type
Description
Low-order transfer functions
(process models)
Estimate low-order process models for up to three free poles
from either time- or frequency-domain data.
Linear input-output polynomial
models
To get a linear, continuous-time model of arbitrary
structure from time-domain data, you can estimate a
discrete-time model, and then use d2c to transform it into a
continuous-time model.
For frequency-domain data, you can directly estimate only
the ARX and output-error (OE) continuous-time polynomial
models by setting the sampling interval of the data to 0.
Other structures include noise models and are not supported
for frequency-domain data.
State-space models
To get a linear, continuous-time model of arbitrary
structure for time-domain data, you can estimate a
discrete-time model, and then use d2c to transform it into a
continuous-time model.
For frequency-domain data, you can estimate
continuous-time state-space models directly.
Linear ODEs (grey-box models
Estimate ordinary differential equations (ODEs) from either
time- or frequency-domain data.
Nonlinear ODEs (grey-box)
models
Estimate arbitrary differential equations (ODEs) from
time-domain data.
2-7
2
Choosing Your System Identification Strategy
Supported Discrete-Time Models
2-8
Model Type
Description
Linear, input-output polynomial
models
Estimate arbitrary-order, linear parametric models from
time- or frequency-domain data.
To get a discrete-time model, your data sampling interval
must be set to the (nonzero) value you used to sample in
your experiment.
Nonlinear black-box models
Estimate from time-domain data only.
Linear ODEs (grey-box) models
Estimate ordinary difference equations from time- or
frequency-domain data.
Nonlinear ODEs (grey-box)
models
Estimate ordinary difference equations from time-domain
data.
Commands for Model Estimation
Commands for Model Estimation
The quickest way to both construct a model object and estimate the model
parameters is to use estimation commands.
Note For ODEs (grey-box models), you must first construct the model
structure and then apply an estimation command to the resulting model
object.
For ARMAX, Box-Jenkins, and Output-Error Models—which you can only
estimate using the iterative prediction-error method—use the armax, bj, and
oe estimation commands, respectively. For more information about choosing
the models to estimate first, see “Recommended Model Estimation Sequence”
on page 2-2.
The following table summarizes System Identification Toolbox estimation
commands. For detailed information about using each command, see the
corresponding reference page.
Commands for Constructing and Estimating Models
Model Type
Estimation Commands
Continuous-time low-order
transfer functions (process
models)
pem
Linear input-output
polynomial models
armax (ARMAX only)
arx (ARX only)
bj (BJ only)
iv4 (ARX only)
oe (OE only)
pem (for all models)
State-space models
n4sid
pem
2-9
2
Choosing Your System Identification Strategy
Commands for Constructing and Estimating Models (Continued)
2-10
Model Type
Estimation Commands
Linear time-series models
ar
arx (for multiple outputs)
ivar
Nonlinear ARX models
nlarx
Hammerstein-Wiener
models
nlhw
Creating Model Structures at the Command Line
Creating Model Structures at the Command Line
In this section...
“About System Identification Toolbox Model Objects” on page 2-11
“When to Construct a Model Structure Independently of Estimation” on
page 2-12
“Commands for Constructing Model Structures” on page 2-13
“Model Properties” on page 2-14
“See Also” on page 2-20
About System Identification Toolbox Model Objects
Objects are based on model classes. Each class is a blueprint that defines the
following information about your model:
• How the object stores data
• Which operations you can perform on the object
This toolbox includes nine classes for representing models. For example,
idpoly represents linear input-output polynomial models, and idss
represents linear state-space models. For a complete list of available model
objects, see “Commands for Constructing Model Structures” on page 2-13.
Model properties define how a model object stores information. Model objects
store information about a model, including the mathematical form of a
model, names of input and output channels, units, names and values of
estimated parameters, parameter uncertainties, algorithm specifications, and
estimation information. For example, the idpoly model class has a property
called InputName for storing one or more input channel names. Different
model objects have different properties.
The allowed operations on an object are called methods. In the System
Identification Toolbox product, some methods have the same name but apply
to multiple model objects. For example, the method bode creates a bode plot
for all linear model objects. However, other methods are unique to a specific
2-11
2
Choosing Your System Identification Strategy
model object. For example, the estimation method n4sid is unique to the
state-space model object idss.
Every class has a special method for creating objects of that class, called the
constructor. Using a constructor creates an instance of the corresponding
class or instantiates the object. The constructor name is the same as the class
name. For example, idpoly is both the name of the class representing linear
black-box polynomial models and the name of the constructor for instantiating
the model object.
For a tutorial about estimating models at the command line, see “Tutorial –
Identifying Linear Models Using the Command Line” in System Identification
Toolbox Getting Started Guide.
When to Construct a Model Structure Independently
of Estimation
You use model constructors to create a model object at the command line by
specifying all required model properties explicitly.
You must construct the model object independently of estimation when you
want to:
• Simulate a model
• Analyze a model
• Specify an initial guess for specific model parameter values before
estimation
In most cases, you can use the estimation commands to both construct
and estimate the model—without having to construct the model object
independently. For example, the estimation command pem lets you specify
both the model structure with unknown parameters and the estimation
algorithm. For information about how to both construct and estimate models
with a single command, see “Commands for Model Estimation” on page 2-9.
In case of grey-box models, you must always construct the model object first
and then estimate the parameters of the ordinary differential or difference
equation. For more information, see Chapter 5, “ODE Parameter Estimation
(Grey-Box Modeling)”.
2-12
Creating Model Structures at the Command Line
Commands for Constructing Model Structures
The following table summarizes the model constructors available in the
System Identification Toolbox product for representing various types of
models.
After model estimation, you can recognize the corresponding model objects
in the MATLAB Workspace browser by their class names. The name of the
constructor matches the name of the object it creates.
For information about how to both construct and estimate models with a
single command, see “Commands for Model Estimation” on page 2-9.
Summary of Model Constructors
Model Constructor
Resulting Model Class
Single or Multiple Outputs?
idarx
Parametric multiple-output
ARX models. Also
represents nonparametric
transient-response models.
Single- or multiple-output
models.
idfrd
Nonparametric
frequency-response model.
Single- or multiple-output
models.
idproc
Continuous-time, low-order
transfer functions (process
models).
Single-output models only.
idpoly
Linear input-output polynomial
models:
Single-output models only.
• ARX
• ARMAX
• Output-Error
• Box-Jenkins
idss
Linear state-space models.
Single- or multiple-output
models.
2-13
2
Choosing Your System Identification Strategy
Summary of Model Constructors (Continued)
Model Constructor
Resulting Model Class
Single or Multiple Outputs?
idgrey
Linear ordinary differential or
difference equations (grey-box
models). You write an M-file
that translates user parameters
to state-space matrices.
Single- and multiple-output
models.
idnlgrey
Nonlinear ordinary differential
or difference equation (grey-box
models). You write an M-file
or MEX-file to represent the
set of first-order differential or
difference equations.
Supports single- and
multiple-output models.
idnlarx
Nonlinear ARX models, which
define the predicted output as a
nonlinear function of past inputs
and outputs.
Single- or multiple-output
models.
idnlhw
Nonlinear Hammerstein-Wiener
models, which include a linear
dynamic system with nonlinear
static transformations of inputs
and outputs.
Single- or multiple-output
models. Does not support time
series.
For more information about when to use these commands, see “When to
Construct a Model Structure Independently of Estimation” on page 2-12.
Model Properties
• “Categories of Model Properties” on page 2-15
• “Specifying Model Properties for Estimation” on page 2-16
• “Viewing Model Properties and Estimated Parameters” on page 2-17
• “Getting Help on Model Properties at the Command Line” on page 2-19
2-14
Creating Model Structures at the Command Line
Categories of Model Properties
The way a model object stores information is defined by the properties of the
corresponding model class.
Each model object has properties for storing information that are relevant
only to that specific model type. However, the idarx, idgrey, idpoly, idproc,
and idss model objects are based on the idmodel superclass and inherit all
idmodel properties.
Similarly, the nonlinear models idnlarx, idnlhw, and idnlgrey are based on
the idnlmodel superclass and inherit all idnlmodel properties.
In general, all nonlinear model objects have properties that belong to the
following categories:
• Names of input and output channels, such as InputName and OutputName
• Sampling interval of the model, such as Ts
• Units for time or frequency
• Model order and mathematical structure (for example, ODE or
nonlinearities)
• Properties that store estimation results and model uncertainty
• User comments, such as Notes and Userdata
• Estimation algorithm information
-
Algorithm
Structure includes fields that specify the estimation method. Algorithm
includes another structure, called Advanced, which provides additional
flexibility for setting the search algorithm. Different fields apply to
different estimation techniques.
For linear parametric models, Algorithm specifies the frequency
weighing of the estimation using the Focus property.
Note Algorithm does not apply to idfrd models.
2-15
2
Choosing Your System Identification Strategy
-
EstimationInfo
Structure includes read-only fields that describe the estimation data set,
quantitative model quality measures, search termination conditions,
how the initial states are handled, and any warnings encountered during
the estimation.
For information about getting help on object properties, see “Getting Help on
Model Properties at the Command Line” on page 2-19.
Specifying Model Properties for Estimation
If you are estimating a new model, you can specify model properties directly
in the estimator syntax. For a complete list of model estimation commands,
see “Commands for Model Estimation” on page 2-9.
When using the commands that let you both construct and estimate a model,
you can specify all top-level model properties in the estimator syntax.
Top-level properties are those listed when you type get(object_name). You
can also specify the top-level fields of the Algorithm structure directly in
the estimator using property-value pairs—such as focus in the previous
example—without having to define the structure fields first.
The following commands load the sample data, z8, construct an ARMAX
model, and estimate the model parameters. The arguments of the armax
estimator specify model properties as property-value pairs.
load iddata8
m_armax=armax(z8,'na',4,...
'nb',[3 2 3],...
'nc',4,...
'nk',[0 0 0],...
'focus', 'simulation',...
'covariance', 'none',...
'tolerance',1e-5,...
'maxiter',50);
focus, covariance, tolerance, and maxiter are fields in the Algorithm
model property and specify aspects of the estimation algorithm.
2-16
Creating Model Structures at the Command Line
For linear models, you can use a shortcut to specify the second-level
Algorithm properties, such as Advanced. With this syntax, you can reference
the structure fields by name without specifying the structure to which these
fields belong.
However, when estimating nonlinear black-box models, you must set the
specific fields of the Advanced Algorithm structure and the nonlinearity
estimators before estimation. For example, suppose you want to set the value
of the wavenet object property Options, which is a structure. The following
commands set the Options values before estimation and include the modified
wavenet object in the estimator:
% Define wavenet object with defaul properties
W = wavenet;
% Specify variable to represent Options field
O = W.Options;
% Modify values of specific Options fields
O.MaxLevels = 5 ;
O.DilationStep = 2;
% Estimate model using new Options settings
M = nlarx(data,[2 2 1],wavenet('options',O))
where O specifies the values of the Options structure fields and M is the
estimated model. For more information about these and other commands,
see the corresponding reference page.
Viewing Model Properties and Estimated Parameters
To view all the properties and values of any model object, use the get
command. For example, type the following at the prompt to load sample data,
compute an ARX model, and list the model properties:
load iddata8
m_arx=arx(z8,[4 3 2 3 0 0 0]);
get(m_arx)
To access a specific property, use dot notation. For example, to view the
A matrix containing the estimated parameters in the previous model, type
the following command:
m_arx.a
2-17
2
Choosing Your System Identification Strategy
ans =
1.0000
-0.8441
-0.1539
0.2278
0.1239
Similarly, to access the uncertainties in these parameter estimates, type
the following command:
m_arx.da
ans =
0
0.0357
0.0502
0.0438
0.0294
Property names are not case sensitive. You do not need to type the entire
property name if the first few letters uniquely identify the property.
To change property values for an existing model object, use the set command
or dot notation. For example, to change the input delays for all three input
channels to [1 1 1], type the following at the prompt:
set(m_arx,'nk',[1 1 1])
or equivalently
m_arx.nk = [1 1 1]
Some model properties, such as Algorithm, are structures. To access the
fields in this structure, use the following syntax:
model.algorithm.PropertyName
where PropertyName represents any of the Algorithm fields. For example,
to change the maximum number of iterations using the MaxIter property,
type the following command:
m_arx.algorithm.MaxIter=50
To verify the new property value, type the following:
m_arx.algorithm.MaxIter
Note PropertyName refers to fields in a structure and is case sensitive. You
must type the entire property name. Use the Tab key when typing property
names to get completion suggestions.
2-18
Creating Model Structures at the Command Line
Getting Help on Model Properties at the Command Line
If you need to learn more about model properties while working at the
command line, you can use the idprops command to list the properties and
values for each object.
Some model objects are based on the superclasses idmodel and idnlmodel
and inherit the properties of these superclasses. For such model objects, you
must independently look up the properties for both the model object and for
its superclass.
The following table summarizes the commands for getting help on object
properties.
Help Commands for Model Properties
Model Class
idarx
Help Commands
idprops idarx
Also inherits properties from idmodel.
idfrd
idprops idfrd
idnlmodel
idprops idnlmodel
idmodel
idprops idmodel
idprops idmodel Algorithm
idprops idmodel EstimationInfo
Also see the Algorithm and EstimationInfo reference page.
idproc
idprops idproc
Also inherits properties from idmodel.
idpoly
idprops idpoly
Also inherits properties from idmodel.
idss
idprops idss
Also inherits properties from idmodel.
idgrey
idprops idgrey
Also inherits properties from idmodel.
idnlgrey
idprops idnlgrey
idprops idnlgrey Algorithm
idprops idnlgrey EstimationInfo
Also inherits properties from idnlmodel.
2-19
2
Choosing Your System Identification Strategy
Help Commands for Model Properties (Continued)
Model Class
Help Commands
idnlarx
idprops idnlarx
idprops idnlarx Algorithm
idprops idnlarx EstimationInfo
Also inherits properties from idnlmodel.
idnlhw
idprops idnlhw
idprops idnlhw Algorithm
idprops idnlhw EstimationInfo
Also inherits properties from idnlmodel.
See Also
Validate each model directly after estimation to help fine-tune your modeling
strategy. When you do not achieve a satisfactory model, you can try a
different model structure and order, or try another identification algorithm.
For more information about validating and troubleshooting models, see
Chapter 8, “Model Analysis”.
After you have selected a good model to represent your system, see Chapter 9,
“Simulation and Prediction”.
2-20
Modeling Multiple-Output Systems
Modeling Multiple-Output Systems
In this section...
“About Modeling Multiple-Output Systems” on page 2-21
“Modeling Multiple Outputs Directly” on page 2-22
“Modeling Multiple Outputs as a Combination of Single-Output Models”
on page 2-22
“Improving Multiple-Output Estimation Results by Weighing Outputs
During Estimation” on page 2-23
About Modeling Multiple-Output Systems
You can estimate multiple-output model directly using all the inputs and
outputs, or you can try building models for subsets of the most important
input and output channels. To learn more about each approach, see:
• “Modeling Multiple Outputs Directly” on page 2-22
• “Modeling Multiple Outputs as a Combination of Single-Output Models”
on page 2-22
Modeling multiple-output systems is more challenging because input/output
couplings require additional parameters to obtain a good fit and involve more
complex models. In general, a model is better when more data inputs are
included during modeling. Including more outputs typically leads to worse
simulation results because it is harder to reproduce the behavior of several
outputs simultaneously.
If you know that some of the outputs have poor accuracy and should be
less important during estimation, you can control how much each output
is weighed in the estimation. For more information, see “Improving
Multiple-Output Estimation Results by Weighing Outputs During
Estimation” on page 2-23.
2-21
2
Choosing Your System Identification Strategy
Modeling Multiple Outputs Directly
You can estimate the following types of models for multiple-output data:
• Impulse- and step-response models
• Frequency-response models
• Linear ARX models
• State-space models
• Nonlinear ARX and Hammerstein-Wiener models
• Linear and nonlinear ODEs
Tip Estimating multiple-output state-space models directly generally
produces better results than estimating other types of multiple-output models
directly.
Modeling Multiple Outputs as a Combination of
Single-Output Models
You may find that it is harder for a single model to explain the behavior of
several outputs. If you get a poor fit estimating a multiple-output model
directly, you can try building models for subsets of the most important input
and output channels.
Use this approach when no feedback is present in the dynamic system and
there are no couplings between the outputs. If you are unsure about the
presence of feedback, see “Getting Advice About Your Data” on page 1-84.
To construct partial models, use subreferencing to create partial data sets,
such that each data set contains all inputs and one output. For more
information about creating partial data sets, see the following sections in the
System Identification Toolbox User’s Guide:
• For working in the System Identification Tool GUI, see “Creating Data Sets
from a Subset of Signal Channels” on page 1-31.
• For working at the command line, see the “Subreferencing iddata Objects”
on page 1-55.
2-22
Modeling Multiple-Output Systems
After validating the single-output models, use vertical concatenation to
combine these partial models into a single multiple-output model. For more
information about concatenation, see “Concatenating iddata Objects” on page
1-65 or “Concatenating idfrd Objects” on page 1-71.
You can try refining the concatenated multiple-output model using the
original (multiple-output) data set.
Improving Multiple-Output Estimation Results by
Weighing Outputs During Estimation
When estimating linear and nonlinear black-box models for multiple-output
systems, you can control the relative importance of output channels during
the estimation process. The ability to control how much each output is
weighed during estimation is useful when some of the measured outputs
have poor accuracy or should be treated as less important during estimation.
For example, if you have already modeled one output well, you might want
to focus the estimation on modeling the remaining outputs. Similarly, you
might want to refine a model for a subset of outputs.
You can specify output weights directly in the estimation command using
the Criterion and Weighting fields of the Algorithm property. You must
set the Criterion field to Trace, and set the Weighting field to the matrix
that contains the output weights. The Trace criterion minimizes the weighted
sum of the prediction errors using the weights specified by Weighting.
The following code snippet shows how to specify the Criterion and Weighting
Algorithm fields as part of the pem command:
model=pem(z,2,'criterion','trace','weighting',diag(Q,1))
where Q is a vector of positive values and the higher values for outputs to be
emphasized more during estimation.
You set Weighting to a positive semi-definite symmetric matrix of size equal
to number of outputs. By default, Weighting is an identity matrix, which
means that all outputs are weighed equally during estimation.
For more information about these Algorithm fields for linear estimation, see
the Algorithm Properties reference page. For more information about
2-23
2
Choosing Your System Identification Strategy
the Algorithm fields for nonlinear estimation, see the idnlarx and idnlhw
reference pages.
Note For multiple-output idnlarx models containing neuralnet or
treepartition nonlinearity estimators, output weighting is ignored because
each output is estimated independently.
2-24
3
Linear Model Identification
• “Identifying Frequency-Response Models” on page 3-2
• “Identifying Impulse-Response Models” on page 3-14
• “Identifying Low-Order Transfer Functions (Process Models)” on page 3-22
• “Identifying Input-Output Polynomial Models” on page 3-41
• “Identifying State-Space Models” on page 3-73
• “Refining Linear Parametric Models” on page 3-103
• “Extracting Parameter Values from Linear Models” on page 3-108
• “Extracting Dynamic Model and Noise Model Separately” on page 3-110
• “Transforming Between Discrete-Time and Continuous-Time
Representations” on page 3-112
• “Transforming Between Linear Model Representations” on page 3-117
• “Subreferencing Model Objects” on page 3-119
• “Concatenating Model Objects” on page 3-124
• “Merging Model Objects” on page 3-128
3
Linear Model Identification
Identifying Frequency-Response Models
In this section...
“What Is a Frequency-Response Model?” on page 3-2
“Data Supported by Frequency-Response Models” on page 3-3
“How to Estimate Frequency-Response Models in the GUI” on page 3-3
“How to Estimate Frequency-Response Models at the Command Line” on
page 3-5
“Options for Computing Spectral Models” on page 3-5
“Options for Frequency Resolution” on page 3-6
“Spectral Analysis Algorithm” on page 3-8
“Understanding Spectrum Normalization” on page 3-11
What Is a Frequency-Response Model?
You can estimate frequency-response models and visualize the responses on
a Bode plot, which shows the amplitude change and the phase shift as a
function of the sinusoid frequency.
For a discrete-time system sampled with a time interval T, the
frequency-response model G(z) relates the Z-transforms of the input U(z)
and output Y(z):
Y ( z) = G( z)U ( z)
The frequency-response function describes the steady-state response of a
system to sinusoidal inputs. For a linear system, a sinusoidal input of a
specific frequency results in an output that is also a sinusoid with the same
frequency, but with a different amplitude and phase. The frequency response
describes the amplitude change and phase shift as a function of frequency.
In other words, the frequency-response function, G(eiwT), is the Laplace
transform of the impulse response that is evaluated on the imaginary axis.
The frequency-response function is the transfer function G(z) evaluated on
the unit circle.
3-2
Identifying Frequency-Response Models
Data Supported by Frequency-Response Models
You can estimate spectral analysis models from data with the following
characteristics:
• Complex or real data.
• Time- or frequency-domain iddata or idfrd data object. To learn more
about estimating time-series models, see Chapter 6, “Time Series Model
Identification”.
• Single- or multiple-output data.
How to Estimate Frequency-Response Models in the
GUI
You must have already imported your data into the GUI and performed any
necessary preprocessing operations. For more information, see Chapter
1, “Data Processing”.
To estimate frequency-response models in the System Identification Tool GUI:
1 In the System Identification Tool GUI, select Estimate > Spectral
models to open the Spectral Model dialog box.
2 In the Method list, select the spectral analysis method you want to use.
For information about each method, see “Options for Computing Spectral
Models” on page 3-5.
3 Specify the frequencies at which to compute the spectral model in one of
the following ways:
• In the Frequencies field, enter either a vector of values, a MATLAB
expression that evaluates to a vector, or a variable name of a vector in
the MATLAB workspace. For example, logspace(-1,2,500).
• Use the combination of Frequency Spacing and Frequencies to
construct the frequency vector of values:
– In the Frequency Spacing list, select Linear or Logarithmic
frequency spacing.
3-3
3
Linear Model Identification
Note For etfe, only the Linear option is available.
– In the Frequencies field, enter the number of frequency points.
For time-domain data, the frequency ranges from 0 to the Nyquist
frequency. For frequency-domain data, the frequency ranges from the
smallest to the largest frequency in the data set.
4 In the Frequency Resolution field, enter the frequency resolution, as
described in “Options for Frequency Resolution” on page 3-6. To use the
default value, enter default or, equivalently, the empty matrix [].
5 In the Model Name field, enter the name of the correlation analysis model.
The model name should be unique in the Model Board.
6 Click Estimate to add this model to the Model Board in the System
Identification Tool GUI.
7 In the Spectral Model dialog box, click Close.
8 To view the frequency-response plot, select the Frequency resp check
box in the System Identification Tool GUI. For more information about
working with this plot, see “Using Frequency-Response Plots to Validate
Models” on page 8-32.
9 To view the estimated disturbance spectrum, select the Noise spectrum
check box in the System Identification Tool GUI. For more information
about working with this plot, see “Creating Noise-Spectrum Plots” on page
8-40.
10 After estimating the model, see Chapter 8, “Model Analysis”, to validate
the model.
To export the model to the MATLAB workspace, drag it to the To Workspace
rectangle in the System Identification Tool GUI. You can retrieve the
responses from the resulting idfrd model object using the bode or nyquist
command.
3-4
Identifying Frequency-Response Models
How to Estimate Frequency-Response Models at the
Command Line
You can use the etfe, spa, and spafdr commands to estimate spectral
models. The following table provides a brief description of each command
and usage examples.
The resulting models are stored as idfrd model objects. For detailed
information about the commands and their arguments, see the corresponding
reference page.
Commands for Frequency Response
Command
Description
Usage
etfe
Estimates an empirical
transfer function using
Fourier analysis.
To estimate a model m, use the following syntax:
Estimates a frequency
response with a fixed
frequency resolution
using spectral analysis.
To estimate a model m, use the following syntax:
Estimates a frequency
response with a variable
frequency resolution
using spectral analysis.
To estimate a model m, use the following syntax:
spa
spafdr
m=etfe(data)
m=spa(data)
m=spafdr(data,R,w)
where R is the resolution vector and w is the frequency
vector.
After estimating the model, see Chapter 8, “Model Analysis” to validate the
model.
Options for Computing Spectral Models
This section describes how to select the method for computing spectral models
in the estimation procedures “How to Estimate Frequency-Response Models
in the GUI” on page 3-3 and “How to Estimate Frequency-Response Models
at the Command Line” on page 3-5.
3-5
3
Linear Model Identification
You can choose from the following three spectral-analysis methods:
• etfe (Empirical Transfer Function Estimate)
For input-output data. This method computes the ratio of the Fourier
transform of the output to the Fourier transform of the input.
For time-series data. This method computes a periodogram as the
normalized absolute squares of the Fourier transform of the time series.
ETFE works well for highly resonant systems or narrowband systems.
The drawback of this method is that it requires linearly spaced frequency
values, does not estimate the disturbance spectrum, and does not provide
confidence intervals. ETFE also works well for periodic inputs and
computes exact estimates at multiples of the fundamental frequency of the
input and their ratio.
• spa (SPectral Analysis)
This method is the Blackman-Tukey spectral analysis method, where
windowed versions of the covariance functions are Fourier transformed.
For more information about this algorithm, see “Spectral Analysis
Algorithm” on page 3-8.
• spafdr (SPectral Analysis with Frequency Dependent Resolution)
This method is a variant of the Blackman-Tukey spectral analysis method
with frequency-dependent resolution. First, the algorithm computes
Fourier transforms of the inputs and outputs. Next, the products of the
transformed inputs and outputs with the conjugate input transform are
smoothed over local frequency regions. The widths of the local frequency
regions can vary as a function of frequency. The ratio of these averages
computes the frequency-response estimate.
Options for Frequency Resolution
• “What Is Frequency Resolution?” on page 3-7
• “Frequency Resolution for etfe and spa” on page 3-7
• “Frequency Resolution for spafdr” on page 3-7
• “etfe Frequency Resolution for Periodic Input” on page 3-8
3-6
Identifying Frequency-Response Models
This section supports the estimation procedures “How to Estimate
Frequency-Response Models in the GUI” on page 3-3 and “How to Estimate
Frequency-Response Models at the Command Line” on page 3-5.
What Is Frequency Resolution?
Frequency resolution is the size of the smallest frequency for which details
in the frequency response and the spectrum can be resolved by the estimate.
A resolution of 0.1 rad/s means that the frequency response variations at
frequency intervals at or below 0.1 rad/s are not resolved.
Note Finer resolution results in greater uncertainty in the model estimate.
Specifying the frequency resolution for etfe and spa is different than for
spafdr.
Frequency Resolution for etfe and spa
For etfe and spa, the frequency resolution is approximately equal to the
following value:
⎞
2π ⎛
radians
⎜
⎟
M ⎝ sampling interval ⎠
M is a scalar integer that sets the size of the lag window.
A large value of M gives good resolution, but results in mode uncertain
estimates.
The default value of M for spa is good for systems without sharp resonances.
For etfe, the default value of M gives the maximum resolution.
Frequency Resolution for spafdr
In case of etfe and spa, the frequency response is defined over a uniform
frequency range, 0-Fs/2 radians per second, where Fs is the sampling
frequency—equal to twice the Nyquist frequency. In contrast, spafdr lets
3-7
3
Linear Model Identification
you increase the resolution in a specific frequency range, such as near a
resonance frequency. Conversely, you can make the frequency grid coarser in
the region where the noise dominates—at higher frequencies, for example.
Such customizing of the frequency grid assists in the estimation process by
achieving high fidelity in the frequency range of interest.
For spafdr, the frequency resolution around the frequency k is the value R(k).
You can enter R(k) in any one of the following ways:
• Scalar value of the constant frequency resolution value in radians per
second.
Note The scalar R is inversely related to the M value used for etfe and
spa.
• Vector of frequency values the same size as the frequency vector.
• Expression using MATLAB workspace variables and evaluates to a
resolution vector that is the same size as the frequency vector.
The default value of the resolution for spafdr is twice the difference between
neighboring frequencies in the frequency vector.
etfe Frequency Resolution for Periodic Input
If the input data is marked as periodic and contains an integer number of
periods (data.Period is an integer), etfe computes the frequency response at
2πk
frequencies T
k
( Period
)
where k = 1, 2,..., Period
.
For periodic data, the frequency resolution is ignored.
Spectral Analysis Algorithm
You can estimate the frequency-response function of dynamic systems using
spectral analysis.
To better understand the spectral analysis algorithm, consider the following
description of a linear, dynamic system:
3-8
Identifying Frequency-Response Models
y(t) = G(q)u(t) + v(t)
where u(t) and y(t) are the input and output signals, respectively. G(q) is
called the transfer function of the system—it takes the input to the output
and captures the system dynamics. The G(q)u(t) notation represents the
following operation:
G(q)u(t) =
∞
∑ g(k)u(t − k)
k=1
q is the shift operator, defined by the following equation:
G(q) =
∞
∑ g(k)q−k
q−1u(t) = u(t − 1)
k=1
G(q) that is evaluated on the unit circle, G(q=eiw), is the frequency-response
function.
ˆ (ω) comprise the
Together, G(q=eiw) and the output noise spectrum Φ
v
frequency-domain description of the system.
According to the Blackman-Tukey approach, the estimated frequency-response
function is given by the following equation:
ˆ ( ω)
Φ
yu
Gˆ N eiω =
ˆ
Φu ( ω)
( )
In this case, ^ represents approximate quantities. For a derivation of this
equation, see the chapter on nonparametric time- and frequency-domain
methods in System Identification: Theory for the User, Second Edition, by
Lennart Ljung, Prentice Hall PTR, 1999.
The output noise spectrum is given by the following equation:
3-9
3
Linear Model Identification
ˆ ( ω) = Φ
ˆ ( ω) −
Φ
v
y
ˆ ( ω) 2
Φ
yu
ˆ ( ω)
Φ
u
This equation for the noise spectrum is derived by assuming the linear
relationship y(t) = G(q)u(t) + v(t) , that u(t) is independent of v(t), and the
following relationships between the spectra:
( )
Φ y (ω) = G eiω
2
Φu (ω) + Φ v (ω)
( )
Φ yu (ω) = G eiω Φu (ω)
where the noise spectrum is given by the following equation:
Φ v (ω) ≡
∞
∑
Rv (τ) e−iwτ
τ=−∞
ˆ (ω)
ˆ (ω) is the output-input cross-spectrum and Φ
u
Φ
is the input spectrum.
yu
The algorithms for estimating the frequency response (such as spa) perform
the following steps:
1 Compute the covariances and cross-covariance from u(t) and y(t), as follows:
ˆ ( τ) =
R
y
1
N
ˆ ( τ) =
R
u
1
N
ˆ ( τ) =
R
yu
3-10
N
∑ y (t + τ) y (t )
t =1
N
∑ u (t + τ) u (t )
t =1
N
1
y (t + τ) u (t )
N
t =1
∑
Identifying Frequency-Response Models
2 Compute the Fourier transforms of the covariances and the
cross-covariance, as follows:
M
ˆ (ω) =
Φ
y
ˆ (ω) =
Φ
u
∑
ˆ (τ)W (τ) e−iωτ
R
M
y
∑
ˆ (τ)W (τ) e−iωτ
R
u
M
τ=− M
M
τ=− M
M
ˆ (ω) =
Φ
yu
∑
ˆ (τ)W (τ) e−iωτ
R
M
yu
τ=− M
where WM (τ) is called the lag window with the width M.
( ) and the output noise
iω
ˆ
3 Compute the frequency-response function G
N e
ˆ (ω)
spectrum Φ
v
Alternatively, the disturbance v(t) can be described as filtered white noise:
v(t) = H (q) e(t)
where e(t) is the white noise with variance λ and the noise power spectrum
is given by the following equation:
( )
Φ v (ω) = λ H eiω
2
Understanding Spectrum Normalization
The spectrum of a signal is the square of the Fourier transform of the
signal. The spectral estimate using the commands spa, spafdr, and etfe is
normalized by the sampling interval T:
Φ y (ω) = T
M
∑
Ry (kT ) e−iwT WM (k)
k=− M
3-11
3
Linear Model Identification
where WM(k) is the lag window, and M is the width of the lag window. The
output covariance Ry(kT) is given by the following discrete representation:
ˆ (kT ) = 1
R
y
N
N
∑ y(lT − kT ) y(lT )
l =1
Because there is no scaling in a discrete Fourier transform of a vector, the
purpose of T is to relate the discrete transform of a vector to the physically
meaningful transform of the measured signal. This normalization sets the
units of Φ y (ω) as power per radians per unit time, and makes the frequency
units radians per unit time.
The scaling factor of T is necessary to preserve the energy density of the
spectrum after interpolation or decimation.
By Parseval’s theorem, the average energy of the signal must equal the
average energy in the estimated spectrum, as follows:
Ey2 (t) =
1 π/T
Φ y (ω) dω
2π ∫− π / T
S1 ≡ Ey2 (t)
1 π/T
S2 ≡
Φ y (ω) dω
2π ∫− π / T
To compare the left side of the equation (S1) to the right side (S2), enter the
following commands in the MATLAB Command Window:
load iddata1
% Create time-series iddata object
y = z1(:,1,[]);
% Define sample interval from the data
T = y.Ts;
% Estimate frequency response
sp = spa(y);
% Remove spurious dimensions
phiy = squeeze(sp.spec);
% Compute average energy from the estimated
3-12
Identifying Frequency-Response Models
% energy spectrum, where S1 is scaled by T
S1 = sum(phiy)/length(phiy)/T
% Compute average energy of the signal
S2 = sum(y.y.^2)/size(y,1)
In this code, phiy contains Φ y (ω) between ω = 0 and ω = π T with the
frequency step given as follows:
⎛
⎞
π
⎜
⎟
⎝ T ⋅ length(phiy) ⎠
MATLAB computes the following values for S1 and S2:
S1 =
19.2076
S2 =
19.4646
Thus, the average energy of the signal approximately equals the average
energy in the estimated spectrum.
3-13
3
Linear Model Identification
Identifying Impulse-Response Models
In this section...
“What Is Time-Domain Correlation Analysis?” on page 3-14
“Data Supported by Correlation Analysis” on page 3-15
“How to Estimate Correlation Models Using the GUI” on page 3-15
“How to Estimate Correlation Models at the Command Line” on page 3-16
“How to Compute Response Values” on page 3-18
“How to Identify Delay Using Transient-Response Plots” on page 3-18
“Algorithm for Correlation Analysis” on page 3-20
What Is Time-Domain Correlation Analysis?
Time-domain correlation analysis is a nonparametric estimate of transient
response of dynamic systems, which computes a finite impulse response (FIR)
model from the data. Correlation analysis assumes a linear system and does
not require a specific model structure.
There are two types of transient response for a dynamic model:
• Impulse response
Impulse response is the output signal that results when the input is an
impulse and has the following definition for a discrete model:
u(t) = 0
t>0
u(t) = 1
t=0
• Step response
Step response is the output signal that results from a step input, defined as
follows:
u(t) = 0
u(t) = 1
3-14
t<0
t≥0
Identifying Impulse-Response Models
The response to an input u(t) is equal to the convolution of the impulse
response, as follows:
y(t) =
t
∫0 h ( t − z) ⋅ u( z)dz
Data Supported by Correlation Analysis
You can estimate correlation analysis models from data with the following
characteristics:
• Real or complex time-domain iddata object. To learn about estimating
time-series models, see Chapter 6, “Time Series Model Identification”.
• Frequency-domain iddata or idfrd object with the sampling interval T≠0.
• Single- or multiple-output data.
How to Estimate Correlation Models Using the GUI
The following procedure assumes that you already imported your data into
the GUI and performed any necessary preprocessing operations. For more
information, see Chapter 1, “Data Processing”.
To estimate impulse- and step-response models in the System Identification
Tool GUI using time-domain correlation analysis:
1 In the System Identification Tool GUI, select Estimate > Correlation
models to open the Correlation Model dialog box.
2 In the Time span (s) field, specify a scalar value as the time interval over
which the impulse or step response is calculated. For a scalar time span T,
the resulting response is plotted from -T/4 to T.
Tip You can also enter a 2-D vector in the format [min_value max_value].
3 In the Order of whitening filter field, specify the filter order.
3-15
3
Linear Model Identification
The prewhitening filter is determined by modeling the input as an
Auto-Regressive (AR) process of order N. The algorithm applies a filter of
the form A(q)u(t)=u_F(t). That is, the input u(t) is subjected to an FIR
filter A to produce the filtered signal u_F(t). Prewhitening the input by
applying a whitening filter before estimation might improve the quality of
the estimated impulse response g.
The order of the prewhitening filter, N, is the order of the A filter. N equals
the number of lags. The default value of N is 10, which you can also specify
as [].
4 In the Model Name field, enter the name of the correlation analysis model.
The name of the model should be unique in the Model Board.
5 Click Estimate to add this model to the Model Board in the System
Identification Tool GUI.
6 In the Correlation Model dialog box, click Close.
7 To view the transient response plot, select the Transient resp check box
in the System Identification Tool GUI. For more information about working
with this plot and selecting to view impulse- versus step-response, see
“Using Impulse- and Step-Response Plots to Validate Models” on page 8-24.
You can export the model to the MATLAB workspace for further analysis
by dragging it to the To Workspace rectangle in the System Identification
Tool GUI.
How to Estimate Correlation Models at the Command
Line
You can use impulse and step commands to estimate the impulse and step
response directly from time- or frequency-domain data using correlation
analysis. Both impulse and step produce the same FIR model, but generate
different plots.
Note cra is an alternative method for computing impulse response from
time-domain data only.
3-16
Identifying Impulse-Response Models
The following tables summarize the commands for computing impulse- and
step-response models. The resulting models are stored as idarx model objects
and contain impulse-response coefficients in the model parameter B. For
detailed information about these commands, see the corresponding reference
page.
Commands for Impulse and Step Response
Command
Description
Example
impulse
Estimates a high-order,
noncausal FIR model
using correlation analysis.
To estimate the model m and plot the impulse
response, use the following syntax:
m=impulse(data,Time,'pw',N)
where data is a single- or multiple-output
time-domain iddata object, and Time is a
scalar value representing the time interval
over which the impulse or step response is
calculated. For a scalar time span T, the
resulting response is plotted from -T/4 to T.
'pw' and N is an option property-value pair
that specifies the order N of the prewhitening
filter 'pw'.
step
Estimates a high-order,
noncausal FIR model
correlation analysis.
To estimate the model m and plot the step
response, use the following syntax:
step(data,Time)
where data is a single- or multiple-output
time-domain iddata object, and Time is the
time span.
To validate the model, see Chapter 8, “Model Analysis”. For more information
about continuing to work with models in the MATLAB workspace, see
Chapter 11, “Using System Identification Toolbox Blocks”.
3-17
3
Linear Model Identification
How to Compute Response Values
You can use impulse and step commands with output arguments to get
the numerical impulse- and step-response vectors as a function of time,
respectively.
To get the numerical response values:
1 Compute the FIR model by applying either impulse or step commands
on the data, as described in “How to Estimate Correlation Models at the
Command Line” on page 3-16.
2 Apply the following syntax on the resulting model:
% To compute impulse-response data
[y,t,ysd] = impulse(model)
% To compute step-response data
[y,t,ysd] = step(model)
where y is the response data, t is the time vector, and ysd is the standard
deviations of the response.
How to Identify Delay Using Transient-Response Plots
You can use transient-response plots to estimate the input delay, or dead
time, of linear systems. Input delay represents the time it takes for the output
to respond to the input.
In the System Identification Tool GUI. To view the transient response
plot, select the Transient resp check box in the System Identification Tool
GUI. For example, the following step response plot shows a time delay of
about 0.25 s before the system responds to the input.
3-18
Identifying Impulse-Response Models
Step Response Plot
At the command line. You can use the impulse command to plot the
impulse response. The time delay is equal to the first positive peak in the
transient response magnitude that is greater than the confidence region for
positive time values.
For example, the following commands create an impulse-response plot with a
1-standard-deviation confidence region:
% Load sample data
load dry2
% Split data into estimation and
% validation data sets
ze = dry2(1:500);
zr = dry2(501:1000);
impulse(ze,'sd',1,'fill')
The resulting figure shows that the first positive peak of the response
magnitude, which is greater than the confidence region for positive time
values, occurs at 0.24 s.
3-19
3
Linear Model Identification
Algorithm for Correlation Analysis
To better understand the algorithm underlying correlation analysis, consider
the following description of a dynamic system:
y(t) = G(q)u(t) + v(t)
where u(t) and y(t) are the input and output signals, respectively. v(t) is the
additive noise term. G(q) is the transfer function of the system. The G(q)u(t)
notation represents the following operation:
G(q)u(t) =
∞
∑ g(k)u(t − k)
k=1
3-20
Identifying Impulse-Response Models
q is the shift operator, defined by the following equation:
G(q) =
∞
∑ g(k)q−k
q−1u(t) = u(t − 1)
k=1
For impulse response, the algorithm estimates impulse response coefficients
g for both the single- and multiple-output data. The impulse response is
estimated as a high-order, noncausal FIR model:
y(t) = g(−m)u(t + m) + … + g(−1)u(t + 1) + g(0)u(t)
+ g(1)u(t − 1) + … + g(n)u(t − n)
The estimation algorithm prefilters the data such that the input is as white
as possible. It then computes the correlations from the prefiltered data to
obtain the FIR coefficients.
g is also estimated for negative lags, which takes into account any noncausal
effects from input to output. Noncausal effects can result from feedback. The
coefficients are computed using the least-squares method.
For a multiple-input or multiple-output system, the impulse response gk is an
ny-by-nu matrix, where ny is the number of outputs and nu is the number
of inputs. The i-jth element of the impulse response matrix describes the
behavior of the ith output after an impulse in the jth input.
3-21
3
Linear Model Identification
Identifying Low-Order Transfer Functions (Process Models)
In this section...
“What Is a Process Model?” on page 3-22
“Data Supported by a Process Model” on page 3-23
“How to Estimate Process Models Using the GUI” on page 3-23
“Estimating Process Models at the Command Line” on page 3-29
“Options for Specifying the Process-Model Structure” on page 3-35
“Options for Multiple-Input Models” on page 3-36
“Options for the Disturbance Model Structure” on page 3-37
“Options for Frequency-Weighing Focus” on page 3-38
“Options for Initial States” on page 3-39
What Is a Process Model?
The structure of a continuous-time process model is a simple transfer function
that describes linear system dynamics in terms of one or more of the following
elements:
• Static gain Kp.
• One or more time constants Tpk. For complex poles, the time constant is
called Tω —equal to the inverse of the natural frequency—and the damping
coefficient is ζ (zeta).
• Process zero Tz.
• Possible time delay Td before the system output responds to the input
(dead time).
• Possible enforced integration.
Process models are popular for describing system dynamics in many
industries and apply to various production environments. The primary
advantages of these models are that they provide delay estimation, and the
model coefficients have a physical interpretation.
3-22
Identifying Low-Order Transfer Functions (Process Models)
You can create different model structures by varying the number of poles,
adding an integrator, or adding or removing a time delay or a zero. You can
specify a first-, second-, or third-order model, and the poles can be real or
complex (underdamped modes).
Note Continuous-time process models let you estimate the input delay.
For example, the following model structure is a first-order continuous-time
process model, where K is the static gain, Tp1 is a time constant, and Td is the
input-to-output delay:
G(s) =
K
e− sTd
1 + sTp1
To learn more about estimating continuous-time process models in the GUI,
see “Tutorial – Identifying Low-Order Transfer Functions (Process Models)
Using the GUI” in System Identification Toolbox Getting Started Guide.
Data Supported by a Process Model
You can estimate low-order (up to third order), continuous-time transfer
functions from data with the following characteristics:
• Time- or frequency-domain iddata or idfrd data object
• Real data, or complex data in the time domain only
• Single-output data
You must import your data into the MATLAB workspace, as described in
Chapter 1, “Data Processing”.
How to Estimate Process Models Using the GUI
The following procedure assumes that you have already imported your data
into the GUI and performed any necessary preprocessing operations. For
more information, see Chapter 1, “Data Processing”.
3-23
3
Linear Model Identification
To estimate a low-order transfer function (process model) using the System
Identification Tool GUI:
1 In the System Identification Tool GUI, select Estimate > Process models
to open the Process Models dialog box.
2 If your model contains multiple inputs, select the input channel in the
Input list. This list only appears when you have multiple inputs. For more
information, see “Options for Multiple-Input Models” on page 3-36.
3 In the Model Transfer Function area, specify the model structure using
the following options:
3-24
Identifying Low-Order Transfer Functions (Process Models)
• Under Poles, select the number of poles, and then select All real or
Underdamped.
Note You need at least two poles to allow underdamped modes
(complex-conjugate pair).
• Select the Zero check box to include a zero, which is a numerator term
other than a constant, or clear the check box to exclude the zero.
• Select the Delay check box to include a delay, or clear the check box
to exclude the delay.
• Select the Integrator check box to include an integrator (self-regulating
process), or clear the check box to exclude the integrator.
The Parameter area shows as many active parameters as you included in
the model structure.
Note By default, the model Name is set to the acronym that reflects the
model structure, as described in “Options for Specifying the Process-Model
Structure” on page 3-35.
4 In the Initial Guess area, select Auto-selected to calculate the initial
parameter values for the estimation. The Initial Guess column in the
3-25
3
Linear Model Identification
Parameter table displays Auto. If you do not have a good guess for the
parameter values, Auto works better than entering an ad hoc value.
5 (Optional) If you approximately know a parameter value, enter this value
in the Initial Guess column of the Parameter table. The estimation
algorithm uses this value as a starting point. If you know a parameter
value exactly, enter this value in the Initial Guess column, and also select
the corresponding Known check box in the table to fix its value.
If you know the range of possible values for a parameter, enter these values
into the corresponding Bounds field to help the estimation algorithm.
For example, the following figure shows that the delay value Td is fixed
at 2 s and is not estimated.
3-26
Identifying Low-Order Transfer Functions (Process Models)
6 In the Disturbance Model list, select one of the available options. For
more information about each option, see “Options for the Disturbance
Model Structure” on page 3-37.
7 In the Focus list, select how to weigh the relative importance of the fit at
different frequencies. For more information about each option, see “Options
for Frequency-Weighing Focus” on page 3-38.
8 In the Initial state list, specify how you want the algorithm to treat initial
states. For more information about the available options, see “Options for
Initial States” on page 3-39.
Tip If you get a bad fit, you might try setting a specific method for handling
initial states, rather than choosing it automatically.
9 In the Covariance list, select Estimate if you want the algorithm to
compute parameter uncertainties. Effects of such uncertainties are
displayed on plots as model confidence regions.
3-27
3
Linear Model Identification
To omit estimating uncertainty, select None. Skipping uncertainty
computation might reduce computation time for complex models and large
data sets.
10 In the Model Name field, edit the name of the model or keep the default.
The name of the model should be unique in the Model Board.
11 To view the estimation progress in the MATLAB Command Window, select
the Trace check box. During estimation, the following information is
displayed for each iteration:
• Loss function — Equals the determinant of the estimated covariance
matrix of the input noise.
• Parameter values — Values of the model structure coefficients you
specified.
• Search direction — Change in parameter values from the previous
iteration.
• Fit improvements — Shows the actual versus expected improvements in
the fit.
12 Click Estimate to add this model to the Model Board in the System
Identification Tool GUI.
13 To stop the search and save the results after the current iteration has been
completed, click Stop Iterations. To continue iterations from the current
model, click the Continue iter button to assign current parameter values
as initial guesses for the next search.
14 To plot the model, select the appropriate check box in the Model Views
area of the System Identification Tool GUI. For more information about
validating models, see “Overview of Model Validation and Plots” on page
8-2.
15 To refine the current estimate, click the Value —> Initial Guess button
to assign current parameter values as initial guesses for the next search,
edit the Model Name field, and click Estimate.
If your model is not sufficiently accurate, try another model structure.
3-28
Identifying Low-Order Transfer Functions (Process Models)
You can export the model to the MATLAB workspace for further analysis
by dragging it to the To Workspace rectangle in the System Identification
Tool GUI.
Estimating Process Models at the Command Line
• “Using pem to Estimate Process Models” on page 3-29
• “Example – Estimating Process Models with Free Parameters at the
Command Line” on page 3-30
• “Example – Estimating Process Models with Fixed Parameters at the
Command Line” on page 3-32
Using pem to Estimate Process Models
You can estimate process models using the iterative estimation method pem
that minimizes the prediction errors to obtain maximum likelihood estimates.
The resulting models are stored as idproc model objects.
You can use the following general syntax to both configure and estimate
process models:
m = pem(data,mod_struc,'Property1',Value1,...,
'PropertyN',ValueN)
data is the estimation data and mod_struc is a string that represents
the process model structure, as described in “Options for Specifying the
Process-Model Structure” on page 3-35.
Tip You do not need to construct the model object using idproc before
estimation unless you want to specify initial parameter guesses or fixed
parameter values, as described in “Example – Estimating Process Models
with Fixed Parameters at the Command Line” on page 3-32.
The property-value pairs specify any model properties that configure the
estimation algorithm and the initial conditions. For more information about
accessing and setting model properties, see “Model Properties” on page 2-14.
3-29
3
Linear Model Identification
Note You can specify all property-value pairs in pem as a simple,
comma-separated list without worrying about the hierarchy of these
properties in the idproc model object.
For more information about validating a process model, see “Overview of
Model Validation and Plots” on page 8-2.
You can use pem to refine parameter estimates of an existing process model,
as described in “Refining Linear Parametric Models” on page 3-103.
For detailed information about pem and idproc, see the corresponding
reference page.
Example – Estimating Process Models with Free Parameters
at the Command Line
This example demonstrates how to estimate the parameters of a first-order
process model:
G(s) =
K
e− sTd
1 + sTp1
This process has two inputs and the response from each input is estimated by
a first-order process model. All parameters are free to vary.
3-30
Identifying Low-Order Transfer Functions (Process Models)
Use the following commands to estimate a model m from sample data:
% Load sample data
load co2data
% Sampling interval is 0.5 min (known)
Ts = 0.5;
% Split data set into estimation data ze
% and validation data zv
ze = iddata(Output_exp1,Input_exp1,Ts,...
'TimeUnit','min');
zv = iddata(Output_exp2,Input_exp2,Ts,...
'TimeUnit','min');
% Estimate model with one pole and a delay
m = pem(ze,'P1D')
MATLAB computes the following output:
Process model with 2 inputs:
y = G_1(s)u_1 + G_2(s)u_2
where
K
G_1(s) = ---------- * exp(-Td*s)
1+Tp1*s
with
K = -3.2168
Tp1 = 23.033
Td = 10.101
K
G_2(s) = ---------- * exp(-Td*s)
1+Tp1*s
with
K = 9.9877
Tp1 = 2.0314
Td = 4.8368
Use dot notation to get the value of any model parameter. For example, to get
the Value field in the K structure, type the following command:
m.K.value
3-31
3
Linear Model Identification
Example – Estimating Process Models with Fixed Parameters
at the Command Line
When you know the values of certain parameters in the model and want
to estimate only the values you do not know, you must specify the fixed
parameters after creating the idproc model object.
Use the following commands to prepare the data and construct a process
model with one pole and a delay:
% Load sample data
load co2data
% Sampling interval is 0.5 min (known)
Ts = 0.5;
% Split data set into estimation data ze
% and validation data zv
ze = iddata(Output_exp1,Input_exp1,Ts,...
'TimeUnit','min');
zv = iddata(Output_exp2,Input_exp2,Ts,...
'TimeUnit','min');
mod=idproc('P1D')
MATLAB computes the following output:
Process model with transfer function
K
G(s) = ---------- * exp(-Td*s)
1+Tp1*s
with
K = NaN
Tp1 = NaN
Td = NaN
This model was not estimated from data.
The model parameters K, Tp1, and Td are assigned NaN values, which means
that the parameters have not yet been estimated from the data.
All process-model parameters are structures with the following fields:
3-32
Identifying Low-Order Transfer Functions (Process Models)
• status field specifies whether to estimate the parameter, or keep the initial
value fixed (do not estimate), or set the value to zero. This field can have
the values 'estimate', 'fixed', or 'zero'. For more information, see
“Options for Initial States” on page 3-39.
• min specifies the minimum bound on the parameter.
• max specifies the maximum bound on the parameter.
• value specifies the numerical value of the parameter, if known.
To set the value of K to 12 and keep it fixed, use the following commands:
mod.K.value=12;
mod.K.status='fixed';
Note mod is defined for one input. This model is automatically adjusted
to have a duplicate for each input.
To estimate Tp1 and Td only, use the following command:
mod_proc=pem(ze,mod)
3-33
3
Linear Model Identification
MATLAB computes the following result:
Process model with 2 inputs:
y = G_1(s)u_1 + G_2(s)u_2
where
K
G_1(s) = ---------- * exp(-Td*s)
1+Tp1*s
with
K = 12
Tp1 = 7.0998e+007
Td = 15
K
G_2(s) = ---------- * exp(-Td*s)
1+Tp1*s
with
K = 12
Tp1 = 3.6962
Td = 3.817
In this case, the value of K is fixed at 12, but Tp1 and Td are estimated.
3-34
Identifying Low-Order Transfer Functions (Process Models)
If you prefer to specify parameter constraints directly in the estimator syntax,
the following table provides examples of pem commands.
Action
Example
Fix the value of K to 12.
m=pem(ze,'p1d','k','fix','k',12)
Initialize K for the iterative search
without fixing this value.
Constrain the value of K between
3 and 4.
m=pem(ze,'p1d','k',12)
m=pem(ze,'p1d','k',...
{'min',3},'k',{'max',4})
Options for Specifying the Process-Model Structure
This section describes how to specify the model structure in the estimation
procedures “How to Estimate Process Models Using the GUI” on page 3-23
and “Estimating Process Models at the Command Line” on page 3-29.
In the System Identification Tool GUI. Specify the model structure by
selecting the number of real or complex poles, and whether to include a zero,
delay, and integrator. The resulting transfer function is displayed in the
Process Models dialog box.
At the command line. Specify the model structure using an acronym that
includes the following letters and numbers:
• (Required) P for a process model
• (Required) 0, 1, 2 or 3 for the number of poles
• (Optional) D to include a time-delay term e− sTd
• (Optional) Z to include a process zero (numerator term)
• (Optional) U to indicate possible complex-valued (underdamped) poles
• (Optional) I to indicate enforced integration
3-35
3
Linear Model Identification
Typically, you specify the model-structure acronym as a string argument in
the estimation command pem:
• pem(data,'P1D') to estimate the following structure:
G(s) =
K
e− sTd
1 + sTp1
• pem(data,'P2ZU') to estimate the following structure:
G(s) =
K p (1 + sTz )
1 + 2sζTw + s2 Tw2
• pem(data,'P0ID') to estimate the following structure:
G(s) =
Kp
s
e− sTd
• pem(data,'P3Z') to estimate the following structure:
G(s) =
K p (1 + sTz )
(1 + sTp1 ) (1 + sTp2 ) (1 + sTp3 )
For more information about estimating models , see “Estimating Process
Models at the Command Line” on page 3-29.
Options for Multiple-Input Models
If your model contains multiple inputs, you can specify whether to estimate
the same transfer function for all inputs, or a different transfer function
for each input. The information in this section supports the estimation
procedures “How to Estimate Process Models Using the GUI” on page 3-23
and “Estimating Process Models at the Command Line” on page 3-29.
In the System Identification Tool GUI. To fit a data set with multiple
inputs in the Process Models dialog box, configure the process model settings
for one input at a time. When you finish configuring the model and the
3-36
Identifying Low-Order Transfer Functions (Process Models)
estimation settings for one input, select a different input in the Input
Number list.
If you want the same transfer function to apply to all inputs, select the Same
structure for all channels check box. To apply a different structure to each
channel, leave this check box clear, and create a different transfer function for
each input.
At the command line. Specify the model structure as a cell array of acronym
strings in the estimation command pem. For example, use this command to
specify the first-order transfer function for the first input, and a second-order
model with a zero and an integrator for the second input:
m = idproc({'P1','P2ZI'})
m = pem(data,m)
To apply the same structure to all inputs, define a single structure in idproc.
Options for the Disturbance Model Structure
This section describes how to specify a noise model in the estimation
procedures “How to Estimate Process Models Using the GUI” on page 3-23
and “Estimating Process Models at the Command Line” on page 3-29.
In addition to the transfer function G, a linear system can include an additive
noise term He, as follows:
y = Gu + He
where e is white noise.
You can estimate only the dynamic model G, or estimate both the dynamic
model and the disturbance model H. For process models, H is a rational
transfer function C/D, where the C and D polynomials for a first- or
second-order ARMA model.
In the GUI. To specify whether to include or exclude a noise model in the
Process Models dialog box, select one of the following options from the
Disturbance Model list:
3-37
3
Linear Model Identification
• None — The algorithm does not estimate a noise model (C=D=1). This
option also sets Focus to Simulation.
• Order 1 — Estimates a noise model as a continuous-time, first-order
ARMA model.
• Order 2 — Estimates a noise model as a continuous-time, second-order
ARMA model.
At the command line. Specify the disturbance model as an argument in
the estimation command pem. For example, use this command to estimate a
first-order transfer function and a first-order noise model:
pem(data,'P1D','DisturbanceModel','ARMA1')
Tip You can type 'dis' instead of 'DisturbanceModel'.
For a complete list of values for the DisturbanceModel model property, see
the idproc reference page.
Options for Frequency-Weighing Focus
You can specify how the estimation algorithm weighs the fit at various
frequencies. This information supports the estimation procedures “How to
Estimate Process Models Using the GUI” on page 3-23 and “Estimating
Process Models at the Command Line” on page 3-29.
In the System Identification Tool GUI. Set Focus to one of the following
options:
• Prediction — Uses the inverse of the noise model H to weigh the relative
importance of how closely to fit the data in various frequency ranges.
Corresponds to minimizing one-step-ahead prediction, which typically
favors the fit over a short time interval. Optimized for output prediction
applications.
• Simulation — Uses the input spectrum to weigh the relative importance of
the fit in a specific frequency range. Does not use the noise model to weigh
the relative importance of how closely to fit the data in various frequency
ranges. Optimized for output simulation applications.
3-38
Identifying Low-Order Transfer Functions (Process Models)
• Stability — Behaves the same way as the Prediction option, but also
forces the model to be stable. For more information about model stability,
see “Unstable Models” on page 8-69.
• Filter — Specify a custom filter to open the Estimation Focus dialog box,
where you can enter a filter, as described in “Simple Passband Filter” on
page 1-111 or “Defining a Custom Filter” on page 1-112. This prefiltering
applies only for estimating the dynamics from input to output. The
disturbance model is determined from the estimation data.
At the command line. Specify the focus as an argument in the estimation
command pem using the same options as in the GUI. For example, use this
command to optimize the fit for simulation and estimate a disturbance model:
pem(data,'P1D','dist','arma2','Focus','Simulation')
Options for Initial States
Because the process models are dynamic, you need initial states that
capture past input properties. Thus, you must specify how the iterative
algorithm treats initial states. This information supports the estimation
procedures “How to Estimate Process Models Using the GUI” on page 3-23
and “Estimating Process Models at the Command Line” on page 3-29.
In the System Identification Tool GUI. Set Initial state to one of the
following options:
• Zero — Sets all initial states to zero.
• Estimate — Treats the initial states as an unknown vector of parameters
and estimates these states from the data.
• Backcast — Estimates initial states using a backward filtering method
(least-squares fit).
• U-level est — Estimates both the initial states and the InputLevel
model property that represents the input offset level. For multiple inputs,
the input level for each input is estimated individually. Use if you included
an integrator in the transfer function.
• Auto — Automatically chooses one of the preceding options based on the
estimation data. If initial states have negligible effect on the prediction
errors, the initial states are set to zero to optimize algorithm performance.
3-39
3
Linear Model Identification
At the command line. Specify the initial states as an argument in the
estimation command pem using the same options as in the GUI. For example,
use this command to estimate a first-order transfer function and set the
initial states to zero:
m=pem(data,'P1D','InitialState','zero')
For a complete list of values for the InitialState model property, see the
idproc reference page.
3-40
Identifying Input-Output Polynomial Models
Identifying Input-Output Polynomial Models
In this section...
“What Are Black-Box Polynomial Models?” on page 3-41
“Data Supported by Polynomial Models” on page 3-48
“Preliminary Step – Estimating Model Orders and Input Delays” on page
3-49
“How to Estimate Polynomial Models in the GUI” on page 3-57
“How to Estimate Polynomial Models at the Command Line” on page 3-60
“Options for Multiple-Input and Multiple-Output ARX Orders” on page 3-64
“Option for Frequency-Weighing Focus” on page 3-65
“Options for Initial States” on page 3-66
“Algorithms for Estimating Polynomial Models” on page 3-66
“Example – Estimating Models Using armax” on page 3-67
What Are Black-Box Polynomial Models?
• “Polynomial Model Structure” on page 3-42
• “Understanding the Time-Shift Operator q” on page 3-43
• “Definition of a Discrete-Time Polynomial Model” on page 3-43
• “Definition of a Continuous-Time Polynomial Model” on page 3-46
• “Definition of Multiple-Output ARX Models” on page 3-46
3-41
3
Linear Model Identification
Polynomial Model Structure
You can estimate the following types of linear polynomial model structures:
nu
Bi (q)
C(q)
ui ( t − nki ) +
e(t)
F
(
q
)
D(q)
i=1 i
A(q) y(t) = ∑
The polynomials A, Bi, C, D, and F i contain the time-shift operator q. ui is the
ith input, nu is the total number of inputs, and nki is the ith input delay that
characterizes the delay response time. The variance of the white noise e(t)
is assumed to be λ . For more information about the time-shift operator, see
“Understanding the Time-Shift Operator q” on page 3-43.
Note This form is completely equivalent to the Z-transform form: q
corresponds to z.
To estimate polynomial models, you must specify the model order as a set of
integers that represent the number of coefficients for each polynomial you
include in your selected structure—na for A, nb for B, nc for C, nd for D,
and nf for F. You must also specify the number of samples nk corresponding
to the input delay—dead time—given by the number of samples before the
output responds to the input.
The number of coefficients in denominator polynomials is equal to the number
of poles, and the number of coefficients in the numerator polynomials is equal
to the number of zeros plus 1. When the dynamics from u(t) to y(t) contain a
delay of nk samples, then the first nk coefficients of B are zero.
For more information about the family of transfer-function models, see the
corresponding section in System Identification: Theory for the User, Second
Edition, by Lennart Ljung, Prentice Hall PTR, 1999.
3-42
Identifying Input-Output Polynomial Models
Understanding the Time-Shift Operator q
The general polynomial equation is written in terms of the time-shift operator
q. To understand this time-shift operator, consider the following discrete-time
difference equation:
y(t) + a1 y(t − T ) + a2 y(t − 2T ) =
b1u(t − T ) + b2u(t − 2T )
where y(t) is the output, u(t) is the input, and T is the sampling interval. q-1
is a time-shift operator that compactly represents such difference equations
using qu(t) = u(t − T ) :
y(t) + a1 q−1 y(t) + a2 q−2 y(t) =
b1 q−1u(t) + b2 q−2u(t)
or
A(q) y(t) = B(q)u(t)
In this case, A(q) = 1 + a1 q−1 + a2 q−2 and B(q) = b1 q−1 + b2 q−2 .
Note This q description is completely equivalent to the Z-transform form: q
corresponds to z.
Definition of a Discrete-Time Polynomial Model
These model structures are subsets of the following general polynomial
equation:
nu
Bi (q)
C(q)
ui ( t − nki ) +
e(t)
F (q)
D(q)
i=1 i
A(q) y(t) = ∑
The model structures differ by how many of these polynomials are included
in the structure. Thus, different model structures provide varying levels of
flexibility for modeling the dynamics and noise characteristics. For more
3-43
3
Linear Model Identification
information about the time-shift operator, see “Understanding the Time-Shift
Operator q” on page 3-43.
The following table summarizes common linear polynomial model structures
supported by the System Identification Toolbox product. If you have a specific
structure in mind for your application, you can decide whether the dynamics
and the noise have common or different poles. A(q) corresponds to poles that
are common for the dynamic model and the noise model. Using common poles
for dynamics and noise is useful when the disturbances enter the system at
the input. F i determines the poles unique to the system dynamics, and D
determines the poles unique to the disturbances.
Model
Structure
Discrete-Time Form
ARX
nu
A(q) y(t) = ∑ Bi (q)ui ( t − nki ) + e(t)
i=1
ARMAX
nu
A(q) y(t) = ∑ Bi (q)ui ( t − nki ) + C(q) e(t)
i=1
3-44
Noise Model
1 and the
The noise model is A
noise is coupled to the dynamics
model. ARX does not let you
model noise and dynamics
independently. Estimate an
ARX model to obtain a simple
model at good signal-to-noise
ratios.
Extends the ARX structure by
providing more flexibility for
modeling noise using the C
parameters (a moving average of
white noise). Use ARMAX when
the dominating disturbances
enter at the input. Such
disturbances are called load
disturbances.
Identifying Input-Output Polynomial Models
Model
Structure
Box-Jenkins
(BJ)
Output-Error
(OE)
Discrete-Time Form
nu
Bi (q)
C(q)
ui ( t − nki ) +
e(t)
F (q)
D(q)
i=1 i
y(t) = ∑
nu
Bi (q)
ui ( t − nki ) + e(t)
F (q)
i=1 i
y(t) = ∑
Noise Model
Provides completely independent
parameterization for the
dynamics and the noise using
rational polynomial functions.
Use BJ models when the noise
does not enter at the input,
but is primary a measurement
disturbance, This structure
provides additional flexibility for
modeling noise.
Use when you want to
parameterize dynamics, but
do not want to estimate a noise
model.
Note In this case, the noise
models is H = 1 in the general
equation and the white noise
source e(t) affects only the
output.
The System Identification Tool GUI supports only the polynomial models
listed in the table. However, you can use pem to estimate all five polynomial
or any subset of polynomials in the general equation. For more information
about working with pem, see “Using pem to Estimate Polynomial Models”
on page 3-61.
3-45
3
Linear Model Identification
Definition of a Continuous-Time Polynomial Model
In continuous time, the general frequency-domain equation is written in terms
of the Laplace transform variable s, which corresponds to a differentiation
operation:
A(s)Y (s) =
B(s)
C(s)
U (s) +
E(s)
F (s)
D(s)
In the continuous-time case, the underlying time-domain model is a
differential equation and the model order integers represent the number of
estimated numerator and denominator coefficients. For example, na=3 and
nb=2 correspond to the following model:
A(s) = s4 + a1 s3 + a2 s2 + a3
B(s) = b1 s + b2
The simplest way to estimate continuous-time polynomial models of
arbitrary structure is to first estimate a discrete-time model of arbitrary
order and then use d2c to convert this model to continuous time. For more
information, see “Transforming Between Discrete-Time and Continuous-Time
Representations” on page 3-112.
You can also estimate continuous-time polynomial models directly using
continuous-time frequency-domain data. In this case, you must set the Ts data
property to 0 to indicate that you have continuous-time frequency-domain
data.
Definition of Multiple-Output ARX Models
You can use a multiple-output ARX model to model a multiple-output dynamic
system. The ARX model structure is given by the following equation:
A(q) y(t) = B(q)u ( t − nk ) + e(t)
3-46
Identifying Input-Output Polynomial Models
For a system with nu inputs and ny outputs, A(q) is an ny-by-ny matrix. A(q)
can be represented as a polynomial in the shift operator q-1:
A(q) = Iny + A1 q−1 + … + Ana q− na
For more information about the time-shift operator, see “Understanding the
Time-Shift Operator q” on page 3-43.
A(q) can also be represented as a matrix:
⎛ a11 (q) a12 (q)
⎜
a21 (q) a22 (q)
A(q) = ⎜
⎜ …
…
⎜⎜
a
(
q
)
a
ny2 ( q)
⎝ ny1
…
…
a1ny (q) ⎞
⎟
a2ny (q) ⎟
…
… ⎟
⎟
… anyny( q) ⎟⎠
where the matrix element akj is a polynomial in the shift operator q-1:
akj (q) = δkj + a1kj q−1 + … + akj kj q
na
− nakj
δkj represents the Kronecker delta, which equals 1 for k=j and equals 0
for k≠j. This polynomial describes how the old values of the jth output are
affected by the kth output. The ith row of A(q) represents the contribution of
the past output values for predict the current value of the ith output.
B(q) is an ny-by-ny matrix. B(q) can be represented as a polynomial in the
shift operator q-1:
B(q) = B0 + B1 q−1 + … + Bnb q− nb
3-47
3
Linear Model Identification
B(q) can also be represented as a matrix:
⎛ b11 (q) b12 (q)
⎜
b21 (q) b22 (q)
B(q) = ⎜
⎜ …
…
⎜⎜
⎝ bny1 (q) bny2 (q)
… b1nu (q) ⎞
⎟
… b2nu (q) ⎟
…
… ⎟
⎟
… bnynu( q) ⎟⎠
where the matrix element bkj is a polynomial in the shift operator q-1:
bkj (q) = a1kj q
− nbkj
nk
+ … + akj kj q
− nbkj − nbkj +1
nkkj is the delay from the jth input to the kth output. B(q) represents the
contributions of inputs to predicting all output values.
Data Supported by Polynomial Models
• “Types of Supported Data” on page 3-48
• “Designating Data for Estimating Continuous-Time Models” on page 3-49
• “Designating Data for Estimating Discrete-Time Models” on page 3-49
Types of Supported Data
You can estimate linear, black-box polynomial models from data with the
following characteristics:
• Time- or frequency-domain data (iddata or idfrd data objects).
Note For frequency-domain data, you can only estimate ARX and OE
models.
To estimate black-box polynomial models for time-series data, see Chapter
6, “Time Series Model Identification”.
• Real data or complex data in any domain.
3-48
Identifying Input-Output Polynomial Models
• Single-output and multiple-output.
You must import your data into the MATLAB workspace, as described in
Chapter 1, “Data Processing”.
Designating Data for Estimating Continuous-Time Models
To get a linear, continuous-time model of arbitrary structure for time-domain
data, you can estimate a discrete-time model, and then use d2c to transform
it to a continuous-time model.
For continuous-time frequency-domain data, you can estimate directly only
the ARX and Output-Error (OE) continuous-time models. Other structures
include noise models, which is not supported for frequency-domain data.
Tip To denote continuous-time frequency-domain data, set the data sampling
interval to 0. You can set the sampling interval when you import data into
the GUI or set the Ts property of the data object at the command line.
Designating Data for Estimating Discrete-Time Models
You can estimate arbitrary-order, linear state-space models for both time- or
frequency-domain data.
Your data must have the data property Ts set to the experimental data
sampling interval.
Tip You can set the sampling interval when you import data into the GUI or
set the Ts property of the data object at the command line.
Preliminary Step – Estimating Model Orders and
Input Delays
• “Why Estimate Model Orders and Delays?” on page 3-50
• “Estimating Orders and Delays in the GUI” on page 3-50
3-49
3
Linear Model Identification
• “Estimating Model Orders at the Command Line” on page 3-53
• “Estimating Delays at the Command Line” on page 3-55
• “Selecting Model Orders from the Best ARX Structure” on page 3-55
Why Estimate Model Orders and Delays?
To estimate polynomial models, you must provide input delays and model
orders. If you already have insight into the physics of your system, you can
specify the number of poles and zeros.
In most cases, you do not know the model orders in advance. To get initial
model orders and delays for your system, you can estimate several ARX
models with a range of orders and delays and compare the performance of
these models. You choose the model orders that correspond to the best model
performance and use these orders as an initial guess for further modeling.
Because this estimation procedure uses the ARX model structure, which
includes the A and B polynomials, you only get estimates for the na, nb, and
nk parameters. However, you can use these results as initial guesses for the
corresponding polynomial orders and input delays in other model structures,
such as ARMAX, OE, and BJ.
If the estimated nk is too small, the leading nb coefficients are much smaller
than their standard deviations. Conversely, if the estimated nk is too large,
there is a significant correlation between the residuals and the input for lags
that correspond to the missing B terms. For information about residual
analysis plots, see “Using Residual Analysis Plots to Validate Models” on
page 8-16.
Estimating Orders and Delays in the GUI
The following procedure assumes that you have already imported your data
into the GUI and performed any necessary preprocessing operations. For
more information, see Chapter 1, “Data Processing”.
To estimate model orders and input delays in the System Identification Tool
GUI:
3-50
Identifying Input-Output Polynomial Models
1 In the System Identification Tool GUI, select Estimate > Linear
parametric models to open the Linear Parametric Models dialog box.
The ARX model is already selected by default in the Structure list.
Note For time-series models, select the AR model structure.
2 Edit the Orders field to specify a range of poles, zeros, and delays. For
example, enter the following values for na, nb, and nk:
[1:10 1:10 1:10]
Tip As a shortcut for entering 1:10 for each required model order, click
Order Selection.
3-51
3
Linear Model Identification
3 Click Estimate to open the ARX Model Structure Selection window, which
displays the model performance for each combination of model parameters.
The following figure shows an example plot.
4 Select a rectangle that represents the optimum parameter combination and
click Insert to estimates a model with these parameters. For information
about using this plot, see “Selecting Model Orders from the Best ARX
Structure” on page 3-55.
This action adds a new model to the Model Board in the System
Identification Tool GUI. The default name of the parametric model contains
the model type and the number of poles, zeros, and delays. For example,
arx692 is an ARX model with na=6, nb=9, and a delay of two samples.
5 Click Close to close the ARX Model Structure Selection window.
After estimating model orders and delays, use these values as initial guesses
for estimating other model structures, as described in “How to Estimate
Polynomial Models in the GUI” on page 3-57.
3-52
Identifying Input-Output Polynomial Models
Estimating Model Orders at the Command Line
You can estimate model orders using the struc, arxstruc, and selstruc
commands in combination.
If you are working with a multiple-output system, you must use struc,
arxstruc, and selstruc commands for each output. In this case, you must
subreference the correct output channel in your estimation and validation
data sets.
For each estimation, you use two independent data sets—an estimation data
set and a validation data set. These independent data set can be from different
experiments, or you can select these data sets from a single experiment. For
more information about subreferencing data, see “Subreferencing iddata
Objects” on page 1-55 and “Subreferencing idfrd Objects” on page 1-70.
For an example of estimating model orders for a multiple-input system, see
“Estimating Delays in the Multiple-Input System” in System Identification
Toolbox Getting Started Guide.
struc. The struc command creates a matrix of possible model-order
combinations for a specified range of na, nb, and nk values.
For example, the following command defines the range of model orders and
delays na=2:5, nb=1:5, and nk=1:5:
NN = struc(2:5,1:5,1:5))
Note struc applies only to single-input/single-output models. If you
have multiple inputs and want to use struc, apply this command to one
input-output pair at a time.
arxstruc. The arxstruc command takes the output from struc, estimates
an ARX model for each model order, and compares the model output to the
measured output. arxstruc returns the loss for each model, which is the
normalized sum of squared prediction errors.
3-53
3
Linear Model Identification
For example, the following command uses the range of specified orders NN
to compute the loss function for single-input/single-output estimation data
data_e and validation data data_v:
V = arxstruc(data_e,data_v,NN)
Each row in NN corresponds to one set of orders:
[na nb nk]
selstruc. The selstruc command takes the output from arxstruc and opens
the ARX Model Structure Selection window to guide your choice of the model
order with the best performance.
For example, to open the ARX Model Structure Selection window and
interactively choose the optimum parameter combination, use the following
command:
selstruc(V)
For more information about working with the ARX Model Structure Selection
window, see “Selecting Model Orders from the Best ARX Structure” on page
3-55.
To find the structure that minimizes Akaike’s Information Criterion, use
the following command:
nn = selstruc(V,'AIC')
where nn contains the corresponding na, nb, and nk orders.
Similarly, to find the structure that minimizes the Rissanen’s Minimum
Description Length (MDL), use the following command:
nn = selstruc(V,'MDL')
To select the structure with the smallest loss function, use the following
command:
nn = selstruc(V,0)
3-54
Identifying Input-Output Polynomial Models
After estimating model orders and delays, use these values as initial guesses
for estimating other model structures, as described in “Using pem to Estimate
Polynomial Models” on page 3-61.
Estimating Delays at the Command Line
The delayest command estimates the time delay in a dynamic system by
estimating a low-order, discrete-time ARX model and treating the delay as an
unknown parameter.
By default, delayest assumes that na=nb=2 and that there is a good
signal-to-noise ratio, and uses this information to estimate nk.
To estimate the delay for a data set data, type the following at the prompt:
delayest(data)
If your data has a single input, MATLAB computes a scalar value for the
input delay—equal to the number of data samples. If your data has multiple
inputs, MATLAB returns a vector, where each value is the delay for the
corresponding input signal.
To compute the actual delay time, you must multiply the input delay by the
sampling interval of the data.
You can also use the ARX Model Structure Selection window to estimate input
delays and model order together, as described in “Estimating Model Orders at
the Command Line” on page 3-53.
Selecting Model Orders from the Best ARX Structure
You generate the ARX Model Structure Selection window for your data to
select the best-fit model.
For a procedure on generating this plot in the System Identification Tool GUI,
see “Estimating Orders and Delays in the GUI” on page 3-50. To open this
plot at the command line, see “Estimating Model Orders at the Command
Line” on page 3-53.
The following figure shows a sample plot in the ARX Model Structure
Selection window.
3-55
3
Linear Model Identification
The horizontal axis in the ARX Model Structure Selection window is the total
number of ARX parameters:
Number of parameters = na + nb
The vertical axis, called Unexplained output variance (in %), is the ARX
model prediction error for a specific number of parameters. The prediction
error is the sum of the squares of the differences between the validation
data output and the model output. In other words, Unexplained output
variance (in %) is the portion of the output not explained by the model.
Three rectangles are highlighted on the plot—green, blue, and red. Each color
indicates a type of best-fit criterion, as follows:
• Red minimizes the sum of the squares of the difference between the
validation data output and the model output. This option is considered the
overall best fit.
• Green minimizes Rissanen MDL criterion.
3-56
Identifying Input-Output Polynomial Models
• Blue minimizes Akaike AIC criterion.
In the ARX Model Structure Selection window, click any bar to view the
orders that give the best fit. The area on the right is dynamically updated to
show the orders and delays that give the best fit.
For more information about the AIC criterion, see “Using Akaike’s Criteria to
Validate Models” on page 8-61.
How to Estimate Polynomial Models in the GUI
• “Before You Begin” on page 3-57
• “Estimating Polynomial Models in the GUI” on page 3-57
Before You Begin
Before you estimate polynomial models, you must have already imported your
data into the GUI and performed any necessary preprocessing operations. For
more information, see Chapter 1, “Data Processing”.
This procedure also requires that you select a model structure and specify
model orders and delays. For more information about how to estimate model
orders and delays, see “Estimating Orders and Delays in the GUI” on page
3-50.
If you are estimating a multiple-output ARX model, you must specify order
matrices in the MATLAB workspace before estimation, as described in
“Options for Multiple-Input and Multiple-Output ARX Orders” on page 3-64.
Estimating Polynomial Models in the GUI
To estimate a polynomial model in the System Identification Tool GUI.
1 In the System Identification Tool GUI, select Estimate > Linear
parametric models to open the Linear Parametric Models dialog box.
3-57
3
Linear Model Identification
2 In the Structure list, select the polynomial model structure you want to
estimate from the following options:
• ARX:[na nb nk]
• ARMAX:[na nb nc nk]
• OE:[nb nf nk]
• BJ:[nb nc nd nf nk]
This action updates the options in the Linear Parametric Models dialog box
to correspond with this model structure. For information about each model
structure, see “What Are Black-Box Polynomial Models?” on page 3-41.
Note For time-series data, only AR and ARMA models are available. For
more information about estimating time-series models, see Chapter 6,
“Time Series Model Identification”.
3 In the Orders field, specify the model orders and delays, as follows:
• For single-output polynomial models. Enter the model orders and
delays according to the sequence displayed in the Structure field. For
multiple-input models, specify nb and nk as row vectors with as many
elements as there are inputs. If you are estimating BJ and OE models,
you must also specify nf as a vector.
For example, for a three-input system, nb can be [1 2 4], where each
element corresponds to an input.
• For multiple-output ARX models. Enter the model orders, as
described in “Options for Multiple-Input and Multiple-Output ARX
Orders” on page 3-64.
Tip To enter model orders and delays using the Order Editor dialog box,
click Order Editor.
4 (ARX models only) Select the estimation Method as ARX or IV
(instrumental variable method). For information about the algorithms, see
“Algorithms for Estimating Polynomial Models” on page 3-66.
3-58
Identifying Input-Output Polynomial Models
5 In the Name field, edit the name of the model or keep the default. The
name of the model should be unique in the Model Board.
6 In the Focus list, select how to weigh the relative importance of the fit at
different frequencies. For more information about each option, see “Option
for Frequency-Weighing Focus” on page 3-65.
7 In the Initial state list, specify how you want the algorithm to treat initial
states. For more information about the available options, see “Options for
Initial States” on page 3-39.
Tip If you get an inaccurate fit, try setting a specific method for handling
initial states rather than choosing it automatically.
8 In the Covariance list, select Estimate if you want the algorithm to
compute parameter uncertainties. Effects of such uncertainties are
displayed on plots as model confidence regions.
To omit estimating uncertainty, select None. Skipping uncertainty
computation for large, multiple-output ARX models might reduce
computation time.
9 (ARMAX, OE, and BJ models only) To view the estimation progress in
the MATLAB Command Window, select the Trace check box. During
estimation, the following information is displayed for each iteration:
• Loss function — Equals the determinant of the estimated covariance
matrix of the input noise.
• Parameter values — Values of the model structure coefficients you
specified.
• Search direction — Change in parameter values from the previous
iteration.
• Fit improvements — Shows the actual versus expected improvements in
the fit.
10 Click Estimate to add this model to the Model Board in the System
Identification Tool GUI.
3-59
3
Linear Model Identification
11 (Prediction-error method only) To stop the search and save the results
after the current iteration has been completed, click Stop Iterations. To
continue iterations from the current model, click the Continue iter button
to assign current parameter values as initial guesses for the next search.
12 To plot the model, select the appropriate check box in the Model Views
area of the System Identification Tool GUI. For more information about
validating models, see “Overview of Model Validation and Plots” on page
8-2.
If you get an inaccurate fit, try estimating a new model with different orders
or structure. You can export the model to the MATLAB workspace for further
analysis by dragging it to the To Workspace rectangle in the System
Identification Tool GUI.
How to Estimate Polynomial Models at the Command
Line
• “Using arx and iv4 to Estimate ARX Models” on page 3-60
• “Using pem to Estimate Polynomial Models” on page 3-61
Using arx and iv4 to Estimate ARX Models
You can estimate single-output and multiple-output ARX models using
the arx and iv4 commands. For information about the algorithms, see
“Algorithms for Estimating Polynomial Models” on page 3-66.
If you are estimating a multiple-output ARX model, you must specify order
matrices in the MATLAB workspace before estimation, as described in
“Options for Multiple-Input and Multiple-Output ARX Orders” on page 3-64.
For single-output data, the arx and iv4 commands produce an idpoly model
object, and for multiple-output data these commands produce an idarx model
object.
You can use the following general syntax to both configure and estimate ARX
models:
% Using ARX method
3-60
Identifying Input-Output Polynomial Models
m = arx(data,[na nb nk],'Property1',Value1,...,
'PropertyN',ValueN)
% Using IV method
m = iv4(data,[na nb nk],'Property1',Value1,...,
'PropertyN',ValueN)
data is the estimation data and [na nb nk] specifies the model orders, as
discussed in “What Are Black-Box Polynomial Models?” on page 3-41.
The property-value pairs specify any model properties that configure the
estimation algorithm and the initial conditions. For more information about
accessing and setting model properties, see “Model Properties” on page 2-14.
Note You can specify all property-value pairs as a comma-separated list.
To get discrete-time models, use the time-domain data (iddata object). To get
a single-output continuous-time model, apply d2c to a discrete-time model
or use continuous-time frequency-domain data—either idfrd object, or
frequency-domain iddata with Ts=0.
Note The System Identification Toolbox product does not support
multiple-output continuous-time idarx models.
For more information about validating you model, see “Overview of Model
Validation and Plots” on page 8-2.
You can use pem to refine parameter estimates of an existing polynomial
model, as described in “Refining Linear Parametric Models” on page 3-103.
For detailed information about these commands, see the corresponding
reference page.
Using pem to Estimate Polynomial Models
You can estimate any single-output polynomial model using the iterative
prediction-error estimation method pem. For Gaussian disturbances, this
3-61
3
Linear Model Identification
method gives the maximum likelihood estimate. that minimizes the prediction
errors to obtain maximum-likelihood values. The resulting models are stored
as idpoly model objects.
Use the following general syntax to both configure and estimate polynomial
models:
m = pem(data,'na',na,
'nb',nb,
'nc',nc,
'nd',nb,
'nf',nc,
'nk',nk,
'Property1',Value1,...,
'PropertyN',ValueN)
where data is the estimation data. na, nb, nc, nd, nf are integers that specify
the model orders, and nk specifies the input delays for each input. If you
skip any property-value pair, the corresponding parameter value is set to
zero—except nk, which has the default value 1. For more information about
model orders, see “What Are Black-Box Polynomial Models?” on page 3-41.
Tip You do not need to construct the model object using idoly before
estimation.
If you want to estimate the coefficients of all five polynomials, A, B, C, D, and
F, you must specify an integer order for each polynomial. However, if you
want to specify an ARMAX model for example, which includes only the A, B,
and C polynomials, you must set nd and nf to 0.
Note To get faster estimation of ARX models, use arx or iv4 instead of pem.
In addition to the polynomial models listed in “What Are Black-Box
Polynomial Models?” on page 3-41, you can use pem to model the ARARX
structure—called the generalized least-squares model—by setting nc=nf=0.
3-62
Identifying Input-Output Polynomial Models
You can also model the ARARMAX structure—called the extended matrix
model—by setting nf=0.
The property-value pairs specify any model properties that configure
the estimation algorithm and the initial conditions. You can enter all
property-value pairs in pem as a comma-separated list without worrying
about the hierarchy of these properties in the idpoly model object. For
more information about accessing and setting model properties, see “Model
Properties” on page 2-14.
For multiple inputs, nb, nf, and nk are row vectors of the same lengths as the
number of input channels:
nb = [nb1 ...
nf = [nf1 ...
nk = [nk1 ...
nbnu];
nfnu];
nknu];
For ARMAX, Box-Jenkins, and Output-Error models—which can only be
estimated using the iterative prediction-error method—use the armax, bj, and
oe estimation commands, respectively. These commands are versions of pem
with simplified syntax for these specific model structures, as follows:
m = armax(Data,[na nb nc nk])
m = oe(Data,[nb nf nk])
m = bj(Data,[nb nc nd nf nk])
Tip If your data is sampled fast, it might help to apply a lowpass filter to the
data before estimating the model. For example, to model only data in the
frequency range 0-10 rad/s, use the Focus property, as follows:
m = oe(Data,[nb nf nk],'Focus',[0 10])
For more information about validating you model, see “Overview of Model
Validation and Plots” on page 8-2.
You can use pem to refine parameter estimates of an existing polynomial
model, as described in “Refining Linear Parametric Models” on page 3-103.
3-63
3
Linear Model Identification
For detailed information about pem and idpoly, see the corresponding
reference page.
Options for Multiple-Input and Multiple-Output ARX
Orders
To estimate a multiple-input and multiple-output (MIMO) ARX model, you
must first specify the model order matrices, as follows:
• NA — An ny-by-ny matrix whose i-jth entry is the order of the polynomial
that relates the jth output to the ith output.
• NB — An ny-by-nu matrix whose i-jth entry is the order of the polynomial
that relates the jth input to the ith output.
• NK — An ny-by-nu matrix whose i-jth entry is the delay from the jth input
to the ith output.
• For ny outputs and nu inputs, the A coefficients are ny-by-ny matrices and
the B coefficients are ny-by-nu matrices. For more information about
MIMO ARX structure, see “Definition of Multiple-Output ARX Models”
on page 3-46.
Note For multiple-output time-series models, only AR models are supported.
AR models require only the NA matrix.
In the System Identification Tool GUI. You can enter the matrices directly
in the Orders field.
At the command line. Define variables that store the model order matrices
and specify these variables in the model-estimation command. You can use
the following syntax to estimate a model with these orders:
arx(data,'na',NA,'nb',NB,'nk',NK)
Tip To simplify entering large matrices orders in the System Identification
Tool GUI, define the variable NN=[NA NB NK] at the command line. You can
specify this variable in the Orders field.
3-64
Identifying Input-Output Polynomial Models
Option for Frequency-Weighing Focus
You can specify how the estimation algorithm weighs the fit at various
frequencies. This information supports the estimation procedures “How to
Estimate Polynomial Models in the GUI” on page 3-57 and “Using pem to
Estimate Polynomial Models” on page 3-61.
In the System Identification Tool GUI. Set Focus to one of the following
options:
• Prediction — Uses the inverse of the noise model H to weigh the relative
importance of how closely to fit the data in various frequency ranges.
Corresponds to minimizing one-step-ahead prediction, which typically
favors the fit over a short time interval. Optimized for output prediction
applications.
• Simulation — Uses the input spectrum to weigh the relative importance of
the fit in a specific frequency range. Does not use the noise model to weigh
the relative importance of how closely to fit the data in various frequency
ranges. Optimized for output simulation applications.
• Stability — Estimates the best stable model. For more information about
model stability, see “Unstable Models” on page 8-69.
• Filter — Specify a custom filter to open the Estimation Focus dialog box,
where you can enter a filter, as described in “Simple Passband Filter” on
page 1-111 or “Defining a Custom Filter” on page 1-112. This prefiltering
applies only for estimating the dynamics from input to output. The
disturbance model is determined from the unfiltered estimation data.
At the command line. Specify the focus as an argument in the
model-estimation command using the same options as in the GUI. For
example, use this command to estimate an ARX model and emphasize the
frequency content related to the input spectrum only:
m=arx(data,[2 2 3],'Focus','Simulation')
This Focus setting might produce more accurate simulation results.
3-65
3
Linear Model Identification
Options for Initial States
When you use the iterative estimation algorithm PEM to estimate ARMAX,
Box-Jenkins (BJ), Output-Error (OE), you must specify how the algorithm
treats initial states.
This information supports the estimation procedures “How to Estimate
Polynomial Models in the GUI” on page 3-57 and “Using pem to Estimate
Polynomial Models” on page 3-61.
In the System Identification Tool GUI. For ARMAX, OE, and BJ models,
set Initial state to one of the following options:
• Auto — Automatically chooses Zero, Estimate, or Backcast based on the
estimation data. If initial states have negligible effect on the prediction
errors, the initial states are set to zero to optimize algorithm performance.
• Zero — Sets all initial states to zero.
• Estimate — Treats the initial states as an unknown vector of parameters
and estimates these states from the data.
• Backcast — Estimates initial states using a smoothing filter.
At the command line. Specify the initial states as an argument in the
model-estimation command. For example, use this command to estimate an
ARMAX model and set the initial states to zero:
m=armax(data,[2 2 2 3],'InitialState','zero')
For a complete list of values for the InitialState model property, see the
idpoly reference page.
Algorithms for Estimating Polynomial Models
For linear ARX and AR models, you can choose between the ARX and IV
algorithms. ARX implements the least-squares estimation method that uses
QR-factorization for overdetermined linear equations. IV is the instrumental
variable method. For more information about IV, see the section on
variance-optimal instruments in System Identification: Theory for the User,
Second Edition, by Lennart Ljung, Prentice Hall PTR, 1999.
3-66
Identifying Input-Output Polynomial Models
The ARX and IV algorithms treat noise differently. ARX assumes white noise.
However, the instrumental variable algorithm, IV, is not sensitive to noise
color. Thus, use IV when the noise in your system is not completely white and
it is incorrect to assume white noise. If the models you obtained using ARX
are inaccurate, try using IV.
Note AR models apply to time-series data, which has no input. For more
information, see Chapter 6, “Time Series Model Identification”. For more
information about working with AR and ARX models, see “Identifying
Input-Output Polynomial Models” on page 3-41.
Example – Estimating Models Using armax
You can use estimation commands to both construct a model object and
estimate the model parameters. In this example, you estimate a linear,
polynomial model with an ARMAX structure for a three-input and
single-output (MISO) system using the iterative estimation method armax.
For a summary of all available estimation commands in the toolbox, see
“Commands for Model Estimation” on page 2-9.
1 Load a sample data set z8 with three inputs and one output, measured at
1-second intervals and containing 500 data samples:
load iddata8
2 Use armax to both construct the idpoly model object, and estimate the
parameters:
nu
A(q) y(t) = ∑ Bi (q)ui ( t − nki ) + C(q) e(t)
i=1
3-67
3
Linear Model Identification
Typically you try different model orders and compare results, ultimately
choosing the simplest model that best describes the system dynamics. The
following command specifies the estimation data set, z8, and the orders of
the A, B, and C polynomials as na, nb, and nc, respectively. nk of [0 0 0]
specifies that there is no input delay for all three input channels.
m_armax=armax(z8,'na',4,...
'nb',[3 2 3],...
'nc',4,...
'nk',[0 0 0],...
'focus', 'simulation',...
'tolerance',1e-5,...
'maxiter',50);
covariance, focus, tolerance, and maxiter are optional arguments
specify additional information about the computation. focus specifies
whether the model is optimized for simulation or prediction applications,
tolerance and maxiter specify when to stop estimation. For more
information about these properties, see the algorithm properties
reference page.
armax is a version of pem with simplified syntax for the ARMAX model
structure. The armax method both constructs the idpoly model object
and estimates its parameters.
Tip Instead of specifying model orders and delays as individual
property-value pairs, you can use the equivalent shorthand notation that
includes all of the order integers in a single vector, as follows:
m_armax=armax(z8,[4 3 2 3 4 0 0 0],...
'focus', 'simulation',...
'tolerance',1e-5,...
'maxiter',50);
3-68
Identifying Input-Output Polynomial Models
3 To view information about the resulting model object, type the following at
the prompt:
m_armax
MATLAB returns the following information about this model object:
Discrete-time IDPOLY model: A(q)y(t) = B(q)u(t) + e(t)
A(q) = 1 - 1.255q^-1 + 0.2551q^-2 + 0.2948q^-3 - 0.0619q^-4
B1(q) = -0.09168 + 1.105q^-1 + 0.7399q^-2
B2(q) = 1.022 + 0.129q^-1
B3(q) = -0.07605 + 0.08681q^-1 + 0.5619q^-2
C(q) = 1-0.06117q^-1 - 0.1461q^-2 + 0.009862q^-3 - 0.04313q^-4
Estimated using ARMAX from data set z8
Loss function 2.23844 and FPE 2.35202
Sampling interval: 1
m_armax is an idpoly model object. The coefficients represent estimated
parameters of this polynomial model.
Tip You can use present(m_armax) to show additional information about
the model, including parameter uncertainties.
3-69
3
Linear Model Identification
4 To view all property values for this model, type the following command:
get(m_armax
ans =
a:
b:
c:
d:
f:
da:
db:
dc:
dd:
df:
na:
nb:
nc:
nd:
nf:
nk:
InitialState:
Name:
Ts:
InputName:
InputUnit:
OutputName:
OutputUnit:
TimeUnit:
ParameterVector:
PName:
CovarianceMatrix:
NoiseVariance:
InputDelay:
Algorithm:
EstimationInfo:
Notes:
UserData:
3-70
[1 -1.2549 0.2551 0.2948 -0.0619]
[3x3 double]
[1 -0.0612 -0.1461 0.0099 -0.0431]
1
[3x1 double]
[]
[3x0 double]
[]
[]
[3x0 double]
4
[3 2 3]
4
0
[0 0 0]
[0 0 0]
'Auto'
''
1
{3x1 cell}
{3x1 cell}
{'y1'}
{''}
''
[16x1 double]
{}
[16x16 double]
0.9932
[3x1 double]
[1x1 struct]
[1x1 struct]
{}
[]
Identifying Input-Output Polynomial Models
5 The Algorithm and EstimationInfo model properties are structures. To
view the properties and values inside these structure, use dot notation.
For example:
m_armax.Algorithm
This action displays the complete list of Algorithm properties and values
that specify the iterative computational algorithm:
ans =
Approach:
Focus:
MaxIter:
Tolerance:
LimitError:
MaxSize:
SearchDirection:
FixedParameter:
Trace:
N4Weight:
N4Horizon:
Advanced:
'Pem'
'Simulation'
50
1.0000e-005
1.6000
'Auto'
'Auto'
[]
'Off'
'Auto'
'Auto'
[1x1 struct]
3-71
3
Linear Model Identification
Similarly, to view the properties and values of the EstimationInfo
structure, type the following command:
m_armax.EstimationInfo
This action displays the complete list of read-only EstimationInfo
properties and values that describe the estimation data set, quantitative
measures of model quality (loss function and FPE), the number of iterations
actually used, and the behavior of the iterative model estimation.
ans =
Status:
Method:
LossFcn:
FPE:
DataName:
DataLength:
DataTs:
DataDomain:
DataInterSample:
WhyStop:
UpdateNorm:
LastImprovement:
Iterations:
InitialState:
Warning:
'Estimated model (PEM)'
'ARMAX'
0.9602
1.0263
'z8'
500
1
'Time'
{3x1 cell}
'Near (local) minimum, (norm(g)<tol).'
8.0572e-006
'7.4611e-006%'
4
'Zero'
'None'
6 If you want to repeat the model estimation using different model orders,
but keep the algorithm properties the same, you can store the model
properties used for m_armax in a variable, as follows:
myAlg=m_armax.Algorithm
This action stores the specified focus, tolerance, and maxiter, and the
default algorithm.
7 To reuse the algorithm properties in estimating the ARMAX model with
different orders, use the following command:
m_armax2=armax(z8,[4 3 2 3 3 1 1 1],...
'algorithm',myAlg);
3-72
Identifying State-Space Models
Identifying State-Space Models
In this section...
“What Are State-Space Models?” on page 3-73
“Data Supported by State-Space Models” on page 3-77
“Supported State-Space Parameterizations” on page 3-78
“Preliminary Step – Estimating State-Space Model Orders” on page 3-79
“How to Estimate State-Space Models in the GUI” on page 3-84
“How to Estimate State-Space Models at the Command Line” on page 3-87
“How to Estimate Free-Parameterization State-Space Models” on page 3-90
“How to Estimate State-Space Models with Canonical Parameterization”
on page 3-91
“How to Estimate State-Space Models with Structured Parameterization”
on page 3-93
“How to Estimate the State-Space Equivalent of ARMAX and OE Models”
on page 3-100
“Options for Frequency-Weighing Focus” on page 3-100
“Options for Initial States” on page 3-101
“Algorithms for Estimating State-Space Models” on page 3-101
What Are State-Space Models?
• “Definition of State-Space Models” on page 3-74
• “Continuous-Time Representation” on page 3-74
• “Discrete-Time Representation” on page 3-75
• “Relationship Between Continuous-Time and Discrete-Time State
Matrices” on page 3-75
• “State-Space Representation of Transfer Functions” on page 3-76
3-73
3
Linear Model Identification
Definition of State-Space Models
State-space models are models that use state variables to describe a system by
a set of first-order differential or difference equations, rather than by one or
more nth-order differential or difference equations. State variables x(t) can be
reconstructed from the measured input-output data, but are not themselves
measured during an experiment.
The state-space model structure is a good choice for quick estimation because
it requires only two parameters:
• n — Model order or the number of poles (size of the A matrix).
• nk — One or more input delays.
The model order for state-space models is an integer equal to the dimension
of x(t) and relates to the number of delayed inputs and outputs used in the
corresponding linear difference equation.
Continuous-Time Representation
In continuous-time, the state-space description has the following form:
(t)
x (t) = Fx(t) + Gu(t) + Kw
y(t) = Hx(t) + Du(t) + w(t)
x(0) = x0
It is often easier to define a parameterized state-space model in continuous
time because physical laws are most often described in terms of differential
equations. In this case, the matrices F, G, H, and D contain elements with
physical significance—for example, material constants. x0 specifies the initial
states.
Note K=0 gives the state-space representation of an Output-Error model.
For more information about Output-Error models, see “What Are Black-Box
Polynomial Models?” on page 3-41.
3-74
Identifying State-Space Models
Discrete-Time Representation
Discrete-time state-space models provide the same type of linear difference
relationship between the inputs and the outputs as the linear ARX model, but
are rearranged such that there is only one delay in the expressions. The
discrete-time state-space model structure is often written in the innovations
form that describes noise:
x(kT + T ) = Ax(kT ) + Bu(kT ) + Ke(kT )
y(kT ) = Cx(kT ) + Du(kT ) + e(kT )
x(0) = x0
where T is the sampling interval, u(kT) is the input at time instant kT, and
y(kT) is the output at time instant kT.
Note K=0 gives the state-space representation of an Output-Error model.
For more information about Output-Error models, see “What Are Black-Box
Polynomial Models?” on page 3-41.
Relationship Between Continuous-Time and Discrete-Time
State Matrices
The relationships between the discrete state-space matrices A, B, C, D, and K
and the continuous-time state-space matrices F, G, H, D, and K are given for
piece-wise-constant input, as follows:
A = e FT
T
B=
∫e
Fτ
Gdτ
0
C=H
These relationships assume that the input is piece-wise-constant over time
intervals kT ≤ t < (k + 1)T .
3-75
3
Linear Model Identification
The exact relationship between K and K is complicated. However, for short
sampling intervals T, the following approximation works well:
T
K=
∫e
Fτ
τ
Kd
0
State-Space Representation of Transfer Functions
For linear models, the general symbolic model description is given by:
y = Gu + He
G is a transfer function that takes the input u to the output y. H is a transfer
function that describes the properties of the additive output noise model.
The discrete-time state-space representation is given by the following
equation:
x(kT + T ) = Ax(kT ) + Bu(kT ) + Ke(kT )
y(kT ) = Cx(kT ) + Du(kT ) + e(kT )
x(0) = x0
where T is the sampling interval, u(kT) is the input at time instant kT, and
y(kT) is the output at time instant kT.
The relationships between the transfer functions and the discrete-time
state-space matrices are given by the following equations:
G(q) = C(qInx − A)−1 B + D
H (q) = C(qInx − A)−1 K + Iny
where Inx is the nx-by-nx identity matrix, Iny is the nx-by-nx identity matrix,
and ny is the dimension of y and e.
3-76
Identifying State-Space Models
Data Supported by State-Space Models
• “Types of Supported Data” on page 3-77
• “Estimating Continuous-Time Models” on page 3-77
• “Designating Data for Estimating Discrete-Time Models” on page 3-78
Types of Supported Data
You can estimate linear state-space models from data with the following
characteristics:
• Real data or complex data in any domain
• Single-output and multiple-output
• Time- or frequency-domain data
To estimate state-space models for time-series data, see Chapter 6, “Time
Series Model Identification”.
You must first import your data into the MATLAB workspace, as described in
Chapter 1, “Data Processing”.
Estimating Continuous-Time Models
Use either of the following ways to estimate continuous-time, state-space
models:
• To get a linear, continuous-time model of arbitrary structure for
time-domain data, you can estimate a discrete-time model, and then use
d2c to transform it to a continuous-time model.
• Use continuous-time frequency-domain data.
To denote continuous-time frequency-domain data, set the data sampling
interval to 0. You can set the sampling interval when you import data into
the GUI or set the Ts property of the data object at the command line.
3-77
3
Linear Model Identification
Tip Continuous state-space models are available for canonical and
structured parameterizations and grey-box models. In this case, no
disturbance model can be estimated.
Designating Data for Estimating Discrete-Time Models
You can estimate arbitrary-order, linear state-space models for both time- or
frequency-domain data.
You must specify your data to have the sampling interval equal to the
experimental data sampling interval.
You can set the sampling interval when you import data into the GUI or set
the Ts property of the data object at the command line.
Supported State-Space Parameterizations
The System Identification Toolbox product supports the following
parameterizations that indicate which parameters are estimated and which
remain fixed at specific values:
• Free parameterization results in the estimation of all system matrix
elements A, B, C, D, and K.
• Canonical forms of A, B, C, D, and K matrices.
Canonical parameterization represents a state-space system in its minimal
form, using the minimum number of free parameters to capture the
dynamics. Thus, free parameters appear in only a few of the rows and
columns in system matrices A, B, C, and D, and the remaining matrix
elements are fixed to zeros and ones.
• Structured parameterization lets you specify the values of specific
parameters and exclude these parameters from estimation.
• Completely arbitrary mapping of parameters to state-space matrices. For
more information, see “Estimating Linear Grey-Box Models” on page 5-6.
3-78
Identifying State-Space Models
You can only estimate free state-space models in discrete time.
Continuous state-space models are available for canonical and structured
parameterizations and grey-box models.
Note To estimate canonical and structured state-space models in the System
Identification Tool GUI, define the corresponding model structures at the
command line and import them into the System Identification Tool GUI.
Preliminary Step – Estimating State-Space Model
Orders
• “Why Estimate Model Orders?” on page 3-79
• “Estimating Model Order in the GUI” on page 3-79
• “Estimating the Model Order at the Command Line” on page 3-82
• “Using the Model Order Selection Window” on page 3-83
Why Estimate Model Orders?
To estimate a state-space model, you must provide a model order and one
or more input delays.
To get an initial model order for your system, you can estimate a group of
state-space models with a range of orders for a specific delay and compare the
performance of these models. You choose the model order that include states
with the highest contribution to the input-output behavior of the model and
use this order as an initial guess for further modeling.
The model order is always a single integer—regardless of the number of
inputs and outputs. However, the number of input delays must correspond to
the number of input channels.
Estimating Model Order in the GUI
You must have already imported your data into the GUI, as described in
“Representing Data in the GUI” on page 1-13.
3-79
3
Linear Model Identification
To estimate model orders for a specific input delay:
1 In the System Identification Tool GUI, select Estimate > Linear
parametric models to open the Linear Parametric Models dialog box.
2 In the Structure list, select State Space:
n [nk].
3 Edit the Orders field to specify a range of orders for a specific delay. For
example, enter the following values for n and nk:
1:10 [1]
Tip As a shortcut for entering 1:10 [1], click Order Selection.
4 Verify that the Method is set to N4SID.
3-80
Identifying State-Space Models
5 Click Estimate to open the Model Order Selection window, which
displays the relative measure of how much each state contributes to the
input-output behavior of the model (log of singular values of the covariance
matrix). The following figure shows an example plot.
6 Select the rectangle that represents the cutoff for the states on the left that
provide a significant contribution to the input-output behavior, and click
Insert to estimate a model with this order. Red indicates the recommended
choice. States 1 and 2 provide the most significant contribution. The
contributions to the right of state 2 drop significantly. For information
about using the Model Order Selection window, see “Using the Model Order
Selection Window” on page 3-83.
This action adds a new model to the Model Board in the System
Identification Tool GUI. The default name of the parametric model
combines the string n4s and the selected model order.
7 Click Close to close the Model Order Selection window.
3-81
3
Linear Model Identification
After estimating model orders, use this value as an initial guess for estimating
other state-space models, as described in “How to Estimate State-Space
Models in the GUI” on page 3-84.
Estimating the Model Order at the Command Line
You can estimate the state-space model order using the n4sid command.
Use following syntax to specify the range of model orders to try for a specific
input delay.
m = n4sid(data,n1:n2,'nk',nk);
where data is the estimation data set, n1 and n2 specify the range of orders,
and nk specifies the input delay. For multiple-input systems, nk is a vector
of input delays.
This command opens the Model Order Selection window. For information
about using this plot, see “Using the Model Order Selection Window” on page
3-83.
Alternatively, you can use the pem command to open the Model Order
Selection window, as follows:
m = pem(Data,'nx',nn)
where nn = [n1,n2,...,nN] specifies the vector or range of orders you
want to try.
To omit opening the Model Order Selection window and automatically select
the best order, use the following syntax:
m = pem(Data,'best')
For a tutorial on estimating model orders for a multiple-input system, see
“Estimating a State-Space Model” in System Identification Toolbox Getting
Started Guide.
3-82
Identifying State-Space Models
Using the Model Order Selection Window
You can generate the Model Order Selection window for your data to select
the number of states that provide the highest relative contribution to the
input-output behavior of the model (log of singular values of the covariance
matrix).
For a procedure on generating this plot in the System Identification Tool
GUI, see “Estimating Model Order in the GUI” on page 3-79. To open this
plot at the command line, see “Estimating the Model Order at the Command
Line” on page 3-82.
The following figure shows a sample Model Order Selection window.
The horizontal axis corresponds to the model order n. The vertical axis, called
Log of Singular values, shows the singular values of a covariance matrix
constructed from the observed data.
You use this plot to decide which states provide a significant relative
contribution to the input-output behavior, and which states provide the
3-83
3
Linear Model Identification
smallest contribution. Based on this plot, select the rectangle that represents
the cutoff for the states on the left that provide a significant contribution to
the input-output behavior. The recommended choice is red.
For example, in the previous figure, states 1 and 2 provide the most significant
contribution. However, the contributions of the states to the right of state 2
drop significantly. This sharp decrease in the log of the singular values after
n=2 indicates that using two states is sufficient to get an accurate model.
How to Estimate State-Space Models in the GUI
• “Supported State-Space Models in the GUI” on page 3-84
• “Before You Begin” on page 3-84
• “Estimating State-Space Models in the GUI” on page 3-84
Supported State-Space Models in the GUI
Only free parameterization is directly supported in the System Identification
Tool GUI. You can also estimate canonical and structured parameterizations
at the command line and import them into the System Identification Tool
GUI for parameter estimation. For more information about state-space
parameterization, see “Supported State-Space Parameterizations” on page
3-78.
Before You Begin
Before you estimate state-space models, you must have already imported your
data into the GUI and performed any necessary preprocessing operations. For
more information, see Chapter 1, “Data Processing”.
The following procedure also requires that you specify model order and
input delays. For more information about how to estimate model orders, see
“Estimating Model Order in the GUI” on page 3-79.
Estimating State-Space Models in the GUI
To estimate a state-space model with free parameterization in the System
Identification Tool GUI:
3-84
Identifying State-Space Models
1 In the System Identification Tool GUI, select Estimate > Linear
parametric models to open the Linear Parametric Models dialog box.
2 In the Structure list, select State Space:
n [nk].
This action updates the options in the Linear Parametric Models dialog box
to correspond with this model structure. For information about each model
structure, see “What Are State-Space Models?” on page 3-73.
3 In the Orders field, specify the model order and delay, as follows:
• For single-input models. Enter the model order integer and the input
delay in terms of the number of samples. Omitting nk uses the default
value nk=1.
For example, enter 4 [2] for a fourth-order model and nk=2.
• For multiple-input models. Enter the model order integer and the
input delay vector—which is a 1-by-nu vector whose ith entry is the
delay for the ith input.
For example, for a two-input system, enter 4 [1 1] for a fourth-order
model and a delay of 1 for each input.
• For multiple-output models. Enter the model order integer the same
way as for single-input models.
Tip To enter model order and any delays using the Order Editor dialog
box, click Order Editor.
4 Select the estimation Method as N4SID or PEM. For more information
about these methods, “Algorithms for Estimating State-Space Models” on
page 3-101.
5 In the Name field, edit the name of the model or keep the default. The
name of the model should be unique in the Model Board.
6 In the Focus list, select how to weigh the relative importance of the fit at
different frequencies. For more information about each option, see “Options
for Frequency-Weighing Focus” on page 3-100.
3-85
3
Linear Model Identification
7 (PEM only) In the Initial state list, specify how you want the algorithm to
treat initial states. For more information about the available options, see
“Options for Initial States” on page 3-101.
Tip If you get an inaccurate fit, try setting a specific method for handling
initial states rather than choosing it automatically.
8 In the Covariance list, select Estimate if you want the algorithm to
compute parameter uncertainties. Effects of such uncertainties are
displayed on plots as model confidence regions.
To omit estimating uncertainty, select None. Skipping uncertainty
computation reduces computation time for complex models and large data
sets.
9 (PEM only) To view the estimation progress in the MATLAB Command
Window, select the Trace check box. During estimation, the following
information is displayed for each iteration:
• Loss function — Equals the determinant of the estimated covariance
matrix of the input noise.
• Parameter values — Values of the model structure coefficients you
specified.
• Search direction — Change in parameter values from the previous
iteration.
• Fit improvements — Shows the actual versus expected improvements in
the fit.
10 Click Estimate to add this model to the System Identification Tool GUI.
11 (PEM only) To stop the search and save the results after the current
iteration has been completed, click Stop Iterations. To continue iterations
from the current model, click the Continue iter button to assign current
parameter values as initial guesses for the next search.
12 To plot the model, select the appropriate check box in the Model Views
area of the System Identification Tool GUI. For information about
3-86
Identifying State-Space Models
validating your model, see “Overview of Model Validation and Plots” on
page 8-2.
Tip You can export the model to the MATLAB workspace for further analysis
by dragging it to the To Workspace rectangle in the System Identification
Tool GUI.
How to Estimate State-Space Models at the Command
Line
• “Supported State-Space Models” on page 3-87
• “Estimating State-Space Models Using pem and n4sid” on page 3-87
• “Common Properties to Specify Model Estimation” on page 3-88
• “Choosing to Estimate D, K, and X0 Matrices” on page 3-89
Supported State-Space Models
You can only estimate discrete-time state-space models with free
parameterization. Continuous state-space models are available for canonical
and structured parameterizations.
Estimating State-Space Models Using pem and n4sid
You can estimate continuous-time and discrete-time polynomial model using
the iterative estimation command pem that minimizes the prediction errors
to obtain maximum-likelihood values. You can also use the noniterative
subspace command n4sid.
You must have already estimated the model order, as described in
“Preliminary Step – Estimating State-Space Model Orders” on page 3-79. You
use this model order as input to the estimation functions.
Use the following general syntax to both configure and estimate state-space
models:
m = pem(data,n,
'nk',nk,
3-87
3
Linear Model Identification
'Property1',Value1,...,
'PropertyN',ValueN)
where data is the estimation data, n is the model order, and nk specifies the
input delays for each input.
As an alternative to pem, you can use n4sid:
m = n4sid(data,n,
'nk',nk,
'Property1',Value1,...,
'PropertyN',ValueN)
Note pem uses n4sid to initialize the state-space matrices.
For more information about the most common property-value pairs you can
specify, see “Common Properties to Specify Model Estimation” on page 3-88.
For detailed information about the syntax, see the corresponding reference
page.
For more information about estimating model order, see “Estimating the
Model Order at the Command Line” on page 3-82.
For information about validating your model, see “Overview of Model
Validation and Plots” on page 8-2
Common Properties to Specify Model Estimation
The following properties are common to specify in the estimation syntax:
• SSparameterization — Specifies the state-space parameterization
form. For more information about estimating a specific state-space
parameterization, see the following topics:
3-88
-
“How to Estimate Free-Parameterization State-Space Models” on page
3-90
-
“How to Estimate State-Space Models with Canonical Parameterization”
on page 3-91
Identifying State-Space Models
-
“How to Estimate State-Space Models with Structured Parameterization”
on page 3-93
• Focus — Specifies the frequency-weighing of the noise model during
estimation. See “Options for Frequency-Weighing Focus” on page 3-100.
• DisturbanceModel — Specifies to estimate or omit the noise model for
time-domain data. See “K Matrix” on page 3-89.
• InitialStates — Specifies to set or estimate the initial states. See
“Options for Initial States” on page 3-101.
For more information about these properties, see the idss reference page.
Choosing to Estimate D, K, and X0 Matrices
For state-space models with any parameterization, you can specify whether
to estimate the K and X0 matrices, which represent the noise model and the
initial states, respectively.
For state-space models with structured parameterization, you can also specify
to estimate the D matrix. However, for free and canonical forms, the structure
of the D matrix is set based on your choice of nk.
For more information about state-space structure, see “What Are State-Space
Models?” on page 3-73.
D Matrix. By default, the D matrix is not estimated. Set the model property
nk to estimate the D matrix, as follows:
• To estimate the kth column of D (corresponding to the kth input), set nk to
0. For nu inputs, nk is a 1-by-nu vector.
• To estimate the full D matrix, set all nk values to 0. For example, for two
inputs:
m = pem(Data,n,'nk',[0 0])
To omit estimating the D matrix, set the nk value or values to 1, which is
the default.
K Matrix. K represents the noise model.
3-89
3
Linear Model Identification
For frequency-domain data, no noise model is estimated and K is set to 0. For
time-domain data, K is estimated by default.
To modify whether K is estimated for time-domain data, you can specify the
DisturbanceModel property in the estimator syntax.
Initially, you can omit estimating the noise parameters in K to focus on
achieving a reasonable model for the system dynamics. After estimating the
dynamic model, you can use pem to refine the model and set the K parameters
to be estimated. For example:
m = pem(Data,md,'DisturbanceModel','Estimate')
where md is the dynamic model without noise.
To set K to zero, set the value of the DisturbanceModel property to 'None'.
For example:
m = pem(Data,n,'DisturbanceModel','None')
XO Matrices. X0 stores the estimated or specified initial states of the model.
To specify how to handle the initial states, set the value of the InitialStates
model property. For example, to set the initial states to zero, set the
InitialStates property to 'zero', as follows:
m = pem(Data,n,'InitialStates','zero')
When you estimate models using multiexperiment data and InitialStates
is set to 'Estimate', X0 stores the estimated initial states corresponding to
the last experiment in the data set.
For a complete list of values for the InitialStates property, see “Options for
Initial States” on page 3-101.
How to Estimate Free-Parameterization State-Space
Models
The default parameterization of the state-space matrices A, B, C, D, and K is
free; that is, any elements in the matrices are adjustable by the estimation
3-90
Identifying State-Space Models
routines. Because the parameterization of A, B, and C is free, a basis for
the state-space realization is automatically selected to give well-conditioned
calculations.
You can only estimate discrete-time state-space models with any
parameterization. Continuous state-space models are available for canonical
and structured parameterizations only.
To estimate the disturbance model K, you must use time domain data.
Suppose that you have no knowledge about the internal structure of the
discrete-time state-space model. To quickly get started, use the following
syntax:
m = pem(data)
where data is your estimation data. This command estimates a state-space
model for an automatically selected order between 1 and 10.
To find a black-box model of a specific order n, use the following syntax:
m = pem(Data,n)
The iterative algorithm pem is initialized by the subspace method n4sid. You
can use n4sid directly, as an alternative to pem:
m = n4sid(Data,n)
How to Estimate State-Space Models with Canonical
Parameterization
• “What Is Canonical Parameterization?” on page 3-91
• “Estimating Canonical State-Space Models” on page 3-92
What Is Canonical Parameterization?
Canonical parameterization represents a state-space system in its minimal
form, using the minimum number of free parameters to capture the dynamics.
Thus, free parameters appear in only a few of the rows and columns in system
3-91
3
Linear Model Identification
matrices A, B, C, and D, and the remaining matrix elements are fixed to
zeros and ones.
Of the two popular canonical forms, which include controllable canonical
form and observable canonical form, the toolbox supports only controllable
forms. Controllable canonical structures include free parameters in output
rows of the A matrix, free B and K matrices, and the fixed C matrix. The
representation within controllable canonical forms is not unique and the
exact form depends on the actual choices of canonical indices. For more
information about the distribution of free parameters in canonical forms, see
the appendix on identifiability of black-box multivariable model structures in
System Identification: Theory for the User, Second Edition, by Lennart Ljung,
Prentice Hall PTR, 1999 (equation 4A.16).
Estimating Canonical State-Space Models
You can estimate state-space models with canonical parameterization at the
command line.
To specify a canonical form for A, B, C, and D, set the SSparameterization
model property directly in the estimator syntax, as follows:
m = pem(data,n,'SSparameterization','canonical')
If you have time-domain data, the preceding command estimates a
discrete-time model.
Note When you estimate the D matrix in canonical form, you must set the nk
property. See “Choosing to Estimate D, K, and X0 Matrices” on page 3-89.
If you have continuous-time frequency-domain data, the preceding syntax
estimates an nth order continuous-time state-space model with no direct
contribution from the input to the output (D=0). To include a D matrix, set
the nk property to 0 in the estimation, as follows:
m = pem(data,n,'SSparameterization','canonical',
'nk',0)
3-92
Identifying State-Space Models
You can specify additional property-value pairs similar to the
free-parameterization case, as described in “How to Estimate
Free-Parameterization State-Space Models” on page 3-90.
For information about validating your model, see “Overview of Model
Validation and Plots” on page 8-2.
How to Estimate State-Space Models with Structured
Parameterization
• “What Is Structured Parameterization?” on page 3-93
• “Specifying the State-Space Structure” on page 3-94
• “Are Grey-Box Models Similar to State-Space Models with Structured
Parameterization?” on page 3-96
• “Example – Estimating Structured Discrete-Time State-Space Models”
on page 3-96
• “Example – Estimating Structured Continuous-Time State-Space Models”
on page 3-97
What Is Structured Parameterization?
Structured parameterization lets you exclude specific parameters from
estimation by setting these parameters to specific values. This approach is
useful when you can derive state-space matrices from physical principles and
provide initial parameter values based on physical insight. You can use this
approach to discover what happens if you fix specific parameter values or if
you free certain parameters.
In the case of structured parameterization, there are two stages to the
estimation procedure:
1 Using the idss command to specify the structure of the state-space
matrices and the initial values of the free parameters
2 Using the pem estimation command to estimate the free model parameters
3-93
3
Linear Model Identification
This approach differs from estimating models with free and canonical
parameterizations, where it is not necessary to specify initial parameter
values before the estimation. For free parameterization, there is no
structure to specify because it is assumed to be unknown. For canonical
parameterization, the structure is fixed to a specific form.
For information about validating your model, see “Overview of Model
Validation and Plots” on page 8-2.
Specifying the State-Space Structure
To specify the state-space model structure, first define the A, B, C, D, K and X0
matrices in the MATLAB workspace.
To define a discrete-time state-space structure, use the following syntax:
m = idss(A,B,C,D,K,X0,...
'Ts',T,...
'SSparameterization','structured')
where A, B, C, D, and K specify both the fixed parameter values and the
initial values for the free parameters. T is the sampling interval. Setting
SSparameterization to 'structured' flags that you want to estimate a
partial structure for this state-space model.
Similarly, to define a continuous-time state-space structure, use the following
syntax:
m = idss(A,B,C,D,K,X0,...
'Ts',0,...
'SSparameterization','structured')
In the continuous-time case, you must set the sampling interval property Ts
to zero.
After you create the nominal model structure, you must specify which
parameters to estimate and which to set to specific values. To accomplish this,
you must edit the structures of the following model properties: As, Bs, Cs, Ds,
Ks, and x0s. These structure matrices are properties of the nominal model
you constructed and have the same sizes as A, B, C, D, K, and x0, respectively.
Initially, the structure matrices contain NaN values.
3-94
Identifying State-Space Models
Specify the structure matrix values, as follows:
• Set a NaN value to flag free parameters at the corresponding locations in
A, B, C, D, K, and x0.
• Specify the values of fixed parameters at the corresponding locations in
A, B, C, D, K, and x0.
For example, suppose that you constructed a nominal state-space model m
with the following A matrix:
A = [2 0; 0 3]
Suppose you want to fix A(1,2)=A(2,1)=0. To specify the parameters you
want to fix, enter their values at the corresponding locations in the structure
matrix As:
m.As = [NaN 0; 0 NaN]
The estimation algorithm only estimates the parameters in A that have a
NaN value in As.
Finally, use pem to estimate the model, as described in “How to Estimate
State-Space Models at the Command Line” on page 3-87.
Use physical insight, whenever possible, to initialize the parameters for
the iterative search algorithm. Because it is possible that the numerical
minimization gets stuck in a local minimum, try several different initialization
values for the parameters. For random initialization, use the init command.
When the model structure contains parameters with different orders of
magnitude, try to scale the variables so that the parameters are all roughly
the same magnitude.
The iterative search computes gradients of the prediction errors with respect
to the parameters using numerical differentiation. The step size is specified
by the nuderst M-file. The default step size is equal to 10–4 times the absolute
value of a parameter or equal to 10–7, whichever is larger. To specify a
different step size, edit the nuderst M-file.
3-95
3
Linear Model Identification
Are Grey-Box Models Similar to State-Space Models with
Structured Parameterization?
Structured parameterization state-space models are similar to grey-box
modeling. However, the state-space models are simpler to estimate than
grey-box models. To learn more about grey-box models, see Chapter 5, “ODE
Parameter Estimation (Grey-Box Modeling)”.
Example – Estimating Structured Discrete-Time State-Space
Models
In this example, you estimate the unknown parameters ( θ1 , θ2 , θ3 , θ4 , θ5 )
in the following discrete-time model:
⎡ θ2 ⎤
⎡ θ4 ⎤
⎡1 θ1 ⎤
x(t + 1) = ⎢
x(t) + ⎢ ⎥ u(t) + ⎢ ⎥ e(t)
⎥
⎣0 1 ⎦
⎣ θ3 ⎦
⎣ θ5 ⎦
y(t) = [1 0] x(t) + e(t)
⎡0 ⎤
x(0) = ⎢ ⎥
⎣0 ⎦
Suppose that the nominal values of the unknown parameters ( θ1 , θ2 , θ3 , θ4 , θ5 )
are -1, 2, 3, 4, and 5, respectively.
The discrete-time state-space model structure is defined by the following
equation:
x(kT + T ) = Ax(kT ) + Bu(kT ) + Ke(kT )
y(kT ) = Cx(kT ) + Du(kT ) + e(kT )
x(0) = x0
To construct and estimate the parameters of this discrete-time state-space
model:
1 Construct the parameter matrices and initialize the parameter values
using the nominal parameter values:
A = [1,-1;0,1];
B = [2;3];
3-96
Identifying State-Space Models
C = [1,0];
D = 0;
K = [4;5];
2 Construct the state-space model object:
m = idss(A,B,C,D,K);
3 Specify the parameter values in the structure matrices that you do not
want to estimate:
m.As = [1, NaN; 0 ,1];
m.Bs = [NaN;NaN];
m.Cs = [1, 0];
m.Ds = 0;
m.Ks = [NaN;NaN];
m.x0s = [0;0];
4 Estimate the model structure:
m = pem(data,m)
where data is name of the iddata object containing time-domain or
frequency-domain data. The iterative search starts with the nominal
values in the A, B, C, D, K, and x0 matrices.
Example – Estimating Structured Continuous-Time State-Space
Models
In this example, you estimate the unknown parameters ( θ1 , θ2 , θ3 ) in the
following continuous-time model:
⎡0 1 ⎤
⎡0⎤
x (t) = ⎢
x(t) + ⎢ ⎥ u(t)
⎥
⎣0 θ1 ⎦
⎣ θ2 ⎦
⎡1 0 ⎤
y(t) = ⎢
⎥ x(t) + e(t)
⎣0 1 ⎦
⎡ θ3 ⎤
x(0) = ⎢ ⎥
⎣0⎦
3-97
3
Linear Model Identification
This equation represents an electrical motor, where y1 (t) = x1 (t) is the
angular position of the motor shaft, and y2 (t) = x2 (t) is the angular velocity.
The parameter −θ1 is the inverse time constant of the motor, and − θ2 θ is the
1
static gain from the input to the angular velocity.
The motor is at rest at t=0, but its angular position θ3 is unknown. Suppose
that the approximate nominal values of the unknown parameters are θ1 = −1
and θ2 = 0.25 . The variance of the errors in the position measurement is
0.01, and the variance in the angular velocity measurements is 0.1. For
more information about this example, see the section on state-space models
in System Identification: Theory for the User, Second Edition, by Lennart
Ljung, Prentice Hall PTR, 1999.
The continuous-time state-space model structure is defined by the following
equation:
(t)
x (t) = Fx(t) + Gu(t) + Kw
y(t) = Hx(t) + Du(t) + w(t)
x(0) = x0
To construct and estimate the parameters of this continuous-time state-space
model:
1 Construct the parameter matrices and initialize the parameter values
using the nominal parameter values:
Note The following matrices correspond to continuous-time
representation. However, to be consistent with the idss object property
name, this example uses A, B, and C instead of F, G, and H.
A
B
C
D
3-98
=
=
=
=
[0 1;0 -1];
[0;0.25];
eye(2);
[0;0];
Identifying State-Space Models
K = zeros(2,2);
x0 = [0;0];
2 Construct the continuous-time state-space model object:
m = idss(A,B,C,D,K,x0,'Ts',0);
3 Specify the parameter values in the structure matrices that you do not
want to estimate:
m.As = [0 1;0 NaN];
m.Bs = [0;NaN];
m.Cs = m.c;
m.Ds = m.d;
m.Ks = m.k;
m.x0s = [NaN;0]
m.NoiseVariance = [0.01 0; 0 0.1];
4 Estimate the model structure:
m = pem(data,m)
where data is name of the iddata object containing time-domain or
frequency-domain data. The iterative search for a minimum is initialized
by the parameters in the nominal model m. The continuous-time model is
sampled using the same sampling interval as the data.
5 To simulate this system using the sampling interval T = 0.1 for input u
and the noise realization e, use the following commands:
e = randn(300,2);
u = idinput(300);
simdat = iddata([],[u e],'Ts',0.1);
y = sim(m,simdat)
The continuous system is automatically sampled using Ts=0.1. The noise
sequence is scaled according to the matrix m.noisevar.
If you discover that the motor was not initially at rest, you can estimate x2(0)
by setting the second element of the x0s structure matrix to NaN, as follows:
m_new = pem(data,m,'x0s',[NaN;NaN])
3-99
3
Linear Model Identification
How to Estimate the State-Space Equivalent of
ARMAX and OE Models
You can estimate the equivalent of ARMAX and output-error (OE)
multiple-output models using state-space model structures. For the ARMAX
case, specify to estimate the K matrix for the state-space model. For the OE
case, set K to zero.
For more information about ARMAX and OE models, see “Identifying
Input-Output Polynomial Models” on page 3-41.
Options for Frequency-Weighing Focus
You can specify how the estimation algorithm weighs the fit at various
frequencies. This information supports the estimation procedures “How to
Estimate State-Space Models in the GUI” on page 3-84 and “How to Estimate
State-Space Models at the Command Line” on page 3-87.
In the System Identification Tool GUI. Set Focus to one of the following
options:
• Prediction — Uses the inverse of the noise model H to weigh the relative
importance of how closely to fit the data in various frequency ranges.
Corresponds to minimizing one-step-ahead prediction, which typically
favors the fit over a short time interval. Optimized for output prediction
applications.
• Simulation — Uses the input spectrum to weigh the relative importance of
the fit in a specific frequency range. Does not use the noise model to weigh
the relative importance of how closely to fit the data in various frequency
ranges. Optimized for output simulation applications.
• Stability — Estimates the best stable model. For more information about
model stability, see “Unstable Models” on page 8-69.
• Filter — Specify a custom filter to open the Estimation Focus dialog box,
where you can enter a filter, as described in “Simple Passband Filter” on
page 1-111 or “Defining a Custom Filter” on page 1-112. This prefiltering
applies only for estimating the dynamics from input to output. The
disturbance model is determined from the estimation data.
3-100
Identifying State-Space Models
At the command line. Specify the focus as an argument in the
model-estimation command using the same options as in the GUI. For
example, use this command to emphasize the fit between the 5 and 8 rad/s:
pem(data,4,'Focus',[5 8])
Options for Initial States
If you estimate state-space models using the iterative estimation algorithm
pem, you must specify how the algorithm treats initial states. This information
supports the estimation procedures “How to Estimate State-Space Models
in the GUI” on page 3-84 and “How to Estimate State-Space Models at the
Command Line” on page 3-87.
In the System Identification Tool GUI. Set Initial state to one of the
following options:
• Auto — Automatically chooses Zero, Estimate, or Backcast based on the
estimation data. If initial states have negligible effect on the prediction
errors, the initial states are set to zero to optimize algorithm performance.
• Zero — Sets all initial states to zero.
• Estimate — Treats the initial states as an unknown vector of parameters
and estimates these states from the data.
• Backcast — Estimates initial states using a backward filtering method
(least-squares fit).
At the command line. Specify the initial states as an argument in the
estimation command pem. For example, use this command to estimate a
fourth-order state-space model and set the initial states to be estimated from
the data:
m=pem(data,4,'InitialState','estimate')
For a complete list of values for the InitialState model property, see the
idss reference page.
Algorithms for Estimating State-Space Models
For linear state-space models, you can use the subspace method, called
N4SID. You can use the subspace method N4SID to get an initial model (see
3-101
3
Linear Model Identification
the n4sid reference page), and then try to refine the initial estimate using the
iterative prediction-error method PEM (see the pem reference page).
N4SID is faster than PEM, but is typically less accurate and robust, and
requires additional arguments that might be difficult to specify.
You can use the iterative prediction-error minimization (PEM) (maximum
likelihood) algorithm for all linear and nonlinear model types.
3-102
Refining Linear Parametric Models
Refining Linear Parametric Models
In this section...
“When to Refine Models” on page 3-103
“What You Specify to Refine a Model” on page 3-103
“How to Refine Linear Parametric Models in the GUI” on page 3-104
“How to Refine Linear Parametric Models at the Command Line” on page
3-105
When to Refine Models
There are two situations where you can refine estimates of linear parametric
models.
In the first situation, you have already estimated a parametric model and
wish to refine the model. However, if your model captures the essential
dynamics, it is usually not necessary to continue improving the fit—especially
when the improvement is a fraction of a percent.
In the second situation, you might have constructed a model using one of
the model constructors described in “Commands for Constructing Model
Structures” on page 2-13. In this case, you built initial parameter guesses into
the model structure and wish to refine these parameter values.
Note Because it is difficult to specify nonlinear model parameters in
advance, you typically only estimate nonlinear models.
What You Specify to Refine a Model
When you refine a model, you must provide two inputs:
• Parametric model
• Data — You can either use the same data set for refining the model as the
one you originally used to estimate the model, or you can use a different
data set.
3-103
3
Linear Model Identification
How to Refine Linear Parametric Models in the GUI
The following procedure assumes that the model you want to refine is already
in the System Identification Tool GUI. You might have estimated this model
in the current session or imported the model from the MATLAB workspace.
For information about importing models into the GUI, see “Importing Models
into the GUI” on page 12-9.
To refine your model:
1 In the System Identification Tool GUI, verify that you have the correct data
set in the Working Data area for refining your model.
If you are using a different data set than the one you used to estimate the
model, drag the correct data set into the Working Data area. For more
information about specifying estimation data, see “Specifying Estimation
and Validation Data” on page 1-29.
2 Select Estimate > Linear parametric models to open the Linear
Parametric Models dialog box, if this dialog box is not already open.
3 In the Linear Parametric Models dialog box, select By Initial Model from
the Structure list.
4 Enter the model name into the Initial model field, and press Enter.
The model name must be in the Model Board of the System Identification
Tool GUI or a variable in the MATLAB workspace.
Tip As a shortcut for specifying a model in the Model Board, you can drag
the model icon from the System Identification Tool GUI into the Initial
model field.
When you enter the model name, algorithm settings in the Linear
Parametric Models dialog box override the initial model settings.
5 Modify the algorithm settings, displayed in the Linear Parametric Models
dialog box, if necessary.
6 Click Estimate to refine the model.
3-104
Refining Linear Parametric Models
7 Validate the new model, as described in Chapter 8, “Model Analysis”.
Tip To continue refining the model using additional iterations, click
Continue iter. This action continues parameter estimation using the most
recent model.
How to Refine Linear Parametric Models at the
Command Line
If you are working at the command line, you can use pem to refine parametric
model estimates.
The general syntax for refining initial models is as follows:
m = pem(data,init_model)
pem uses the properties of the initial model unless you specify different
properties. For more information about specifying model properties directly in
the estimator, see “Specifying Model Properties for Estimation” on page 2-16.
3-105
3
Linear Model Identification
Example – Refining an Initial ARMAX Model at the Command
Line
The following example shows to estimate an initial model and try to refine
this model using pem:
load iddata8
% Split the data z8 into two parts.
% Create new data object with first hundred samples
z8a = z8(1:100);
% Create new data object with remaining samples
z8b = z8(101:end);
% Estimate ARMAX model with default Algorithm
% properties, na=4, nb=[3 2 3], nc=2, and nk=[0 0 0]
m1 = armax(z8a,[4 3 2 3 2 0 0 0]);
% Refine the initial model m1 using the data set z8b,
% and stricter algorithm settings with increased number
% of maximum iterations (MaxIter) and smaller tolerance
m2 = pem(z8b,m1,'tol',1e-5,'maxiter',50);
For more information about estimating polynomial models, see “Identifying
Input-Output Polynomial Models” on page 3-41.
3-106
Refining Linear Parametric Models
Example – Refining an ARMAX Model with Initial Parameter
Guesses at the Command Line
The following example shows how to refine models for which you have initial
parameter guesses. This example estimates an ARMAX model for the data
and requires you to initialize the A, B, and C polynomials.
In this case, you must first create a model object and set the initial parameter
values in the model properties. Next, you provide this initial model as input
to pem, which refines the initial parameter guesses using the data.
load iddata8
% Define model parameters
A = [1 -1.2 0.7];
B(1,:) = [0 1 0.5 0.1]; % first input
B(2,:) = [0 1.5 -0.5 0]; % second input
B(3,:) = [0 -0.1 0.5 -0.1]; % third input
C = [1 0 0 0 0];
Ts = 1;
% Leading zeros in B matrix indicate input delay (nk),
% which is 1 for each input channel. The trailing zeros
% in B(2,:)) make the number of coefficients equal
% for all channels.
% Create model object
init_model = idpoly(A,B,C,'Ts',1);
% Use pem to refine initial model
model = pem(z8,init_model)
% Compare the two models
compare(z8,init_model,model)
For more information about estimating polynomial models, see “Identifying
Input-Output Polynomial Models” on page 3-41.
3-107
3
Linear Model Identification
Extracting Parameter Values from Linear Models
You can extract the numerical parameter values and uncertainties of model
objects and store these values using double data format.
For example, you can extract state-space matrices for state-space models, and
extract polynomials for polynomial models. You can operate on extracted
model data as you would on any other MATLAB vectors and matrices. You
can also pass these numerical values to Control System Toolbox commands,
for example, or Simulink blocks.
If you specified to estimate model uncertainty data, this information is stored
in the property Model.CovarianceMatrix in the estimated model. The
covariance matrix is used to compute uncertainties in parameter estimates,
model output plots, Bode plots, residual plots, and pole-zero plots.
The most direct method for getting parameter values from linear models is to
use the get command. For example, get(m,'A') displays the A polynomial
coefficients from model m. Alternatively, you can use dot notation to access
the model properties, as follows: m.A.
The following table summarizes commands for extracting numerical data
from models. All of these commands have the following syntax form:
[G,dG] = command(model)
where G stores model parameters and dG stores standard deviation of
parameters or covariance.
Commands for Extracting Numerical Model Data
3-108
Command
Description
arxdata
Extracts ARX
parameters from
multiple-output idarx
or single-output idpoly
objects that represent
ARX models.
Syntax
[A,B,dA,dB] = arxdata(m)
Extracting Parameter Values from Linear Models
Commands for Extracting Numerical Model Data (Continued)
Command
Description
freqresp
Extracts
frequency-response
data from any idmodel
or idfrd object.
polydata
ssdata
tfdata
zpkdata
Extracts polynomials
from any single-output
idmodel object.
Extracts state-space
matrices from any
idmodel object.
Syntax
[H,w,CovH] = freqresp(m)
[A,B,C,D,F,dA,dB,dC,dD,dF] = ...
polydata(m)
[A,B,C,D,K,X0,...
dA,dB,dC,dD,dK,dX0] = ...
ssdata(Model)
Extracts numerator
and denominator
polynomials from any
idmodel object.
[Num,Den,dNum,dDen] = ...
tfdata(Model)
Extracts zeros, poles,
and transfer function
gains from any idmodel
object.
[Z,P,K,covZ,covP,covK] = ...
zpkdata(m)
3-109
3
Linear Model Identification
Extracting Dynamic Model and Noise Model Separately
You can extract the numerical data associated with a dynamic model and
the noise model separately.
For linear models, the general symbolic model description is given by:
y = Gu + He
G is an operator that takes the measured inputs u to the outputs and captures
the system dynamics. H is an operator that describes the properties of the
additive output disturbance and takes the hypothetical (unmeasured) noise
source inputs e to the outputs, also called the noise model. When you estimate
a noise model, the toolbox includes one noise channel e at the input for each
output in your system.
The following table summarizes the results of ssdata, tfdata, and zpkdata
commands for extracting the numerical values of the dynamic model and
noise model separately. fcn represents ssdata, tfdata, and zpkdata, and
m is a model object. L represents the covariance matrix e, as defined in
“Subreferencing Measured and Noise Models” on page 3-120.
For information about subreferencing noise channels or treating noise
channels as measured input, see “Subreferencing Model Objects” on page
3-119.
Note The syntax fcn(m('noise')) is equivalent to fcn(m('n')).
Syntax for Extracting Transfer-Function Data
3-110
Command
Syntax
fcn(m)
Returns the properties of G for ny outputs and nu inputs.
fcn(m('noise'))
Returns the properties of H for ny outputs and ny inputs.
fcn(noisecnv(m))
Returns the properties of [G H] ny outputs and ny+nu
inputs.
Extracting Dynamic Model and Noise Model Separately
Syntax for Extracting Transfer-Function Data (Continued)
Command
Syntax
fcn(noisecnv(m,'Norm'))
Returns the properties of [G HL] ny outputs and ny+nu
inputs.
fcn(noisecnv(m('noise'),'Norm')) Returns the properties of HL ny outputs and ny inputs.
fcn(m)
If m is a time-series model, returns the properties of H.
fcn(noisecnv(m,'Norm'))
If m is a time-series model, returns the properties of HL.
Note The estimated covariance matrix NoiseVariance is uncertain. Thus,
the uncertainty of H differs from the uncertainty of HL.
3-111
3
Linear Model Identification
Transforming Between Discrete-Time and Continuous-Time
Representations
In this section...
“Why Transform Between Continuous and Discrete Time?” on page 3-112
“Using the c2d, d2c, and d2d Commands” on page 3-112
“Specifying Intersample Behavior” on page 3-114
“How d2c Handles Input Delays” on page 3-114
“Effects on the Noise Model” on page 3-115
Why Transform Between Continuous and Discrete
Time?
Transforming between continuous-time and discrete-time representations is
useful, for example, if you have estimated a discrete-time linear model and
require a continuous-time model instead.
d2d is useful is you want to change the sampling interval of a discrete
model. All of these operations change the sampling interval, which is called
resampling the model.
Using the c2d, d2c, and d2d Commands
You can use c2d and d2c to transform any idmodel object between
continuous-time and discrete-time representations.
The following table summarizes the commands for transforming between
continuous-time and discrete-time model representations. These commands
also transform the estimated model uncertainty, which corresponds to the
estimated covariance matrix of the parameters. For detailed information
about these commands, see the corresponding reference page.
3-112
Transforming Between Discrete-Time and Continuous-Time Representations
Note c2d and d2d correctly approximate the transformation of the noise
model when the sampling interval T is small compared to the bandwidth
of the noise.
Command
Description
Usage Example
c2d
Converts
continuous-time
models to discrete-time
models.
To transform a continuous-time
model mod_c to a discrete-time
form, use the following
command:
mod_d = c2d(mod_c,T)
where T is the sampling interval
of the discrete-time model.
d2c
Converts parametric
discrete-time models
to continuous-time
models.
To transform a discrete-time
model mod_d to a
continuous-time form, use
the following command:
mod_c = d2c(mod_d)
d2d
Resample a linear
discrete-time
model and produce
an equivalent
discrete-time model
with a new sampling
interval.
You can use the
resampled model to
simulate or predict
output with a specified
time interval.
To resample a discrete-time
model mod_d1 to a discrete-time
form with a new sampling
interval Ts, use the following
command:
mod_d2 = d2d(mod_d1,Ts)
3-113
3
Linear Model Identification
The following commands compare estimated model m and its continuous-time
counterpart mc on a Bode plot:
% Estimate discrete-time ARMAX model
% from the data
m = armax(data,[2 3 1 2]);
% Convert to continuous-time form
mc = d2c(m);
% Plot bode plot for both models
bode(m,mc)
Specifying Intersample Behavior
A sampled signal is characterized only by its values at the sampling instants.
However, when you apply a continuous-time input to a continuous-time
system, the output values at the sampling instants depend on the inputs at
the sampling instants and on the inputs between these points. Thus, the
InterSample data property describes how the algorithms should handle the
input between samples. For example, you can specify the behavior between
the samples to be piece-wise constant (zero-order hold, zoh) or linearly
interpolated between the samples (first order hold, foh). The transformation
formulas for c2d and d2c are affected by the intersample behavior of the input.
By default, c2d and d2c use the intersample behavior you assigned to the
estimation data. To override this setting during transformation, add an extra
argument in the syntax. For example:
% Set first-order hold intersample behavior
mod_d = c2d(mod_c,T,'foh')
How d2c Handles Input Delays
The discrete-to-continuous-time conversion d2c properly handles any
input delays in the discrete-time model, and stores this information in the
continuous-time model. An input delay is the delay in the response of the
output to the input signal.
The relationship between discrete-time and continuous-time delays depends
on the input intersample behavior. For example, a continuous-time system
without a delay shows a delay when sampled with a zero-order-hold input.
3-114
Transforming Between Discrete-Time and Continuous-Time Representations
A delay in the discrete-time model that corresponds to an actual delay in the
continuous-time model is stored in the in the InputDelay property of the
resulting continuous-time model. Typically, this InputDelay is (nk-1)/Ts,
where nk is the delay of the discrete-time system and Ts is the sampling
interval.
Note Unlike for discrete-time models, the nk property of continuous-time
model is only used to flag when immediate response to step changes is present;
nk is not used to store input delays greater than or equal to 1. When nk(i)=0,
then there is an immediate response to a step change in the input ith. When
nk(i)=1, then there is no immediate response to the input.
Effects on the Noise Model
c2d, d2c, and d2d change the sampling interval of both the dynamic model and
the noise model. Resampling a model affects the variance of its noise model.
A parametric noise model is a time-series model with the following
mathematical description:
y(t) = H (q) e(t)
Ee2 = λ
The noise spectrum is computed by the following discrete-time equation:
(
Φ v (ω) = λT H eiωT
)
2
where λ is the variance of the white noise e(t), and λT represents the spectral
density of e(t). Resampling the noise model preserves the spectral density λ T
. The spectral density λ T is invariant up to the Nyquist frequency. For more
information about spectrum normalization, see “Understanding Spectrum
Normalization” on page 3-11.
d2d resampling of the noise model affects simulations with noise using
sim. If you resample a model to a faster sampling rate, simulating this
model results in higher noise level. This higher noise level results from the
3-115
3
Linear Model Identification
underlying continuous-time model being subject to continuous-time white
noise disturbances, which have infinite, instantaneous variance. In this
case, the underlying continuous-time model is the unique representation for
discrete-time models. To maintain the same level of noise after interpolating
the noise signal, scale the noise spectrum by TNew T , where Tnew is the new
Old
sampling interval and Told is the original sampling interval. before applying
sim.
c2d and d2c transformations produce warnings when the continuous-time
disturbance model does not have the required white-noise component.
These warnings occur because the underlying state-space model, which
is formed and used by these transformations, is ill-defined. In this case,
modify the C-polynomial such that the degree of the monic C-polynomial
in continuous-time equals the sum of the degrees of the monic A- and
D-polynomials in continuous-time. For example:
length(C)-1 = (length(A)-1)+(length(D)-1)
3-116
Transforming Between Linear Model Representations
Transforming Between Linear Model Representations
You can transform linear models between state-space and polynomial forms.
You can also transform between frequency-response, state-space, and
polynomial forms.
If you used the System Identification Tool GUI to estimate models, you must
export the models to the MATLAB workspace before converting models.
For detailed information about each command in the following table, see the
corresponding reference page.
Commands for Transforming Model Representations
Command
Model Type to Convert
Usage Example
idfrd
Converts any single- or
multiple-output idmodel
object to idfrd model.
If you have the Control
System Toolbox product, this
command converts any LTI
object.
To get frequency response of m at default
frequencies, use the following command:
m_f = idfrd(m)
To get frequency response at specific
frequencies, use the following command:
m_f = idfrd(m,f)
To get frequency response for a submodel
from input 2 to output 3, use the
following command:
m_f = idfrd(m(2,3))
3-117
3
Linear Model Identification
Commands for Transforming Model Representations (Continued)
Command
Model Type to Convert
Usage Example
idpoly
Converts single-output
idmodel object to ARMAX
representation.
If you have the Control
System Toolbox product,
this command converts any
single-output LTI object
except frd.
To get an ARMAX model from state-space
model m_ss, use the following command:
Converts any single- or
multiple-output idmodel
object to state-space
representation.
If you have the Control
System Toolbox product, this
command converts any LTI
object except frd.
To get a state-space model from an ARX
model m_arx, use the following command:
idss
m_p = idpoly(m_ss)
m_ss = idss(m_arx)
Note The idss conversion produces warnings when the continuous-time
disturbance model does not have the required white-noise component.
These warnings occur because the underlying state-space model, which
is formed and used by these transformations, is ill defined. In this case,
modify the C-polynomial such that the degree of the monic C-polynomial
in continuous-time equals the sum of the degrees of the monic A- and
D-polynomials in continuous-time. For example:
length(C)-1 = (length(A)-1)+(length(D)-1)
3-118
Subreferencing Model Objects
Subreferencing Model Objects
In this section...
“What Is Subreferencing?” on page 3-119
“Limitation on Supported Models” on page 3-119
“Subreferencing Specific Measured Channels” on page 3-119
“Subreferencing Measured and Noise Models” on page 3-120
“Treating Noise Channels as Measured Inputs” on page 3-122
What Is Subreferencing?
You can use subreferencing to create models with subsets of inputs and
outputs from existing multivariable models. Subreferencing is also useful
when you want to generate model plots for only certain channels, such as
when you are exploring multiple-output models for input channels that have
minimal effect on the output.
The toolbox supports subreferencing operations for idarx, idgrey, idpoly,
idproc, idss, and idfrd model objects.
In addition to subreferencing the model for specific combinations of measured
inputs and output, you can subreference dynamic and noise models
individually.
Limitation on Supported Models
Subreferencing nonlinear models is not supported.
Subreferencing Specific Measured Channels
Use the following general syntax to subreference specific input and output
channels in models:
model(outputs,inputs)
In this syntax, outputs and inputs specify channel indexes or channel names.
3-119
3
Linear Model Identification
To select all output or all input channels, use a colon (:). To select no
channels, specify an empty matrix ([]). If you need to reference several
channel names, use a cell array of strings.
For example, to create a new model m2 from m from inputs 1 ('power') and
4 ('speed') to output number 3 ('position'), use either of the following
equivalent commands:
m2 = m('position',{'power','speed'})
or
m2 = m(3,[1 4])
For a single-output model, you can use the following syntax to subreference
specific input channels without ambiguity:
m3 = m(inputs)
Similarly, for a single-input model, you can use the following syntax to
subreference specific output channels:
m4 = m(outputs)
Subreferencing Measured and Noise Models
For linear models, the general symbolic model description is given by:
y = Gu + He
G is an operator that takes the measured inputs u to the outputs and captures
the system dynamics.
H is an operator that describes the properties of the additive output
disturbance and takes the hypothetical (unmeasured) noise source inputs to
the outputs. H represents the noise model. When you specify to estimate a
noise model, the resulting model include one noise channel e at the input for
each output in your system.
3-120
Subreferencing Model Objects
Thus, linear, parametric models represent input-output relationships for two
kinds of input channels: measured inputs and (unmeasured) noise inputs. For
example, consider the ARX model given by one of the following equations:
A(q) y(t) = B(q)u ( t − nk ) + e(t)
or
y(t) =
B(q)
1
u(t) +
e(t)
A(q)
A(q)
In this case, the dynamic model is the relationship between the measured
input u and output y, G = B( q) A( q) . The noise model is the contribution of the
input noise e to the output y, given by H = 1 A( q) .
Suppose that the model m contains both a dynamic model G and a noise model
H. To create a new model by subreferencing G due to measured inputs, use
the following syntax:
m_G = m('measured')
Tip Alternatively, you can use the following shorthand syntax: m_G = m('m')
3-121
3
Linear Model Identification
To create a new model by subreferencing H due to unmeasured inputs, use
the following syntax:
m_H = m('noise')
Tip Alternatively, you can use the following shorthand syntax: m_H = m('n')
This operation creates a time-series model from m by ignoring the measured
input.
The covariance matrix of e is given by the idmodel property NoiseVariance,
which is the matrix Λ :
Λ = LLT
The covariance matrix of e is related to v, as follows:
e = Lv
where v is white noise with an identity covariance matrix representing
independent noise sources with unit variances.
Treating Noise Channels as Measured Inputs
To study noise contributions in more detail, it might be useful to convert the
noise channels to measured channels using noisecnv:
m_GH = noisecnv(m)
This operation creates a model m_GH that represents both measured inputs u
and noise inputs e, treating both sources as measured signals. m_GH is a model
from u and e to y, describing the transfer functions G and H.
3-122
Subreferencing Model Objects
Converting noise channels to measured inputs loses information about
the variance of the innovations e. For example, step response due to the
noise channels does not take into consideration the magnitude of the noise
contributions. To include this variance information, normalize e such that v
becomes white noise with an identity covariance matrix, where
e = Lv
To normalize e, use the following command:
m_GH = noisecnv(m,'Norm')
This command creates a model where u and v are treated as measured
signals, as follows:
y(t) = Gu(t) + HLv = [ G
⎡u ⎤
HL] ⎢ ⎥
⎣v⎦
For example, the scaling by L causes the step responses from v to y to reflect
the size of the disturbance influence.
The converted noise sources are named in a way that relates the noise channel
to the corresponding output. Unnormalized noise sources e are assigned
names such as 'e@y1', 'e@y2', ..., 'e@yn', where 'e@yn' refers to the noise
input associated with the output yn. Similarly, normalized noise sources v,
are named 'v@y1', 'v@y2', ..., 'v@yn'.
Note When you plot models in the GUI that include noise sources, you
can select to view the response of the noise model corresponding to specific
outputs. For more information, see “Selecting Measured and Noise Channels
in Plots” on page 12-18.
3-123
3
Linear Model Identification
Concatenating Model Objects
In this section...
“About Concatenating Models” on page 3-124
“Limitation on Supported Models” on page 3-124
“Horizontal Concatenation of Model Objects” on page 3-125
“Vertical Concatenation of Model Objects” on page 3-125
“Concatenating Noise Spectral Data of idfrd Objects” on page 3-126
“See Also” on page 3-127
About Concatenating Models
You can perform horizontal and vertical concatenation of linear model objects
to grow the number of inputs or outputs in the model.
When you concatenate parametric models, such as idarx, idgrey, idpoly,
idproc, and idss model objects, the resulting model combines the parameters
of the individual models.
You can also concatenate nonparametric models, which contain the estimated
impulse-response (idarx object) and frequency-response (idfrd object) of a
system.
In case of idfrd models, concatenation combines information in the
ResponseData properties of the individual model objects. ResponseData is
an ny-by-nu-by-nf array that stores the response of the system, where ny
is the number of output channels, nu is the number of input channels, and
nf is the number of frequency values. The (j,i,:) vector of the resulting
response data represents the frequency response from the ith input to the
jth output at all frequencies.
Limitation on Supported Models
Concatenation is supported for linear models only.
3-124
Concatenating Model Objects
Horizontal Concatenation of Model Objects
Horizontal concatenation of model objects requires that they have the same
outputs. If the output channel names are different and their dimensions are
the same, the concatenation operation uses the names of output channels in
the first model object you listed. Input channels must have unique names.
The following syntax creates a new model object m that contains the horizontal
concatenation of m1,m2,...,mN:
m = [m1,m2,...,mN]
m takes all of the inputs of m1,m2,...,mN to the same outputs as in the
original models. The following diagram is a graphical representation of
horizontal concatenation of the models.
u1
u2
Combined
Inputs
Model 1
u1
u2
u3
y1
y2
u3
Horizonal Concatenation
of Model 1 and Model 2
y1
Model 2
y1
y2
y2
Same
Outputs
Note Horizontal concatenation of idarx objects creates an idss object.
Vertical Concatenation of Model Objects
Vertical concatenation combines output channels of specified models. Vertical
concatenation of model objects requires that they have the same inputs
and frequency vectors. If the input channel names are different and their
dimensions are the same, the concatenation operation uses the names of
input channels in the first model object you listed. Output channels must
have unique names.
3-125
3
Linear Model Identification
Note You cannot concatenate the single-output idproc and idpoly model
objects.
The following syntax creates a new model object m that contains the vertical
concatenation of m1,m2,...,mN:
m = [m1;m2;... ;mN]
m takes the same inputs in the original models to all of the output of
m1,m2,...,mN. The following diagram is a graphical representation of vertical
concatenation of frequency-response data.
u1
u2
Same
Inputs
Model 1
u1
u2
y1
u1
y2
u2
Vertical Concatenation
of Model 1 and Model 2
Model 2
y1
y2
y3
y3
Combined
Outputs
Concatenating Noise Spectral Data of idfrd Objects
When the idfrd objects contain the frequency-response data you measured
or constructed manually, the concatenation operation combines only the
ResponseData properties. Because noise spectral data does not exist (unless
you also entered it manually), SpectralData is empty in both the individual
idfrd objects and the concatenated idfrd object.
However, when the idfrd objects are spectral models that you estimated, the
SpectralData property is not empty and contains the power spectra and
cross spectra of the output noise in the system. For each output channel, this
toolbox estimates one noise channel to explain the difference between the
output of the model and the measured output.
3-126
Concatenating Model Objects
When the SpectralData property of individual idfrd objects is not empty,
horizontal and vertical concatenation handle SpectralData, as follows.
In case of horizontal concatenation, there is no meaningful way to combine the
SpectralData of individual idfrd objects, and the resulting SpectralData
property is empty. An empty property results because each idfrd object has
its own set of noise channels, where the number of noise channels equals the
number of outputs. When the resulting idfrd object contains the same output
channels as each of the individual idfrd objects, it cannot accommodate the
noise data from all the idfrd objects.
In case of vertical concatenation, this toolbox concatenates individual noise
models diagonally. The following shows that m.SpectrumData is a block
diagonal matrix of the power spectra and cross spectra of the output noise in
the system:
⎛ m1.s
0 ⎞⎟
⎜
m.s = ⎜
⎟
⎜⎜
⎟
mN .s ⎟⎠
⎝ 0
s in m.s is the abbreviation for the SpectrumData property name.
See Also
If you have the Control System Toolbox product, see “Combining Model
Objects” on page 10-6 about additional functionality for combining models.
3-127
3
Linear Model Identification
Merging Model Objects
You can merge models of the same structure to obtain a single model with
parameters that are statistically weighed means of the parameters of the
individual models. When computing the merged model, the covariance
matrices of the individual models determine the weights of the parameters.
You can perform the merge operation for the idarx, idgrey, idpoly, idproc,
and idss model objects.
Note Each merge operation merges the same type of model object.
Merging models is an alternative to merging data sets into a single
multiexperiment data set, and then estimating a model for the merged data.
Whereas merging data sets assumes that the signal-to-noise ratios are about
the same in the two experiments, merging models allows greater variations
in model uncertainty, which might result from greater disturbances in an
experiment.
When the experimental conditions are about the same, merge the data
instead of models. This approach is more efficient and typically involves
better-conditioned calculations. For more information about merging data
sets into a multiexperiment data set, see “Creating Multiexperiment Data at
the Command Line” on page 1-53.
For more information about merging models, see the merge reference page.
3-128
4
Nonlinear Black-Box Model
Identification
• “Supported Data for Estimating Nonlinear Black-Box Models” on page 4-2
• “Supported Nonlinear Black-Box Models” on page 4-3
• “Identifying Nonlinear ARX Models” on page 4-4
• “Identifying Hammerstein-Wiener Models” on page 4-15
• “Supported Nonlinearity Estimators” on page 4-25
• “Refining Nonlinear Black-Box Models” on page 4-28
• “Extracting Parameter Values from Nonlinear Black-Box Models” on page
4-30
• “Next Steps After Estimating Nonlinear Black-Box Models” on page 4-32
• “Computing Linear Approximations of Nonlinear Black-Box Models” on
page 4-33
4
Nonlinear Black-Box Model Identification
Supported Data for Estimating Nonlinear Black-Box
Models
You can estimate discrete-time black-box models for data with the following
characteristics:
• Time-domain input-output or time-series data.
Note Time series are supported for nonlinear ARX models only.
• Single-output or multiple-output data.
Before you begin estimating models, import your data into the MATLAB
software and represent the data in either of the following ways:
• In the System Identification Tool GUI. Import the data into the GUI,
as described in “Representing Data in the GUI” on page 1-13.
• At the command line. Represent your data as an iddata or idfrd object.
To examine the data features, plot the data on a time plot or an estimated
frequency-response plot. You can preprocess your data by interpolating
missing values, filtering to emphasize a specific frequency range, or
resampling using a different time interval. For more information about
available date plots and data-preprocessing operations, see Chapter 1, “Data
Processing”.
Caution For nonlinear modeling, do not remove offsets and linear trends
from the measured signals.
4-2
Supported Nonlinear Black-Box Models
Supported Nonlinear Black-Box Models
You can estimate the following types of nonlinear black-box models:
• Nonlinear ARX models
• Hammerstein-Wiener models
You can estimate these models both in the System Identification Tool GUI
and at the command line.
For an introduction, see “Tutorial – Identifying Nonlinear Black-Box Models
Using the GUI” in the System Identification Toolbox Getting Started Guide.
4-3
4
Nonlinear Black-Box Model Identification
Identifying Nonlinear ARX Models
In this section...
“Supported Data for Nonlinear ARX Models” on page 4-4
“Definition of the Nonlinear ARX Model” on page 4-4
“Using Regressors” on page 4-6
“Nonlinearity Estimators for Nonlinear ARX Models” on page 4-9
“How to Estimate Nonlinear ARX Models in the GUI” on page 4-10
“How to Estimate Nonlinear ARX Models at the Command Line” on page
4-11
Supported Data for Nonlinear ARX Models
You can estimate discrete-time nonlinear ARX models from data with the
following characteristics:
• Time-domain input-output data or time-series data
• Single-output or multiple-output data
For more information about representing your data for system identification,
see Chapter 1, “Data Processing”.
Definition of the Nonlinear ARX Model
Nonlinear ARX models describe nonlinear structures using a parallel
combination of nonlinear and linear blocks. The nonlinear and linear
functions are expressed in terms of variables called regressors.
The System Identification Toolbox product computes regressors by performing
transformations of the measured input u(t) and output y(t) signals based
on the model order you specify. For example, regressors can be delayed
inputs and outputs, such as u(t-1) and y(t-3). Regressors can also be nonlinear
functions of inputs and outputs, such as tan(u(t-1)) or u(t-1)y(t-3). You can
either use default regressors, or specify your own custom functions of input
and output signals.
4-4
Identifying Nonlinear ARX Models
The predicted output yˆ (t) of a nonlinear model at time t is given by the
following general equation:
yˆ (t) = F ( x(t))
where x(t) represents the regressors. F is a nonlinear regression function,
which is approximated by a nonlinearity estimator, which might be a binary
partition tree, a neural network, or a network based on wavelets. The
following figure shows how the predicted output of the model is formed from
the inputs and outputs.
Inputs
u(t)
Regressors
u1(t-1),u2(t-3),y1(t-1), ...
Outputs
y(t)
Nonlinear
Function
Linear
Function
Predicted
Outputs
The function F can include both linear and nonlinear functions of x(t), as
shown in the previous diagram. You can specify which regressors to use a
inputs to the nonlinear block.
The following equation provides a general description of F:
F ( x) =
d
∑ α k κ ( βk ( x − γ k ) )
k=1
where κ is the unit nonlinear function, d is the number of nonlinearity units,
and α k , βk , and γ k are the parameters of the nonlinearity estimator.
You choose a nonlinear structure that independently combines linear and
nonlinear regressors and the structure of the nonlinearity itself, such as
treepartition or wavenet. The System Identification Toolbox product uses
input/output data to find the linear and nonlinear mappings that give the best
predicted outputs of the nonlinear model.
4-5
4
Nonlinear Black-Box Model Identification
For more information about regressors, see “Using Regressors” on page 4-6.
For a list of nonlinearity estimators supported by nonlinear ARX models, see
“Nonlinearity Estimators for Nonlinear ARX Models” on page 4-9.
Using Regressors
You can use the following types of regressors for nonlinear ARX models:
• Standard regressors — Past input u(t) and output signals y(t), computed
automatically as delay transformations for specified model orders.
• Custom regressors — Products, powers, and other MATLAB expressions
of input and output variables that you specify.
Specifying Model Order and Delays
You must specify the following model orders for computing standard
regressors:
• na — The number of past output terms used to predict the current output.
• nb — The number of past input terms used to predict the current output.
• nk — The delay from input to the output in terms of the number of samples.
This value defines the least delayed input regressor.
The meaning of na and nb is similar to the linear-ARX model parameters in
the sense that na represents the number of output terms and nb represents the
number of input terms. nk represents the minimum input delay from an input
to an output. For more information about the linear ARX model structure, see
“What Are Black-Box Polynomial Models?” on page 3-41.
Note The total number of regressors in the model must be greater than zero.
If you only need to use custom regressors, set na=nb=nk=0 to omit creating
standard regressors.
4-6
Identifying Nonlinear ARX Models
Example – Relationship Between Regressors, Model Orders,
and Delays
This example describes how the model orders and delays you specify relate
to computing the regressors.
Suppose that you specify a nonlinear ARX model with a minimum of a
two-sample input delay and the number of input terms is nb=2. The toolbox
computes the following standard regressors from the input signal:
• u(t-2)
• u(t-3)
If you specify that the number of output terms is na=4, the toolbox computes
the following standard regressors from the output signals:
• y(t-1)
• y(t-2)
• y(t-3)
• y(t-4)
Note The minimum output delay is fixed at 1 because the prediction of
an output requires the delayed versions of itself and all other outputs.
To use past outputs for predicting the current value, you must include
past output samples, starting with the most recent at t=-1. In the case
of decoupled outputs, the delay for output signals corresponding to the
prediction horizon. To use greater output delay values (for example, 2), you
must explicitly exclude the regressors that correspond to a delay of 1 (such
as y_i(t-1)) for the nonlinear block during estimation by configuring the
NonlinearRegressors model property. However, all regressors are used in
the linear block if the linear block is included in your model.
If you have physical insight that your current output depends on specific
delayed inputs and outputs, select the appropriate model orders to compute
the required regressors.
4-7
4
Nonlinear Black-Box Model Identification
Using Custom Regressors
In general, custom regressors are nonlinear functions of delayed input and
output data samples. You can specify custom regressors, such as tan(u(t-1)),
u(t-1)2, or u(t-1)*y(t-3).
In the System Identification Tool GUI. You can create custom regressors
in the Model Regressors dialog box. For more information, see “How to
Estimate Nonlinear ARX Models in the GUI” on page 4-10.
At the command line. Use the customreg or polyreg command to construct
custom regressors in terms of input-output variables. For more information,
see the corresponding reference page.
The linear block includes all standard and custom regressors. However, you
can include specific standard and custom regressors in your nonlinear block to
fine-tune the model structure.
To get a linear-in-the-parameters ARX model structure, you can exclude
the nonlinear block from the model structure completely. When using
only a linear block with custom regressors, you can create the simplest
types of nonlinear models. In this case, the custom regressors capture
the nonlinearities and the estimation routine computes the weights of the
standard and custom regressors in the linear block to predict the output.
4-8
Identifying Nonlinear ARX Models
Nonlinearity Estimators for Nonlinear ARX Models
Nonlinear ARX models support the following nonlinearity estimators:
• Sigmoid Network
• Tree Partition
• Wavelet Network
• Custom Network
• Linear (indicates absence of nonlinearity estimator)
• Neural Network
Note You must have the Neural Network Toolbox™ product to use
the Neural Network nonlinearity estimator. If your model has only one
regressor, you can also use the Saturation, Dead Zone, One-Dimensional
Polynomial, and Piecewise Linear nonlinearity estimators, as listed in
“Nonlinearity Estimators for Hammerstein-Wiener Models” on page 4-17.
For a summary of all nonlinearity estimators and links to the corresponding
reference pages, see “Supported Nonlinearity Estimators” on page 4-25.
You can exclude the nonlinearity function from the model structure. In this
case, the model includes all standard and custom regressors and is linear in
the parameters.
In the System Identification Tool GUI. You can omit the nonlinear block
by selecting None for the Nonlinearity.
At the command line. You can omit the nonlinear block by setting the
Nonlinearity property value to 'Linear'. For more information, see the
nlarx and idnlarx reference pages.
For a description of each nonlinearity estimator, see “Supported Nonlinearity
Estimators” on page 4-25.
4-9
4
Nonlinear Black-Box Model Identification
How to Estimate Nonlinear ARX Models in the GUI
You must have already imported your data into the System Identification
Tool GUI. For more information about preparing your data, see Chapter 1,
“Data Processing”.
To estimate a nonlinear ARX model in the System Identification Tool GUI:
1 In the System Identification Tool GUI, select Estimate > Nonlinear
models to open the Nonlinear Models dialog box. The Model Type tab
is selected.
2 In the Model Structure list, select Nonlinear ARX.
This action updates the options in the Nonlinear Models dialog box to
correspond to this model structure. For information about this model
structure, see “Definition of the Nonlinear ARX Model” on page 4-4.
3 In the Model name field, edit the name of the model, or keep the default
name. The name of the model should be unique to all nonlinear ARX
models in the System Identification Tool GUI.
4 (Optional) If you want to try refining a previously estimated model, select
the name of this model in the Initial model list.
Note The model structure and algorithm properties of the initial model
populate the fields in the Nonlinear Models dialog box.
A model is available in the Initial model list under the following
conditions:
• The model exists in the System Identification Tool GUI.
• The number of model inputs and outputs matches the dimensions
of the Working Data (estimation data) you selected in the System
Identification Tool GUI.
5 Keep the default settings in the Nonlinear Models dialog box that specify
the model structure and the algorithm, or modify the following settings:
4-10
Identifying Nonlinear ARX Models
• In the Regressors tab, change the input delay of the input signals.
To gain insight into possible input delay values, click Infer Input
Delay. This action opens the Infer Input Delay dialog box.
• In the Regressors tab, change the number of terms to include in the
nonlinear block.
• In the Regressors tab, click Edit Regressors to select which regressors
are included in the nonlinear block. This action opens the Model
Regressors dialog box. You can also use this dialog box to create custom
regressors.
• In the Model Properties tab, select and configure the nonlinearity
estimator, and choose whether to include the linear block. To use all
standard and custom regressors in the linear block only, you can exclude
the nonlinear block by choosing None.
For more information about the available options, click Help in the
Nonlinear Models dialog box to open the GUI help.
6 Click Estimate to add this model to the Model Board in the System
Identification Tool GUI.
The Estimation tab displays the estimation progress and results.
7 To plot the response of this model, select the appropriate check box in
the Model Views area of the System Identification Tool GUI. If you get
an inaccurate fit, try estimating a new model with different orders or
nonlinearity estimator. For more information about validating models, see
Chapter 8, “Model Analysis”.
8 For further analysis, export the model to the MATLAB workspace by
dragging it to the To Workspace rectangle in the System Identification
Tool GUI.
How to Estimate Nonlinear ARX Models at the
Command Line
• “General nlarx Syntax” on page 4-12
• “Example – Using nlarx to Estimate Nonlinear ARX Models” on page 4-13
4-11
4
Nonlinear Black-Box Model Identification
General nlarx Syntax
You can estimate nonlinear ARX models using nlarx. The resulting models
are stored as idnlarx model objects.
Use the following general syntax to both configure and estimate nonlinear
ARX models:
m = nlarx(data,'na',na,...
'nb',nb,...
'nk',nk,...
Nonlinearity,...
'Property1',Value1,...,
'PropertyN',ValueN)
where data is the estimation data. na, nb, and nk specify the model orders
and delays. For more information about model orders, see “Specifying Model
Order and Delays” on page 4-6.
Nonlinearity specifies the nonlinearity estimator object as 'sigmoidnet',
'wavenet', 'treepartition', 'customnet', 'neuralnet', or 'linear'.
The property-value pairs specify any idnlarx model properties that configure
the estimation algorithm. You can enter all model property-value pairs and
top-level algorithm properties as a comma-separated list in nlarx.
For multiple inputs and outputs, na, nb, and nk are described in “Options for
Multiple-Input and Multiple-Output ARX Orders” on page 3-64.
You can specify different nonlinearity estimators for different output channels
by setting Nonlinearity to an object array. For example:
m = nlarx(data,[[2 1; 0 1] [2;1] [1;1]],...
[wavenet;sigmoidnet('num',7)])
To specify the same nonlinearity for all outputs, set Nonlinearity to a single
nonlinearity estimator. For example:
m = nlarx(data,[[2 1; 0 1] [2;1] [1;1]],...
sigmoidnet('num',7))
4-12
Identifying Nonlinear ARX Models
For detailed information about the nlarx and idnlarx properties and values,
see the corresponding reference page.
For more information about validating models, see Chapter 8, “Model
Analysis”.
Note You do not need to construct the model object using idnlarx before
estimation.
You can also use pem to refine parameter estimates of an existing nonlinear
ARX model, as described in “Refining Nonlinear Black-Box Models” on page
4-28.
Example – Using nlarx to Estimate Nonlinear ARX Models
This example uses nlarx to estimate a nonlinear ARX model for the two-tank
system. The data for this system is described in “Tutorial – Identifying
Nonlinear Black-Box Models Using the GUI” in the System Identification
Toolbox Getting Started Guide.
Prepare the data for estimation using the following commands:
load twotankdata
z = iddata(y, u, 0.2);
ze = z(1:1000); zv = z(1001:3000);
Estimate several models using different model orders, delays, and
nonlinearity settings:
m1
m2
m3
m4
=
=
=
=
nlarx(ze,[2
nlarx(ze,[2
nlarx(ze,[2
nlarx(ze,[2
2
2
2
2
1],'wav');
3],wavenet);
3],wavenet('num',8));
3],wavenet('num',8),...
'nlr', [1 2]);
m5 = nlarx(ze,[2 2 3],sigmoidnet('num',14),...
'nlr',[1 2]);
4-13
4
Nonlinear Black-Box Model Identification
Compare the resulting models by plotting the model outputs on top of the
measured output:
compare(zv, m1,m2,m3,m4,m5)
MATLAB software responds with the following plot.
4-14
Identifying Hammerstein-Wiener Models
Identifying Hammerstein-Wiener Models
In this section...
“Supported Data for Estimating Hammerstein-Wiener Models” on page 4-15
“Definition of the Hammerstein-Wiener Model” on page 4-15
“Nonlinearity Estimators for Hammerstein-Wiener Models” on page 4-17
“How to Estimate Hammerstein-Wiener Models in the GUI” on page 4-18
“How to Estimate Hammerstein-Wiener Models at the Command Line”
on page 4-20
Supported Data for Estimating Hammerstein-Wiener
Models
You can estimate discrete-time Hammerstein-Wiener models from data with
the following characteristics:
• Time-domain input-output data
Note Hammerstein-Wiener models do not support time-series data, which
has no input signal.
• Single-output or multiple-output data
Definition of the Hammerstein-Wiener Model
Hammerstein-Wiener models describe dynamic systems using one or two
static nonlinear blocks in series with a linear block. Only the linear block
contains dynamic elements.
The linear block is a discrete-time transfer function and the nonlinear
blocks are implemented using nonlinearity estimators, such as saturation,
wavenet, and deadzone.
4-15
4
Nonlinear Black-Box Model Identification
The input signal passes through the first nonlinear block, a linear block,
and a second nonlinear block to produce the output signal, as shown in the
following figure.
Input
u(t)
Input
Nonlinearity
Linear
Block
Output
Nonlinearity
Output
y(t)
The following general equation describes the Hammerstein-Wiener structure:
w(t) = f (u(t))
B j,i (q)
x(t) =
w(t)
F j,i (q)
y(t) = h( x(t))
which contains the following variables:
• u(t) and y(t) are the inputs and outputs for the system, respectively.
• f and h are nonlinear functions that correspond to the input and output
nonlinearities, respectively.
For multiple inputs and multiple outputs, f and h are defined independently
for each input and output channel.
• w(t) and x(t) are internal variables that define the input and output of the
linear block, respectively.
w(t) has the same dimension as u(t). x(t) has the same dimension as y(t).
• B(q) and F(q) in the linear dynamic block are linear functions, which are
similar to the polynomial in an Output-Error model, as described in “What
Are Black-Box Polynomial Models?” on page 3-41.
For ny outputs and nu inputs, the linear block is a transfer function matrix
containing entries in the following form:
B j,i (q)
F j,i (q)
where j = 1,2,...,ny and i = 1,2,...,nu.
4-16
Identifying Hammerstein-Wiener Models
If only the input nonlinearity is present, the model is called a Hammerstein
model. If only the output nonlinearity is present, the model is called a Wiener
model.
You must specify the following model orders for the linear block:
• nb—The number of zeros plus one.
• nf—The number of poles.
• nk—The delay from input to the output in terms of the number of samples.
For ny outputs and nu inputs, nb, nf, and nk are ny-by-nu matrices. You can
specify a nonlinearity for only certain inputs and outputs, and exclude the
nonlinearity for other inputs and outputs.
Nonlinearity Estimators for Hammerstein-Wiener
Models
Hammerstein-Wiener models support the following nonlinearity estimators
for estimating the parameters of its input and output nonlinear blocks:
• Dead Zone
• Piecewise Linear
• Saturation
• Sigmoid Network
• Wavelet Network
• One-Dimensional Polynomial
• Unit Gain
• Custom Network
For a summary of all nonlinearity estimators and links to the corresponding
reference pages, see “Supported Nonlinearity Estimators” on page 4-25.
You can exclude either the input nonlinearity or the output nonlinearity from
the model structure:
4-17
4
Nonlinear Black-Box Model Identification
In the System Identification Tool GUI. Exclude a nonlinearity for a
specific channel by selecting None.
At the command line. Exclude a nonlinearity for a specific channel
by specifying the unitgain value for the InputNonlinearity or
OutputNonlinearity properties. For more information about estimation
objects and their properties, see nlhw and idnlhw reference page.
For a description of each nonlinearity estimator, see “Supported Nonlinearity
Estimators” on page 4-25.
How to Estimate Hammerstein-Wiener Models in the
GUI
You must have already imported your data into the System Identification Tool
GUI, as described in Chapter 1, “Data Processing”.
To estimate a Hammerstein-Wiener model in the System Identification Tool
GUI:
1 In the System Identification Tool GUI, select Estimate > Nonlinear
models to open the Nonlinear Models dialog box. The Model Type tab is
shown.
2 In the Model Structure list, select Hammerstein-Wiener.
This action updates the options in the Nonlinear Models dialog box to
correspond to this model structure. For information about this model
structure, see “Definition of the Hammerstein-Wiener Model” on page 4-15.
3 In the Model name field, edit the name of the model, or keep the default
name. The name of the model should be unique to all Hammerstein-Wiener
models in the System Identification Tool GUI.
4-18
Identifying Hammerstein-Wiener Models
4 (Optional) If you want to try refining a previously estimated model, select
the name of this model in the Initial model list.
Note The model structure and algorithm properties of the initial model
populate the fields in the Nonlinear Models dialog box.
A model is available in the Initial model list under the following
conditions:
• The model exists in the System Identification Tool GUI.
• The number of model inputs and outputs matches the dimensions
of the Working Data (estimation data) you selected in the System
Identification Tool GUI.
5 Keep the default settings in the Nonlinear Models dialog box that specify
the model structure and the algorithm, or modify the following settings:
• In the I/O Nonlinearity tab, specify whether to include or exclude the
input and output nonlinearities. For multiple-input and multiple-output
systems, you can choose to apply nonlinearities only to specific input
and output channels.
• In the I/O Nonlinearity tab, change the input and output nonlinearity
types and configure the nonlinearity settings.
Tip If you are not sure about which nonlinearity to try, start by using
the Piecewise Linear nonlinearity estimator.
• In the Linear Block tab, specify the model orders and delays. To gain
insight into possible delays, click Infer Input Delay.
For more information about the available options, click Help in the
Nonlinear Models dialog box to open the GUI help.
6 Click Estimate to add this model to the Model Board in the System
Identification Tool GUI.
The Estimation tab displays the estimation progress and results.
4-19
4
Nonlinear Black-Box Model Identification
7 To plot the response of this model, select the appropriate check box in
the Model Views area of the System Identification Tool GUI. For more
information about working with plots and validating models, see Chapter
8, “Model Analysis”.
If you get an inaccurate fit, try estimating a new model with different orders
or nonlinearity estimator.
You can export the model to the MATLAB workspace for further analysis
by dragging it to the To Workspace rectangle in the System Identification
Tool GUI.
How to Estimate Hammerstein-Wiener Models at the
Command Line
• “General nlhw Syntax” on page 4-20
• “Improving Estimation Results Using Initial States” on page 4-22
• “Example – Using nlhw to Estimate Hammerstein-Wiener Models” on page
4-23
General nlhw Syntax
You can estimate Hammerstein-Wiener models using the nlhw command. The
resulting models are stored as idnlhw model objects.
Use the following general syntax to both configure and estimate
Hammerstein-Wiener models:
m = nlhw(data,'nb',nb,...
'nf',nf,...
'nk',nk,...
InputNonlinearity,..
OutputNonlinearity,...
'Property1',Value1,...,
'PropertyN',ValueN)
where data is the estimation data. nb, nf, and nk specify the orders and delays
of the linear model, which is similar to an Output-Error (OE) model. For more
4-20
Identifying Hammerstein-Wiener Models
information about model orders, see “Definition of the Hammerstein-Wiener
Model” on page 4-15.
InputNonlinearity specifies the input static nonlinearity estimator object
as 'pwlinear', 'deadzone', 'saturation', 'sigmoidnet', 'wavenet',
'customnet', 'unitgain', or 'poly1d'. Similarly, OutputNonlinearity
specifies the output static nonlinearity estimator object.
The property-value pairs specify any idnlhw model properties that configure
the estimation algorithm. You can enter all model property-value pairs
and top-level algorithm properties as a comma-separated list in nlhw. For
example, you can control the iterative search for a best fit using the following
properties:
m = nlhw(data,'nb',nb,...
'nf',nf,...
'nk',nk,...
InputNonlinearity,...
OutputNonlinearity,...
'MaxIter',N,...
'Tolerance',tol,...
'LimitError',lim,
'Display','on')
Note You do not need to construct the model object using idnlhw before
estimation. nlhw both constructs and estimates the model.
For nu inputs and ny outputs, na, nb, and nk are ny-by-nu matrices whose
i-jth entry specifies the order and delay of the transfer function from the
jth input to the ith output.
4-21
4
Nonlinear Black-Box Model Identification
You can specify different nonlinearity estimators for different output channels
by setting InputNonlinearity or OutputNonlinearity to an object array.
For example, the following code estimates a two-input Hammerstein-Wiener
model, where sigmoidnet and pwlinear are the two input nonlinearities
and there is no output nonlinearity:
m = nlhw(data,[nb,nf,nk],...
[sigmoidnet;pwlinear],...
[])
Alternatively, you can construct the model first and then estimate models
parameters using the following commands:
m0 = idnlhw([nb,nf,nk],[sigmoidnet;pwlinear],[]);
m = nlhw(data,m0);
For detailed information about nlhw and idnlhw, see the corresponding
reference pages.
For more information about validating your models, see Chapter 8, “Model
Analysis”.
You can also use pem to refine parameter estimates of an existing
Hammerstein-Wiener model, as described in “Refining Nonlinear Black-Box
Models” on page 4-28.
Improving Estimation Results Using Initial States
If your estimated Hammerstein-Wiener model provides a poor fit to measured
data, you can estimate the model again using initial states estimated from
the data. By default, the initial states corresponding to the linear block of the
Hammerstein-Wiener model are zero.
To specify estimating initial states during model estimation, you can use
the following syntax:
m0 = idnlhw([nb,nf,nk],[sigmoidnet;pwlinear],[]);
m = nlhw(data,m0,'InitialState','e');
4-22
Identifying Hammerstein-Wiener Models
Example – Using nlhw to Estimate Hammerstein-Wiener
Models
This example uses nlhw to estimate a Hammerstein-Wiener model for
the two-tank system. The data for this system is described in “Tutorial –
Identifying Nonlinear Black-Box Models Using the GUI” in the System
Identification Toolbox Getting Started Guide.
Prepare the data for estimation using the following commands:
load twotankdata
z = iddata(y, u, 0.2);
ze = z(1:1000); zv = z(1001:3000);
Estimate several models using different model orders, delays, and
nonlinearity settings:
m1 = nlhw(ze,[2 3 1],'pwl','pwl');
m2 = nlhw(ze,[2 2 3],'pwl','pwl');
m3 = nlhw(ze,[2 2 3], pwlinear('num',13),...
pwlinear('num',10));
m4 = nlhw(ze,[2 2 3], sigmoidnet('num',2),...
pwlinear('num',10));
m5 = nlhw(ze,[2 2 3], 'dead','sat');
Compare the resulting models by plotting the model outputs on top of the
measured output:
compare(zv,m1,m2,m3,m4,m5)
4-23
4
Nonlinear Black-Box Model Identification
MATLAB software responds with the following plot.
4-24
Supported Nonlinearity Estimators
Supported Nonlinearity Estimators
In this section...
“Types of Nonlinearity Estimators” on page 4-25
“Creating Custom Nonlinearities” on page 4-26
Types of Nonlinearity Estimators
When configuring the nonlinear ARX and Hammerstein-Wiener models for
estimation, you must specify a mathematical structure for the nonlinear
portion of the model.
If you are working in the System Identification Tool GUI, specify the
nonlinearity type by name when you configure the nonlinear model structure.
If you are estimating or constructing a nonlinear model at the command
line instead, specify the nonlinearity as an argument in the nlarx or nlhw
estimation command.
The following table summarizes supported nonlinearities in the System
Identification Toolbox product for each type of nonlinear model. For a
description of each nonlinearity, see the references page for the corresponding
nonlinearity object.
Nonlinearity
Object Name
Supported Model Type
Supports Multiple
Inputs?
Custom Network
(user-defined)
customnet
Hammerstein-Wiener and
Nonlinear ARX
Yes
Dead Zone
deadzone
Hammerstein-Wiener
No
Neural Network
neuralnet
Nonlinear ARX
Yes
Piecewise Linear
pwlinear
Hammerstein-Wiener
No
One-Dimensional
Polynomial
poly1d
Hammerstein-Wiener
No
Saturation
saturation
Hammerstein-Wiener
No
Sigmoid Network
sigmoidnet
Hammerstein-Wiener and
Nonlinear ARX
Yes
4-25
4
Nonlinear Black-Box Model Identification
Nonlinearity
Object Name
Supported Model Type
Supports Multiple
Inputs?
Tree Partition
treepartition
Nonlinear ARX
Yes
Wavelet Network
wavenet
Hammerstein-Wiener and
Nonlinear ARX
Yes
The Neural Network nonlinearity lets you import a network object you
created using the Neural Network Toolbox commands.
The nonlinearity estimators deadzone, poly1d, pwlinear, and saturation
are optimized for estimating Hammerstein-Wiener models. However, you
can also these estimators with nonlinear ARX models that have only one
regressor. For more information about nonlinear ARX model structure, see
“Definition of the Nonlinear ARX Model” on page 4-4.
Creating Custom Nonlinearities
You can create custom nonlinearities for nonlinear ARX and
Hammerstein-Wiener models.
A custom nonlinearity uses a unit function that you define. This custom unit
function uses a weighted sum of inputs to compute a scalar output.
You can use a combination of these unit functions to approximate the
nonlinearity.
Note Hammerstein-Wiener models require that your custom nonlinearity
have one input and one output.
function [f, g, a] = gaussunit(x)
%GAUSSUNIT example of customnet unit function
%
%[f, g, a] = GAUSSUNIT(x)
%
% x: unit function variable
% f: unit function value
4-26
Supported Nonlinearity Estimators
%
%
%
%
%
%
%
%
g: df/dx
a: unit active range (g(x) is significantly
nonzero in the interval [-a a])
The unit function must be vectorized:
for a vector or matrix x, the output
arguments f and g must have the same size as x
f and g are computed element by element.
f =
exp(-x.*x);
if nargout>1
g = - 2*x .* f;
a = 0.2;
end
4-27
4
Nonlinear Black-Box Model Identification
Refining Nonlinear Black-Box Models
In this section...
“How to Refine Nonlinear Black-Box Models in the GUI” on page 4-28
“How to Refine Nonlinear Black-Box Models at the Command Line” on
page 4-29
How to Refine Nonlinear Black-Box Models in the
GUI
The following procedure assumes that the model you want to refine is already
in the System Identification Tool GUI. You might have estimated this model
in the current session or imported the model into the GUI from the MATLAB
workspace. For more information about estimating nonlinear black-box
models, see Chapter 4, “Nonlinear Black-Box Model Identification”.
To refine your model:
1 In the System Identification Tool GUI, verify that you have the correct data
set in the Working Data area for refining your model.
If you are using a different data set than the one you used to estimate the
model, drag the correct data set into the Working Data area. For more
information about specifying estimation data, see “Specifying Estimation
and Validation Data” on page 1-29.
2 Select Estimate > Nonlinear models to open the Nonlinear Models
dialog box, if this dialog box is not already open.
3 In the Nonlinear Models dialog box, select the model you want to refine
in the Initial model list.
The list includes only those models that have the selected Model
structure and the same number of inputs and outputs as the estimation
data in Working Data area.
Any settings in the Nonlinear Models dialog box related to model structure
and estimation algorithms are overridden by the selected initial model.
4-28
Refining Nonlinear Black-Box Models
4 Click Estimate to refine the model.
5 Validate the new model, as described in Chapter 8, “Model Analysis”.
Tip To continue refining the model directly from the Estimation tab, select
the Use last estimated model as initial model for the next estimation
check box, and click Estimate. This action automatically selects the most
recent model in the Initial model list in the Model Type tab.
How to Refine Nonlinear Black-Box Models at the
Command Line
If you are working at the command line, you can use pem to refine nonlinear
black-box models.
The general syntax for refining initial models is as follows:
m = pem(data,init_model)
pem uses the properties of the initial model unless you specify different
properties. For more information about specifying model properties directly in
the estimator, see “Specifying Model Properties for Estimation” on page 2-16.
4-29
4
Nonlinear Black-Box Model Identification
Extracting Parameter Values from Nonlinear Black-Box
Models
In this section...
“Nonlinear ARX Parameter Values” on page 4-30
“Hammerstein-Wiener Parameter values” on page 4-31
Nonlinear ARX Parameter Values
You can extract the numerical parameter values of a nonlinear ARX model by
accessing the properties of the idnlarx model object.
The nonlinear ARX model parameters you might want to explore include
model orders and delays, regressors, nonlinearity estimator parameters, and
initial state values. To access the list of standard or custom regressors, you
can use the getreg command. For more information, see the getreg reference
page.
You can view the parameters of the nonlinearity estimators using the
Nonlinearity property. For example:
% Load sample data.
load iddata1
% Estimate a nonlinear ARX model that includes a
% treepartition nonlinearity.
m = nlarx(z1,[2 2 1],'tree');
NL = m.Nonlinearity;
get(NL)
NL.Parameters
For more information about the treepartition nonlinearity, see the
corresponding reference page.
To access any properties of a nonlinear ARX model object, use the get
command. For more information about nonlinear ARX model properties, see
the idnlarx reference page.
4-30
Extracting Parameter Values from Nonlinear Black-Box Models
Hammerstein-Wiener Parameter values
You can extract the numerical parameter values of a Hammerstein-Wiener
model by accessing the properties of the idnlhw model object.
The Hammerstein-Wiener model parameter you might want to explore
include model orders and delays, nonlinearity estimator parameters, and
the properties of the linear model.
You can view the parameters of the nonlinearity estimators using the
InputNonlinearity and OutputNonlinearity properties. For example:
% Load sample data.
load iddata1
% Estimate a Hammerstein-Wiener model that includes a
% no input nonlinearity and a wavenet output nonlinearity.
m = nlhw(z1,[2 2 1],[],'wav');
% Assign variables to the input and output nonlinearities.
% No input nonlinearity is equivalent to a unitgain nonlienearity.
uNL = m.InputNonlinearity;
yNL = m.OutputNonlinearity;
get(NL)
% Display output nonlinearity parameters.
yNL.Parameters
For more information about the unitgain and wavenet nonlinearities, see
the corresponding reference pages.
To access any properties of a Hammerstein-Wiener model object, use the
get command. For more information about Hammerstein-Wiener model
properties, see the idnlhw reference page.
4-31
4
Nonlinear Black-Box Model Identification
Next Steps After Estimating Nonlinear Black-Box Models
After estimating nonlinear black-box models, you can perform the following
operations:
• View parameter values, standard deviations of the parameters, loss
function, and Akaike’s Final Prediction Error (FPE) Criterion at the
command line using the present command or by get the EstimationInfo
property of the model.
• Simulate the model using the sim command.
• Predict the model output using the predict command.
• Compute linear approximation of nonlinear ARX and Hammerstein-Wiener
models using linearize or linapp. linearize provides a first-order
Taylor series approximation of the system about an operation point (also
called tangent linearization). linapp computes a linear approximation of
a nonlinear model for a given input. For more information about these
commands, see the “Computing Linear Approximations of Nonlinear
Black-Box Models” on page 4-33.
• Import identified models into Simulink software for simulation. For more
information, see Chapter 11, “Using System Identification Toolbox Blocks”.
After computing a linear approximation of a nonlinear model, you can perform
linear analysis and control design on your model using Control System
Toolbox commands. For more information, see “Using Models with Control
System Toolbox Software” on page 10-2.
4-32
Computing Linear Approximations of Nonlinear Black-Box Models
Computing Linear Approximations of Nonlinear Black-Box
Models
In this section...
“Why Compute a Linearize Approximation of a Nonlinear Model?” on page
4-33
“Choosing Your Linear Approximation Approach” on page 4-33
“Linear Approximation of Nonlinear Black-Box Models for a Given Input”
on page 4-34
“Tangent Linearization of Nonlinear Black-Box Models” on page 4-35
“Computing Operating Points for Nonlinear Black-Box Models” on page 4-35
Why Compute a Linearize Approximation of a
Nonlinear Model?
Linearizing a nonlinear model is required for linear control design and
linear analysis. After you linearize your model, you can use Control System
Toolbox software to design a controller and perform linear analysis. For more
information, see “Using Models with Control System Toolbox Software” on
page 10-2.
Choosing Your Linear Approximation Approach
System Identification Toolbox software provides two approaches for computing
a linear approximation of Nonlinear ARX and Hammerstein-Wiener models.
To generate a linear approximation of a nonlinear model for a given input
signal, use the linapp command. The resulting model is only valid for
the same input you use to generate the linear approximation. For more
information, see “Linear Approximation of Nonlinear Black-Box Models for a
Given Input” on page 4-34.
If you want a tangent approximation of the nonlinear dynamics that is
accurate near the system operating point, use the linearize command. The
resulting model is a first-order Taylor series approximation for the system
about this operating point, which is defined by a constant input and model
4-33
4
Nonlinear Black-Box Model Identification
state values. For more information, see “Tangent Linearization of Nonlinear
Black-Box Models” on page 4-35.
Linear Approximation of Nonlinear Black-Box
Models for a Given Input
linapp computes the best linear approximation—in a mean-square-error
sense—of a nonlinear ARX or Hammerstein-Wiener model for a given input or
a randomly generated input.
linapp estimates the best linear model that is structurally similar to the
original nonlinear model and provides the best fit between a given input and
the corresponding simulated response of the nonlinear model.
To compute a linear approximation of a nonlinear black-box model for a given
input, you must have the following variables in the MATLAB workspace:
• Nonlinear ARX (idnlarx) or Hammerstein-Weiner (idnlhw) model
• Input signal for which you want to obtain a linear approximation, specified
as a real matrix or an iddata object
You use the specified input signal to compute a linear approximation, as
follows:
• For nonlinear ARX models, linapp estimates a linear ARX model using the
same model orders na, nb, and nk as the original model.
• For Hammerstein-Wiener models, linapp estimates a linear Output-Error
(OE) model using the same model orders nb, nf, and nk.
To compute a linear approximation of a nonlinear black-box model for a
randomly generated input, you must also have the minimum and maximum
scalar input values for generating white-noise input with a magnitude in this
rectangular range, umin and umax in the MATLAB workspace.
For more information, see the linapp reference page.
The resulting linear model is only valid for the same input signal as you the
one you used to generate the linear approximation.
4-34
Computing Linear Approximations of Nonlinear Black-Box Models
Tangent Linearization of Nonlinear Black-Box Models
linearize computes a first-order Taylor series approximation for nonlinear
system dynamics about and operating point, which is defined by a constant
input and model state values.
To compute a tangent linear approximation of a nonlinear black-box model,
you must have the following variables in the MATLAB workspace:
• Nonlinear ARX (idnlarx) or Hammerstein-Weiner (idnlhw) model.
• Operating point
The resulting linear model is accurate in the local neighborhood of the
operating conditions you used to compute the linear approximation.
To specify a known the operating point for your system, you must specify the
constant input and the states. For more information about state definitions
for each type of parametric model, see the corresponding reference pages:
• idnlarx (nonlinear ARX models)
• idnlhw (nonlinear Hammerstein-Wiener models)
If you do not know the operating point values for your system, see “Computing
Operating Points for Nonlinear Black-Box Models” on page 4-35. For more
information, see the linearize(idnlarx) or linearize(idnlhw) reference
page.
Computing Operating Points for Nonlinear Black-Box
Models
The linearize command for computing a first-order Taylor series
approximation for the system requires that you specify an operating point. An
operating point is defined by a constant input and model state values.
If you do not know the operating conditions of your system, you can use the
findop command to compute the operating point from specifications, as
follows:
• “Computing Operating Point from Steady-State Specifications” on page 4-36
4-35
4
Nonlinear Black-Box Model Identification
• “Computing Operating Points at a Simulation Snapshot” on page 4-36
Computing Operating Point from Steady-State Specifications
You can compute an operating point from steady-state specifications, as
follows:
• Using values of input and output signals.
If either the steady-state input or output value is unknown, you can specify
it as NaN to estimate this value. This is especially useful when modeling
MIMO systems, where only a subset of the input and output steady-state
values are known.
• Using more complex steady-state specifications.
You construct an object to store the specifications for computing the
operating point, including input and output bounds, known values,
and initial guesses. For more information, see operspec(idnlarx) or
operspec(idnlhw).
For more information, see the findop(idnlarx) or findop(idnlhw) reference
page.
Computing Operating Points at a Simulation Snapshot
You can compute an operating point at a specific time during the model
simulation (snapshot). You must specify the snapshot time and the input
value for which you want to compute the operating point. If you do not know
the equilibrium values of states, you can compute them using an input level
that causes the output level to reach a steady-state after a finite time.
If your system is at steady state and you are working with linear or
Hammerstein-Wiener models, you do not need to specify the initial states
because they do not affect the steady-state values. For nonlinear ARX models,
there can be multiple steady states and you should generally specify the
initial states because they can affect steady-state values. By default, initial
states are set to zero.
However, if your system has not reached steady state at the snapshot time,
you must specify the initial states. If you do not know the initial states, you
4-36
Computing Linear Approximations of Nonlinear Black-Box Models
can compute them using the findstates command. For more information,
see the findstates(idnlarx) or findstates(idnlhw) reference pages.
4-37
4
4-38
Nonlinear Black-Box Model Identification
5
ODE Parameter Estimation
(Grey-Box Modeling)
• “Supported Grey-Box Models” on page 5-2
• “Data Supported by Grey-Box Models” on page 5-3
• “Choosing idgrey or idnlgrey Model Object” on page 5-4
• “Estimating Linear Grey-Box Models” on page 5-6
• “Estimating Nonlinear Grey-Box Models” on page 5-16
• “After Estimating Grey-Box Models” on page 5-23
5
ODE Parameter Estimation (Grey-Box Modeling)
Supported Grey-Box Models
If you understand the physics of your system and can represent the system
using ordinary differential or difference equations (ODEs) with unknown
parameters, then you can use System Identification Toolbox commands to
perform linear or nonlinear grey-box modeling. Grey-box model ODEs specify
the mathematical structure of the model explicitly, including couplings
between parameters and known parameter values. Grey-box modeling is
useful when you know the relationships between variables, constraints on
model behavior, or explicit equations representing system dynamics.
The toolbox supports both continuous-time and discrete-time models.
However, because most laws of physics are expressed in continuous time, it is
easier to construct models with physical insight in continuous time, rather
than in discrete time.
In addition to dynamic input-output models, you can also create time-series
models that have no inputs and static models that have no states.
If it is too difficult to describe your system using known physical laws, you can
perform black-box modeling.
You can also use the idss model object to perform structured model
estimation by using structure matrices As, Bs, Cs, Ds, X0s, Ks to fix or free
specific parameters. However, you cannot use this approach to estimate
arbitrary structures (arbitrary parameterization). For more information
about structure matrices, see “How to Estimate State-Space Models with
Structured Parameterization” on page 3-93.
5-2
Data Supported by Grey-Box Models
Data Supported by Grey-Box Models
You can estimate both continuous-time or discrete-time grey-box models for
data with the following characteristics:
• Time-domain or frequency-domain data, including time-series data with no
inputs.
Note Nonlinear grey-box models support only time-domain data.
• Single-output or multiple-output data
You must first import your data into the MATLAB workspace. If you are
using the System Identification Tool GUI, then import the data into the GUI
to make the data available to the toolbox. However, if you prefer to work at
the command line, then represent your data as an iddata or idfrd object.
For more information about preparing data for identification, see Chapter
1, “Data Processing”.
5-3
5
ODE Parameter Estimation (Grey-Box Modeling)
Choosing idgrey or idnlgrey Model Object
Grey-box models require that you specify the structure of the ODE model in
a file. You use this file to create the idgrey or idnlgrey model object. You
can use both the idgrey and the idnlgrey objects to model linear systems.
However, you can only represent nonlinear dynamics using the idnlgrey
model object.
The idgrey object requires that you write an M-file to describe the linear
dynamics in the state-space form, such that this M-file returns the state-space
matrices as a function of your parameters. For more information, see
“Specifying the Linear Grey-Box Model Structure” on page 5-6.
The idnlgrey object requires that you write an M-file or MEX-file to describe
the dynamics as a set of first-order differential equations, such that this file
returns the output and state derivatives as a function of time, input, state,
and parameter values. For more information, see “Specifying the Nonlinear
Grey-Box Model Structure” on page 5-17.
The following table compares idgrey and idnlgrey model objects.
Comparison of idgrey and idnlgrey Objects
5-4
Settings and
Operations
Supported by
idgrey?
Supported by
idnlgrey?
Set bounds on
parameter values.
No
Yes
Handle initial states
individually.
No
Yes
Perform linear analysis
(e.g., using bode).
Yes
No
Choosing idgrey or idnlgrey Model Object
Comparison of idgrey and idnlgrey Objects (Continued)
Settings and
Operations
Supported by
idgrey?
Supported by
idnlgrey?
Honor stability
constraints specified by
Yes
No
Algorithm.Advanced.
Threshold.Zstability
Note If you know
the parameter bounds
for obtaining a stable
idnlgrey model, set
these bounds to ensure
stability.
and
Algorithm.Advanced.
Threshold.Sstability
model properties
Estimate a disturbance
model
Yes
The disturbance model
is represented by K in
state-space equations.
No
Optimize estimation
results for simulation
or prediction
Yes
Set the
No
Because idnlgrey
models are
Output-Error models,
there is no difference
between simulation and
prediction results.
Algorithm.Focus
property to
'Simulation' or
'Prediction'.
5-5
5
ODE Parameter Estimation (Grey-Box Modeling)
Estimating Linear Grey-Box Models
In this section...
“Specifying the Linear Grey-Box Model Structure” on page 5-6
“Example – Representing a Grey-Box Model in an M-File” on page 5-7
“Example – Estimating a Continuous-Time Grey-Box Model for Heat
Diffusion” on page 5-9
“Example – Estimating a Discrete-Time Grey-Box Model with
Parameterized Disturbance” on page 5-12
Specifying the Linear Grey-Box Model Structure
You can estimate linear discrete-time and continuous-time grey-box models
for arbitrary ordinary differential or difference equations using single-output
and multiple-output time-domain data, or output-only time-series data.
You must represent your system equations in state-space form. State-space
models use state variables x(t) to describe a system as a set of first-order
differential equations, rather than by one or more nth-order differential
equations.
In continuous-time, the state-space description has the following form:
(t)
x (t) = Fx(t) + Gu(t) + Kw
y(t) = Hx(t) + Du(t) + w(t)
x(0) = x0
The discrete-time state-space model structure is often written in the
innovations form:
x(kT + T ) = Ax(kT ) + Bu(kT ) + Ke(kT )
y(kT ) = Cx(kT ) + Du(kT ) + e(kT )
x(0) = x0
5-6
Estimating Linear Grey-Box Models
The first step in grey-box modeling is to write an M-file that returns
state-space matrices as a function of user-defined parameters and information
about the model.
Use the following format to implement the linear grey-box model in an M-file:
[A,B,C,D,K,x0] = myfunc(par,T,CDmfile,aux)
where the matrices A, B, C, D, K, and x0 represent both the continuous-time
and discrete-time state-space description of the system, myfunc is the name
of the M-file, par contains the parameters as a column vector, and T is the
sampling interval. aux contains auxiliary variables in your system. You use
auxiliary variables to vary system parameters at the input to the function,
and avoid editing the M-file.
CDmfile is an optional argument that describes whether the resulting
state-space matrices are in discrete time or continuous time. By default,
CDmfile='cd', which means that the sampling interval property of the model
Ts determines whether the model is continuous or discrete in time. For more
information about these arguments, see the idgrey reference page.
Use pem to estimate your grey-box model.
Example – Representing a Grey-Box Model in an
M-File
In this example, you represent the structure of the following continuous-time
model:
⎡0 1 ⎤
⎡0⎤
x (t) = ⎢
x(t) + ⎢ ⎥ u(t)
⎥
⎣0 θ1 ⎦
⎣ θ2 ⎦
⎡1 0 ⎤
y(t) = ⎢
⎥ x(t) + e(t)
⎣0 1 ⎦
⎡ θ3 ⎤
x(0) = ⎢ ⎥
⎣0⎦
5-7
5
ODE Parameter Estimation (Grey-Box Modeling)
This equation represents an electrical motor, where y1 (t) = x1 (t) is the
angular position of the motor shaft, and y2 (t) = x2 (t) is the angular velocity.
The parameter −θ1 is the inverse time constant of the motor, and − θ2 θ is the
1
static gain from the input to the angular velocity.
The motor is at rest at t=0, but its angular position θ3 is unknown. Suppose
that the approximate nominal values of the unknown parameters are θ1 = −1
and θ2 = 0.25 . For more information about this example, see the section
on state-space models in System Identification: Theory for the User, Second
Edition, by Lennart Ljung, Prentice Hall PTR, 1999.
The continuous-time state-space model structure is defined by the following
equation:
(t)
x (t) = Fx(t) + Gu(t) + Kw
y(t) = Hx(t) + Du(t) + w(t)
x(0) = x0
To prepare this model for identification:
1 Create the following M-file to represent the model structure in this example:
function [A,B,C,D,K,x0] = myfunc(par,T,aux)
A = [0 1; 0 par(1)];
B = [0;par(2)];
C = eye(2);
D = zeros(2,1);
K = zeros(2,2);
x0 =[par(3);0];
5-8
Estimating Linear Grey-Box Models
2 Use the following syntax to define an idgrey model object based on the
myfunc M-file:
m = idgrey('myfunc',par,'c',T,aux)
where par represents user-defined parameters and contains their nominal
(initial) values. 'c' specifies that the underlying parameterization is in
continuous time. aux contains the values of the auxiliary parameters.
Note You must specify T and aux even if they are not used by the myfunc
code.
Use pem to estimate the grey-box parameter values:
m = pem(data,m)
where data is the estimation data and m is the idgrey object with unknown
parameters.
Note Compare this example to “Example – Estimating Structured
Continuous-Time State-Space Models” on page 3-97, where the same problem
is solved using a structured state-space representation.
Example – Estimating a Continuous-Time Grey-Box
Model for Heat Diffusion
In this example, you estimate the heat conductivity and the heat-transfer
coefficient of a continuous-time grey-box model for a heated-rod system.
This system consists of a well-insulated metal rod of length L and a
heat-diffusion coefficient κ . The input to the system is the heating power u(t)
and the measured output y(t) is the temperature at the other end.
5-9
5
ODE Parameter Estimation (Grey-Box Modeling)
Under ideal conditions, this system is described by the heat-diffusion
equation—which is a partial differential equation in space and time.
∂x(t, ξ)
∂ 2 x(t, ξ)
=κ
∂t
∂ξ2
To get a continuous-time state-space model, you can represent the
second-derivative using the following difference approximation:
∂ 2 x(t, ξ)
∂ξ
2
=
x ( t, ξ + ΔL ) − 2 x(t, ξ) + x ( t, ξ − ΔL )
( ΔL )2
where ξ = k ⋅ ΔL
This transformation produces a state-space model of order n = ΔLL , where
the state variables x(t, k ⋅ ΔL) are lumped representations for x(t, ξ) for the
following range of values:
k ⋅ ΔL ≤ ξ < ( k + 1) ΔL
The dimension of x depends on the spatial grid size ΔL in the approximation.
The heat-diffusion equation is mapped to the following continuous-time
state-space model structure to identify the state-space matrices:
(t)
x (t) = Fx(t) + Gu(t) + Kw
y(t) = Hx(t) + Du(t) + w(t)
x(0) = x0
5-10
Estimating Linear Grey-Box Models
The following M-file describes the state-space equation for this model. In
this case, the auxiliary variables specify grid-size variables, so that you can
modify the grid size without the M-file.
function [A,B,C,D,K,x0] = heatd(pars,T,aux)
% Number of points in the space-discretization
Ngrid = aux(1);
% Length of the rod
L = aux(2);
% Initial rod temperature (uniform)
temp = aux(3);
% Space interval
deltaL = L/Ngrid;
% Heat-diffusion coefficient
kappa = pars(1);
% Heat transfer coefficient at far end of rod
htf = pars(2);
A = zeros(Ngrid,Ngrid);
for kk = 2:Ngrid-1
A(kk,kk-1) = 1;
A(kk,kk) = -2;
A(kk,kk+1) = 1;
end
% Boundary condition on insulated end
A(1,1) = -1; A(1,2) = 1;
A(Ngrid,Ngrid-1) = 1;
A(Ngrid,Ngrid) = -1;
A = A*kappa/deltaL/deltaL;
B = zeros(Ngrid,1);
B(Ngrid,1) = htf/deltaL;
C = zeros(1,Ngrid);
C(1,1) = 1;
D = 0;
K = zeros(Ngrid,1);
x0 = temp*ones(Ngrid,1);
5-11
5
ODE Parameter Estimation (Grey-Box Modeling)
Use the following syntax to define an idgrey model object based on the heatd
M-file:
m = idgrey('heatd',[0.27 1],'c',[10,1,22])
This command specifies the auxiliary parameters as inputs to the function,
include the model order 10, the rod length of 1 meter, and an initial
temperature of 22 degrees Celsius. The command also specifies the initial
values for heat conductivity as 0.27, and for the heat transfer coefficient as 1.
For given data, you can use pem to estimate the grey-box parameter values:
me = pem(data,m)
The following command shows how you can specify to estimate a new model
with different auxiliary variables directly in the estimator command:
me = pem(data,m,'FileArgument',[20,1,22])
This syntax uses the FileArgument model property to specify a finer grid
using a larger value for Ngrid. For more information about linear grey-box
model properties, see the idgrey reference page.
Example – Estimating a Discrete-Time Grey-Box
Model with Parameterized Disturbance
This example shows how to create a single-input and single-output grey-box
model structure when you know the variance of the measurement noise. The
code in this example uses the Control System Toolbox command kalman for
computing the Kalman gain from the known and estimated noise variance.
5-12
Estimating Linear Grey-Box Models
Description of the SISO System
This example is based on a discrete, single-input and single-output (SISO)
system represented by the following state-space equations:
⎡1 ⎤
⎡ par1 par 2⎤
x(kT + T ) = ⎢
x(kT ) + ⎢ ⎥ u(kT ) + w(kT )
⎥
0 ⎦
⎣0 ⎦
⎣ 1
y(kT ) = [ par 3 par 4 ] x(kT ) + e(kT )
x(0) = x0
where w and e are independent white-noise terms with covariance matrices
R1 and R2, respectively. R1=E{ww’} is a 2–by-2 matrix and R2=E{ee’} is a
scalar. par1, par2, par3, and par4 represent the unknown parameter values
to be estimated.
Assume that you know the variance of the measurement noise R2 to be 1.
R1(1,1) is unknown and is treated as an additional parameter par5. The
remaining elements of R1 are known to be zero.
Estimating the Parameters of an idgrey Model
You can represent the system described in “Description of the SISO System”
on page 5-13 as an idgrey (grey-box) model using an M-file. Then, you can
use this M-file and the pem command to estimate the model parameters based
on initial parameter guesses.
To run this example, you must load an input-output data set and represent
it as an iddata or idfrd object called data. For more information about
this operation, see “Representing Time- and Frequency-Domain Data Using
iddata Objects” on page 1-47 or “Representing Frequency-Response Data
Using idfrd Objects” on page 1-67.
To estimate the parameters of a grey-box model:
5-13
5
ODE Parameter Estimation (Grey-Box Modeling)
1 Create the M-file mynoise that computes the state-space matrices as a
function of the five unknown parameters and the auxiliary variable that
represents the known variance R2.
Note R2 is treated as an auxiliary variable rather than assigned a value
in the M-file to let you change this value directly at the command line
and avoid editing the M-file.
function [A,B,C,D,K,x0] = mynoise(par,T,aux)
R2 = aux(1); % Known measurement noise variance
A = [par(1) par(2);1 0];
B = [1;0];
C = [par(3) par(4)];
D = 0;
R1 = [par(5) 0;0 0];
[est,K] = kalman(ss(A,eye(2),C,0,T),R1,R2);
% Uses Control System Toolbox product
% u=[]
x0 = [0;0];
2 Specify initial guesses for the unknown parameter values and the auxiliary
parameter value R2:
par1 =
par2 =
par3 =
par4 =
par5 =
Pvec =
auxVal
0.1; %
-2; %
1;
%
3;
%
0.2; %
[par1;
= 1; %
Initial guess for
Initial guess for
Initial guess for
Initial guess for
Initial guess for
par2; par3; par4;
R2=1
A(1,1)
A(1,2)
C(1,1)
C(1,2)
R1(1,1)
par5]
3 Construct an idgrey model using the mynoise M-file:
Minit = idgrey('mynoise',Pvec,'d',auxVal);
The third input argument 'd' specifies a discrete-time system.
4 Estimate the model parameter values from data:
5-14
Estimating Linear Grey-Box Models
Model = pem(data,Minit)
5-15
5
ODE Parameter Estimation (Grey-Box Modeling)
Estimating Nonlinear Grey-Box Models
In this section...
“Supported Nonlinear Grey-Box Models” on page 5-16
“Nonlinear Grey-Box Demos and Examples” on page 5-16
“Specifying the Nonlinear Grey-Box Model Structure” on page 5-17
“Constructing the idnlgrey Object” on page 5-18
“Using pem to Estimate Nonlinear Grey-Box Models” on page 5-19
“Options for the Estimation Algorithm” on page 5-20
Supported Nonlinear Grey-Box Models
You can estimate nonlinear discrete-time and continuous-time grey-box
models for arbitrary nonlinear ordinary differential equations using
single-output and multiple-output time-domain data, or output-only
time-series data. Your grey-box models can be static or dynamic.
Grey-box models describe the system behavior as a set of nonlinear ordinary
differential or difference equations (ODEs) with unknown parameters.
Nonlinear Grey-Box Demos and Examples
The System Identification Toolbox product provides several demos and case
studies on creating, manipulating, and estimating nonlinear grey-box models.
You can access these demos by typing the following command at the prompt:
iddemo
For examples of M-files and MEX-files that specify model structure, see the
toolbox/ident/iddemos/examples directory. For example, the model of a
DC motor—used in the demo idnlgreydemo1—is described in files dcmotor_m
and dcmotor_c.
5-16
Estimating Nonlinear Grey-Box Models
Specifying the Nonlinear Grey-Box Model Structure
You must represent your system as a set of first-order nonlinear difference or
differential equations:
x† (t) = F (t, x(t), u(t), par1, par 2,..., parN )
y(t) = H (t, x(t), u(t), par1, par 2,..., parN ) + e(t)
x(0) = x0
where x† (t) = dx(t) dt for continuous-time representation and x† (t) = x(t + Ts )
for discrete-time representation with Ts as the sampling interval. F and
H are arbitrary linear or nonlinear functions with Nx and Ny components,
respectively. Nx is the number of states and Ny is the number of outputs.
After you establish the equations for your system, create an M-file or MEX-file.
MEX-files, which can be created in C or Fortran, are dynamically linked
subroutines that can be loaded and executed by the MATLAB interpreter. For
more information about MEX-files, see the MATLAB documentation.
The purpose of the model file is to return the state derivatives and model
outputs as a function of time, states, inputs, and model parameters, as follows:
[dx,y] = MODFILENAME(t,x,u,p1,p2, ...,pN,FileArgument)
Tip The template file for writing the C MEX-file,
IDNLGREY_MODEL_TEMPLATE.c, is located in matlab/toolbox/ident/nlident.
The output variables are:
• dx — Represents the right side(s) of the state-space equation(s). A column
vector with Nx entries. For static models, dx=[].
For discrete-time models. dx is the value of the states at the next time
step x(t+Ts).
For continuous-time models. dx is the state derivatives at time t, or dx
.
dt
5-17
5
ODE Parameter Estimation (Grey-Box Modeling)
• y — Represents the right side(s) of the output equation(s). A column vector
with Ny entries.
The file inputs are:
• t — Current time.
• x — State vector at time t. For static models, equals [].
• u — Input vector at time t. For time-series models, equals [].
• p1,p2, ...,pN — Parameters, which can be real scalars, column vectors
or two-dimensional matrices. N is the number of parameter objects. For
scalar parameters, N is the total number of parameter elements.
• FileArgument — Contains auxiliary variables that might be required for
updating the constants in the state equations.
Tip After creating a model file, call it directly from the MATLAB software
with reasonable inputs and verify the output values.
For an example of creating grey-box model files and idnlgrey model object,
see the demo Creating idnlgrey Model Files.
Constructing the idnlgrey Object
After you create the M-file or MEX-file with your model structure, you must
define an idnlgrey object. This object shares many of the properties of the
linear idgrey model object.
Use the following syntax to define the idnlgrey model object:
m = idnlgrey('filename',Order,Parameters,InitialStates)
The idnlgrey arguments are defined as follows:
• 'filename' — Name of the M-file or MEX-file storing the model structure.
This file must be on the MATLAB path when you use this model object for
model estimation, prediction, or simulation.
5-18
Estimating Nonlinear Grey-Box Models
• Order — Vector with three entries [Ny Nu Nx], specifying the number of
model outputs Ny, the number of inputs Nu, and the number of states Nx.
• Parameters — Parameters, specified as struct arrays, cell arrays, or
double arrays.
• InitialStates — Specified in the same way as parameters. Must be the
fourth input to the idnlgrey constructor.
For detailed information about this object and its properties, see the idnlgrey
reference page.
Use pem to estimate your grey-box model.
Using pem to Estimate Nonlinear Grey-Box Models
You can use the pem command to estimate the unknown idnlgrey model
parameters and initial states using measured data.
The input-output dimensions of the data must be compatible with the input
and output orders you specified for the idnlgrey model.
Use the following general estimation syntax:
m = pem(data,m)
where data is the estimation data and m is the idnlgrey model object you
constructed.
You can pass additional property-value pairs to pem to specify the properties
of the model or the estimation algorithm. Assignable properties include
the ones returned by the get(idnlgrey) command and the algorithm
properties returned by the get(idnlgrey, 'Algorithm'), such as MaxIter
and Tolerance. For detailed information about these model properties, see
the idnlgrey reference page.
For more information about validating your models, see Chapter 8, “Model
Analysis”.
5-19
5
ODE Parameter Estimation (Grey-Box Modeling)
Options for the Estimation Algorithm
The Algorithm property of the model specifies the estimation algorithm,
which simulates the model several times by trying various parameter values
to reduce the prediction error.
The following algorithm properties can affect the quality of the results:
• “Simulation Method” on page 5-20
• “Search Method” on page 5-20
• “Gradient Options” on page 5-21
• “Example – Specifying Algorithm Properties” on page 5-21
For detailed information about these and other model properties, see the
idnlgrey reference page.
Simulation Method
You can specify the simulation method using the SimulationOptions
(struct) fields of the model Algorithm property.
System Identification Toolbox software provides several variable-step and
fixed-step solvers for simulating idnlgrey models. To view a list of available
solvers and their properties, type the following command at the prompt:
idprops idnlgrey algorithm.simulationoptions
For discrete-time systems, the default solver is 'FixedStepDiscrete'. For
continuous-time systems, the default solver is 'ode45'.
By default, SimulationOptions.Solver is set to 'Auto', which automatically
selects either 'ode45' or 'FixedStepDiscrete' during estimation and
simulation—depending on whether the system is continuous or discrete in
time.
Search Method
You can specify the search method for estimating model parameters using the
SearchMethod field of the Algorithm property. Two categories of methods are
available for nonlinear grey-box modeling.
5-20
Estimating Nonlinear Grey-Box Models
One category of methods consists of the minimization schemes that are
based on line-search methods, including Gauss-Newton type methods,
steepest-descent methods, and Levenberg-Marquardt methods.
The Trust-Region Reflective Newton method of nonlinear least-squares
(lsqnonlin), where the cost is the sum of squares of errors between the
measured and simulated outputs, requires Optimization Toolbox™ software.
When the parameter bounds differ from the default +/- Inf, this search
method handles the bounds better than the schemes based on a line search.
However, unlike the line-search-based methods, lsqnonlin only works with
Criterion='Trace'.
By default, SearchMethod is set to Auto, which automatically selects a
method from the available minimizers. If the Optimization Toolbox product is
installed, SearchMethod is set to 'lsqnonlin'. Otherwise, SearchMethod is a
combination of line-search based schemes.
Gradient Options
You can specify the method for calculating gradients using the
GradientOptions field of the Algorithm property. Gradients are the
derivatives of errors with respect to unknown parameters and initial states.
Gradients are calculated by numerically perturbing unknown quantities and
measuring their effects on the simulation error.
Option for gradient computation include the choice of the differencing scheme
(forward, backward or central), the size of minimum perturbation of the
unknown quantities, and whether the gradients are calculated simultaneously
or individually.
Example – Specifying Algorithm Properties
You can specify the Algorithm fields directly in the estimation syntax, as
property-value pairs.
For example, you can specify the following properties as part of the pem syntax:
m = pem(data,init_model,'Search','gn',...
'MaxIter',5,...
'Display','On')
5-21
5
5-22
ODE Parameter Estimation (Grey-Box Modeling)
After Estimating Grey-Box Models
After Estimating Grey-Box Models
After estimating linear and nonlinear grey-box models, you can simulate the
model output using the sim command. For more information, see Chapter 9,
“Simulation and Prediction”.
The toolbox represents linear grey-box models using the idgrey model object.
To convert grey-box models to state-space form, use the idss command,
as described in “Transforming Between Linear Model Representations” on
page 3-117. You can then analyze the model behavior using transient- and
frequency-response plots and other linear analysis plots.
The toolbox represents nonlinear grey-box models as idnlgrey model objects.
These model objects store the parameter values resulting from the estimation.
You can access these parameters from the model objects to use these variables
in computation in the MATLAB workspace.
Note Linearization of nonlinear grey-box models is not supported.
You can import grey box models into a Simulink model using the System
Identification Toolbox Block Library. For more information, see “Simulating
Model Output” on page 11-6.
5-23
5
5-24
ODE Parameter Estimation (Grey-Box Modeling)
6
Time Series Model
Identification
• “What Are Time-Series Models?” on page 6-2
• “Preparing Time-Series Data” on page 6-3
• “Estimating Time-Series Power Spectra” on page 6-4
• “Estimating AR and ARMA Models” on page 6-7
• “Estimating State-Space Time-Series Models” on page 6-12
• “Example – Identifying Time-Series Models at the Command Line” on page
6-14
• “Estimating Nonlinear Models for Time-Series Data” on page 6-15
6
Time Series Model Identification
What Are Time-Series Models?
A time series is one or more measured output channels with no measured
input.
You can estimate time-series spectra using both time- and frequency-domain
data. Time-series spectra describe time-series variations using cyclic
components at different frequencies.
You can also estimate parametric autoregressive (AR), autoregressive and
moving average (ARMA), and state-space time-series models. For a definition
of these models, see “Definition of AR and ARMA Models” on page 6-7.
Note ARMA and state-space models are supported for time-domain data
only. Only single-output ARMA models are supported.
6-2
Preparing Time-Series Data
Preparing Time-Series Data
Before you can estimate models for time-series data, you must import your
data into the MATLAB software. You can estimate models from either
time-domain and frequency-domain data. For information about which
variables you need to represent time-series data, see “Importing Time-Series
Data into MATLAB” on page 1-7.
For more information about preparing data for modeling, see “Ways to Process
Data for System Identification” on page 1-2.
If your data is already in the MATLAB workspace, you can import it directly
into the System Identification Tool GUI. If you prefer to work at the command
line, you must represent the data as a System Identification Toolbox data
object instead.
In the System Identification Tool GUI. When you import scalar or
multiple-output time series data into the GUI, leave the Input field empty.
For more information about importing data, see “Representing Data in the
GUI” on page 1-13.
At the command line. To represent a time series vector or a matrix s as an
iddata object, use the following syntax:
y = iddata(s,[],Ts);
s contains as many columns as there are measured outputs. For time-domain
data, set Ts to the sampling interval. For continuous-time frequency domain
data, set Ts to 0.
6-3
6
Time Series Model Identification
Estimating Time-Series Power Spectra
In this section...
“How to Estimate Time-Series Power Spectra Using the GUI” on page 6-4
“How to Estimate Time-Series Power Spectra at the Command Line” on
page 6-5
How to Estimate Time-Series Power Spectra Using
the GUI
You must have already imported your data into the GUI, as described in
“Preparing Time-Series Data” on page 6-3.
To estimate time-series spectral models in the System Identification Tool GUI:
1 In the System Identification Tool GUI, select Estimate > Spectral
models to open the Spectral Model dialog box.
2 In the Method list, select the spectral analysis method you want to use.
For information about each method, see “Options for Computing Spectral
Models” on page 3-5.
3 Specify the frequencies at which to compute the spectral model in either of
the following ways:
• In the Frequencies field, enter either a vector of values, a MATLAB
expression that evaluates to a vector, or a variable name of a vector in
the MATLAB workspace. For example, logspace(-1,2,500).
• Use the combination of Frequency Spacing and Frequencies to
construct the frequency vector of values:
– In the Frequency Spacing list, select Linear or Logarithmic
frequency spacing.
Note For etfe, only the Linear option is available.
– In the Frequencies field, enter the number of frequency points.
6-4
Estimating Time-Series Power Spectra
For time-domain data, the frequency ranges from 0 to the Nyquist
frequency. For frequency-domain data, the frequency ranges from the
smallest to the largest frequency in the data set.
4 In the Frequency Resolution field, enter the frequency resolution, as
described in “Options for Frequency Resolution” on page 3-6. To use the
default value, enter default or leave the field empty.
5 In the Model Name field, enter the name of the correlation analysis model.
The model name should be unique in the Model Board.
6 Click Estimate to add this model to the Model Board in the System
Identification Tool GUI.
7 In the Spectral Model dialog box, click Close.
8 To view the estimated disturbance spectrum, select the Noise spectrum
check box in the System Identification Tool GUI. For more information
about working with this plot, see “Creating Noise-Spectrum Plots” on page
8-40.
To export the model to the MATLAB workspace, drag it to the To Workspace
rectangle in the System Identification Tool GUI. You can view the power
spectrum and the confidence intervals of the resulting idfrd model object
using the bode command.
How to Estimate Time-Series Power Spectra at the
Command Line
You can use the etfe, spa, and spafdr commands to estimate power spectra
of time series for both time-domain and frequency-domain data. The following
table provides a brief description of each command.
You must have already prepared your data, as described in “Preparing
Time-Series Data” on page 6-3.
The resulting models are stored as an idfrd model object, which contains
SpectrumData and its variance. For multiple-output data, SpectrumData
contains power spectra of each output and the cross-spectra between each
output pair.
6-5
6
Time Series Model Identification
Estimating Frequency Response of Time Series
Command
Description
etfe
Estimates a periodogram using Fourier
analysis.
spa
Estimates the power spectrum with its
standard deviation using spectral analysis.
spafdr
Estimates the power spectrum with
its standard deviation using a variable
frequency resolution.
For example, suppose y is time-series data. The following commands estimate
the power spectrum g and the periodogram p, and plot both models with three
standard deviation confidence intervals:
g = spa(y)
p = etfe(y)
bode(g,p,'sd',3)
For detailed information about these commands, see the corresponding
reference pages.
6-6
Estimating AR and ARMA Models
Estimating AR and ARMA Models
In this section...
“Definition of AR and ARMA Models” on page 6-7
“Estimating Polynomial Time-Series Models in the GUI” on page 6-7
“Estimating AR and ARMA Models at the Command Line” on page 6-10
Definition of AR and ARMA Models
For a single-output signal y(t), the AR model is given by the following equation:
A(q) y(t) = e(t)
The AR model is a special case of the ARX model with no input.
The ARMA model for a single-output time-series is given by the following
equation:
A(q) y(t) = C(q) e(t)
The ARMA structure reduces to the AR structure for C(q)=1. The ARMA
model is a special case of the ARMAX model with no input.
For more information about polynomial models, see “What Are Black-Box
Polynomial Models?” on page 3-41.
Estimating Polynomial Time-Series Models in the GUI
Before you begin, you must have accomplished the following:
• Prepared the data, as described in “Preparing Time-Series Data” on page
6-3
• Estimated model order, as described in “Preliminary Step – Estimating
Model Orders and Input Delays” on page 3-49
6-7
6
Time Series Model Identification
• (Multiple-output AR models only) Specified the model-order matrix in
the MATLAB workspace before estimation, as described in “Options for
Multiple-Input and Multiple-Output ARX Orders” on page 3-64
To estimate AR and ARMA models using the System Identification Tool GUI:
1 In the System Identification Tool GUI, select Estimate > Linear
parametric models to open the Linear Parametric Models dialog box.
2 In the Structure list, select the polynomial model structure you want to
estimate from the following options:
• AR:[na]
• ARMA:[na nc]
This action updates the options in the Linear Parametric Models dialog box
to correspond with this model structure. For information about each model
structure, see “Definition of AR and ARMA Models” on page 6-7.
Note OE and BJ structures are not available for time-series models.
3 In the Orders field, specify the model orders, as follows:
• For single-output models. Enter the model orders according to the
sequence displayed in the Structure field.
• For multiple-output ARX models. (AR models only) Enter the
model orders directly, as described in “Options for Multiple-Input and
Multiple-Output ARX Orders” on page 3-64. Alternatively, enter the
name of the matrix NA in the MATLAB Workspace browser that stores
model orders, which is Ny-by-Ny.
Tip To enter model orders and delays using the Order Editor dialog box,
click Order Editor.
6-8
Estimating AR and ARMA Models
4 (AR models only) Select the estimation Method as ARX or IV
(instrumental variable method). For more information about these
methods, see “Algorithms for Estimating Polynomial Models” on page 3-66.
Note IV is not available for multiple-output data.
5 In the Name field, edit the name of the model or keep the default. The
name of the model should be unique in the Model Board.
6 In the Initial state list, specify how you want the algorithm to treat initial
states. For more information about the available options, see “Options for
Initial States” on page 3-66.
Tip If you get an inaccurate fit, try setting a specific method for handling
initial states rather than choosing it automatically.
7 In the Covariance list, select Estimate if you want the algorithm to
compute parameter uncertainties. Effects of such uncertainties are
displayed on plots as model confidence regions.
To omit estimating uncertainty, select None. Skipping uncertainty
computation might reduce computation time for complex models and large
data sets.
8 (ARMA only) To view the estimation progress at the command line, select
the Trace check box. During estimation, the following information is
displayed for each iteration:
• Loss function — Equals the determinant of the estimated covariance
matrix of the input noise.
• Parameter values — Values of the model structure coefficients you
specified.
• Search direction — Changes in parameter values from the previous
iteration.
6-9
6
Time Series Model Identification
• Fit improvements — Shows the actual versus expected improvements in
the fit.
9 Click Estimate to add this model to the Model Board in the System
Identification Tool GUI.
10 (Prediction-error method only) To stop the search and save the results
after the current iteration has been completed, click Stop Iterations. To
continue iterations from the current model, click the Continue iter button
to assign current parameter values as initial guesses for the next search.
11 To plot the model, select the appropriate check box in the Model Views
area of the System Identification Tool GUI. For more information about
validating models, see Chapter 8, “Model Analysis”.
You can export the model to the MATLAB workspace for further analysis
by dragging it to the To Workspace rectangle in the System Identification
Tool GUI.
Estimating AR and ARMA Models at the Command
Line
You can estimate AR and ARMA models at the command line. For
single-output time-series, the resulting models are idpoly model objects. For
multiple-output time-series, the resulting models are idarx model objects.
For more information about models objects, see “Creating Model Structures at
the Command Line” on page 2-11.
The following table summarizes the commands and specifies whether
single-output or multiple-output models are supported.
Commands for Estimating Polynomial Time-Series Models
6-10
Method Name
Description
Supported Data
ar
Noniterative, least-squares method
to estimate linear, discrete-time
single-output AR models.
Time-domain, time-series iddata
data object.
Estimating AR and ARMA Models
Commands for Estimating Polynomial Time-Series Models (Continued)
Method Name
Description
Supported Data
armax
Iterative prediction-error method
to estimate linear, single-output
ARMAX models.
Time-domain, time-series iddata
data object.
arx
Noniterative, least-squares method
for estimating single-output and
multiple-output linear AR models.
Supports time- and frequency-domain
time-series iddata data.
ivar
Noniterative, instrumental variable
method for estimating single-output
AR models.
Supports time-domain, time-series
iddata data.
The following code shows usage examples for estimating AR models:
% For scalar signals
m = ar(y,na)
% For multiple-output vector signals
m = arx(y,na)
% Instrumental variable method
m = ivar(y,na)
% For ARMA, do not need to specify nb and nk
th = armax(y,[na nc])
The ar command provides additional options to let you choose the algorithm
for computing the least-squares from a group of several popular techniques
from the following methods:
• Burg (geometric lattice)
• Yule-Walker
• Covariance
For more information about validating models, see “Overview of Model
Validation and Plots” on page 8-2.
6-11
6
Time Series Model Identification
Estimating State-Space Time-Series Models
In this section...
“Definition of State-Space Time-Series Model” on page 6-12
“Estimating State-Space Models at the Command Line” on page 6-12
Definition of State-Space Time-Series Model
The discrete-time state-space model for a time series is given by the following
equations:
x(kT + T ) = Ax(kT ) + Ke(kT )
y(kT ) = Cx(kT ) + e(kT )
where T is the sampling interval and y(kT) is the output at time instant kT.
The time-series structure corresponds to the general structure with empty B
and D matrices.
For information about general discrete-time and continuous-time structures
for state-space models, see “What Are State-Space Models?” on page 3-73.
Estimating State-Space Models at the Command Line
You can estimate single-output and multiple-output state-space models at the
command line for time-domain and frequency-domain data (iddata object).
The following table provides a brief description of each command. The
resulting models are idss model objects.
6-12
Estimating State-Space Time-Series Models
Commands for Estimating State-Space Time-Series Models
Command
Description
n4sid
Noniterative subspace method for estimating
discrete-time linear state-space models.
Note When you use pem to estimate a state-space
model, n4sid creates the initial model.
pem
Estimates linear, discrete-time time-series
models using an iterative estimation method that
minimizes the prediction error.
6-13
6
Time Series Model Identification
Example – Identifying Time-Series Models at the Command
Line
The following example simulates a time-series model, compares spectral
estimates, covariance estimates, and predicts output of the model:
ts0 = idpoly([1 -1.5 0.7],[]);
ir = sim(ts0,[1;zeros(24,1)]);
% Define the true covariance function
Ry0 = conv(ir,ir(25:-1:1));
e = idinput(200,'rgs');
% Define y vector
y = sim(ts0,e);
% iddata object with sampling time 1
y = iddata(y)
plot(y)
per = etfe(y);
speh = spa(y);
ffplot(per,speh,ts0)
% Estimate a second-order AR model
ts2 = ar(y,2);
ffplot(speh,ts2,ts0,'sd',3)
% Get covariance function estimates
Ryh = covf(y,25);
Ryh = [Ryh(end:-1:2),Ryh]';
ir2 = sim(ts2,[1;zeros(24,1)]);
Ry2 = conv(ir2,ir2(25:-1:1));
plot([-24:24]'*ones(1,3),[Ryh,Ry2,Ry0])
% The prediction ability of the model
compare(y,ts2,5)
6-14
Estimating Nonlinear Models for Time-Series Data
Estimating Nonlinear Models for Time-Series Data
When a linear model provides an insufficient description of the dynamics, you
can try estimating a nonlinear models. To learn more about when to estimate
nonlinear models, see “When to Identify Linear Versus Nonlinear Models” in
the Getting Started Guide.
Before you can estimate models for time-series data, you must have already
prepared the data as described in “Preparing Time-Series Data” on page 6-3.
For black-box modeling of time-series data, the toolbox supports nonlinear
ARX models. To learn how to estimate this type of model, see “Identifying
Nonlinear ARX Models” on page 4-4.
If you understand the underlying physics of the system, you can specify an
ordinary differential or difference equation and estimate the coefficients. To
learn how to estimate this type of model, see “Estimating Nonlinear Grey-Box
Models” on page 5-16.
For more information about validating models, see “Overview of Model
Validation and Plots” on page 8-2.
6-15
6
6-16
Time Series Model Identification
7
Recursive Techniques for
Model Identification
• “What Is Recursive Estimation?” on page 7-2
• “Commands for Recursive Estimation” on page 7-3
• “Algorithms for Recursive Estimation” on page 7-6
• “Data Segmentation” on page 7-14
7
Recursive Techniques for Model Identification
What Is Recursive Estimation?
Many real-world applications, such as adaptive control, adaptive filtering, and
adaptive prediction, require a model of the system to be available online while
the system is in operation. Estimating models for batches of input-output
data is useful for addressing the following types of questions regarding
system operation:
• Which input should be applied at the next sampling instant?
• How should the parameters of a matched filter be tuned?
• What are the predictions of the next few outputs?
• Has a failure occurred? If so, what type of failure?
You might also use online models to investigate time variations in system
and signal properties.
The methods for computing online models are called recursive identification
methods. Recursive algorithms are also called recursive parameter estimation,
adaptive parameter estimation, sequential estimation, and online algorithms.
For examples of recursive estimation and data segmentation, run the
Recursive Estimation and Data Segmentation demo by typing the following
command at the prompt:
iddemo5
For detailed information about recursive parameter estimation algorithms,
see the corresponding chapter in System Identification: Theory for the User by
Lennart Ljung (Prentice Hall PTR, Upper Saddle River, NJ, 1999).
7-2
Commands for Recursive Estimation
Commands for Recursive Estimation
You can recursively estimate linear polynomial models, such as ARX,
ARMAX, Box-Jenkins, and Output-Error models. If you are working with
time-series data that contains no inputs and a single output, you can
estimate AR (Auto-Regressive) and ARMA (Auto-Regressive Moving Average)
single-output models.
Before estimating models using recursive algorithms, you must import your
data into the MATLAB workspace and represent your data in either of the
following formats:
• Matrix of the form [y u]. y represents the output data using one or more
column vectors. Similarly, u represents the input data using one or more
column vectors.
• iddata or idfrd object. For more information about creating these objects,
see Chapter 1, “Data Processing”.
The general syntax for recursive estimation commands is as follows:
[params,y_hat]=command(data,nn,adm,adg)
params matrix contains the values of the estimated parameters, where the
kth row contains the parameters associated with time k, which are computed
using the data values in the rows up to and including the row k.
y_hat contains the predicted output values such that the kth row of y_hat is
computed based on the data values in the rows up to and including the row k.
Tip y_hat contains the adaptive predictions of the output and is useful for
adaptive filtering applications, such as noise cancelation.
nn specified the model orders and delay according to the specific polynomial
structure of the model. For example, nn=[na nb nk] for ARX models. For
more information about specifying polynomial model orders and delays, see
“Identifying Input-Output Polynomial Models” on page 3-41.
7-3
7
Recursive Techniques for Model Identification
adm and adg specify any of the four recursive algorithm, as described in
“Algorithms for Recursive Estimation” on page 7-6.
The following table summarizes the recursive estimation commands
supported by the System Identification Toolbox product. The command
description indicates whether you can estimate single-input, single-output,
multiple-input, and multiple-output, and time-series (no input) models. For
details about each command, see the corresponding reference page.
Tip For ARX and AR models, use rarx. For single-input/single-output
ARMAX or ARMA, Box-Jenkins, and Output-Error models, use rarmax, rbj,
and roe, respectively.
Commands for Linear Recursive Estimation
7-4
Command
Description
rarmax
Estimate parameters of
single-input/single-output ARMAX
and ARMA models.
rarx
Estimate parameters of single- or
multiple-input and single-output ARX
and AR models. Does not support
multiple-output system.
rbj
Estimate parameters of
single-input/single-output Box-Jenkins
models.
roe
Estimate parameters of
single-input/single-output Output-Error
models.
Commands for Recursive Estimation
Commands for Linear Recursive Estimation (Continued)
Command
Description
rpem
Estimate parameters of multiple-input
and single-output ARMAX/ARMA,
Box-Jenkins, or Output-Error models
using the general recursive prediction-error
algorithm for estimating the parameter
gradient.
Note Unlike pem, rpem does not support
state-space models.
rplr
Use as an alternative to rpem to estimate
parameters of multiple-input and
single-output systems when you want
to use recursive pseudolinear regression
method.
7-5
7
Recursive Techniques for Model Identification
Algorithms for Recursive Estimation
In this section...
“Types of Recursive Estimation Algorithms” on page 7-6
“General Form of Recursive Estimation Algorithm” on page 7-6
“Kalman Filter Algorithm” on page 7-8
“Forgetting Factor Algorithm” on page 7-10
“Unnormalized and Normalized Gradient Algorithms” on page 7-11
Types of Recursive Estimation Algorithms
You can choose from the following four recursive estimation algorithms:
• “General Form of Recursive Estimation Algorithm” on page 7-6
• “Kalman Filter Algorithm” on page 7-8
• “Forgetting Factor Algorithm” on page 7-10
• “Unnormalized and Normalized Gradient Algorithms” on page 7-11
You specify the type of recursive estimation algorithms as arguments adm
and adg of the recursive estimation commands in “Commands for Recursive
Estimation” on page 7-3.
For detailed information about these algorithms, see the corresponding
chapter in System Identification: Theory for the User by Lennart Ljung
(Prentice Hall PTR, Upper Saddle River, NJ, 1999).
General Form of Recursive Estimation Algorithm
The general recursive identification algorithm is given by the following
equation:
θˆ ( t ) = θˆ ( t − 1) + K ( t ) ( y ( t ) − yˆ ( t ) )
7-6
Algorithms for Recursive Estimation
θˆ ( t ) is the parameter estimate at time t. y(t) is the observed output at time t
and yˆ ( t ) is the prediction of y(t) based on observations up to time t-1. The
gain, K(t), determines how much the current prediction error y ( t ) − yˆ ( t )
affects the update of the parameter estimate. The estimation algorithms
minimize the prediction-error term y ( t ) − yˆ ( t ) .
The gain has the following general form:
K (t) = Q (t) ψ (t)
The recursive algorithms supported by the System Identification Toolbox
product differ based on different approaches for choosing the form of Q(t) and
computing ψ ( t ) , where ψ ( t ) represents the gradient of the predicted model
output yˆ ( t | θ ) with respect to the parameters θ .
The simplest way to visualize the role of the gradient ψ ( t ) of the parameters,
is to consider models with a linear-regression form:
y ( t ) = ψ T ( t ) θ0 ( t ) + e ( t )
In this equation, ψ ( t ) is the regression vector that is computed based on
previous values of measured inputs and outputs. θ0 ( t ) represents the true
parameters. e(t) is the noise source (innovations), which is assumed to be
white noise. The specific form of ψ ( t ) depends on the structure of the
polynomial model.
For linear regression equations, the predicted output is given by the following
equation:
yˆ ( t ) = ψ T ( t ) θˆ ( t − 1)
7-7
7
Recursive Techniques for Model Identification
For models that do not have the linear regression form, it is not possible to
compute exactly the predicted output and the gradient ψ ( t ) for the current
parameter estimate θˆ ( t − 1) . To learn how you can compute approximation for
ψ ( t ) and θˆ ( t − 1) for general model structures, see the section on recursive
prediction-error methods in System Identification: Theory for the User by
Lennart Ljung (Prentice Hall PTR, Upper Saddle River, NJ, 1999).
Kalman Filter Algorithm
• “Mathematics of the Kalman Filter Algorithm” on page 7-8
• “Using the Kalman Filter Algorithm” on page 7-9
Mathematics of the Kalman Filter Algorithm
The following set of equations summarizes the Kalman filter adaptation
algorithm:
θˆ ( t ) = θˆ ( t − 1) + K ( t ) ( y ( t ) − yˆ ( t ) )
yˆ ( t ) = ψ T ( t ) θˆ ( t − 1)
K (t) = Q (t) ψ (t)
Q (t) =
P ( t − 1)
R2 + ψ ( t ) P ( t − 1) ψ ( t )
T
P ( t ) = P ( t − 1) + R1 −
P ( t − 1) ψ ( t ) ψ ( t ) P ( t − 1)
T
R2 + ψ ( t ) P ( t − 1) ψ ( t )
T
This formulation assumes the linear-regression form of the model:
y ( t ) = ψ T ( t ) θ0 ( t ) + e ( t )
7-8
Algorithms for Recursive Estimation
The Kalman filter is used to obtain Q(t).
This formulation also assumes that the true parameters θ0 ( t ) are described
by a random walk:
θ0 ( t ) = θ0 ( t − 1) + w ( t )
w(t) is Gaussian white noise with the following covariance matrix, or drift
matrix R1:
Ew ( t ) w ( t )
T
= R1
R2 is the variance of the innovations e(t) in the following equation:
y ( t ) = ψ T ( t ) θ0 ( t ) + e ( t )
The Kalman filter algorithm is entirely specified by the sequence of data y(t),
the gradient ψ ( t ) , R1, R2, and the initial conditions θ ( t = 0 ) (initial guess of
the parameters) and P ( t = 0 ) (covariance matrix that indicates parameters
errors).
Note To simplify the inputs, you can scale R1, R2, and P ( t = 0 ) of the
original problem by the same value such that R2 is equal to 1. This scaling
does not affect the parameters estimates.
Using the Kalman Filter Algorithm
The general syntax for the command described in “Algorithms for Recursive
Estimation” on page 7-6 is the following:
[params,y_hat]=command(data,nn,adm,adg)
7-9
7
Recursive Techniques for Model Identification
To specify the Kalman filter algorithm, set adm to 'kf' and adg to the value
of the drift matrix R1 (described in “Mathematics of the Kalman Filter
Algorithm” on page 7-8).
Forgetting Factor Algorithm
• “Mathematics of the Forgetting Factor Algorithm” on page 7-10
• “Using the Forgetting Factor Algorithm” on page 7-11
Mathematics of the Forgetting Factor Algorithm
The following set of equations summarizes the forgetting factor adaptation
algorithm:
θˆ ( t ) = θˆ ( t − 1) + K ( t ) ( y ( t ) − yˆ ( t ) )
yˆ ( t ) = ψ T ( t ) θˆ ( t − 1)
K (t) = Q (t) ψ (t)
Q (t) = P (t) =
P (t) =
P ( t − 1)
λ + ψ ( t ) P ( t − 1) ψ ( t )
⎛
1 ⎜ P t −1 −
)
λ⎜ (
⎝
T
P ( t − 1) ψ ( t ) ψ ( t ) P ( t − 1) ⎞
⎟
T
λ + ψ ( t ) P ( t − 1) ψ ( t ) ⎠⎟
T
To obtain Q(t), the following function is minimized at time t:
∑ k=1 λt−k e2 ( k)
t
This approach discounts old measurements exponentially such that an
observation that is τ samples old carries a weight that is equal to λ τ times
the weight of the most recent observation. τ = 1 1−λ represents the memory
7-10
Algorithms for Recursive Estimation
horizon of this algorithm. Measurements older than τ = 1 1−λ typically carry a
weight that is less than about 0.3.
λ is called the forgetting factor and typically has a positive value between
0.97 and 0.995.
Note In the linear regression case, the forgetting factor algorithm is
known as the recursive least-squares (RLS) algorithm. The forgetting factor
algorithm for λ = 1 is equivalent to the Kalman filter algorithm with R1=0
and R2=1. For more information about the Kalman filter algorithm, see
“Kalman Filter Algorithm” on page 7-8.
Using the Forgetting Factor Algorithm
The general syntax for the command described in “Algorithms for Recursive
Estimation” on page 7-6 is the following:
[params,y_hat]=command(data,nn,adm,adg)
To specify the forgetting factor algorithm, set adm to 'ff' and adg to the
value of the forgetting factor λ (described in “Mathematics of the Forgetting
Factor Algorithm” on page 7-10).
Tip λ typically has a positive value from 0.97 to 0.995.
Unnormalized and Normalized Gradient Algorithms
• “Mathematics of the Unnormalized and Normalized Gradient Algorithm”
on page 7-12
• “Using the Unnormalized and Normalized Gradient Algorithms” on page
7-12
7-11
7
Recursive Techniques for Model Identification
Mathematics of the Unnormalized and Normalized Gradient
Algorithm
In the linear regression case, the gradient methods are also known as the
least mean squares (LMS) methods.
The following set of equations summarizes the unnormalized gradient and
normalized gradient adaptation algorithm:
θˆ ( t ) = θˆ ( t − 1) + K ( t ) ( y ( t ) − yˆ ( t ) )
yˆ ( t ) = ψ T ( t ) θˆ ( t − 1)
K (t) = Q (t) ψ (t)
In the unnormalized gradient approach, Q(t) is the product of the gain γ
and the identity matrix:
Q ( t ) = γI
In the normalized gradient approach, Q(t) is the product of the gain γ , and
the identity matrix is normalized by the magnitude of the gradient ψ ( t ) :
Q (t) =
γ
ψ (t)
2
I
These choices of Q(t) update the parameters in the negative gradient direction,
where the gradient is computed with respect to the parameters.
Using the Unnormalized and Normalized Gradient Algorithms
The general syntax for the command described in “Algorithms for Recursive
Estimation” on page 7-6 is the following:
[params,y_hat]=command(data,nn,adm,adg)
7-12
Algorithms for Recursive Estimation
To specify the unnormalized gain algorithm, set adm to 'ug' and adg to the
value of the gain γ (described in “Mathematics of the Unnormalized and
Normalized Gradient Algorithm” on page 7-12).
To specify the normalized gain algorithm, set adm to 'ng' and adg to the
value of the gain γ .
7-13
7
Recursive Techniques for Model Identification
Data Segmentation
For systems that exhibit abrupt changes while the data is being collected,
you might want to develop models for separate data segments such that the
system does not change during a particular data segment. Such modeling
requires identification of the time instants when the changes occur in the
system, breaking up the data into segments according to these time instants,
and identification of models for the different data segments.
The following cases are typical applications for data segmentation:
• Segmentation of speech signals, where each data segment corresponds
to a phonem.
• Detection of trend breaks in time series.
• Failure detection, where the data segments correspond to operation with
and without failure.
• Estimating different working modes of a system.
Use segment to build polynomial models, such as ARX, ARMAX, AR, and
ARMA, so that the model parameters are piece-wise constant over time. For
detailed information about this command, see the corresponding reference
page.
To see an example of using data segmentation, run the Recursive Estimation
and Data Segmentation demonstration by typing to the following command at
the prompt:
iddemo5
7-14
8
Model Analysis
• “Overview of Model Validation and Plots” on page 8-2
• “Using Model Output Plots to Validate and Compare Models” on page 8-8
• “Using Residual Analysis Plots to Validate Models” on page 8-16
• “Using Impulse- and Step-Response Plots to Validate Models” on page 8-24
• “Using Frequency-Response Plots to Validate Models” on page 8-32
• “Creating Noise-Spectrum Plots” on page 8-40
• “Using Pole-Zero Plots to Validate Models” on page 8-47
• “Using Nonlinear ARX Plots to Validate Models” on page 8-52
• “Using Hammerstein-Wiener Plots to Validate Models” on page 8-56
• “Using Akaike’s Criteria to Validate Models” on page 8-61
• “Computing Model Uncertainty” on page 8-64
• “Troubleshooting Models” on page 8-67
• “Next Steps After Getting an Accurate Model” on page 8-72
8
Model Analysis
Overview of Model Validation and Plots
In this section...
“When to Validate Models” on page 8-2
“Ways to Validate Models” on page 8-2
“Data for Validating Models” on page 8-4
“Supported Model Plots” on page 8-4
“Plotting Models in the GUI” on page 8-5
“Getting Advice About Models” on page 8-7
When to Validate Models
After estimating each model, you can validate whether the model reproduces
system behavior within acceptable bounds. You iterate between estimation
and validation until you find the simplest model that best captures the system
dynamics.
For ideas on how to adjust your modeling strategy based on validation results,
see “Troubleshooting Models” on page 8-67.
Tip If you have installed the Control System Toolbox product, you can also
view models using the LTI Viewer. For more information, see “Viewing Model
Response Using the LTI Viewer” on page 10-5.
Ways to Validate Models
You can use the following approaches to validate models:
• Comparing simulated or predicted model output to measured output.
See “Using Model Output Plots to Validate and Compare Models” on page
8-8.
• Analyzing autocorrelation and cross-correlation of the residuals with input.
See “Using Residual Analysis Plots to Validate Models” on page 8-16.
8-2
Overview of Model Validation and Plots
• Analyzing model response. For more information, see the following:
-
“Using Impulse- and Step-Response Plots to Validate Models” on page
8-24
-
“Using Frequency-Response Plots to Validate Models” on page 8-32
For information about the response of the noise model, see “Creating
Noise-Spectrum Plots” on page 8-40.
• Plotting the poles and zeros of the linear parametric model.
For more information, see “Using Pole-Zero Plots to Validate Models” on
page 8-47.
• Comparing the response of nonparametric models, such as impulse-, step-,
and frequency-response models, to parametric models, such as linear
polynomial models, state-space model, and nonlinear parametric models.
Note Do not use this comparison when feedback is present in the system
because feedback makes nonparametric models unreliable. To test if
feedback is present in the system, use the advice command on the data.
• Compare models using Akaike Information Criterion or Akaike Final
Prediction Error.
For more information, see the aic and fpe reference page.
• Plotting linear and nonlinear blocks of Hammerstein-Wiener and nonlinear
ARX models.
For more information, see “Using Hammerstein-Wiener Plots to Validate
Models” on page 8-56 and “Using Nonlinear ARX Plots to Validate Models”
on page 8-52.
Displaying confidence intervals on supported plots helps you assess the
uncertainty of model parameters. For more information, see “Computing
Model Uncertainty” on page 8-64.
8-3
8
Model Analysis
Data for Validating Models
For plots that compare model response to measured response, such as model
output and residual analysis plots, you designate two types of data sets: one
for estimating the models (estimation data), and the other for validating the
models (validation data). Although you can designate the same data set to be
used for estimating and validating the model, you risk overfitting your data.
When you validate a model using an independent data set, this process is
called cross-validation.
Note Validation data should be the same in frequency content as the
estimation data. If you detrended the estimation data, you must remove the
same trend from the validation data. For more information about detrending,
see “Subtracting Trends from Signals (Detrending)” on page 1-94.
Supported Model Plots
The following table summarizes the types of supported model plots.
Plot Type
Supported Models
Learn More
Model Output
All linear and nonlinear
models
“Using Model Output
Plots to Validate and
Compare Models” on
page 8-8
Residual Analysis
All linear and nonlinear
models
“Using Residual
Analysis Plots to
Validate Models” on
page 8-16
Transient Response
• All linear parametric
models
“Using Impulse- and
Step-Response Plots to
Validate Models” on
page 8-24
• Correlation analysis
(nonparametric)
models
• For nonlinear
models, only step
response.
8-4
Overview of Model Validation and Plots
Plot Type
Supported Models
Learn More
Frequency Response
• All linear parametric
models
“Using
Frequency-Response
Plots to Validate
Models” on page 8-32
• Spectral analysis
(nonparametric)
models
Noise Spectrum
• All linear parametric
models
• Spectral analysis
(nonparametric)
models
“Creating
Noise-Spectrum Plots”
on page 8-40
Poles and Zeros
All linear parametric
models
“Using Pole-Zero Plots
to Validate Models” on
page 8-47
Nonlinear ARX
Nonlinear ARX models
only
“Using Nonlinear
ARX Plots to Validate
Models” on page 8-52
Hammerstein-Wiener
Hammerstein-Wiener
models only
“Using
Hammerstein-Wiener
Plots to Validate
Models” on page 8-56
Plotting Models in the GUI
To create one or more plots of your models, select the corresponding check box
in the Model Views area of the System Identification Tool GUI. An active
model icon has a thick line in the icon, while an inactive model has a thin line.
Only active models appear on the selected plots.
To include or exclude a model on a plot, click the corresponding icon in the
System Identification Tool GUI. Clicking the model icon updates any plots
that are currently open.
8-5
8
Model Analysis
For example, in the following figure, Model output is selected. In this case,
the models n4s4 is not included on the plot because only arx441 is active.
Active model
Inactive model
Plots the model
output of active
models.
Plots Include Only Active Models
To close a plot, clear the corresponding check box in the System Identification
Tool GUI.
Tip To get information about a specific plot, select a help topic from the Help
menu in the plot window.
For general information about working with plots in the System Identification
Toolbox product , see “Working with Plots in the System Identification Tool
GUI” on page 12-15.
8-6
Overview of Model Validation and Plots
Getting Advice About Models
Use the advice command on an estimated model to answer the following
questions about the model:
• Should I increase or decrease the model order?
• Should I estimate a noise model?
• Is feedback present?
8-7
8
Model Analysis
Using Model Output Plots to Validate and Compare Models
In this section...
“Supported Model Types” on page 8-8
“What Does a Model Output Plot Show?” on page 8-8
“Choosing Simulated or Predicted Output” on page 8-9
“How to Plot Model Output Using the GUI” on page 8-11
“Displaying the Confidence Interval” on page 8-13
“How to Plot and Compare Model Output at the Command Line” on page
8-14
Supported Model Types
You can validate linear parametric models and nonlinear models by checking
how well the simulated or predicted output of the model matches the
measured output.
Note For nonparametric models, including impulse-response, step-response,
and frequency-response models, model output plots are not available. For
time-series models, you can only generate model-output plots for parametric
models using time-domain time-series (no input) measured data.
What Does a Model Output Plot Show?
The model output plot shows different information depending on the domain
of the input-output validation data, as follows:
• For time-domain validation data, the plot shows simulated or predicted
model output.
• For frequency-domain data, the plot shows the simulated complex-valued
amplitude of the model output. The complex-valued amplitude is equal to
the product of the Fourier transform of the input and the model frequency
function.
8-8
Using Model Output Plots to Validate and Compare Models
• For frequency-response data, the plot shows the simulated amplitude of the
model frequency response.
For linear models, you can estimate a model using time-domain data, and
then validate the model using frequency domain data. For nonlinear models,
you can only use time-domain data for both estimation and validation.
The following figure shows a sample Model Output plot, created in the System
Identification Tool GUI.
Choosing Simulated or Predicted Output
How you validate the model output should match how you plan to use the
model. If you plan to use the model for simulation applications, validate the
model by comparing simulated output to the validation data. Using a model
for prediction is common in controls applications where you want to predict
output for a specific number of steps in advance. For example, if you are
modeling a plant for a control system, your model must perform for prediction
over a horizon that corresponds to the time-constant of the system.
8-9
8
Model Analysis
The main difference between simulation and prediction is whether the toolbox
uses measured or computed previous outputs for computing the next output.
Note Output-error models, obtained by fixing K to zero for state-space
models and setting na=nc=nd=0 for polynomial models, do not use past
outputs. Therefore, for these models, the simulated and the predicted outputs
are the same for any value of k.
Simulating a model means that you compute the response of a model to
a particular input. Then, the toolbox feeds this computed output into the
differential (continuous-time) or difference (discrete-time) equation for
calculating the next output value. In this way, the simulation progresses
using previously calculated outputs in the difference equation to produce
the next output; with an infinite prediction horizon (k=∞), the simulation
has no limit on how far out in time it computes output values. Simulating
models uses the input-data values from the validation data set to compute
the output values.
Simulating models uses only past input values to compute the output values.
If the model-output expression includes past outputs, the toolbox computes
the first output value using the initial conditions and the inputs. Then, the
toolbox feeds this computed output into the difference equation or differential
equation for calculating the next output value. Thus, no past outputs are used
in the computation of output at the current time.
Simulation always uses a discrete model and continuous-time models are
discretized for simulation purposes. Simulation does not involve the noise
model unless you explicitly specify to compute the response to the noise source
input. During simulation, the toolbox computes the first output value using
the initial conditions and the inputs.
Predicting future outputs of a model from previous data over a time horizon of
k samples or kTs time units—where Ts is the sampling interval and k is the
prediction horizon—requires both past inputs and past outputs.
During prediction, the algorithm uses both the measured and the calculated
output data values in the difference equation for computing the next output.
The predicted value y(t) is computed from all available inputs u(s), where
8-10
Using Model Output Plots to Validate and Compare Models
s ≤ t , and all available outputs y(s), where s ≤ ( t − k ) . The argument s
represents the data sample number.
To make sure that the model picks up important dynamic properties, let the
predicted time horizon kT be larger than the system time constants, where
T is the sampling interval.
Note Prediction with k=∞ means that no previous inputs are used in the
computation and prediction matches simulation.
To learn how to display simulated or predicted output, see the description of
the plot settings in “How to Plot Model Output Using the GUI” on page 8-11.
How to Plot Model Output Using the GUI
To create a model output plot for parametric linear and nonlinear models in
the System Identification Tool GUI, select the Model output check box in
the Model Views area. For general information about creating and working
with plots, see “Working with Plots in the System Identification Tool GUI” on
page 12-15.
To include or exclude a model on the plot, click the corresponding model icon
in the System Identification Tool GUI. Active models display a thick line
inside the Model Board icon.
The right side of the plot displays the percentage of the output that the model
reproduces (Best Fit), computed using the following equation:
⎛
y − yˆ
Best Fit = ⎜⎜ 1 −
y− y
⎝
⎞
⎟⎟ × 100
⎠
In this equation, y is the measured output, yˆ is the simulated or predicted
model output, and y is the mean of y. 100% corresponds to a perfect fit,
and 0% indicates that the fit is no better than guessing the output to be a
constant ( yˆ = y ).
8-11
8
Model Analysis
Because of the definition of Best Fit, it is possible for this value to be negative.
A negative best fit is worse than 0% and can occur for the following reasons:
• The estimation algorithm failed to converge.
• The model was not estimated by minimizing y − yˆ . Best Fit can
be negative when you minimized 1-step-ahead prediction during the
estimation, but validate using the simulated output yˆ .
• The validation data set was not preprocessed in the same way as the
estimation data set.
The following table summarizes the Model Output plot settings.
Model Output Plot Settings
Action
Command
Display confidence intervals.
• To display the dashed lines on
either side of the nominal model
curve, select Options > Show
confidence intervals. Select
this option again to hide the
confidence intervals.
Note Confidence intervals are only
available for simulated model output
of linear models. Confidence internal
are not available for nonlinear ARX
and Hammerstein-Wiener models.
• To change the confidence
value, select Options > Set %
confidence level, and choose a
value from the list.
• To enter your own confidence
level, select Options > Set
confidence level > Other.
Enter the value as a probability
(between 0 and 1) or as the
number of standard deviations of
a Gaussian distribution.
8-12
Using Model Output Plots to Validate and Compare Models
Model Output Plot Settings (Continued)
Action
Command
Change between simulated output
or predicted output.
• Select Options > Simulated
output or Options > k step
ahead predicted output.
Note Prediction is only available
for time-domain validation data.
• To change the prediction horizon,
select Options > Set prediction
horizon, and select the number
of samples.
• To enter your own prediction
horizon, select Options > Set
prediction horizon > Other.
Enter the value in terms of the
number of samples.
Display the actual output values
(Signal plot), or the difference
between model output and measured
output (Error plot).
Select Options > Signal plot or
Options > Error plot.
(Time-domain validation data only)
Set the time range for model output
and the time interval for which the
Best Fit value is computed.
Select Options > Customized time
span for fit and enter the minimum
and maximum time values. For
example:
[1 20]
(Multiple-output system only)
Select a different output.
Select the output by name in the
Channel menu.
Displaying the Confidence Interval
In the GUI, you can display a confidence interval on the plot to gain insight
into the quality of a linear model. To learn how to show or hide confidence
interval, see the description of the plot settings in “How to Plot Model Output
Using the GUI” on page 8-11.
The confidence interval corresponds to the range of output values with a
specific probability of being the actual output of the system. The toolbox uses
8-13
8
Model Analysis
the estimated uncertainty in the model parameters to calculate confidence
intervals and assumes the estimates have a Gaussian distribution.
For example, for a 95% confidence interval, the region around the nominal
curve represents the range of values that have a 95% probability of being the
true system response. You can specify the confidence interval as a probability
(between 0 and 1) or as the number of standard deviations of a Gaussian
distribution. For example, a probability of 0.99 (99%) corresponds to 2.58
standard deviations.
Note The calculation of the confidence interval assumes that the model
sufficiently describes the system dynamics and the model residuals pass
independence tests.
How to Plot and Compare Model Output at the
Command Line
You can plot simulated and predicted model output using the compare, sim,
and predict commands.
Simulation and prediction require input data, a model, and the values of
the initial states. If you estimated the model using one data set, but want
to simulate the model using a different data set, the initial states of your
simulation must be consistent with the data you use for simulation.
Note compare automatically estimates the initial states from the data and
ensures consistency.
By default, sim and predict use the initial states that were derived from the
data you used to estimate the model. These initial states are not appropriate
if you are simulating or predicting output using new data.
To use sim or predict with a data set that differs from the data you used to
estimate the model, first estimate the new initial states X0est from the data
using findstates:
8-14
Using Model Output Plots to Validate and Compare Models
X0est=findstates(model,data)
Next, specify the estimated initial states X0est as an argument in sim or
predict. For example:
y=sim(model,data,'InitialState',X0est)
Command
Description
Example
compare
Plots simulated or
predicted model
output on top of the
measured output.
You should use
an independent
validation data set
as input to the model.
To plot five-step-ahead
predicted output of the model
mod against the validation
data data, use the following
command:
compare(data,mod,5)
Note Omitting the third
argument assumes an
infinite horizon and results in
simulation.
sim
Plots simulated model
output only.
To simulate the response of
the model model using input
data data, use the following
command:
sim(model,data)
predict
Plots predicted model
output only.
To perform one-step-ahead
prediction of the response for
the model model and input
data data, use the following
command:
predict(model,data,1)
8-15
8
Model Analysis
Using Residual Analysis Plots to Validate Models
In this section...
“What Is Residual Analysis?” on page 8-16
“Supported Model Types” on page 8-17
“What Does the Residuals Plot Show?” on page 8-17
“Displaying the Confidence Interval” on page 8-18
“How to Plot Residuals Using the GUI” on page 8-19
“How to Plot Residuals at the Command Line” on page 8-21
“Example – Examining Model Residuals” on page 8-21
What Is Residual Analysis?
Residuals are differences between the one-step-predicted output from the
model and the measured output from the validation data set. Thus, residuals
represent the portion of the validation data not explained by the model.
Residual analysis consists of two tests: the whiteness test and the
independence test.
According to the whiteness test criteria, a good model has the residual
autocorrelation function inside the confidence interval of the corresponding
estimates, indicating that the residuals are uncorrelated.
According to the independence test criteria, a good model has residuals
uncorrelated with past inputs. Evidence of correlation indicates that the
model does not describe how part of the output relates to the corresponding
input. For example, a peak outside the confidence interval for lag k means
that the output y(t) that originates from the input u(t-k) is not properly
described by the model.
Your model should pass both the whiteness and the independence tests,
except in the following cases:
8-16
Using Residual Analysis Plots to Validate Models
• For output-error (OE) models and when using instrumental-variable (IV)
methods, make sure that your model shows independence of e and u, and
pay less attention to the results of the whiteness of e.
In this case, the modeling focus is on the dynamics G and not the
disturbance properties H.
• Correlation between residuals and input for negative lags, is not necessarily
an indication of an inaccurate model.
When current residuals at time t affect future input values, there might
be feedback in your system. In the case of feedback, concentrate on the
positive lags in the cross-correlation plot during model validation.
Supported Model Types
You can validate parametric linear and nonlinear models by checking the
behavior of the model residuals. For a description of residual analysis, see
“What Does the Residuals Plot Show?” on page 8-17.
Note For nonparametric models, including impulse-response, step-response,
and frequency-response models, residual analysis plots are not available. For
time-series models, you can only generate model-output plots for parametric
models using time-domain time-series (no input) measured data.
What Does the Residuals Plot Show?
Residual analysis plots show different information depending on whether you
use time-domain or frequency-domain input-output validation data.
For time-domain validation data, the plot shows the following two axes:
• Autocorrelation function of the residuals for each output
• Cross-correlation between the input and the residuals for each input-output
pair
Note For time-series models, the residual analysis plot does not provide
any input-residual correlation plots.
8-17
8
Model Analysis
For frequency-domain validation data, the plot shows the following two axes:
• Estimated power spectrum of the residuals for each output
• Transfer-function amplitude from the input to the residuals for each
input-output pair
For linear models, you can estimate a model using time-domain data, and
then validate the model using frequency domain data. For nonlinear models,
the System Identification Toolbox product supports only time-domain data.
The following figure shows a sample Residual Analysis plot, created in the
System Identification Tool GUI.
Displaying the Confidence Interval
You can display a confidence interval on the plot in the GUI to gain insight
into the quality of the model. To learn how to show or hide confidence
interval, see the description of the plot settings in “How to Plot Residuals
Using the GUI” on page 8-19.
8-18
Using Residual Analysis Plots to Validate Models
Note If you are working in the System Identification Tool GUI, you can
specify a custom confidence interval. If you are using the resid command, the
confidence interface is fixed at 99%.
The confidence interval corresponds to the range of residual values with a
specific probability of being statistically insignificant for the system. The
toolbox uses the estimated uncertainty in the model parameters to calculate
confidence intervals and assumes the estimates have a Gaussian distribution.
For example, for a 95% confidence interval, the region around zero represents
the range of residual values that have a 95% probability of being statistically
insignificant. You can specify the confidence interval as a probability
(between 0 and 1) or as the number of standard deviations of a Gaussian
distribution. For example, a probability of 0.99 (99%) corresponds to 2.58
standard deviations.
How to Plot Residuals Using the GUI
To create a residual analysis plot for parametric linear and nonlinear models
in the System Identification Tool GUI, select the Model resids check box in
the Model Views area. For general information about creating and working
with plots, see “Working with Plots in the System Identification Tool GUI” on
page 12-15.
To include or exclude a model on the plot, click the corresponding model icon
in the System Identification Tool GUI. Active models display a thick line
inside the Model Board icon.
The following table summarizes the Residual Analysis plot settings.
8-19
8
Model Analysis
Residual Analysis Plot Settings
Action
Command
Display confidence
intervals around zero.
• To display the dashed lines on either
side of the nominal model curve, select
Options > Show confidence intervals.
Select this option again to hide the
confidence intervals.
Note Confidence internal
are not available for
nonlinear ARX and
Hammerstein-Wiener
models.
Change the number of lags
(data samples) for which
to compute autocorellation
and cross-correlation
functions.
• To change the confidence value, select
Options > Set % confidence level and
choose a value from the list.
• To enter your own confidence level, select
Options > Set confidence level > Other.
Enter the value as a probability (between
0 and 1) or as the number of standard
deviations of a Gaussian distribution.
• Select Options > Number of lags and
choose the value from the list.
• To enter your own lag value, select
Options > Set confidence level > Other.
Enter the value as the number of data
samples.
Note For
frequency-domain
validation data, increasing
the number of lags
increases the frequency
resolution of the residual
spectrum and the transfer
function.
(Multiple-output system
only)
Select a different
input-output pair.
8-20
Select the input-output by name in the
Channel menu.
Using Residual Analysis Plots to Validate Models
How to Plot Residuals at the Command Line
The following table summarizes commands that generate residual-analysis
plots for linear and nonlinear models. For detailed information about this
command, see the corresponding reference page.
Note Apply pe and resid to one model at a time.
Command
Description
Example
pe
Computes and plots model
prediction errors.
To plot the prediction
errors for the model model
using data data, type the
following command:
pe(model,data)
resid
Performs whiteness and
independence tests on model
residuals, or prediction
errors. Uses validation data
input as model input.
To plot residual correlations
for the model model using
data data, type the following
command:
resid(model,data)
Example – Examining Model Residuals
This example shows how you can use residual analysis to evaluate model
quality.
Creating Residual Plots
1 To load the sample System Identification Tool session that contains
estimated models, type the following command in the MATLAB Command
Window:
ident('dryer2_linear_models')
2 To generate a residual analysis plot, select the Model resids check box in
the System Identification Tool GUI.
8-21
8
Model Analysis
This opens an empty plot.
3 In the System Identification Tool window, click each model icon to display
it on the Residual Analysis plot.
Description of the Residual Plot Axes
The top axes show the autocorrelation of residuals for the output (whiteness
test). The horizontal scale is the number of lags, which is the time difference
(in samples) between the signals at which the correlation is estimated. The
horizontal dashed lines on the plot represent the confidence interval of the
corresponding estimates. Any fluctuations within the confidence interval are
considered to be insignificant. Two of the models, n4s3 and arx223, produce
residuals that enter outside the confidence interval. A good model should have
a residual autocorrelation function within the confidence interval, indicating
that the residuals are uncorrelated.
The bottom axes show the cross-correlation of the residuals with the
input. A good model should have residuals uncorrelated with past inputs
(independence test). Evidence of correlation indicates that the model does not
8-22
Using Residual Analysis Plots to Validate Models
describe how the output is formed from the corresponding input. For example,
when there is a peak outside the confidence interval for lag k, this means that
the contribution to the output y(t) that originates from the input u(t-k) is
not properly described by the model. The models arxqs and amx2222 extend
beyond the confidence interval and do not perform as well as the other models.
Validating Models Using Analyzing Residuals
To remove models with poor performance from the Residual Analysis plot,
click the model icons arxqs, n4s3, arx223, and amx2222 in the System
Identification Tool GUI.
The Residual Analysis plot now includes only the three models that pass the
residual tests: arx692, n4s6, and amx3322.
The plots for these models fall within the confidence intervals. Thus, when
choosing the best model among several estimated models, it is reasonable to
pick amx3322 because it is a simpler, low-order model.
8-23
8
Model Analysis
Using Impulse- and Step-Response Plots to Validate
Models
In this section...
“Supported Models” on page 8-24
“How Transient Response Helps to Validate Models” on page 8-24
“What Does a Transient Response Plot Show?” on page 8-25
“How to Plot Impulse and Step Response Using the GUI” on page 8-26
“Displaying the Confidence Interval” on page 8-29
“How to Plot Impulse and Step Response at the Command Line” on page
8-30
Supported Models
You can plot the simulated response of a model using impulse and step
signals as the input for all linear parametric models and correlation analysis
(nonparametric) models.
You can also create step-response plots for nonlinear models. These step
and impulse response plots, also called transient response plots, provide
insight into the characteristics of model dynamics, including peak response
and settling time.
Note For frequency-response models, impulse- and step-response plots are
not available. For nonlinear models, only step-response plots are available.
How Transient Response Helps to Validate Models
Transient response plots provide insight into the basic dynamic properties of
the model, such as response times, static gains, and delays.
Transient response plots also help you validate how well a linear parametric
model, such as a linear ARX model or a state-space model, captures the
dynamics. For example, you can estimate an impulse or step response from
the data using correlation analysis (nonparametric model), and then plot the
8-24
Using Impulse- and Step-Response Plots to Validate Models
correlation analysis result on top of the transient responses of the parametric
models.
Because nonparametric and parametric models are derived using different
algorithms, agreement between these models increases confidence in the
parametric model results.
What Does a Transient Response Plot Show?
Transient response plots show the value of the impulse or step response on
the vertical axis. The horizontal axis is in units of time you specified for the
data used to estimate the model.
The impulse response of a dynamic model is the output signal that results
when the input is an impulse. That is, u(t) is zero for all values of t except at
t=0, where u(0)=1. In the following difference equation, you can compute the
impulse response by setting y(-T)=y(-2T)=0, u(0)=1, and u(t>0)=0.
y(t) − 1.5 y(t − T ) + 0.7 y(t − 2T ) =
0.9u(t) + 0.5u(t − T )
The step response is the output signal that results from a step input, where
u(t<0)=0 and u(t>0)=1.
If your model includes a noise model, you can display the transient response
of the noise model associated with each output channel. For more information
about how to display the transient response of the noise model, see “How to
Plot Impulse and Step Response Using the GUI” on page 8-26.
The following figure shows a sample Transient Response plot, created in
the System Identification Tool GUI.
8-25
8
Model Analysis
How to Plot Impulse and Step Response Using the
GUI
To create a transient analysis plot in the System Identification Tool GUI,
select the Transient resp check box in the Model Views area. For general
information about creating and working with plots, see “Working with Plots
in the System Identification Tool GUI” on page 12-15.
To include or exclude a model on the plot, click the corresponding model icon
in the System Identification Tool GUI. Active models display a thick line
inside the Model Board icon.
The following table summarizes the Transient Response plot settings.
Transient Response Plot Settings
8-26
Action
Command
Display step response for linear
or nonlinear model.
Select Options > Step response.
Using Impulse- and Step-Response Plots to Validate Models
Transient Response Plot Settings (Continued)
Action
Command
Display impulse response for
linear model.
Select Options > Impulse response.
Note Not available for nonlinear
models.
Display the confidence interval.
Note Only available for linear
models.
• To display the dashed lines on either
side of the nominal model curve,
select Options > Show confidence
intervals. Select this option again to
hide the confidence intervals.
• To change the confidence value, select
Options > Set % confidence level,
and choose a value from the list.
• To enter your own confidence level,
select Options > Set confidence
level > Other. Enter the value as a
probability (between 0 and 1) or as
the number of standard deviations of
a Gaussian distribution.
8-27
8
Model Analysis
Transient Response Plot Settings (Continued)
Action
Command
Change time span over which
the impulse or step response is
calculated. For a scalar time
span T, the resulting response is
plotted from -T/4 to T.
• Select Options > Time span (time
units), and choose a new time span
in units of time you specified for the
model.
Note To change the time span
of models you estimated using
correlation analysis models,
select Estimate > Correlation
models and reestimate the
model using a new time span.
Toggle between line plot or stem
plot.
Tip Use a stem plot for
displaying impulse response.
8-28
• To enter your own time span,
select Options > Time span (time
units) > Other, and enter the total
response duration.
• To use the time span based on model
dynamics, type [] or default.
The default time span is computed
based on the model dynamics and
might be different for different
models. For nonlinear models, the
default time span is 10.
Select Style > Line plot or
Style > Stem plot.
Using Impulse- and Step-Response Plots to Validate Models
Transient Response Plot Settings (Continued)
Action
Command
(Multiple-output system only)
Select an input-output pair
to view the noise spectrum
corresponding to those channels.
Select the output by name in the
Channel menu.
(Step response for nonlinear
models only)
Set level of the input step.
If the plotted models include a noise
model, you can display the transient
response properties associated with
each output channel. The name of the
channel has the format e@OutputName,
where OutputName is the name of the
output channel corresponding to the
noise model.
Select Options > Step Size, and then
chose from two options:
• 0–>1 sets the lower level to 0 and the
upper level to 1.
Note For multiple-input models,
the input-step level applies only
to the input channel you selected
to display in the plot.
• Other opens the Step Level dialog
box, where you enter the values for
the lower and upper level values.
Displaying the Confidence Interval
In addition to the transient-response curve, you can display a confidence
interval on the plot. To learn how to show or hide confidence interval, see the
description of the plot settings in “How to Plot Impulse and Step Response
Using the GUI” on page 8-26.
The confidence interval corresponds to the range of response values with a
specific probability of being the actual response of the system. The toolbox
uses the estimated uncertainty in the model parameters to calculate
confidence intervals and assumes the estimates have a Gaussian distribution.
For example, for a 95% confidence interval, the region around the nominal
curve represents the range of values that have a 95% probability of being the
8-29
8
Model Analysis
true system response. You can specify the confidence interval as a probability
(between 0 and 1) or as the number of standard deviations of a Gaussian
distribution. For example, a probability of 0.99 (99%) corresponds to 2.58
standard deviations.
Note The calculation of the confidence interval assumes that the model
sufficiently describes the system dynamics and the model residuals pass
independence tests.
How to Plot Impulse and Step Response at the
Command Line
You can plot impulse- and step-response plots using the impulse and step
commands, respectively.
All plot commands have the same basic syntax, as follows:
• To plot one model, use the syntax command(model).
• To plot several models, use the syntax
command(model1,model2,...,modelN).
In this case, command represents any of the plotting commands.
To display confidence intervals for a specified number of standard deviations,
use the following syntax:
command(model,'sd',sd)
where sd is the number of standard deviations of a Gaussian distribution. For
example, a confidence value of 99% for the nominal model curve corresponds
to 2.58 standard deviations.
To display a filled confidence region, use the following syntax:
command(model,'sd',sd,'fill')
8-30
Using Impulse- and Step-Response Plots to Validate Models
The following table summarizes commands that generate impulse- and
step-response plots. For detailed information about each command, see the
corresponding reference page.
Command
Description
Example
impulse
Plots impulse response
for idpoly, idproc,
idarx, idss, and
idgrey model objects.
Estimates and plots
impulse response
models for iddata
objects.
To plot the impulse response
of the model mod, type the
following command:
impulse(mod)
Note Does not
support nonlinear
models.
step
Plots the step response
of all linear and
nonlinear models.
Estimates and plots
step response models
for iddata objects.
To plot the step response
of the model mod, type the
following command:
step(mod)
To specify step levels for a
nonlinear model, type the
following command:
step(mod,
'InputLevel',[u1;u2])
8-31
8
Model Analysis
Using Frequency-Response Plots to Validate Models
In this section...
“What Is Frequency Response?” on page 8-32
“How Frequency Response Helps to Validate Models” on page 8-33
“What Does a Frequency-Response Plot Show?” on page 8-34
“How to Plot Bode Plots Using the GUI” on page 8-35
“How to Plot Bode and Nyquist Plots at the Command Line” on page 8-38
What Is Frequency Response?
Frequency response plots show the complex values of a transfer function as a
function of frequency.
In the case of linear dynamic systems, the transfer function G is essentially
an operator that takes the input u of a linear system to the output y:
y = Gu
For a continuous-time system, the transfer function relates the Laplace
transforms of the input U(s) and output Y(s):
Y (s) = G(s)U (s)
In this case, the frequency function G(iw) is the transfer function evaluated
on the imaginary axis s=iw.
For a discrete-time system sampled with a time interval T, the transfer
function relates the Z-transforms of the input U(z) and output Y(z):
Y ( z) = G( z)U ( z)
In this case, the frequency function G(eiwT) is the transfer function G(z)
evaluated on the unit circle. The argument of the frequency function G(eiwT)
8-32
Using Frequency-Response Plots to Validate Models
is scaled by the sampling interval T to make the frequency function periodic
with the sampling frequency 2π T .
How Frequency Response Helps to Validate Models
You can plot the frequency response of a model to gain insight into the
characteristics of linear model dynamics, including the frequency of the peak
response and stability margins. Frequency-response plots are available for all
linear parametric models and spectral analysis (nonparametric) models.
Note Frequency-response plots are not available for nonlinear models. In
addition, Nyquist plots do not support time-series models that have no input.
The frequency response of a linear dynamic model describes how the model
reacts to sinusoidal inputs. If the input u(t) is a sinusoid of a certain frequency,
then the output y(t) is also a sinusoid of the same frequency. However, the
magnitude of the response is different from the magnitude of the input signal,
and the phase of the response is shifted relative to the input signal.
Frequency response plots provide insight into linear systems dynamics, such
as frequency-dependent gains, resonances, and phase shifts. Frequency
response plots also contain information about controller requirements and
achievable bandwidths. Finally, frequency response plots can also help you
validate how well a linear parametric model, such as a linear ARX model or a
state-space model, captures the dynamics.
One example of how frequency-response plots help validate other models
is that you can estimate a frequency response from the data using spectral
analysis (nonparametric model), and then plot the spectral analysis result
on top of the frequency response of the parametric models. Because
nonparametric and parametric models are derived using different algorithms,
agreement between these models increases confidence in the parametric
model results.
8-33
8
Model Analysis
What Does a Frequency-Response Plot Show?
System Identification Tool GUI supports the following types of
frequency-response plots for linear parametric models, linear state-space
models, and nonparametric frequency-response models:
• Bode plot of the model response. A Bode plot consists of two plots. The top
plot shows the magnitude G by which the transfer function G magnifies
the amplitude of the sinusoidal input. The bottom plot shows the phase
ϕ = arg G by which the transfer function shifts the input. The input to
the system is a sinusoid, and the output is also a sinusoid with the same
frequency.
• Bode plot of the disturbance model, called noise spectrum. This plot is the
same as a Bode plot of the model response, but it shows the frequency
response of the noise model instead. For more information, see “Creating
Noise-Spectrum Plots” on page 8-40.
• (Only in the MATLAB Command Window)
Nyquist plot. Plots the imaginary versus the real part of the transfer
function.
The following figure shows a sample Bode plot of the model dynamics, created
in the System Identification Tool GUI.
8-34
Using Frequency-Response Plots to Validate Models
How to Plot Bode Plots Using the GUI
To create a frequency-response plot for parametric linear models in the System
Identification Tool GUI, select the Frequency resp check box in the Model
Views area. For general information about creating and working with plots,
see “Working with Plots in the System Identification Tool GUI” on page 12-15.
To include or exclude a model on the plot, click the corresponding model icon
in the System Identification Tool GUI. Active models display a thick line
inside the Model Board icon.
In addition to the frequency-response curve, you can display a confidence
interval on the plot. The confidence interval corresponds to the range of
response values with a specific probability of being the actual response of the
system. The toolbox uses the estimated uncertainty in the model parameters
to calculate confidence intervals and assumes the estimates have a Gaussian
distribution.
For example, for a 95% confidence interval, the region around the nominal
curve represents the range of values that have a 95% probability of being the
8-35
8
Model Analysis
true system response. You can specify the confidence interval as a probability
(between 0 and 1) or as the number of standard deviations of a Gaussian
distribution. For example, a probability of 0.99 (99%) corresponds to 2.58
standard deviations.
The following table summarizes the Frequency Function plot settings.
Frequency Function Plot Settings
Action
Command
Display the confidence
interval.
• To display the dashed lines on either
side of the nominal model curve, select
Options > Show confidence intervals.
Select this option again to hide the
confidence intervals.
• To change the confidence value, select
Options > Set % confidence level, and
choose a value from the list.
• To enter your own confidence level, select
Options > Set confidence level > Other.
Enter the value as a probability (between
0 and 1) or as the number of standard
deviations of a Gaussian distribution.
8-36
Using Frequency-Response Plots to Validate Models
Frequency Function Plot Settings (Continued)
Action
Command
Change the frequency
values for computing the
noise spectrum.
Select Options > Frequency range and
specify a new frequency vector in units of
rad/s.
The default frequency
vector is 128 linearly
distributed values, greater
than zero and less than
or equal to the Nyquist
frequency.
Enter the frequency vector using any one of
following methods:
• MATLAB expression, such as
[1:100]*pi/100 or logspace(-3,-1,200).
Cannot contain variables in the MATLAB
workspace.
• Row vector of values, such as [1:.1:100]
Note To restore the default frequency vector,
enter [].
Change frequency units
between hertz and radians
per second.
Select Style > Frequency (Hz) or
Style > Frequency (rad/s).
Change frequency scale
between linear and
logarithmic.
Select Style > Linear frequency scale or
Style > Log frequency scale.
8-37
8
Model Analysis
Frequency Function Plot Settings (Continued)
Action
Command
Change amplitude scale
between linear and
logarithmic.
Select Style > Linear amplitude scale or
Style > Log amplitude scale.
(Multiple-output system
only)
Select an input-output pair
to view the noise spectrum
corresponding to those
channels.
Select the output by name in the Channel
menu.
Note You cannot view
cross spectra between
different outputs.
How to Plot Bode and Nyquist Plots at the Command
Line
You can plot Bode and Nyquist plots for linear models using the bode, ffplot,
and nyquist commands.
All plot commands have the same basic syntax, as follows:
• To plot one model, use the syntax command(model).
• To plot several models, use the syntax
command(model1,model2,...,modelN).
In this case, command represents any of the plotting commands.
To display confidence intervals for a specified number of standard deviations,
use the following syntax:
command(model,'sd',sd)
8-38
Using Frequency-Response Plots to Validate Models
where sd is the number of standard deviations of a Gaussian distribution. For
example, a confidence value of 99% for the nominal model curve corresponds
to 2.58 standard deviations.
To display a filled confidence region, use the following syntax:
command(model,'sd',sd,'fill')
The following table summarizes commands that generate Bode and Nyquist
plots for linear models. For detailed information about each command and
how to specify the frequency values for computing the response, see the
corresponding reference page.
Command
Description
Example
bode
Plots the magnitude
and phase of the
frequency response on
a logarithmic frequency
scale.
To create the bode plot
of the model mod, use
the following command:
Plots the magnitude
and phase of the
frequency response
on a linear frequency
scale (hertz).
To create the bode plot
of the model mod, use
the following command:
Plots the imaginary
versus real part of the
transfer function.
To plot the frequency
response of the model
mod, use the following
command:
ffplot
nyquist
Note Does not support
time-series models.
bode(mod)
ffplot(mod)
nyquist(mod)
8-39
8
Model Analysis
Creating Noise-Spectrum Plots
In this section...
“Supported Models” on page 8-40
“What Does a Noise Spectrum Plot Show?” on page 8-40
“Displaying the Confidence Interval” on page 8-41
“How to Plot the Noise Spectrum Using the GUI” on page 8-42
“How to Plot the Noise Spectrum at the Command Line” on page 8-45
Supported Models
When you estimate the noise model of your linear system, you can plot the
spectrum of the estimated noise model. Noise-spectrum plots are available for
all linear parametric models and spectral analysis (nonparametric) models.
Note For nonlinear models and correlation analysis models, noise-spectrum
plots are not available. For time-series models, you can only generate
noise-spectrum plots for parametric and spectral-analysis models.
What Does a Noise Spectrum Plot Show?
The general equation of a linear dynamic system is given by:
y(t) = G( z)u(t) + v(t)
In this equation, G is an operator that takes the input to the output and
captures the system dynamics, and v is the additive noise term. The toolbox
treats the noise term as filtered white noise, as follows:
v(t) = H ( z) e(t)
The toolbox computes both H and λ during the estimation of the noise model
and stores these quantities as model properties. The H(z) operator represents
the noise model. e(t) is a white-noise source with variance λ .
8-40
Creating Noise-Spectrum Plots
Whereas the frequency-response plot shows the response of G, the
noise-spectrum plot shows the frequency-response of the noise model H.
For input-output models, the noise spectrum is given by the following
equation:
( )
Φ v (ω) = λ H eiω
2
For time-series models (no input), the vertical axis of the noise-spectrum plot
is the same as the dynamic model spectrum. These axes are the same because
there is no input for time series and y = He .
Note You can avoid estimating the noise model by selecting the Output-Error
model structure or by setting the DisturbanceModel property value to 'None'
for a state space model. If you choose to not estimate a noise model for
your system, then H and the noise spectrum amplitude are equal to 1 at all
frequencies.
Displaying the Confidence Interval
In addition to the noise-spectrum curve, you can display a confidence interval
on the plot. To learn how to show or hide confidence interval, see the
description of the plot settings in “How to Plot the Noise Spectrum Using
the GUI” on page 8-42.
The confidence interval corresponds to the range of power-spectrum values
with a specific probability of being the actual noise spectrum of the system.
The toolbox uses the estimated uncertainty in the model parameters to
calculate confidence intervals and assumes the estimates have a Gaussian
distribution.
For example, for a 95% confidence interval, the region around the nominal
curve represents the range of values that have a 95% probability of being the
true system noise spectrum. You can specify the confidence interval as a
probability (between 0 and 1) or as the number of standard deviations of a
8-41
8
Model Analysis
Gaussian distribution. For example, a probability of 0.99 (99%) corresponds
to 2.58 standard deviations.
Note The calculation of the confidence interval assumes that the model
sufficiently describes the system dynamics and the model residuals pass
independence tests.
How to Plot the Noise Spectrum Using the GUI
To create a noise spectrum plot for parametric linear models in the GUI,
select the Noise spectrum check box in the Model Views area. For general
information about creating and working with plots, see “Working with Plots
in the System Identification Tool GUI” on page 12-15.
To include or exclude a model on the plot, click the corresponding model icon
in the System Identification Tool GUI. Active models display a thick line
inside the Model Board icon.
The following figure shows a sample Noise Spectrum plot.
8-42
Creating Noise-Spectrum Plots
The following table summarizes the Noise Spectrum plot settings.
Noise Spectrum Plot Settings
Action
Command
Display the confidence
interval.
• To display the dashed lines on either side of the
nominal model curve, select Options > Show
confidence intervals. Select this option
again to hide the confidence intervals.
• To change the confidence value, select
Options > Set % confidence level, and
choose a value from the list.
• To enter your own confidence level, select
Options > Set confidence level > Other.
Enter the value as a probability (between 0
and 1) or as the number of standard deviations
of a Gaussian distribution.
8-43
8
Model Analysis
Noise Spectrum Plot Settings (Continued)
Action
Command
Change the frequency
values for computing
the noise spectrum.
Select Options > Frequency range and specify
a new frequency vector in units of radians per
second.
The default frequency
vector is 128 linearly
distributed values,
greater than zero and
less than or equal to the
Nyquist frequency.
Enter the frequency vector using any one of
following methods:
• MATLAB expression, such as [1:100]*pi/100
or logspace(-3,-1,200). Cannot contain
variables in the MATLAB workspace.
• Row vector of values, such as [1:.1:100]
Tip To restore the default frequency vector, enter
[].
8-44
Change frequency units
between hertz and
radians per second.
Select Style > Frequency (Hz) or
Style > Frequency (rad/s).
Change frequency scale
between linear and
logarithmic.
Select Style > Linear frequency scale or
Style > Log frequency scale.
Creating Noise-Spectrum Plots
Noise Spectrum Plot Settings (Continued)
Action
Command
Change amplitude scale
between linear and
logarithmic.
Select Style > Linear amplitude scale or
Style > Log amplitude scale.
(Multiple-output
system only)
Select an input-output
pair to view the noise
spectrum corresponding
to those channels.
Select the output by name in the Channel menu.
Note You cannot view
cross spectra between
different outputs.
How to Plot the Noise Spectrum at the Command Line
You can plot the frequency-response of the noise model.
First, select the portion of the model object that corresponds to the noise
model H. For example, to select the noise model in the model object m, type
the following command:
m_noise=m('noise')
Tip You can abbreviate the command to m_noise=m('n').
To plot the frequency-response of the noise model, use the bode command:
bode(m_noise)
To determine if your estimated noise model is good enough, you can compare
the frequency-response of the estimated noise-model H to the estimated
8-45
8
Model Analysis
frequency response of v(t). To compute v(t), which represents the actual noise
term in the system, use the following commands:
ysimulated = sim(m,data);
v = ymeasured-ysimulated;
ymeasured is data.y. v is the noise term v(t), as described in “What Does a
Noise Spectrum Plot Show?” on page 8-40 and corresponds to the difference
between the simulated response ysimulated and the actual response
ymeasured.
To compute the frequency-response model of the actual noise, use spa:
V = spa(v);
The toolbox uses the following equation to compute the noise spectrum of
the actual noise:
Φ v (ω) =
∞
∑
τ=−∞
Rv ( τ ) e−iωτ
The covariance function Rv is given in terms of E, which denotes the
mathematical expectation, as follows:
Rv ( τ ) = Ev ( t ) v ( t − τ )
To compare the parametric noise-model H to the (nonparametric)
frequency-response estimate of the actual noise v(t), use bode:
bode(V,m('noise'))
If the parametric and the nonparametric estimates of the noise spectra are
different, then you might need a higher-order noise model.
8-46
Using Pole-Zero Plots to Validate Models
Using Pole-Zero Plots to Validate Models
In this section...
“Supported Models” on page 8-47
“What Does a Pole-Zero Plot Show?” on page 8-47
“How to Plot Model Poles and Zeros Using the GUI” on page 8-48
“How to Plot Poles and Zeros at the Command Line” on page 8-50
“Reducing Model Order Using Pole-Zero Plots” on page 8-51
Supported Models
You can create pole-zero plots of linear input-output polynomial, state-space,
and grey-box models.
What Does a Pole-Zero Plot Show?
The general equation of a linear dynamic system is given by:
y(t) = G( z)u(t) + v(t)
In this equation, G is an operator that takes the input to the output and
captures the system dynamics, and v is the additive noise term.
The poles of a linear system are the roots of the denominator of the transfer
function G. The poles have a direct influence on the dynamic properties of
the system. The zeros are the roots of the numerator of G. If you estimated
a noise model H in addition to the dynamic model G, you can also view the
poles and zeros of the noise model.
Zeros and the poles are equivalent ways of describing the coefficients of a
linear difference equation, such as the ARX model. Poles are associated with
the output side of the difference equation, and zeros are associated with the
input side of the equation. The number of poles is equal to the number of
sampling intervals between the most-delayed and least-delayed output. The
number of zeros) is equal to the number of sampling intervals between the
8-47
8
Model Analysis
most-delayed and least-delayed input. For example, there two poles and one
zero in the following ARX model:
y(t) − 1.5 y(t − T ) + 0.7 y(t − 2T ) =
0.9u(t) + 0.5u(t − T )
The following figure shows a sample pole-zero plot of the model with
confidence intervals. x indicate poles and o indicate zeros.
How to Plot Model Poles and Zeros Using the GUI
To create a pole-zero plot for parametric linear models in the System
Identification Tool GUI, select the Zeros and poles check box in the Model
Views area. For general information about creating and working with plots,
see “Working with Plots in the System Identification Tool GUI” on page 12-15.
To include or exclude a model on the plot, click the corresponding model icon
in the System Identification Tool GUI. Active models display a thick line
inside the Model Board icon.
8-48
Using Pole-Zero Plots to Validate Models
In addition, you can display a confidence interval for each pole and zero on the
plot. The confidence interval corresponds to the range of pole or zero values
with a specific probability of being the actual pole or zero of the system. The
toolbox uses the estimated uncertainty in the model parameters to calculate
confidence intervals and assumes the estimates have a Gaussian distribution.
For example, for a 95% confidence interval, the region around the nominal
pole or zero value represents the range of values that have a 95% probability
of being the true system pole or zero value. You can specify the confidence
interval as a probability (between 0 and 1) or as the number of standard
deviations of a Gaussian distribution. For example, a probability of 0.99 (99%)
corresponds to 2.58 standard deviations.
The following table summarizes the Zeros and Poles plot settings.
Zeros and Poles Plot Settings
Action
Command
Display the confidence
interval.
• To display the dashed lines on either side
of the nominal pole and zero values, select
Options > Show confidence intervals.
Select this option again to hide the confidence
intervals.
• To change the confidence value, select
Options > Set % confidence level, and
choose a value from the list.
• To enter your own confidence level, select
Options > Set confidence level > Other.
Enter the value as a probability (between 0
and 1) or as the number of standard deviations
of a Gaussian distribution.
Show real and
imaginary axes.
Select Style > Re/Im-axes. Select this option
again to hide the axes.
8-49
8
Model Analysis
Zeros and Poles Plot Settings (Continued)
Action
Command
Show the unit circle.
Select Style > Unit circle. Select this option
again to hide the unit circle.
(Multiple-output system
only)
Select an input-output
pair to view the poles
and zeros corresponding
to those channels.
Select the output by name in the Channel menu.
How to Plot Poles and Zeros at the Command Line
You can create a pole-zero plot for linear polynomial, linear state-space, and
linear grey-box models using the pzmap command. pzmap lets you include
several models on a plot.
To display confidence intervals for a specified number of standard deviations,
use the following syntax:
pzmap(model,'sd',sd)
where sd is the number of standard deviations of a Gaussian distribution. For
example, a confidence value of 99% for the nominal model curve corresponds
to 2.58 standard deviations.
Command
Description
Example
pzmap
Plots zeros and poles
of the model on the
S-plane or Z-plane for
continuous-time or
discrete-time model,
respectively.
To plot the poles and
zeros of the model
mod, use the following
command:
pzmap(mod)
For detailed information about pzmap, see the corresponding reference page.
8-50
Using Pole-Zero Plots to Validate Models
Reducing Model Order Using Pole-Zero Plots
You can use pole-zero plots to evaluate whether it might be useful to reduce
model order. When confidence intervals for a pole-zero pair overlap, this
overlap indicates a possible pole-zero cancelation.
For example, you can use the following syntax to plot a 1-standard-deviation
confidence interval around model poles and zeros.
pzmap(model,'sd',1)
If poles and zeros overlap, try estimating a lower order model.
Always validate model output and residuals to see if the quality of the
fit changes after reducing model order. If the plot indicates pole-zero
cancellations, but reducing model order degrades the fit, then the extra
poles probably describe noise. In this case, you can choose a different model
structure that decouples system dynamics and noise. For example, try
ARMAX, Output-Error, or Box-Jenkins polynomial model structures with
an A or F polynomial of an order equal to that of the number of uncanceled
poles. For more information about estimating linear polynomial models, see
“Identifying Input-Output Polynomial Models” on page 3-41.
8-51
8
Model Analysis
Using Nonlinear ARX Plots to Validate Models
In this section...
“About Nonlinear ARX Plots” on page 8-52
“How to Plot Nonlinear ARX Plots Using the GUI” on page 8-52
“Configuring the Nonlinear ARX Plot” on page 8-53
“Axis Limits, Legend, and 3-D Rotation” on page 8-54
“How to Plot Nonlinear ARX Plots at the Command Line” on page 8-55
About Nonlinear ARX Plots
The Nonlinear ARX plot displays the characteristics of model nonlinearities
as a function of one or two regressors. For more information about estimating
nonlinear ARX models, see “Identifying Nonlinear ARX Models” on page 4-4.
Examining a nonlinear ARX plot can help you gain insight into which
regressors have the strongest effect on the model output. Understanding the
relative importance of the regressors on the output can help you decide which
regressors should be included in the nonlinear function.
Furthermore, you can create several nonlinear models for the same data
set using different nonlinearity estimators, such a wavelet network and
tree partition, and then compare the nonlinear surfaces of these models.
Agreement between nonlinear surfaces increases the confidence that these
nonlinear models capture the true dynamics of the system.
How to Plot Nonlinear ARX Plots Using the GUI
To create a nonlinear ARX plot in the System Identification Tool GUI, select
the Nonlinear ARX check box in the Model Views area. For general
information about creating and working with plots, see “Working with Plots
in the System Identification Tool GUI” on page 12-15.
Note The Nonlinear ARX check box is unavailable if you do not have a
nonlinear ARX model in the Model Board.
8-52
Using Nonlinear ARX Plots to Validate Models
The following figure shows a sample nonlinear ARX plot.
Configuring the Nonlinear ARX Plot
To include or exclude a model on the plot, click the corresponding model icon
in the System Identification Tool GUI. Active models display a thick line
inside the Model Board icon.
To configure the plot:
1 If your model contains multiple output, select the output channel in the
Select nonlinearity at output list. Selecting the output channel displays
the nonlinearity values that correspond to this output channel.
2 If the regressor selection options are not visible, click
to expand the
Nonlinear ARX Model Plot window.
8-53
8
Model Analysis
3 Select Regressor 1 from the list of available regressors. In the Range
field, enter the range of values to include on the plot for this regressor. The
regressor values are plotted on the Reg1 axis.
4 Specify a second regressor for a 3-D plot by selecting one of the following
types of options:
• Select Regressor 2 to display three axes. In the Range field, enter the
range of values to include on the plot for this regressor. The regressor
values are plotted on the Reg2 axis.
• Select <none> in the Regressor 2 list to display only two axes.
5 To fix the values of the regressor that are not displayed, click Fix Values.
In the Fix Regressor Values dialog box, double-click the Value cell to edit
the constant value of the corresponding regressor. The default values are
determined during model estimation. Click OK.
6 In the Nonlinear ARX Model Plot window, click Apply to update the plot.
7 To change the grid of the regressor space along each axis, Options > Set
number of samples, and enter the number of samples to use for each
regressor. Click Apply and then Close.
For example, if the number of samples is 20, each regressor variable
contains 20 points in its specified range. For a 3-D plots, this results in
evaluating the nonlinearity at 20 x 20 = 400 points.
Axis Limits, Legend, and 3-D Rotation
The following table summarizes the commands to modify the appearance
of the Nonlinear ARX plot.
Changing Appearance of the Nonlinear ARX Plot
8-54
Action
Command
Change axis limits.
Select Options > Set axis limits to
open the Axis Limits dialog box, and
edit the limits. Click Apply.
Using Nonlinear ARX Plots to Validate Models
Changing Appearance of the Nonlinear ARX Plot (Continued)
Action
Command
Hide or show the legend.
Select Style > Legend. Select this
option again to show the legend.
(Three axes only)
Rotate in three dimensions.
Select Style > 3D Rotate and
drag the axes on the plot to
a new orientation. To disable
three-dimensional rotation, select
Style > 3D Rotate again.
Note Available only when you
have selected two regressors as
independent variables.
How to Plot Nonlinear ARX Plots at the Command
Line
You can plot the nonlinearity shape of nonlinear ARX models using the
following syntax:
plot(model)
model must be an idnlarx model object. You can use additional plot
arguments to specify the following information:
• Include multiple nonlinear ARX models on the plot.
• Configure the regressor values for computing the nonlinearity values.
The plot command opens the Nonlinear ARX Model Plot window. For
more information about working with this plot window, see “Configuring
the Nonlinear ARX Plot” on page 8-53 and “Axis Limits, Legend, and 3-D
Rotation” on page 8-54.
For detailed information about plot, type the following command at the
prompt:
help idnlarx/plot
8-55
8
Model Analysis
Using Hammerstein-Wiener Plots to Validate Models
In this section...
“About Hammerstein-Wiener Plots” on page 8-56
“How to Create Hammerstein-Wiener Plots in the GUI” on page 8-56
“How to Plot Hammerstein-Wiener Plots at the Command Line” on page
8-58
“Plotting Nonlinear Block Characteristics” on page 8-58
“Plotting Linear Block Characteristics” on page 8-59
About Hammerstein-Wiener Plots
Hammerstein-Wiener model plot lets you explore the characteristics of the
linear block and the static nonlinearities of the Hammerstein-Wiener model.
For more information about estimating nonlinear Hammerstein-Wiener
models, see “Identifying Hammerstein-Wiener Models” on page 4-15.
Examining a Hammerstein-Wiener plot can help you determine whether you
chose an unnecessarily complicated nonlinearity for modeling your system.
For example, if you chose a piece-wise-linear nonlinearity (which is very
general), but the plot indicates saturation behavior, then you can estimate a
new model using the simpler saturation nonlinearity instead.
For multivariable systems, you can use the Hammerstein-Wiener plot
to determine whether to exclude nonlinearities for specific channels. If
the nonlinearity for a specific input or output channel does not exhibit
strong nonlinear behavior, you can estimate a new model after setting the
nonlinearity at that channel to unit gain.
How to Create Hammerstein-Wiener Plots in the GUI
To create a Hammerstein-Wiener plot in the System Identification Tool GUI,
select the Hamm-Wiener check box in the Model Views area. For general
information about creating and working with plots, see “Working with Plots
in the System Identification Tool GUI” on page 12-15.
8-56
Using Hammerstein-Wiener Plots to Validate Models
Note The Hamm-Wiener check box is unavailable if you do not have a
Hammerstein-Wiener model in the Model Board.
To include or exclude a model on the plot, click the corresponding model icon
in the System Identification Tool GUI. Active models display a thick line
inside the model icon, as shown in the following figure.
Selected block
is highlighted.
Supported plots
for linear block
Hide or show
the top pane.
After you generate a plot, you can learn more about your model by:
• “Plotting Nonlinear Block Characteristics” on page 8-58
• “Plotting Linear Block Characteristics” on page 8-59
8-57
8
Model Analysis
How to Plot Hammerstein-Wiener Plots at the
Command Line
You can plot input and output nonlinearity and linear responses for
Hammerstein-Wiener models using the following syntax:
plot(model)
model must be an idnlhw model object. You can use additional plot
arguments to specify the following information:
• Include several Hammerstein-Wiener models on the plot.
• Configure how to evaluate the nonlinearity at each input and output
channel.
• Specify the time or frequency values for computing transient and frequency
response plots of the linear block.
The plot command opens the Hammerstein-Wiener Model Plot window.
For more information about working with this plot window, see “Plotting
Nonlinear Block Characteristics” on page 8-58 and “Plotting Linear Block
Characteristics” on page 8-59.
For detailed information about plot, type the following command at the
prompt:
help idnlhw/plot
Plotting Nonlinear Block Characteristics
The Hammerstein-Wiener model can contain up to two nonlinear blocks. The
nonlinearity at the input to the Linear Block is labeled uNL and is called the
input nonlinearity. The nonlinearity at the output of the Linear Block is
labeled yNL and is called the output nonlinearity.
To configure the plot, perform the following steps:
1 If the top pane is not visible, click
to expand the Hammerstein-Wiener
Model Plot window.
2 Select the nonlinear block you want to plot:
8-58
Using Hammerstein-Wiener Plots to Validate Models
• To plot uNL as a command of the input data, click the uNL block.
• To plot yNL as a command of its inputs, click the yNL block.
The selected block is highlighted in green.
Note An input to the output nonlinearity block yNL is the output from the
Linear Block and not the measured input data.
3 If your model contains multiple variables, select the channel in the Select
nonlinearity at channel list. Selecting the channel updates the plot
and displays the nonlinearity values versus the corresponding input to
this nonlinear block.
4 To change the range of the horizontal axis, select Options > Set input
range to open the Range for Input to Nonlinearity dialog box. Enter the
range using the format [MinValue MaxValue]. Click Apply and then
Close to update the plot.
Plotting Linear Block Characteristics
The Hammerstein-Wiener model contains one Linear Block that represents
the embedded linear model.
To configure the plot:
1 If the top pane is not visible, click
to expand the Hammerstein-Wiener
Model Plot window.
2 Click the Linear Block to select it. The Linear Block is highlighted in green.
3 In the Select I/O pair list, select the input and output data pair for which
to view the response.
4 In the Choose plot type list, select the linear plot from the following
options:
• Step
• Impulse
8-59
8
Model Analysis
• Bode
• Pole-Zero Map
5 If you selected to plot step or impulse response, you can set the time span.
Select Options > Time span and enter a new time span in units of time
you specified for the model.
For a time span T, the resulting response is plotted from -T/4 to T. The
default time span is 10.
Click Apply and then Close.
6 If you selected to plot a Bode plot, you can set the frequency range.
The default frequency vector is 128 linearly distributed values, greater
than zero and less than or equal to the Nyquist frequency. To change the
range, select Options > Frequency range, and specify a new frequency
vector in units of rad per model time units.
Enter the frequency vector using any one of following methods:
• MATLAB expression, such as [1:100]*pi/100 or logspace(-3,-1,200).
Cannot contain variables in the MATLAB workspace.
• Row vector of values, such as [1:.1:100].
Click Apply and then Close.
8-60
Using Akaike’s Criteria to Validate Models
Using Akaike’s Criteria to Validate Models
In this section...
“Definition of FPE” on page 8-61
“Computing FPE” on page 8-62
“Definition of AIC” on page 8-62
“Computing AIC” on page 8-63
Definition of FPE
Akaike’s Final Prediction Error (FPE) criterion provides a measure of model
quality by simulating the situation where the model is tested on a different
data set. After computing several different models, you can compare them
using this criterion. According to Akaike’s theory, the most accurate model
has the smallest FPE.
Note If you use the same data set for both model estimation and validation,
the fit always improves as you increase the model order and, therefore, the
flexibility of the model structure.
Akaike’s Final Prediction Error (FPE) is defined by the following equation:
⎛1+ dN ⎞
FPE = V ⎜
⎜ 1 − d ⎟⎟
N⎠
⎝
where V is the loss function, d is the number of estimated parameters, and N
is the number of values in the estimation data set.
The toolbox assumes that the final prediction error is asymptotic for d<<N
and uses the following approximation to compute FPE:
FPE = V (1 + 2 d N )
The loss function V is defined by the following equation:
8-61
8
Model Analysis
⎛ N
1
V = det ⎜ N
ε t, θ N
⎜ ∑
⎝
1
(
) ( ε ( t, θ N ))
T
⎞
⎟
⎟
⎠
where θ N represents the estimated parameters.
Computing FPE
You can compute Akaike’s Final Prediction Error (FPE) criterion for linear
and nonlinear models.
Note FPE for nonlinear ARX models that include a tree partition
nonlinearity is not supported.
To compute FPE, use the fpe command, as follows:
FPE = fpe(m1,m2,m3,...,mN)
According to Akaike’s theory, the most accurate model has the smallest FPE.
You can also access the FPE value of an estimated model by accessing the
FPE field of the EstimationInfo property of this model. For example, if you
estimated the model m, you can access its FPE using the following command:
m.EstimationInfo.FPE
Definition of AIC
Akaike’s Information Criterion (AIC) provides a measure of model quality
by simulating the situation where the model is tested on a different data
set. After computing several different models, you can compare them using
this criterion. According to Akaike’s theory, the most accurate model has
the smallest AIC.
Note If you use the same data set for both model estimation and validation,
the fit always improves as you increase the model order and, therefore, the
flexibility of the model structure.
8-62
Using Akaike’s Criteria to Validate Models
Akaike’s Information Criterion (AIC) is defined by the following equation:
AIC = log V +
2d
N
where V is the loss function, d is the number of estimated parameters, and N
is the number of values in the estimation data set.
The loss function V is defined by the following equation:
⎛ N
1
V = det ⎜ N
ε t, θ N
⎜ ∑
1
⎝
(
) ( ε ( t, θ N ))
T
⎞
⎟
⎟
⎠
where θ N represents the estimated parameters.
For d<<N:
2d ⎞ ⎞
⎛ ⎛
AIC = log ⎜ V ⎜ 1 +
⎟⎟
N ⎠⎠
⎝
⎝
Note AIC is approximately equal to log(FPE).
Computing AIC
Use the aic command to compute Akaike’s Information Criterion (AIC) for
one or more linear or nonlinear models, as follows:
AIC = aic(m1,m2,m3,...,mN)
According to Akaike’s theory, the most accurate model has the smallest AIC.
8-63
8
Model Analysis
Computing Model Uncertainty
In this section...
“Why Analyze Model Uncertainty?” on page 8-64
“What Is Model Covariance?” on page 8-64
“Viewing Model Uncertainty Information” on page 8-65
Why Analyze Model Uncertainty?
In addition to estimating model parameters, the toolbox algorithms also
estimate variability of the model parameters that result from random
disturbances in the output.
Understanding model variability helps you to understand how different your
model parameters would be if you repeated the estimation using a different
data set (with the same input sequence as the original data set) and the same
model structure.
When validating your parametric models, check the uncertainty values.
Large uncertainties in the parameters might be caused by high model orders,
inadequate excitation, and poor signal-to-noise ratio in the data.
Note You can get model uncertainty data for linear parametric black-box
models, and both linear and nonlinear grey-box models. Supported model
objects include idproc, idpoly, idss, idarx, idgrey, idfrd, and idnlgrey.
What Is Model Covariance?
Uncertainty in the model is called model covariance.
If you estimate model uncertainty data, this information is stored in the
Model.CovarianceMatrix model property. The covariance matrix is used to
compute all uncertainties in model output, Bode plots, residual plots, and
pole-zero plots.
8-64
Computing Model Uncertainty
Computing the covariance matrix is based on the assumption that the model
structure gives the correct description of the system dynamics. For models
that include a disturbance model H, a correct uncertainty estimate assumes
that the model produces white residuals. To determine whether you can trust
the estimated model uncertainty values, perform residual analysis tests
on your model, as described in “Using Residual Analysis Plots to Validate
Models” on page 8-16. If your model passes residual analysis tests, there is a
good chance that the true system lies within the confidence interval and any
parameter uncertainties results from random disturbances in the output.
In the case of output-error models, where the noise model H is fixed to 1,
computing the covariance matrix does not assume that the residuals are
white. Instead, the covariance is estimated based on the estimated color of the
residual correlations. This estimation of the noise color is also performed for
state-space models with K=0, which is equivalent to an output-error model.
Viewing Model Uncertainty Information
You can view the following uncertainty information from linear and nonlinear
grey-box models:
• Uncertainties of estimated parameters.
Type present(model) at the prompt, where model represents the name of
a linear or nonlinear model.
• Confidence intervals on the linear model plots, including step-response,
impulse-response, Bode, and pole-zero plots.
Confidence intervals are computed based on the variability in the model
parameters. For information about displaying confidence intervals, see the
corresponding plot section.
• Covariance matrix of the estimated parameters in linear and nonlinear
grey-box models.
Type model.CovarianceMatrix at the prompt, where model represents the
name of the model object.
• Estimated standard deviations of polynomial coefficients or state-space
matrices
8-65
8
Model Analysis
Type model.dA at the prompt to access the estimated standard deviations
of the model.A estimated property, where model represents the name
of the model object, and A represents any estimated model property. In
general, you prefix the name of the estimated property with a d to get the
standard deviation estimate for that property. For example, to get the
standard deviation value of the A polynomial in an estimated ARX model,
type model.da.
Note State-space models, estimated with free parameterization, do
not have well-defined standard deviations of the matrix elements. To
display matrix parameter uncertainties in this case, first transform the
model to a canonical parameterization by setting the ss model property
to model.ss = 'canon'. For more information about free and canonical
parameterizations, see “Identifying State-Space Models” on page 3-73.
• Simulated output values for linear models with standard deviations using
the sim command.
Call the sim command with output arguments, where the second output
argument is the estimated standard deviation of each output value.
For example, type [ysim,ysimsd]=sim(model,data), where ysim is
the simulated output, ysimsd contains the standard deviations on the
simulated output, and data is the simulation data.
8-66
Troubleshooting Models
Troubleshooting Models
In this section...
“About Troubleshooting Models” on page 8-67
“Model Order Is Too High or Too Low” on page 8-67
“Nonlinearity Estimator Produces a Poor Fit” on page 8-68
“Substantial Noise in the System” on page 8-69
“Unstable Models” on page 8-69
“Missing Input Variables” on page 8-70
“Complicated Nonlinearities” on page 8-71
About Troubleshooting Models
During validation, you might find that your model output fits the validation
data poorly. You might also find some unexpected or undesirable model
characteristics.
If the tips suggested in these sections do not help improve your models, then
a good model might not be possible for this data. For example, your data
might have poor signal-to-noise ratio, large and nonstationary disturbances,
or varying system properties.
Model Order Is Too High or Too Low
When the Model Output plot does not show a good fit, there is a good chance
that you need to try a different model order. System identification is largely
a trial-and-error process when selecting model structure and model order.
Ideally, you want the lowest-order model that adequately captures the system
dynamics.
You can estimate the model order as described in “Preliminary Step –
Estimating Model Orders and Input Delays” on page 3-49. Typically, you use
the suggested order as a starting point to estimate the lowest possible order
with different model structures. After each estimation, you monitor the Model
Output and the Residual Analysis plots, and then adjust your settings for
the next estimation.
8-67
8
Model Analysis
When a low-order model fits the validation data poorly, try estimating a
higher-order model to see if the fit improves. For example, if a Model Output
plot shows that a fourth-order model gives poor results, try estimating an
eighth-order model. When a higher-order model improves the fit, you can
conclude that higher-order models might be required and linear models might
be sufficient.
You should use an independent data set to validate your models. If you
use the same data set to both estimate and validate a model, the fit always
improves as you increase model order, and you risk overfitting. However, if
you use an independent data set to validate your models, the fit eventually
deteriorates if your model orders are too high.
High-order models are more expensive to compute and result in greater
parameter uncertainty.
Nonlinearity Estimator Produces a Poor Fit
In the case of nonlinear ARX and Hammerstein-Wiener models, the Model
Output plot does not show a good fit when the nonlinearity estimator has
incorrect complexity.
You specify the complexity of piece-wise-linear, wavelet, sigmoid, and
custom networks using the number of units (NumberOfUnits nonlinear
estimator property). A high number of units indicates a complex nonlinearity
estimator. In the case of neural networks, you specify the complexity using
the parameters of the network object. For more information, see the Neural
Network Toolbox documentation.
To select the appropriate complexity of the nonlinearity estimator, start
with a low complexity and validate the model output. Next, increate the
complexity and validate the model output again. The model fit degrades when
the nonlinearity estimator becomes too complex.
Note To see the model fit degrade when the nonlinearity estimator becomes
too complex, you must use an independent data set to validate the data that is
different from the estimation data set.
8-68
Troubleshooting Models
Substantial Noise in the System
There are a couple of indications that you might have substantial noise in
your system and might need to use linear model structures that are better
equipped to model noise.
One indication of noise is when a state-space model is better than an ARX
model at reproducing the measured output; whereas the state-space structure
has sufficient flexibility to model noise, the ARX model structure is less able
to model noise because the A polynomial must account for both the system
dynamics and the noise. The following equation represents the ARX model
and shows that A couples the dynamics and the noise by appearing in the
denominator of both the dynamics term and the noise terms:
y=
B
1
u+ e
A
A
Another indication that a noise model is needed appears in residual analysis
plots when you see significant autocorrelation of residuals at nonzero lags.
For more information about residual analysis, see “Using Residual Analysis
Plots to Validate Models” on page 8-16.
To model noise more carefully, use the ARMAX or the Box-Jenkins model
structure, where the dynamics term and the noise term are modeled by
different polynomials.
Unstable Models
One of the most conclusive approaches to determining whether a linear model
is unstable is by examining the pole-zero plot of the model, which is described
in “Using Pole-Zero Plots to Validate Models” on page 8-47. The stability
threshold for pole values differs for discrete-time and continuous-time models,
as follows:
• For stable continuous-time models, the real part of the pole is less than 0.
• For stable discrete-time models, the magnitude of the pole is less than 1.
In some cases, an unstable model is still a useful model. For example, your
system might be unstable without a controller, and you plan to use your
8-69
8
Model Analysis
model for control design. In this case, you can import your unstable model
into Simulink or Control System Toolbox products.
One way to check if a nonlinear model is unstable is to plot the simulated
model output on top of the validation data. If the simulated output diverges
from measured output, the model is unstable. However, agreement between
model output and measured output does not guarantee stability.
In the case of linear models, if you believe that your system is stable, but your
model is unstable, then you can estimate the model again with a Focus setting
that guarantees stability. For example, set Focus to Stability to find the best
stable model. This setting might result in a reduced model quality. For more
information about Focus, see the Algorithm Properties reference page.
A more advanced approach to achieving a stable model is by setting the
stability threshold property to allow a margin of error. The threshold model
property is accessed as a field in the algorithm structure:
• For continuous-time models, set the value of
model.algorithm.advanced.sstability. The model is considered stable
if the pole on the far right is to the left of sstability threshold.
• For discrete-time models, set the value of
model.algorithm.advanced.zstability. The model is considered stable
if all poles inside the circle centered at the origin and with a radius
zstability.
For more information about Threshold fields for linear models, see the
Algorithm Properties reference page.
Missing Input Variables
If the Model Output plot and Residual Analysis plot shows a poor fit and
you have already tried different structures and orders and modeled noise, it
might be that there are one or more missing inputs that have a significant
effect on the output.
Try including other measured signals in your input data, and then estimating
the models again.
8-70
Troubleshooting Models
Inputs need not be control signals. Any measurable signal can be considered
an input, including measurable disturbances.
Complicated Nonlinearities
If the Model Output plot and Residual Analysis plot shows a poor fit, consider
if nonlinear effects are present in the system.
You can model the nonlinearities by performing a simple transformation
on the signals to make the problem linear in the new variables. For
example, if electrical power is the driving stimulus in a heating process and
temperature is the output, you can form a simple product of voltage and
current measurements.
If your problem is sufficiently complex and you do not have physical insight
into the problem, you might try fitting nonlinear black-box models. For more
information, see Chapter 4, “Nonlinear Black-Box Model Identification”.
8-71
8
Model Analysis
Next Steps After Getting an Accurate Model
After you get an accurate model, you can simulate or predict model output.
For more information, see Chapter 9, “Simulation and Prediction”.
For linear parametric models (idmodel objects), you can perform the following
operations:
• Transform between continuous-time and discrete-time representation.
See “Transforming Between Discrete-Time and Continuous-Time
Representations” on page 3-112.
• Transform between linear model representations, such as between
polynomial, state-space, and zero-pole representations.
See “Transforming Between Linear Model Representations” on page 3-117.
• Extract numerical data from transfer functions, pole-zero models, and
state-space matrices.
See “Extracting Parameter Values from Linear Models” on page 3-108.
For nonlinear black-box models (idnlarx and idnlhwobjects), you can perform
the following operations:
• Compute a linear approximation of the nonlinear model.
See “Computing Linear Approximations of Nonlinear Black-Box Models”
on page 4-33.
• Extract model parameters.
See “Extracting Parameter Values from Nonlinear Black-Box Models” on
page 4-30.
System Identification Toolbox models in the MATLAB workspace are
immediately available to other MathWorks™ products. However, if you used
the System Identification Tool GUI to estimate models, you must first export
the models to the MATLAB workspace.
8-72
Next Steps After Getting an Accurate Model
Tip To export a model from the GUI, drag the model icon to the To
Workspace rectangle. For more information about working with the GUI,
see Chapter 12, “Using the System Identification Tool GUI”.
If you have the Control System Toolbox software installed, you can import
your linear plant model for control-system design. For more information, see
“Using Models with Control System Toolbox Software” on page 10-2.
Finally, if you have Simulink software installed, you can exchange data
between the System Identification Toolbox software and the Simulink
environment. For more information, see Chapter 11, “Using System
Identification Toolbox Blocks”.
8-73
8
8-74
Model Analysis
9
Simulation and Prediction
• “Simulating Versus Predicting Output” on page 9-2
• “Simulation and Prediction in the GUI” on page 9-4
• “Example – Simulating Model Output with Noise at the Command Line”
on page 9-5
• “Example – Simulating a Continuous-Time State-Space Model at the
Command Line” on page 9-6
• “Predicting Model Output at the Command Line” on page 9-7
• “Specifying Initial States” on page 9-8
9
Simulation and Prediction
Simulating Versus Predicting Output
Simulating a model means that you compute the response of a model to
a particular input. Then, the toolbox feeds this computed output into the
differential (continuous-time) or difference (discrete-time) equation for
calculating the next output value. In this way, the simulation progresses
using previously calculated outputs in the difference equation to produce
the next output; with an infinite prediction horizon (k=∞), the simulation
has no limit on how far out in time it computes output values. Simulating
models uses the input-data values from the validation data set to compute
the output values.
Simulating models uses only past input values to compute the output values.
If the model-output expression includes past outputs, the toolbox computes
the first output value using the initial conditions and the inputs. Then, the
toolbox feeds this computed output into the difference equation or differential
equation for calculating the next output value. Thus, no past outputs are used
in the computation of output at the current time.
Simulation always uses a discrete model and continuous-time models are
discretized for simulation purposes. Simulation does not involve the noise
model unless you explicitly specify to compute the response to the noise source
input. During simulation, the toolbox computes the first output value using
the initial conditions and the inputs.
Predicting future outputs of a model from previous data over a time horizon of
k samples or kTs time units—where Ts is the sampling interval and k is the
prediction horizon—requires both past inputs and past outputs.
During prediction, the algorithm uses both the measured and the calculated
output data values in the difference equation for computing the next output.
The predicted value y(t) is computed from all available inputs u(s), where
s ≤ t , and all available outputs y(s), where s ≤ ( t − k ) . The argument s
represents the data sample number.
To make sure that the model picks up important dynamic properties, let the
predicted time horizon kT be larger than the system time constants, where
T is the sampling interval.
9-2
Simulating Versus Predicting Output
Note Prediction with k=∞ means that no previous inputs are used in the
computation and prediction matches simulation.
9-3
9
Simulation and Prediction
Simulation and Prediction in the GUI
To learn how to display simulated or predicted output using the System
Identification Tool GUI, see the description of the plot settings in “How to Plot
Model Output Using the GUI” on page 8-11.
For information about simulating identified models in the Simulink
environment, see “Simulating Model Output” on page 11-6.
9-4
Example – Simulating Model Output with Noise at the Command Line
Example – Simulating Model Output with Noise at the
Command Line
This example demonstrates how you can create input data and a model, and
then use the data and the model to simulate output data. In this case, you use
the following ARMAX model with Gaussian noise e:
y(t) − 1.5 y(t − 1) + 0.7 y(t − 2) =
u(t − 1) + 0.5u(t − 2) + e(t) − e(t − 1) + 0.2e(t − 1)
Create the ARMAX model and simulate output data with random binary
input u using the following commands:
% Create an ARMAX model
m_armax = idpoly([1 -1.5 0.7],[0 1 0.5],[1 -1 0.2]);
% Create a random binary input
u = idinput(400,'rbs',[0 0.3]);
% Simulate the output data
y = sim(m_armax,u,'noise');
Note The argument 'noise' specifies to include in the simulation the
Gaussian noise e present in the model. Omit this argument to simulate the
noise-free response to the input u, which is equivalent to setting e to zero.
9-5
9
Simulation and Prediction
Example – Simulating a Continuous-Time State-Space
Model at the Command Line
This example demonstrates how to simulate a continuous-time state-space
model using a random binary input u and a sampling interval of 0.1 s.
Consider the following state-space model:
⎡ −1 1 ⎤
⎡ 1 ⎤
⎡ 0 .5 ⎤
x = ⎢
⎥ x + ⎢ 0 .5 ⎥ u + ⎢ 0 .5 ⎥ e
−
0
.
5
0
⎣
⎦
⎣ ⎦
⎣ ⎦
y = [1 0] x + e
where e is Gaussian white noise with variance 7.
Use the following commands to simulate the model:
% Set up the model matrices
A = [-1 1;-0.5 0]; B = [1; 0.5];
C = [1 0]; D = 0; K = [0.5;0.5];
% Create a continuous-time state-space model
% Ts = 0 indicates continuous time
model_ss = idss(A,B,C,D,K,'Ts',0,'NoiseVariance',7)
% Create a random binary input
u = idinput(400,'rbs',[0 0.3]);
% Create an iddata object with empty output
data = iddata([],u);
data.ts = 0.1
% Simulate the output using the model
y=sim(model_ss,data,'noise');
Note The argument 'noise' specifies to simulate with the Gaussian noise e
present in the model. Omit this argument to simulate the noise-free response
to the input u, which is equivalent to setting e to zero.
9-6
Predicting Model Output at the Command Line
Predicting Model Output at the Command Line
Use the following syntax to compute k-step-ahead prediction of the output
signal using model m:
yhat = predict(m,[y u],k)
The predicted value yˆ ( t | t − k ) is computed using information in u(s) up
to time s=t, and then information in y(s) up to time s=t-kT, where T is the
sampling interval.
The way information in past outputs is used depends on the disturbance
model of m. For example, because H = 1 in the output-error model, there is no
information in past outputs. In this case, predictions and simulations coincide.
The following example demonstrates commands you can use to evaluate how
well a time-series model predicts future values. In this case, y is the original
series of monthly sales figures. The first half of the measured data is used to
estimate the time-series model, and then the second half of the data is used
to predict half a year ahead.
% Split time-series data into
% two halves
y1 = y(1:48),
y2 = y(49:96)
% Estimate a fourth-order autoregressive model
% using the first half of the data.
m = ar(y1,4)
% Predict time-series output
yhat = predict(m4,y2,6)
% Plot predicted output
plot(y2,yhat)
9-7
9
Simulation and Prediction
Specifying Initial States
In this section...
“When to Specify Initial States” on page 9-8
“Setting Initial States to Zero” on page 9-8
“Setting Initial States to Equilibrium Values” on page 9-9
“Estimating Initial States from the Data” on page 9-9
When to Specify Initial States
The sim and predict commands require initial states to start the
computations. If you prefer to use different initial states for state-space
models, or if you are working with other model types, you must specify the
initial states for simulation or prediction.
By default, simulating or predicting output for state-space models uses
the initial states stored in the X0 model property after estimation. For
multiexperiment state-space models, the stored initial states correspond to
the data in the last experiment. These stored initial states might not be
appropriate when you simulate or predict model output using new data.
Use the following general syntax for specifying initial states for simulation
or prediction:
y=sim(model,data,'InitialState',S)
y=predict(model,data,'InitialState',S)
where S represents a vector of states.
Note The compare command automatically estimates the initial states from
the data and ensures consistency.
Setting Initial States to Zero
If the system starts at rest, or if transient effects are not important, then
you can set the initial states to zero.
9-8
Specifying Initial States
You can use the following shortcut syntax for setting initial states to zero:
y=sim(model,data,'InitialState','z')
y=predict(model,data,'InitialState','z')
Setting Initial States to Equilibrium Values
If you have physical insight about the starting point of the system, create a
vector of specific initial states at the command line.
Use the following syntax to specify initial states for simulation or prediction:
y=sim(model,data,'InitialState',S)
y=predict(model,data,'InitialState',S)
where S represents a vector of initial states.
If you are working with multiexperiment data, specify S as a matrix
containing as many columns as there are experiments.
Estimating Initial States from the Data
• “How to Estimate States for Simulation” on page 9-9
• “How to Estimate States for Prediction” on page 9-10
How to Estimate States for Simulation
Simulation using data from a different experiment than the data used to
estimate the model requires the corresponding initial states.
To use sim with a data set that differs from the data you used to estimate the
model, first estimate the new initial states Sest using findstates:
X0est = findstates(model,data)
Next, specify the estimated initial states Sest as an argument in sim. For
example:
y = sim(model,data,'InitialState',SestX0est)
9-9
9
Simulation and Prediction
When you simulate a multiexperiment model, use the pe command to estimate
initial states for the data from that specific experiment. For example, suppose
you estimate a three-state model M using a merged data set Z, which contains
data from five experiments—z1, z2, z3, z4, and z5:
Z = merge(z1,z2,z3,z4,z5);
M = n4sid(Z,3);
If you want to simulate using data from z2, you must estimate the initial
states for the second experiment Z(z2.u), as follows:
X0est = findstates(M,getexp(Z,2))
where getexp(Z,2) gets the data in z2. The estimated states matrix Sest
contains one column of initial-state values for each experiment.
To simulate with these initial states, specify the estimated initial states X0est
as an argument in sim. For example:
y=sim(M,getexp(Z,2),'InitialState',X0est)
How to Estimate States for Prediction
Prediction using data from a different experiment than the data used to
estimate the model requires the corresponding initial states.
Unlike for sim, you can specify to estimate the initial states directly in the
predict command.
To estimate the initial states that correspond to the data set you use for
prediction, use the following syntax:
y=predict(M,data,'InitialState','Estimate')
9-10
10
Using Identified Models in
Control Design
10
Using Identified Models in Control Design
Using Models with Control System Toolbox Software
In this section...
“How Control System Toolbox Software Works with Identified Models”
on page 10-2
“Using balred to Reduce Model Order” on page 10-3
“Compensator Design Using Control System Toolbox Software” on page 10-3
“Converting Models to LTI Objects” on page 10-4
“Viewing Model Response Using the LTI Viewer” on page 10-5
“Combining Model Objects” on page 10-6
“Example – Using System Identification Toolbox Software with Control
System Toolbox Software” on page 10-6
How Control System Toolbox Software Works with
Identified Models
System Identification Toolbox software integrates with Control System
Toolbox software by providing a plant for control design.
Control System Toolbox software also provides the LTI Viewer GUI to extend
System Identification Toolbox functionality for linear model analysis.
Control System Toolbox software supports only linear models. If you
identified a nonlinear plant model using System Identification Toolbox
software, you must linearize it before you can work with this model in the
Control System Toolbox software. For more information, see the linapp,
linearize(idnlarx), or linearize(idnlhw) reference page.
Note You can only use the System Identification Toolbox software to linearize
nonlinear ARX (idnlarx) and Hammerstein-Wiener (idnlhw) models.
Linearization of nonlinear grey-box (idnlgrey) models is not supported.
For information about using the Control System Toolbox software, see the
Control System Toolbox documentation.
10-2
Using Models with Control System Toolbox™ Software
Using balred to Reduce Model Order
In some cases, the order of your identified model might be higher than
necessary to capture the dynamics. If you have the Control System Toolbox
software, you can use balred to compute a state-spate model approximation
with a reduced model order for any idmodel object, including idarx, idpoly,
idss, and idgrey.
For more information about using balred, see the corresponding reference
page. To learn how you can reduce model order using pole-zero plots, see
“Reducing Model Order Using Pole-Zero Plots” on page 8-51.
Compensator Design Using Control System Toolbox
Software
After you estimate a plant model using System Identification Toolbox
software, you can use Control System Toolbox software to design a controller
for this plant.
System Identification Toolbox models in the MATLAB workspace are
immediately available to Control System Toolbox commands. However, if you
used the System Identification Tool GUI to estimate models, you must first
export the models to the MATLAB workspace. To export a model from the
GUI, drag the model icon to the To Workspace rectangle.
Control System Toolbox software provides both the SISO Design Tool GUI
and commands for working at the command line. You can import polynomial
and state-space models directly into SISO Design Tool using the following
command:
sisotool(model('measured'))
where you use only the dynamic model and not the noise model. For more
information about subreferencing the dynamic or the noise model, see
“Subreferencing Measured and Noise Models” on page 3-120. To design a
controller using Control System Toolbox commands and methods at the
command line, you must convert the plant model to an LTI object. For more
information, see “Converting Models to LTI Objects” on page 10-4.
10-3
10
Using Identified Models in Control Design
Note The syntax sisotool(model('m')) is equivalent to
sisotool(model('measured')).
For more information about controller design using SISO Design Tool
and Control System Toolbox commands, see the Control System Toolbox
documentation.
Converting Models to LTI Objects
Control System Toolbox commands operate on LTI objects. To design a
controller for a plant model, you must first convert the System Identification
Toolbox model object to an LTI object.
You can convert linear polynomial, state-space, and grey-box model objects,
including idarx, idpoly, idproc, idss, or idgrey, to LTI objects.
The following table summarizes the commands for transforming linear
state-space and polynomial models to an LTI object.
Commands for Converting Models to LTI Objects
Command
Description
frd
Convert to
frequency-response
representation.
ss
tf
zpk
Example
ss_sys = frd(model)
Convert to state-space
representation.
ss_sys = ss(model)
Convert to
transfer-function form.
tf_sys = tf(model)
Convert to zero-pole form.
zpk_sys = zpk(model)
The following code transforms an idmodel object to an LTI state-space object:
% Extract the measured model
% and ignore the noise model
10-4
Using Models with Control System Toolbox™ Software
model = model('measured')
% Convert to LTI object
LTI_sys = idss(model)
The LTI object includes only the dynamic model and not the noise model,
which is estimated for every linear model in the System Identification Toolbox
software.
Note To include noise channels in the LTI models, first use noisecnv to
convert the noise in the idmodel object to measured channels, and then
convert to an LTI object.
For more information about subreferencing the dynamic or the noise model,
see “Subreferencing Measured and Noise Models” on page 3-120.
Viewing Model Response Using the LTI Viewer
• “What Is the LTI Viewer?” on page 10-5
• “Displaying Identified Models in the LTI Viewer” on page 10-6
What Is the LTI Viewer?
If you have the Control System Toolbox software, you can plot models in the
LTI Viewer from either the System Identification Tool GUI or the MATLAB
Command Window.
The LTI Viewer is a graphical user interface for viewing and manipulating
the response plots of linear models.
Note The LTI Viewer does not display model uncertainty.
For more information about working with plots in the LTI Viewer, see the
Control System Toolbox documentation.
10-5
10
Using Identified Models in Control Design
Displaying Identified Models in the LTI Viewer
When the MATLAB software is installed, the System Identification Tool GUI
contains the To LTI Viewer rectangle. To plot models in the LTI Viewer,
drag and drop the corresponding icon to the To LTI Viewer rectangle in
the System Identification Tool GUI.
Alternatively, use the following syntax when working at the command line
to view a model in the LTI Viewer:
view(model)
Combining Model Objects
If you have the Control System Toolbox software, you can combine linear
model objects, such as idarx, idgrey, idpoly, idproc, and idss model
objects, similar to the way you combine LTI objects.
For example, you can perform the following operations on identified models:
• G1+G2
• G1*G2
• append(G1,G2)
• feedback(G1,G2)
Note These operations lose covariance information.
Example – Using System Identification Toolbox
Software with Control System Toolbox Software
This example demonstrates how to use both System Identification Toolbox
commands and Control System Toolbox commands to create and plot models:
% Construct model using Control System Toolbox
m0 = drss(4,3,2)
% Convert model to an idss object
m0 = idss(m0,'NoiseVar',0.1*eye(3))
% Generate input data for simulating output
10-6
Using Models with Control System Toolbox™ Software
u = iddata([], idinput([800 2],'rbs'));
% Simulate model output using System Identification Toolbox
% with added noise
y = sim(m0,u,'noise')
% Form an input-output iddata object
Data = [y u];
% Estimate state-space model from the generated data
% using System Identification Toolbox command pem
m = pem(Data(1:400))
% Convert the model to a Control System Toolbox transfer function
tf(m)
% Plot model output for model m using System Identification Toolbox
compare(Data(401:800),m)
% Display identified model m in LTI Viewer
view(m)
10-7
10
10-8
Using Identified Models in Control Design
11
Using System Identification
Toolbox Blocks
• “System Identification Toolbox Block Library” on page 11-2
• “Opening the System Identification Toolbox Block Library” on page 11-3
• “Preparing Data” on page 11-4
• “Identifying Linear Models” on page 11-5
• “Simulating Model Output” on page 11-6
• “Example – Simulating a Model Using Simulink Software” on page 11-9
11
Using System Identification Toolbox™ Blocks
System Identification Toolbox Block Library
System Identification Toolbox provides blocks for sharing information
between the MATLAB and Simulink environments.
You can use the System Identification Toolbox block library to perform the
following tasks:
• Stream time-domain data source (iddata object) into a Simulink model.
• Export data from a simulation in Simulink software as a System
Identification Toolbox data object (iddata object).
• Import estimated models into a Simulink model and simulate the models
with or without noise.
The model you import might be a component of a larger system modeled in
Simulink. For example, if you identified a plant model using the System
Identification Toolbox software, you can import this plant into a Simulink
model for control design.
• Estimate parameters of linear polynomial models during simulation from
single-output data.
11-2
Opening the System Identification Toolbox™ Block Library
Opening the System Identification Toolbox Block Library
To open the System Identification Toolbox block library, select
Start > Simulink > Library Browser. In the Library Browser, select
System Identification Toolbox.
You can also open the System Identification Toolbox block library directly by
typing the following command at the MATLAB prompt:
slident
For more information about blocks, see “Block Reference” in the System
Identification Toolbox Reference. To get help on a specific block, right-click
the block in the Library Browser, and select Help.
11-3
11
Using System Identification Toolbox™ Blocks
Preparing Data
The following table summarizes the blocks you use to transfer data between
the MATLAB and Simulink environments.
After you add a block to the Simulink model, double-click the block to specify
block parameters. For an example of bringing data into a Simulink model,
see the tutorial on estimating process models in the System Identification
Toolbox Getting Started Guide.
Block
Description
IDDATA Sink
Export input and output signals to the MATLAB
workspace as an iddata object.
IDDATA Source
Import iddata object from the MATLAB
workspace.
Input and output ports of the block correspond
to input and output signals of the data. These
inputs and outputs provide signals to blocks that
are connected to this data block.
For information about configuring each block, see the corresponding reference
pages.
11-4
Identifying Linear Models
Identifying Linear Models
The following table summarizes the blocks you use to estimate model
parameters in a Simulink model during simulation and export the results to
the MATLAB environment.
After you add a block to the model, double-click the block to specify block
parameters.
Block
Description
AR Estimator
Estimate AR model parameters from time-series
data, which has one output and no input.
ARMAX Estimator
Estimate ARMAX model parameters from
input/output data.
ARX Estimator
Estimate ARX model parameters from
input/output data.
BJ Estimator
Estimate BJ model parameters from input/output
data.
OE Estimator
Estimate OE model parameters from
input/output data.
PEM Estimator
Estimate ARX, ARMAX, Box-Jenkins, and
Output-Error models (idpoly objects) from
single-input and single output data using general
prediction-error method.
For information about configuring each block, see the corresponding reference
pages.
11-5
11
Using System Identification Toolbox™ Blocks
Simulating Model Output
In this section...
“When to Use Simulation Blocks” on page 11-6
“Summary of Simulation Blocks” on page 11-6
“Specifying Initial Conditions for Simulation” on page 11-7
When to Use Simulation Blocks
Add model simulation blocks to your Simulink model from the System
Identification Toolbox block library when you want to:
• Represent the dynamics of a physical component in a Simulink model using
a data-based nonlinear model.
• Replace a complex Simulink subsystem with a simpler data-based
nonlinear model.
You use the model simulation blocks to import the models you identified using
System Identification Toolbox software from the MATLAB workspace into the
Simulink environment. For a list of System Identification Toolbox simulation
blocks, see “Summary of Simulation Blocks” on page 11-6.
Summary of Simulation Blocks
The following table summarizes the blocks you use to import models from
the MATLAB environment into a Simulink model for simulation. Importing
a model corresponds to entering the model variable name in the block
parameter dialog box.
11-6
Block
Description
IDMODEL Model
Simulate idmodel model in Simulink, including
low-order transfer function (idproc), linear
polynomial (idpoly), state-space (idss), and
grey-box (idgrey) models. Also simulates idarx
model objects.
IDNLARX Model
Simulate idnlarx model in Simulink.
Simulating Model Output
Block
Description
IDNLHW Model
Simulate idnlhw model in Simulink.
IDNLGREY Model
Simulate nonlinear ODE (idnlgrey model object)
in Simulink.
After importing the model into Simulink, use the block parameter dialog box
to specify the initial conditions for simulating that block, as described in
“Specifying Initial Conditions for Simulation” on page 11-7. For information
about configuring each block, see the corresponding reference pages.
Specifying Initial Conditions for Simulation
For accurate simulation of a linear or a nonlinear model, you can use default
initial conditions or specify the initial conditions for simulation using the
block parameters dialog box.
Tip Double-click the block after adding it your Simulink model to open the
block parameters dialog box.
Specifying Initial States of Linear Models
For linear models, the default initial states are the states computed during
model estimation and stored by the InitialStates model property. For
idarx and idpoly models, the default initial states are 0. For idproc, idss,
and idgrey models, the InitialStates model property can be nonzero values
after model estimation.
Because idss and idgrey models are state-space models, the definition of
initial states corresponds to the standard definition of states for state-space
representation. For idproc, idpoly, and idarx models, the states are the
states of the corresponding state-space model. For example, suppose you have
the following idpoly model:
m1=idpoly([1 2 1],[2 2]);
The initial states of the previous model correspond to those of the equivalent
state-space model:
11-7
11
Using System Identification Toolbox™ Blocks
m2=idss(m1);
For more information about specifying initial conditions for simulation, see
the IDMODEL Model reference page.
Specifying Initial States of Nonlinear ARX Models
The states of a nonlinear ARX model correspond to the dynamic elements
of the nonlinear ARX model structure, which are the model regressors.
Regressors can be the delayed input/output variables (standard regressors)
or user-defined transformations of delayed input/output variables (custom
regressors). For more information about the states of a nonlinear ARX model,
see the idnlarx reference page.
For more information about specifying initial conditions for simulation, see
the IDNLARX Model reference page.
Specifying Initial States of Hammerstein-Wiener Models
The states of a Hammerstein-Wiener model correspond to the states of the
embedded linear (idpoly) model. For more information about the states of a
Hammerstein-Wiener model, see the idnlhw reference page.
The default initial state for simulating a Hammerstein-Wiener model is 0.
This setting might lead to unexpected transients in the simulated response.
For more information about specifying initial conditions for simulation, see
the IDNLHW Model reference page.
11-8
Example – Simulating a Model Using Simulink® Software
Example – Simulating a Model Using Simulink Software
In this example, you set the initial states for simulating a model such that the
simulation provides a best fit to measured input-output data.
Suppose you estimate a three-state model M using a multiple-experiment data
set Z, which contains data from five experiments—z1, z2, z3, z4, and z5:
Z = merge(z1,z2,z3,z4,z5);
M = n4sid(Z,3);
When a model uses several data sets, the initial-states property stores only
the estimated states corresponding to the last data set. In this example, M.X0
is a vector of length 3 (corresponding to the three states of the model). The
values of M.X0 are the estimated state values corresponding to z5.
The following procedure describes how to access the initial states that
correspond to z2 for the simulation, where z2 is a portion of the estimation
data Z.
To compare the measured output from experiment z2 with the simulated
output:
1 Estimate the initial states using the second experiment as input, that is
Z(z2.u), as follows:
X0est = findstates(M,getexp(Z,2))
In this case, getexp(Z,2) gets the data in z2.
2 In the Simulink model window, open the Function Block Parameters dialog
box for the idmodel block.
3 In the idmodel variable field, type M to specify the estimated model.
4 In the Initial states field, type X0est to specify the estimated initial states.
5 Click OK.
Run the simulation to compare the measured output z2.y to the simulated
output.
11-9
11
11-10
Using System Identification Toolbox™ Blocks
12
Using the System
Identification Tool GUI
• “Steps for Using the System Identification Tool GUI” on page 12-2
• “Starting and Managing GUI Sessions” on page 12-3
• “Managing Models in the GUI” on page 12-9
• “Working with Plots in the System Identification Tool GUI” on page 12-15
• “Customizing the System Identification Tool GUI” on page 12-21
12
Using the System Identification Tool GUI
Steps for Using the System Identification Tool GUI
A typical workflow in the System Identification Tool GUI includes the
following steps:
1 Import your data into the MATLAB workspace, as described in “Importing
Data into the MATLAB Workspace” on page 1-5.
2 Start a new session in the System Identification Tool GUI, or open a saved
session. For more information, see “Starting a New Session in the GUI”
on page 12-4.
3 Import data into the GUI from the MATLAB workspace. For more
information, see “Representing Data in the GUI” on page 1-13.
4 Plot and preprocess data to prepare it for system identification. For
example, you can remove constant offsets or linear trends (for linear models
only), filter data, or select data regions of interest. For more information,
see Chapter 1, “Data Processing”.
5 Specify the data for estimation and validation. For more information, see
“Specifying Estimation and Validation Data” on page 1-29.
6 Select the model to estimating using the Estimate menu. For more
information, see Chapter 2, “Choosing Your System Identification
Strategy”.
7 Validate models. For more information, see Chapter 8, “Model Analysis”.
8 Export models to the MATLAB workspace for further analysis. For
more information, see “Exporting Models from the GUI to the MATLAB
Workspace” on page 12-13.
12-2
Starting and Managing GUI Sessions
Starting and Managing GUI Sessions
In this section...
“What Is a System Identification Tool Session?” on page 12-3
“Starting a New Session in the GUI” on page 12-4
“Description of the System Identification Tool Window” on page 12-5
“Opening a Saved Session” on page 12-6
“Saving, Merging, and Closing Sessions” on page 12-6
“Deleting a Session” on page 12-7
“Getting Help in the GUI” on page 12-7
“Exiting the System Identification Tool GUI” on page 12-8
What Is a System Identification Tool Session?
A session represents the total progress of your identification process, including
any data sets and models in the System Identification Tool GUI.
You can save a session to a file with a .sid extension. For example, you can
save different stages of your progress as different sessions so that you can
revert to any stage by simply opening the corresponding session.
To start a new session, see “Starting a New Session in the GUI” on page 12-4.
For more information about the steps for using the System Identification Tool
GUI, see “Steps for Using the System Identification Tool GUI” on page 12-2.
12-3
12
Using the System Identification Tool GUI
Starting a New Session in the GUI
To start a new session in the System Identification Tool GUI, type the
following command in the MATLAB Command Window:
ident
Alternatively, you can start a new session by selecting
Start > Toolboxes > System Identification > System Identification
Tool GUI in the MATLAB desktop. This action opens the System
Identification Tool GUI.
Note Only one session can be open at a time.
You can also start a new session by closing the current session using
File > Close session. This toolbox prompts you to save your current session
if it is not already saved.
12-4
Starting and Managing GUI Sessions
Description of the System Identification Tool Window
The following figure describes the different areas in the System Identification
Tool GUI.
Data Board
Select check
boxes to display
data plots.
Model Board
Select check
boxes to display
model plots.
The layout of the window organizes tasks and information from left to right.
This organization follows a typical workflow, where you start in the top-left
corner by importing data into the System Identification Tool GUI using
12-5
12
Using the System Identification Tool GUI
the Import data menu and end in the bottom-right corner by plotting the
characteristics of your estimated model on model plots. For more information
about using the System Identification Tool GUI, see “Steps for Using the
System Identification Tool GUI” on page 12-2.
The Data Board area, located below the Import data menu in the System
Identification Tool GUI, contains rectangular icons that represent the data
you imported into the GUI.
The Model Board, located to the right of the <–Preprocess menu in the
System Identification Tool GUI, contains rectangular icons that represent the
models you estimated or imported into the GUI. You can drag and drop model
icons in the Model Board into open dialog boxes.
Opening a Saved Session
You can open a previously saved session using the following syntax:
ident(session,path)
session is the file name of the session you want to open and path is the
location of the session file. Session files have the extension .sid. When the
session file in on the matlabpath, you can omit the path argument.
If the System Identification Tool GUI is already open, you can open a session
by selecting File > Open session.
Note If there is data in the System Identification Tool GUI, you must
close the current session before you can open a new session by selecting
File > Close session.
Saving, Merging, and Closing Sessions
The following table summarizes the menu commands for saving, merging, and
closing sessions in the System Identification Tool GUI.
12-6
Starting and Managing GUI Sessions
Task
Command
Comment
Close the
current
session and
start a new
session.
File > Close session
You are prompted to save the
current session before closing
it.
Merge the
current
session with
a previously
saved session.
File > Merge session
You must start a new session
and import data or models
before you can select to merge
it with a previously saved
session. You are prompted
to select the session file to
merge with the current. This
operation combines the data
and the models of both sessions
in the current session.
Save the
current
session.
File > Save
Useful for saving the session
repeatedly after you have
already saved the session once.
Save the
current
session under
a new name.
File > Save As
Useful when you want to save
your work incrementally. This
command lets you revert to a
previous stage, if necessary.
Deleting a Session
To delete a saved session, you must delete the corresponding session file.
Getting Help in the GUI
System Identification Tool GUI provides online help topics that you can
access from the Help menu.
Contextual help is available from each dialog box by clicking the Help button
in the dialog box.
12-7
12
Using the System Identification Tool GUI
Exiting the System Identification Tool GUI
To exit the System Identification Tool GUI, click Exit in the bottom-left
corner of the window.
Tip Alternatively, select File > Exit System Identification Tool GUI.
12-8
Managing Models in the GUI
Managing Models in the GUI
In this section...
“Importing Models into the GUI” on page 12-9
“Viewing Model Properties” on page 12-10
“Renaming Models and Changing Display Color” on page 12-11
“Organizing Model Icons” on page 12-11
“Deleting Models in the GUI” on page 12-12
“Exporting Models from the GUI to the MATLAB Workspace” on page 12-13
Importing Models into the GUI
You can import System Identification Toolbox models from the MATLAB
workspace into the System Identification Tool GUI. If you have Control
System Toolbox software, you can also import any models (LTI objects) you
created using this toolbox.
The following procedure assumes that you begin with the System
Identification Tool GUI already open. If this window is not open, type the
following command at the prompt:
ident
To import models into the System Identification Tool GUI:
1 In the System Identification Tool GUI, select Import from the Import
models list to open the Import Model Object dialog box.
2 In the Enter the name field, type the name of a model object. Press Enter.
3 (Optional) In the Notes field, type any notes you want to store with this
model.
4 Click Import.
5 Click Close to close the Import Model Object dialog box.
12-9
12
Using the System Identification Tool GUI
Viewing Model Properties
You can get information about each model in the System Identification Tool
GUI by right-clicking the corresponding model icon.
The Data/model Info dialog box opens. This dialog box describes the contents
and the properties of the corresponding model. It also displays any associated
notes and the command-line equivalent of the operations you used to create
this model.
Tip To view or modify properties for several models, keep this window
open and right-click each model in the System Identification Tool GUI. The
Data/model Info dialog box updates when you select each model.
12-10
Managing Models in the GUI
Renaming Models and Changing Display Color
You can rename a model and change its display color by double-clicking the
model icon in the System Identification Tool GUI.
The Data/model Info dialog box opens. This dialog box describes both the
contents and the properties of the model. The object description area displays
the syntax of the operations you used to create the model in the GUI.
To rename the model, enter a new name in the Model name field.
You can also specify a new display color using three RGB values in the Color
field. Each value is between 0 to 1 and indicates the relative presence of
red, green, and blue, respectively. For more information about specifying
default data color, see “Customizing the System Identification Tool GUI” on
page 12-21.
Tip As an alternative to using three RGB values, you can enter any one of
the following letters in single quotes:
'y' 'r' 'b' 'c' 'g' 'm' 'k'
These strings represent yellow, red, blue, cyan, green, magenta, and black,
respectively.
Finally, you can enter comments about the origin and state of the model in
the Diary And Notes area.
To view model properties in the MATLAB Command Window, click Present.
Organizing Model Icons
You can rearrange model icons in the System Identification Tool GUI by
dragging and dropping the icons to empty Model Board rectangles.
Note You cannot drag and drop a model icon into the data area on the left.
12-11
12
Using the System Identification Tool GUI
When you need additional space for organizing model icons, select
Options > Extra model/data board in the System Identification Tool GUI.
This action opens an extra session window with blank rectangles. The new
window is an extension of the current session and does not represent a new
session.
Tip When you import or estimate models and there is insufficient space for
the icons, an additional session window opens automatically.
You can drag and drop model icons between the main System Identification
Tool GUI and any extra session windows.
Type comments in the Notes field to describe the models. When you save a
session, as described in “Saving, Merging, and Closing Sessions” on page 12-6,
all additional windows and notes are also saved.
Deleting Models in the GUI
To delete models in the System Identification Tool GUI, drag and drop the
corresponding icon into Trash. Moving items to Trash does not permanently
delete these items.
12-12
Managing Models in the GUI
To restore a model from Trash, drag its icon from Trash to the Model Board
in the System Identification Tool GUI. You can view the Trash contents by
double-clicking the Trash icon.
Note You must restore a model to the Model Board; you cannot drag model
icons to the Data Board.
To permanently delete all items in Trash, select Options > Empty trash.
Exiting a session empties Trash automatically.
Exporting Models from the GUI to the MATLAB
Workspace
The models you create in the System Identification Tool GUI are not available
in the MATLAB workspace until you export them. Exporting is necessary
when you need to perform an operation on the model that is only available
at the command line. Exporting models to the MATLAB workspace also
makes them available to the Simulink software or another toolbox, such as
the Control System Toolbox product.
To export a model to the MATLAB workspace, drag and drop the
corresponding icon to the To Workspace rectangle.
12-13
12
Using the System Identification Tool GUI
When you export models to the MATLAB workspace, the resulting variables
have the same name as in the System Identification Tool GUI.
12-14
Working with Plots in the System Identification Tool GUI
Working with Plots in the System Identification Tool GUI
In this section...
“Identifying Data Sets and Models on Plots” on page 12-15
“Changing and Restoring Default Axis Limits” on page 12-16
“Selecting Measured and Noise Channels in Plots” on page 12-18
“Grid, Line Styles, and Redrawing Plots” on page 12-19
“Opening a Plot in a MATLAB Figure Window” on page 12-19
“Printing Plots” on page 12-20
Identifying Data Sets and Models on Plots
You can identify data sets and models on a plot by color: the color of the line
in the data or model icon in the System Identification Tool GUI matches the
line color on the plots.
You can also display data tips for each line on the plot. How you display the
data tip depends on whether the zoom feature is enabled:
• When zoom is enabled, press and hold down Shift, and click the desired
curve to display the data tip.
• When zoom is disabled, click a plot curve and hold down the mouse button
to display the data tip.
For more information about enabling zoom, see “Magnifying Plots” on page
12-16.
The following figure shows an example of a data tip, which contains the name
of the data set and the coordinates of the data point.
12-15
12
Using the System Identification Tool GUI
Data Tip on a Plot
Changing and Restoring Default Axis Limits
There are two ways to change which portion of the plot is currently in view:
• “Magnifying Plots” on page 12-16
• “Setting Axis Limits” on page 12-17
Magnifying Plots
Enable zoom by selecting Style > Zoom in the plot window. To disable zoom,
select Style > Zoom again.
Tip To verify that zoom is active, click the Style menu. A check mark should
appear next to Zoom.
You can adjust magnification in the following ways:
12-16
Working with Plots in the System Identification Tool GUI
• To zoom in default increments, left-click the portion of the plot you want to
center in the plot window.
• To zoom in on a specific region, click and drag a rectangle that identifies
the region for magnification. When you release the mouse button, the
selected region is displayed.
• To zoom out, right-click on the plot.
Note To restore the full range of the data in view, select
Options > Autorange in the plot window.
Setting Axis Limits
You can change axis limits for the vertical and the horizontal axes of the input
and output channels that are currently displayed on the plot.
1 Select Options > Set axes limits to open the Limits dialog box.
2 Specify a new range for each axis by editing its lower and upper limits. The
limits must be entered using the format [LowerLimit UpperLimit]. Click
Apply. For example:
[0.1 100]
Note To restore full axis limits, select the Auto check box to the right
of the axis name, and click Apply.
3 To plot data on a linear scale, clear the Log check box to the right of the
axis name, and click Apply.
Note To revert to base-10 logarithmic scale, select the Log check box to
the right of the axis name, and click Apply.
4 Click Close.
12-17
12
Using the System Identification Tool GUI
Note To view the entire data range, select Options > Autorange in the
plot window.
Selecting Measured and Noise Channels in Plots
Model inputs and outputs are called channels. When you create a plot of
a multivariable input-output data set or model, the plot only shows one
input-output channel pair at a time. The selected channel names are
displayed in the title bar of the plot window.
Note When you select to plot multiple data sets, and each data set contains
several input and output channels, the Channel menu lists channel pairs
from all data sets.
You can select a different input-output channel pair from the Channel menu
in any System Identification Toolbox plot window.
The Channel menu uses the following notation for channels: u1->y2 means
that the plot displays a transfer function from input channel u1 to output
channel y2. System Identification Toolbox estimates as many noise sources as
there are output channels. In general, e@ynam indicates that the noise source
corresponds to the output with name ynam.
For example, e@y3->y1 means that the transfer function from the noise
channel (associated with y3) to output channel y2 is displayed. For more
information about noise channels, see “Subreferencing Measured and Noise
Models” on page 3-120.
Tip When you import data into the System Identification Tool GUI, it is
helpful to assign meaningful channel names in the Import Data dialog box.
For more information about importing data, see “Representing Data in the
GUI” on page 1-13.
12-18
Working with Plots in the System Identification Tool GUI
Grid, Line Styles, and Redrawing Plots
There are several Style options that are common to all plot types. These
include the following:
• “Grid Lines” on page 12-19
• “Solid or Dashed Lines” on page 12-19
• “Plot Redrawing” on page 12-19
Grid Lines
To toggle showing or hiding grid lines, select Style > Grid.
Solid or Dashed Lines
To display currently visible lines as a combination of solid, dashed, dotted,
and dash-dotted line style, select Style > Separate linestyles.
To display all solid lines, select Style > All solid lines. This choice is the
default.
All line styles match the color of the corresponding data or model icon in
the System Identification Tool GUI.
Plot Redrawing
To specify that the plot be redrawn when you add another data set or model
to the plot, select Style > Erasemode normal. This choice is the default
setting.
To avoid redrawing the entire plot when you add another data set or model to
the plot, select Style > Erasemode xor. Although this selection results in
faster response, it might also produce poor plot quality.
Opening a Plot in a MATLAB Figure Window
The MATLAB Figure window provides editing and printing commands for
plots that are not available in the System Identification Toolbox plot window.
To take advantage of this functionality, you can first create a plot in the
12-19
12
Using the System Identification Tool GUI
System Identification Tool GUI, and then open it in a MATLAB Figure
window to fine-tune the display.
After you create the plot, as described in “Plotting Models in the GUI” on page
8-5, select File > Copy figure in the plot window. This command opens the
plot in a MATLAB Figure window.
Printing Plots
To print a System Identification Toolbox plot, select File > Print in the plot
window. In the Print dialog box, select the printing options and click OK.
12-20
Customizing the System Identification Tool GUI
Customizing the System Identification Tool GUI
In this section...
“Types of GUI Customization” on page 12-21
“Displaying Warnings While You Work” on page 12-21
“Saving Session Preferences” on page 12-21
“Modifying idlayout.m” on page 12-22
Types of GUI Customization
The System Identification Tool GUI lets you customize the window behavior
and appearance. For example, you can set the size and position of specific
dialog boxes and modify the appearance of plots.
You can save the session to save the customized GUI state.
Advanced users might choose to edit the M-file that controls default settings,
as described in “Modifying idlayout.m” on page 12-22.
Displaying Warnings While You Work
In the System Identification Tool GUI, select Options > Warnings to display
informational dialog boxes while you work. Verify that a check mark appears
to the right of Warnings.
To stop warnings from being displayed during your session, select
Options > Warnings and clear the check mark.
Saving Session Preferences
Use Options > Save preferences to save the current state of the System
Identification Tool GUI. This command saves the following settings to a
preferences file, idprefs.mat:
• Size and position of the System Identification Tool GUI
• Sizes and positions of dialog boxes
12-21
12
Using the System Identification Tool GUI
• Four recently used sessions
• Plot options, such as line styles, zoom, grid, and whether the input is
plotted using zero-order hold or first-order hold between samples
You can only edit idprefs.mat by changing preferences in the GUI.
The idprefs.mat file is located in the same directory as startup.m, by
default. To change the location where your preferences are saved, use the
midprefs command with the new path as the argument. For example:
midprefs('c:\matlab\toolbox\local\')
You can also type midprefs and browse to the desired directory.
To restore the default preferences, select Options > Default preferences.
Modifying idlayout.m
Advanced users might want to customize the default plot options by editing
idlayout.m.
To customize idlayout.m defaults, save a copy of idlayout.m to a folder in
your matlabpath just above the ident directory level.
Caution Do not edit the original file to avoid overwriting the idlayout.m
defaults shipped with the product.
You can customize the following plot options in idlayout.m:
• Order in which colors are assigned to data and model icons
• Line colors on plots
• Axis limits and tick marks
• Plot options, set in the plot menus
• Font size
12-22
Customizing the System Identification Tool GUI
Note When you save preferences using Options > Save preferences
to idprefs.mat, these preferences override the defaults in idlayout.m.
To give idlayout.m precedence every time you start a new session, select
Options > Default preferences.
12-23
12
12-24
Using the System Identification Tool GUI
Index
A
Index
active
model in GUI 8-5
advice
for data 1-84
for models 8-7
AIC 8-61
definition 8-62
Akaike’s Final Prediction Error (FPE) 8-61
Akaike’s Information Criterion (AIC) 8-61
Algorithm property 2-15
algorithms for estimation
recursive 7-6
spectral models 3-5
aliasing effects 1-103
AR 6-7
ARMA 6-7
ARMAX 3-44
ARX 3-44
ARX Model Structure Selection window 3-55
B
best fit
definition 8-11
negative value 8-12
BJ model. See Box-Jenkins model
Bode plot 8-34
Box-Jenkins model 3-44
Burg’s method 6-11
C
c2d 3-112
complex data 1-131
concatenating
iddata objects 1-65
idfrd objects 1-71
models 3-124
confidence interval
impulse response plot 8-29
model output plot 8-13
noise spectrum plot 8-41
residual plot 8-18
step response plot 8-29
confidence interval on plots 8-65
constructor 2-12
continuous-time models
supported 2-7
continuous-time process models 3-22
Control System Toolbox
combining model objects 10-6
converting models to LTI objects 10-4
for compensator design 10-3
LTI Viewer 10-5
reducing model order 10-3
correlation analysis 3-14
covariance 8-64
CovarianceMatrix 8-64
cra 3-16
cross-validation 8-4
custom network 4-25
D
D matrix 3-89
d2c 3-112
d2d 3-112
canonical parameterization 3-91
Index-1
Index
data
creating iddata object 1-47
creating idfrd object 1-67
creating subsets 1-31
detrending 1-94
exporting to MATLAB workspace 1-45
filter 1-107
frequency-domain 1-8
frequency-response 1-10
importing into System Identification Tool
GUI 1-13
managing in GUI 1-13
merging 1-33
missing data 1-90
multiexperiment data 1-33
outliers 1-91
plotting 1-75
renaming in GUI 1-41
resampling 1-100
sampling interval 1-28
segmentation 7-14
selecting 1-86
simulating 1-115
supported types 1-5
time-domain 1-6
time-series 1-7
transforming domain 1-119
viewing properties in GUI 1-40
Data Board 12-6
arranging icons 1-43
deleting icons 1-44
data tip 12-15
dead time 3-41
dead zone 4-25
delay
estimating for polynomial models 3-49
detrending data 1-94
discrete-time models
supported 2-8
Index-2
E
estimating models
black-box polynomial 3-41
commands 2-9
frequency response 3-2
Hammerstein-Wiener 4-15
linear grey-box 5-6
nonlinear ARX 4-4
nonlinear grey-box 5-16
process models 3-22
recursive estimation 7-2
state-space 3-73
time-series 6-1
transient response 3-14
uncertainty 8-64
EstimationInfo property 2-16
etfe
algorithm 3-5
export
data to MATLAB workspace 1-45
model to MATLAB workspace 12-13
F
filtering data 1-107
forgetting factor algorithm 7-10
FPE 8-61
free parameterization 3-84
frequency resolution 3-6
frequency response
estimating in the GUI 3-3
etfe 3-5
spa 3-5
spafdr 3-5
frequency-domain data 1-8
frequency-response data 1-10
frequency-response function 3-9
frequency-response plot 8-32
Bode plot 8-35
Nyquist plot 8-38
Index
H
Hammerstein-Wiener models 4-15
Hammerstein-Wiener plot 8-56
impulse-response plot 8-24
independence test 8-16
initial states for simulation and prediction 9-8
I
K
idarx 2-13
iddata
K matrix 3-89
Kalman filter algorithm 7-8
concatenating 1-65
creating 1-47
subreferencing 1-55
ident 12-4
L
idfrd
concatenating 1-71
creating 1-67
model 2-13
subreferencing 1-70
idgrey 2-13
idlayout.m 12-22
idnlarx 2-13
idnlgrey 2-13
idnlhw 2-13
idpoly 2-13
idproc 2-13
idss 2-13
importing
data into System Identification Tool
GUI 1-13
impulse response
computing values 3-18
confidence interval 8-29
definition 3-14
estimating in the GUI 3-15
impulse 3-16
linear grey-box models 5-6
linear models
extracting numerical data 3-108
transforming between continuous and
discrete time 3-112
transforming between structures 3-117
LTI Viewer 10-5
M
MDL 3-54
merging
data 1-33
models 3-128
methods 2-11
missing data 1-90
Index-3
Index
model
black-box polynomial 3-41
estimating frequency response 3-2
estimating process model 3-22
estimating transient response 3-14
exporting to MATLAB workspace 12-13
grey-box estimation 5-1
Hammerstein-Wiener estimation 4-15
importing into GUI 12-9
linear grey-box estimation 5-6
managing in GUI 12-9
nonlinear ARX estimation 4-4
nonlinear black-box estimation 4-1
nonlinear grey-box estimation 5-16
ordinary difference equation 5-1
ordinary differential equation 5-1
plotting 8-4
predict output 9-7
properties 2-14
recursive estimation 7-2
reducing order using balred 10-3
reducing order using pole-zero plot 8-51
refining linear parametric 3-103
refining nonlinear black-box 4-28
renaming in GUI 12-11
state-space 3-73
time-series 6-1
uncertainty 8-64
validating 8-2
viewing properties in GUI 12-10
Model Board 12-6
arranging icons 12-11
deleting icons 12-12
Index-4
model object
concatenating 3-124
definition 2-11
instantiating 2-12
merging 3-128
methods 2-11
properties 2-11 2-14
types of 2-13
model order
definition 3-41
estimating for polynomial models 3-49
estimating for state-space 3-79
too high or too low 8-67
Model Order Selection window 3-83
model output
confidence interval 8-13
model output plot 8-8
model properties
accessing 2-17
help on 2-19
specifying 2-16
multiexperiment data 1-33
N
neural network 4-25
noise
converting to measured channels 3-122
evidence in estimated model 8-69
subreferencing 3-120
noise spectrum
confidence interval 8-41
noise spectrum plot 8-40
nonlinear ARX models 4-4
nonlinear ARX plot 8-52
nonlinear grey-box models 5-16
nonlinear models 4-1
nonlinearities 4-25
nonlinearity estimators 4-25
troubleshooting 8-68
Index
normalized gradient algorithm 7-11
O
OE model. See Output-Error model
offset levels 1-94
order. See model order
outliers 1-91
Output-Error model 3-44
P
pem
for polynomial models 3-61
for process models 3-29
for state-space models 3-87
periodogram
etfe for time series 6-5
physical equilibrium 1-94
piece-wise linear 4-25
plot
copy to MATLAB Figure window 12-19
data 1-75
data tip 12-15
in LTI Viewer 10-5
models 8-4
models in the GUI 8-5
print 12-20
selecting noise channels 12-18
pole-zero cancelation 8-51
pole-zero plot 8-47
polynomial models 3-41
estimating order 3-49
for time-series 6-7
polynomial nonlinearity 4-25
predicting model output 9-1
initial states 9-8
prediction 9-7
print plot 12-20
process model 3-22
definition 3-22
properties
for models 2-14
R
recursive estimation 7-2
reducing model order
using balred 10-3
using pole-zero plot 8-51
refining models
linear 3-104
linear parametric 3-103
nonlinear 4-28
nonlinear black-box 4-28
using pem 3-105 4-29
renaming data 1-41
resampling data 1-100
avoiding aliasing 1-103
residual analysis
confidence interval 8-18
plot 8-16
residuals
plotting using the System Identification
Tool 8-21
Rissanen’s Minimum Description Length
(MDL) 3-54
robust criterion
for outliers 1-91
S
sampling interval 1-28
saving session preferences 12-21
segmentation of data 7-14
selecting data 1-86
Index-5
Index
session
definition 12-3
managing in GUI 12-3
preferences 12-21
starting 12-4
sigmoid network 4-25
simulating data 1-115
simulating model output 9-1
initial states 9-8
Simulink 11-2
slident 11-3
spa
algorithm 3-5
spafdr
algorithm 3-5
spectral analysis 3-2
algorithm 3-5
frequency resolution 3-6
spectrum normalization 3-11
spectrum normalization 3-11
state-space models 3-73
canonical parameterization 3-91
estimating order 3-79
for time series 6-12
free parameterization 3-84
structured parameterization 3-93
supported parameterization 3-78
step response
computing values 3-18
confidence interval 8-29
definition 3-14
estimating in the GUI 3-15
step 3-16
step-response plot 8-24
structured parameterization 3-93
Index-6
subreferencing
iddata objects 1-55
idfrd objects 1-70
model channels 3-119
model noise channels 3-120
models 3-119
System Identification Tool GUI
customizing 12-21
exiting 12-8
help 12-7
open 12-4
organizing icons 1-43 12-11
plots 12-15
window 12-5
workflow 12-2
System Identification Toolbox blocks 11-2
for data 11-4
for model identification 11-5
for simulating models 11-6
open 11-3
T
time-domain data 1-6
time-series data 1-7
time-series models 6-1
transforming data domain 1-119
Trash 1-44 12-12
tree partition 4-25
troubleshooting models 8-67
complicated nonlinearities 8-71
high noise content 8-69
missing inputs 8-70
model order 8-67
nonlinearity estimators 8-68
unstable models 8-69
Index
U
W
uncertainty of models 8-64
confidence interval on plots 8-65
covariance 8-64
unnormalized gradient algorithm 7-11
unstable models 8-69
warnings 12-21
wavelet network 4-25
whiteness test 8-16
Working Data 1-29
V
validating models 8-2
comparing model output 8-8
residual analysis 8-16
troubleshooting 8-67
Validation Data 1-29
X
X0 matrix 3-89
Y
Yule-Walker approach 6-11
Index-7