1
Identifying State-Space Models
Using the Model Order Selection Window
You can generate the Model Order Selection window for your data to select
the number of states that provide the highest relative contribution to the
input-output behavior of the model (log of singular values of the covariance
matrix).
For a procedure on generating this plot in the System Identification Tool
GUI, see “Estimating Model Order in the GUI” on page 3-79. To open this
plot at the command line, see “Estimating the Model Order at the Command
Line” on page 3-82.
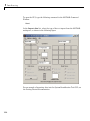
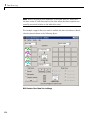
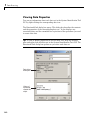
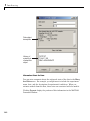
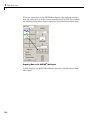
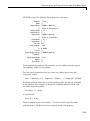
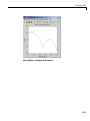
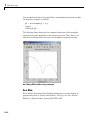
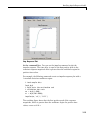
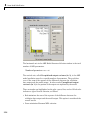
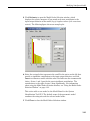
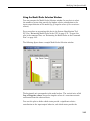
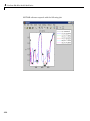
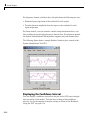
The following figure shows a sample Model Order Selection window.
The horizontal axis corresponds to the model order n. The vertical axis, called
Log of Singular values, shows the singular values of a covariance matrix
constructed from the observed data.
You use this plot to decide which states provide a significant relative
contribution to the input-output behavior, and which states provide the
3-83