1
Drivers
series
SIGNUM SYSTEMS CORPORATION
RDI Drivers for Third Party ARM Debuggers
with JTAGjet
Installation
Instructions
COPYRIGHT NOTICE
Copyright (c) 2007 by Signum Systems Corporation. All rights are reserved worldwide. No
part of this publication may be reproduced, transmitted, transcribed, stored in a retrieval
system, or translated into any language or computer language, in any form or by any means,
electronic, mechanical, magnetic, optical, chemical, manual, or otherwise, without the prior
written permission of Signum Systems.
DISCLAIMER
Signum Systems makes no representations or warranties with respect to the contents hereof
and specifically disclaims any implied warranties of merchantability or fitness for any
particular purpose. Also, Signum Systems reserves the right to revise this publication and to
make changes from time to time in the content hereof without obligation of Signum Systems
to notify any person or organization of such revision or changes.
WARRANTY
Signum Systems warrants to the original purchaser that this product is free of defects in
material and workmanship and performs to applicable published Signum Systems
specifications for a period of SIX MONTHS from the date of shipment. If defective, the
product must be returned to Signum Systems, prepaid, within the warranty period, and it will
be repaired or replaced (at our option) at no charge. Equipment or parts which have been
subject to misuse, abuse, alteration, neglect, accident, unauthorized installation or repair are
not covered by warranty. This warranty is in lieu of any other warranty expressed or implied.
IN NO EVENT SHALL SIGNUM SYSTEMS BE LIABLE FOR CONSEQUENTIAL
DAMAGES OF ANY KIND. It is up to the purchaser to determine the reliability and
suitability of this product for his particular application.
1211 FLYNN RD., UNIT #104
CAMARILLO, CA 93012, U.S.A
PHONE 805 • 383 • 3682
W W W . S I G N U M . C O M
SWII-C-RDI- Drv 7.3.06.14.29 80
This document describes the installation process for the RDI, or
Remote Debug Interface, driver used with the Signum emulators for the ARM
processors. Outlined are the software configuration processes for several popular
ARM debuggers. (Other RDI compatible debuggers should be configured
similarly.)
Purpose
Installing the Driver
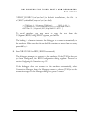
1.
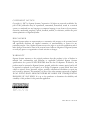
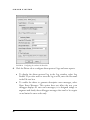
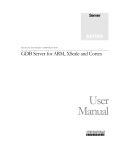
Insert the Development Tools for Microsoft Windows CD into the CD-ROM
drive. In the Master Setup dialog box, select Drivers/Arm/RDI Driver
for Signum Emulators (Figure 1).
FIGURE 1 Master Setup dialog box.
1
SI GNUM
2.
S YS TE MS
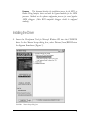
When the Setup program starts, select the program folder for the
program icons and the destination folder for the RDI driver to be
installed in.
FIGURE 2 Selecting the folder for the driver.
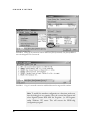
In the confirmation dialog box, press the Next button to copy the driver files
to your hard drive:
2
RDI
DRIV ERS
FO R
THI RD
P AR TY
AR M
DEBUG GE RS
W I T H
J T A G J E T
FIGURE 3 Confirming the driver location.
3.
Connect the emulator JTAG cable to the JTAG connector on your ARM
system or evaluation board. Use either the 20-pin or the 14-pin JTAG
connector, depending on your target board. For examples of connecting
the emulator with selected target boards, see the ARM Board Setup User
Guide. Turn the emulator on first, and then turn on your target board.
Finally, configure your debugger, as described in section Configuring the
Debugger below.
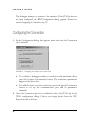
Configuring the Debugger
With the ARM RDI driver for Signum emulators installed, you are ready to
configure your Debugger. The configuration process varies from debugger to
debugger. In the next several sections, you will find configuration details for
several popular debuggers:
3
SI GNUM
•
•
•
•
•
•
•
•
•
•
S YS TE MS
ARM Ltd. RealView Debugger
ARM Lt. AXD, SDT and ADS Debuggers
eSol eBinder
GNU gdb Debugger
Green Hills Software Multi-2000 Debugger
IAR Software Embedded Workbench for ARM (EWARM)
Keil uVision3
Mentor Graphics XRAY
Metrowerks CodeWarrior
Palm Software Universal Debugger (PUD)
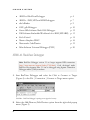
p. 4
p. 7
p. 9
p. 10
p. 12
p. 13
p. 15
p. 16
p. 19
p. 20
ARM Ltd. RealView Debugger
Note: RealView Debugger version 3.1 no longer supports RDI connections
(http://www.arm.com/support/faqdev/17010.html). Code developed under
RealView Development Suite 3.1 can be debugged using Signum Chameleon
Debugger and the JTAGjet emulator.
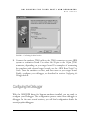
1.
Start RealView Debugger and select the Click to Connect to Target
(Figure 4) or the File | Connection | Connect to Target menu option.
FIGURE 4 RealView Debugger’s opening screen (upper left corner).
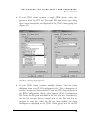
2.
4
Select the Add/Remove/Edit Devices option from the right-click popup
menu (Figure 5).
RDI
DRIV ERS
FO R
THI RD
P AR TY
AR M
DEBUG GE RS
W I T H
J T A G J E T
FIGURE 5 The Connection Control dialog box.
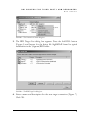
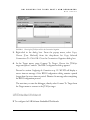
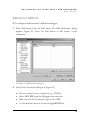
3.
The RDI Target List dialog box appears. Press the Add DLL button
(Figure 6) and browse for the driver file SigJdsDI.dll found in typical
installations in the \Signum\RDI folder.
FIGURE 6 The RDI Target List dialog box.
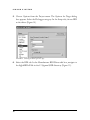
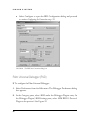
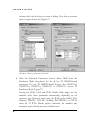
4.
Enter a name and description for the new target connection (Figure 7).
Click OK.
5
SI GNUM
S YS TE MS
FIGURE 7 Naming and describing the new target connection.
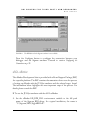
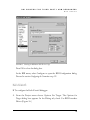
5.
Make sure that the new target entry appears in the RDI target list (Figure
8) and close the RDI Target List dialog box.
FIGURE 8 The augmented target list.
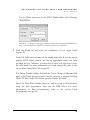
6.
6
In the Connection Control dialog box, right-click the new connection
entry and select Configure Device Info from the popup menu (Figure 9).
RDI
DRIV ERS
FO R
THI RD
P AR TY
AR M
DEBUG GE RS
W I T H
J T A G J E T
FIGURE 9 The augmented target list.
When the RDI Configuration dialog box appears, proceed to section
Configuring the Connection on p. 22 to complete the system configuration
process.
ARM Ltd. AXD, SDT and ADS Debuggers
The ARM RDI driver for Signum emulators is compatible with all the ARM
debuggers that conform to the RDI specification, including:
•
•
•
ARM extended Debugger (AXD) for Windows,
ARM Debugger for Windows SDT 2.51 and higher,
ARM Debugger for Windows ADS v1.0.1 and higher.
The following debugger configuration procedure uses the AXD debugger as an
example. In most situations, extending this procedure to other debuggers will be
straightforward.
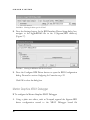
1.
Run the ARM debugger.
2.
From the debugger’s Options menu, select Configure Target. The
Choose Target dialog appears.
7
SI GNUM
S YS TE MS
FIGURE 10 Selecting the driver DLL.
3.
8
Press the Add button. In the Windows Open dialog, navigate to the
ARM RDI driver file. If you accepted the defaults from the Installing the
Driver section, the path to the driver file should be
C:\Signum\RDI\SigJdsRDI.dll. Click the Open button. The driver is
now listed in the Choose Target dialog box.
RDI
DRIV ERS
FO R
THI RD
P AR TY
AR M
DEBUG GE RS
W I T H
J T A G J E T
FIGURE 11 The RDI driver for the Signum emulator is now available.
Press the Configure button to configure the connection between your
debugger and the Signum emulator. Proceed to section Configuring the
Connection on p. 22.
eSOL eBinder
The eBinder Development Suite is provided with a Board Support Package (BSP)
for a specific platform. The BSP contains documentation that covers the process
of setting up eBinder with the JTAGjet emulator and the selected target board.
The information below highlights the most important steps of the process. For
details, please consult the BSP.
! To use the JTAGjet emulator with the eSOL seBinder:
1.
Set the eBinder EB_RDI_DLL environment variable to the full path
name of the Signum RDI driver. In a typical installation, the name is
“C:\Signum\RDI\SigJdsRDI.dll”.
9
SI GNUM
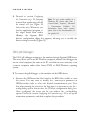
2.
S YS TE MS
Proceed to section Configuring
Note: To set a system variable on a
the Connection on p. 22, keeping
Windows XP system, click Start |
in mind that semihosting should
Control Panel | Systems | Advanced
be turned off (see Figure 28
| Environment Variables. For
later in the text). Whenever you
information about other systems,
load an application program to
please refer to the documentation of
the target board from within
the specific OS.
eBinder, the Signum RDI
driver’s configuration dialog box appears, allowing you to modify the
driver settings as needed (Figure 24).
GNU gdb Debugger
The GNU gdb debugger connects to the emulator through Signum GDB Server.
The server must run on an MS Windows computer, whereas the debugger can
run on a local computer (the same as the PC on which the server executes) or on
a remote computer under either Linux/UNIX or DOS/Windows operating
system.
! To connect the gdb debugger to the emulator via the GDB Server:
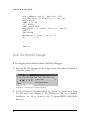
1.
10
Execute the GDBserver.bat file found in the RDI driver folder to start
the server. You may want to modify the --remote-port parameter in
GDBserver.bat order to select the desired communication port. Note
that when running the server for the first time, it is necessary to use the –
config-dialog option that invokes the JTAGjet configuration dialog box.
Once configured, the server can be run without the --config-dialog
option. Proceed to section Configuring the Connection on p. 22 to set up the
connection parameters, and then complete this procedure.
RDI
DRIV ERS
FO R
THI RD
P AR TY
AR M
DEBUG GE RS
W I T H
2.
Start the gdb debugger. To
establish connection with the
GDBserver, run “target remote
<host>:<port>” command, as
shown in the following
examples.
•
J T A G J E T
Note: The server folder contains the
cygwin1.dll library file. You may want
to rename this file if it is in conflict
with your version of cygwin1.dll.
To connect to the server from a remote host computer named
“celeronti” via port 9000, enter:
target remote celeronti:9000
•
To connect to the server on the local machine, enter:
target remote localhost:9000
As another example, the beginning of a remote debug session might look like
this:
$ arm-elf-gdb x.elf
GNU gdb 5.3
Copyright 2002 Free Software Foundation, Inc.
GDB is free software, covered by the GNU General
Public License, and you are
welcome to change it and/or distribute copies of it
under certain conditions.
Type "show copying" to see the conditions.
There is absolutely no warranty for GDB. Type
"show warranty" for details.
This GDB was configured as "--host=i686-pc-cygwin -target=arm-elf"...
(gdb) target remote celeronti:9000
Remote debugging using celeronti:9000
main () at x.c:34
34
a = 0;
(gdb) load x.elf
Loading section .text, size 0x1f10 lma 0x8000
Loading section ..rodata, size 0x29 lma 0x9f10
Loading section .data, size 0x850 lma 0xa03c
Loading section .ctors, size 0x8 lma 0xa88c
Loading section ..dtors, size 0x8 lma 0xa894
11
SI GNUM
S YS TE MS
Start address 0x8000, load size 10137
Transfer rate: 81096 bits in <1 sec, 151
bytes/write.
(gdb) p /x $pc
$1 = 0x8000
(gdb) break main
Breakpoint 1 at 0x8220: file x.c, line 34.
(gdb) c
Continuing.
Breakpoint 1, main () at x.c:34
34
a = 0;
.
.
.
And so on
Green Hills Multi2000 Debugger
! To configure the GreenHills Software Multi2000 Debugger:
1.
Start the MULTI debugger. In the Target menu, select Show Connection
Organizer (Figure 12).
FIGURE 12 Activating the Connection Organizer.
2.
12
In the Connection Organizer dialog box (Figure 13), select Open from
the File menu and navigate to the JTAGjet.con file. In a standard
installation, the file is found in the C:\Signum\RDI\Config\Multi
directory.
RDI
DRIV ERS
FO R
THI RD
P AR TY
AR M
DEBUG GE RS
W I T H
J T A G J E T
FIGURE 13 Choosing the JTAGjet.con file in the Connection Organizer.
3.
Right-click in the dialog box. From the popup menu, select Copy.
Choose [User Methods] from the drop-down list Copy Selected
Connections To. Click OK. Close the Connection Organizer dialog box.
4.
In the Target menu, press Connect To Target. Choose the JTAGjet
target and press Connect. The RDI Configuration dialog appears.
Proceed to section Configuring the Connection on p. 22. MULTI will display a
server timeout message if the RDI Configuration dialog remains opened
longer than the server timeout period. Dismiss this message after completing
the RDI Configuration process.
The next time you start the debugger, directly select Connect To Target from
the Target menu to connect to the JTAGjet target.
IAR Embedded Workbench
! To configure the IAR Software Embedded Workbench:
13
SI GNUM
5.
S YS TE MS
Choose Options from the Project menu. The Options for Target dialog
box appears. Select the Debugger category. In the Setup tab, choose RDI
as the driver (Figure 14).
FIGURE 14 Selecting the driver type for C-Spy.
6.
14
Select the RDI tab. In the Manufacturer RDI Driver edit box, navigate to
the SigJdsRDI.dll file in the C:\Signum\RDI directory (Figure 15).
RDI
DRIV ERS
FO R
THI RD
P AR TY
AR M
DEBUG GE RS
W I T H
J T A G J E T
FIGURE 15 Selecting the RDI driver DLL file for C-Spy.
Press OK to close the dialog box.
In the RDI menu, select Configure to open the RDI Configuration dialog.
Proceed to section Configuring the Connection on p. 22.
Keil uVision3
! To configure the Keil uVisoin3 debugger:
1.
From the Project menu choose Options For Target. The Options for
Target dialog box appears. In the Debug tab, check Use RDI Interface
Driver (Figure 16.)
15
SI GNUM
S YS TE MS
FIGURE 16 Selecting the driver type for uVision3.
2.
Press the Settings button. In the RDI Interface Driver Setup dialog box,
navigate to the SigJdsRDI.dll file in the C:\Signum\RDI directory,
(Figure 17).
FIGURE 17 Selecting the RDI driver DLL file for uVision3.
3.
Press the Configure RDI Driver button to open the RDI Configuration
dialog. Proceed to section Configuring the Connection on p. 22.
Click OK to close the dialog box.
Mentor Graphics XRAY Debugger
! To configure the Mentor Graphics XRAY Debugger:
1.
16
Using a plain text editor, such as Notepad, append the Signum RDI
driver configuration record to the XRAY Debugger board file
RDI
DRIV ERS
FO R
THI RD
P AR TY
AR M
DEBUG GE RS
W I T H
J T A G J E T
%XRAY_HOME%\etc\aro.brd (in default installations, the file
c:\MGC\embedded\xrayose\etc\aro.brd):
is
+ JTAGjet 0 "Signum JTAGjet"
"RDI 1.5" \
{ type=multi-ice:endian=little:chip=ARM7TDMI:
rdilib="C:\Signum\RDI\SigJdsRDI.dll" }
To avoid mistakes, you may want to copy the text from the
C:\Signum\RDI\Config\XRAY\signum_aro.brd file.
The leading + character instructs the debugger to connect automatically to
the emulator. Make sure that the aro.brd file contains no more than one entry
preceded by +.
2.
Start XRAY OSE for RDI (ARM Freezemode)
The debugger attempts to connect to the emulator. If the JTAGjet has not
yet been configured, the RDI Configuration dialog appears. Proceed to
section Configuring the Connection on p. 22.
If the debugger does not connect to the emulator automatically, select
Connection Manager from the Managers menu to choose JTAGjet as the
connection target. In the Manager dialog box, press Connect.
17
SI GNUM
S YS TE MS
FIGURE 18 Setting up the connection between XRAY and JTAGjet manually. The JTAGjet RDI 1.5
server should appear in the Connect tab.
FIGURE 19 A log of a successful connection established between the target and the emulator.
Note: To modify the emulator configuration at a later time, make sure
that the debugger is not running. Press the system Start button and
select Signum Systems RDI from the Programs (or All Programs
under Windows XP) menu. This will execute the RDIConfig
configuration program.
18
RDI
DRIV ERS
FO R
THI RD
P AR TY
AR M
DEBUG GE RS
W I T H
J T A G J E T
Metrowerks CodeWarrior
! To configure the Metrowerks CodeWarrior debugger:
1.
Select Preferences form the Edit menu. The IDE Preferences dialog
appears (Figure 20). Press the Add button to add (create) a new
connection.
FIGURE 20 The IDE Preferences dialog box.
2.
In the New Connection dialog box (Figure 21):
•
•
•
•
Choose a name for your connection, e.g., JTAGjet.
Select ARM RDI from the Debugger drop-down list.
Make sure that the Connecion Type is set to RDI.
Use the Browse button to locate the SigJdsRDI.dll file.
19
SI GNUM
•
S YS TE MS
Select Configure to open the RDI Configuration dialog and proceed
to section Configuring the Connection on p. 22.
FIGURE 21 The IDE New Connection dialog box.
Palm Universal Debugger (PUD)
! To configure the Palm Universal Debugger:
1.
Select Preferences from the Edit menu. The Debugger Preferences dialog
box appears.
2.
In the Category pane, select ARM under the Debugger Plugins entry. In
the Debugger Plugins/ARM Settings pane, select ARM RDI1.5 Protocol
Plugin as the protocol. See Figure 22.
20
RDI
DRIV ERS
FO R
THI RD
P AR TY
AR M
DEBUG GE RS
W I T H
J T A G J E T
FIGURE 22 Selecting the protocol for the ARM Debugger Plugin.
3.
In the Category pane, select ARM RDI 1.5 under the Protocols entry. In
the Debugger Plugins/ARM Settings pane, navigate to the SigJdsRDI.dll
file to set the Path to RDI DLL entry. In a standard installation, the
SigJdsRDI.dll file is located in the C:\Signum\RDI folder. See Figure 23.
FIGURE 23 Selecting the path to the RDI 1.5 DLL file for the ARM RDI 1.5 protocol.
4.
Select Connect in the menu Target.
21
SI GNUM
S YS TE MS
The debugger attempts to connect to the emulator. If the JTAGjet has not
yet been configured, the RDI Configuration dialog appears. Proceed to
section Configuring the Connection on p. 22.
Configuring the Connection
1.
In the Configuration dialog that appears, make sure that the Connection
tab is selected.
FIGURE 24 Configuring the emulator: the Connection tab.
•
2.
22
To establish a debugger-emulator connection with minimum effort,
press the Connect Automatically button. The connection parameters
appear in the Status box.
• For added control over the connection, press the Specify Connection
button to set up the communication port and its parameters
manually.
Once the connection has been established, select the JTAG tab in the
JTAG configuration dialog. Choose your target device from the CPU
drop-down list as follows.
RDI
DRIV ERS
FO R
THI RD
P AR TY
AR M
DEBUG GE RS
W I T H
•
J T A G J E T
If your JTAG chain contains a single ARM device, select the
processor from the CPU list. The name (ID) and device type, along
with a short description, are displayed in the JTAG Chain group box
(Figure 25):
FIGURE 25 Selecting a single target CPU.
•
If your JTAG chain contains multiple devices, load the chain
definition form your JTAG configuration file. (For a description of
the file’s format, see section below). From the CPU drop-down list in
the RDI Configuration dialog, select Specify JTAG Configuration
File. Enter the file path and name in the File text box. Alternatively,
use the file browser button located next to the File text box to
navigate to your file. After the file has been loaded, the chain
description is displayed in the JTAG Chain group box. In the ID
23
SI GNUM
S YS TE MS
column, click on the device you want to debug. Note that you cannot
select a bypass device (see Figure 17):
FIGURE 26 Selecting a multi-device JTAG chain.
•
24
Click the Advanced Parameters button. Select ARM from the
Emulation Mode drop-down list for all but TI ARM925-based
processors. For the TI ARM925-based devices, like OMAP1510,
OMAP5910, OMAP710, OMAP310, or OMAP331, choose TI
Emulation Mode (Figure 27).
Leaving the JTAG Clock and JTAG Header fields empty lets the
emulator select those parameters automatically, depending on the
processor type. However, when using the JTAG probe labeled TI-14
(formerly TMS320), TI-14-ISO (formerly ISO-TMS320), or CTI-20,
select the TI JTAG Header option. Otherwise, the emulator may
incorrectly report that the processor is held in reset.
RDI
DRIV ERS
FO R
THI RD
P AR TY
AR M
DEBUG GE RS
W I T H
J T A G J E T
For the XScale processor, set the JTAG Header field to the following:
ARM,TRST:1.
FIGURE 27 An example of selecting the emulation mode for Texas Instruments ARM925-based
devices, such as OMAP1510, OMAP5910, OMAP710, OMAP310, or OMAP331.
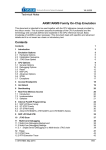
3.
Click the Board tab and select the endianness of your target board
(Figure 28).
In the File field, enter the name of the startup macro file. If you are using a
popular EVM board, chances are that an appropriate macro has been
provided for you. Otherwise, you may need to write your own one or leave
the field blank. For more information on board startup files refer to the
section Board Startup Macro File on page 28.
The Debug Handler Address field and the Vector Changes in Runtime field
apply to the XScale processor only. It may be necessary to increase the Sleep
After CPU Reset value if the XScale processor cannot be halted.
Select the Flash Write Enable option to load the code to flash memory
using the flash programmer built into the RDI driver. For more
information on flash programming, refer to the section Flash
Programming on page 30.
25
SI GNUM
S YS TE MS
FIGURE 28 Configuring the emulator: the Board tab.
4.
Click the Driver tab to configure driver protocol logs and error reports.
•
•
26
To display the driver protocol log in the Log window, select Log
Enable. If you also need to store the log in a file, enter the file name
in the File text box.
To enable the driver to generate descriptive error messages, select
Show Error Messages. This option does not affect the way your
debugger displays its own error messages; it is designed simply to
augment and clarify those debugger messages that tend to be cryptic
or are limited to error codes only.
RDI
DRIV ERS
FO R
THI RD
P AR TY
AR M
DEBUG GE RS
W I T H
J T A G J E T
FIGURE 29 Configuring the emulator: the Driver tab.
5.
Click OK. In the Choose Target dialog box, click OK again to accept
your settings and connect to the target processor.
Multi Device Configuration
A multi-device JTAG daisy chain is configured using an ASCII text JTAG chain
configuration file with extension .cfg. With the exception of comment lines, each
line in a .cfg file refers to a separate device. Thus in general, the file format is as
follows:
ID1
ID2
.
.
.
etc.,
Device1
Device2
Description1
Description2
where
ID
Is a unique name identifying the device, e.g., "CPU_1",
including the double quotes.
27
SI GNUM
S YS TE MS
Device
Description
Is the type of the device, such as ARM7TDMI. Non-ARM
devices should be bypassed, and specified as BYPASSxx,
where xx denotes the length of the instruction register
in a two-digit format. For instance, BYPASS0A denotes a
bypassed device with a 10-bit (0a hex) instruction register.
Is a comment text.
In general, enclose in double quotes all names, words or phrases that contain
non-alphanumeric characters. Lines that begin with the semicolon (;) are treated
as comments and are ignored. The order in which the JTAG devices are specified
in the configuration file is significant: the first line corresponds to the device
closest to the TDI, the second one to the next device in the chain, and so on.
Finally, the last line describes the device on the TDO side of the chain.
Board Startup Macro File
Some application boards may require to be properly set up before a debug
session can begin. Use a startup macro to enable or configure on-board memory
before the debugger attempts to access that memory. The macro is also a good
place for disabling the watchdog that otherwise may reset the CPU soon after the
debugger starts running.
Table 1 lists the commands that can be executed from within the board’s ASCII
.mac strtup file.
sd <address> = <value>
sw <address> = <value>
sb <address> = <value>
28
Write a DWORD (32bit) <value> to memory
<address>.
Write a WORD (16bit) <value> to memory
<address>.
Write a BYTE (8bit) <value> to memory
<address>.
RDI
DRIV ERS
FO R
THI RD
P AR TY
AR M
DEBUG GE RS
W I T H
dd <address>
dw <address>
db <address>
reset /halt
pause <msec>
emu <parameter> = <value>
J T A G J E T
Read a DWORD (32bit) from memory
<address>.
Read a WORD (16bit) from memory
<address>.
Read a BYTE (8bit) from memory
<address>.
Reset the CPU. The /halt option stops the
CPU after the reset.
Pause for the <msec> number of
milliseconds.
Set one of the following emulation
parameters:
•
cmdline (argument string for the
debugger)
•
semihosting_enabled (0 – disabled, 1 –
enabled)
TABLE 1 Configuration file commands.
Empty lines, spaces and comments starting with a semicolon are ignored.
The following is an example of a typical startup macro file.
29
SI GNUM
S YS TE MS
; MyTarget.mac - RDI Startup macro for MyTarget board.
; Version 1.00 7/10/02 - Initial version
reset /halt
sd 0xFFFE4000 = 0x032F0102
pause 100
; Reset and stop the CPU
; Setup PLL register
; Wait for clock setup
; Initialize memory
sd 0xFFFECC10 = 0x00203339
sd 0xFFFECC14 = 0x00001139
sd 0xFFFECC18 = 0x00001139
sd 0xFFFECC1C = 0x00001139
;
;
;
;
CS0
CS1
CS2
CS3
configuration
configuration
configuration
configuration
; Disable ARM watchdog
sw 0xFFFEC808 = 0x00F5
sw 0xFFFEC808 = 0x00A0
; Configure the emulator
emu semihosting_enabled=0
; disable virtual I/O
; End of file 'MyTarget.mac'
Flash Programming
The RDI driver is equipped with a build-in flash programmer for seamless
loading of application code to flash memory.
FIGURE 30 Configuring memory: the Board tab.
In the Board tab, select the Flash Write Enable check box and specify memory
configuration in the Config edit box (Figure 30). The configuration text lists
30
RDI
DRIV ERS
FO R
THI RD
P AR TY
AR M
DEBUG GE RS
W I T H
J T A G J E T
RAM memory and all flash devices you wish to load code to in the following
format:
RAM = <size>@<address>
FLASH = <type>@<address>
The configuration string is case insensitive. For example,
RAM=2K@0x2000_0000 FLASH=cfi@0x40_0000 FLASH=str9@0x10_0000
specifies that there is 2KB RAM at address 0x2000_0000 and a CFI-compliant
flash device at address 0x40_0000. RAM is to be used by the flash programmer.
The contents of the RAM is always preserved. If RAM is not specified, loading
the code to the flash will last much longer.
The list of supported flash types will be systematically expanded. Please check
with Signum Technical Support for the latest information on the subject. As of
this wrtitng, the following devices are supported by the programmer:
FLASH
TYPE
RAM REQUIRED
DESCRIPTION
CFI
Optional (uses <2KB)
STR9
Optional (uses <1KB)
A single 16-bit CFI compliant flash
device implementing Command Set 1
(Intel and Sharp) and Command Set 2
(AMD/Spansion, Fujitsu, Samsung and
Macronix).
STMicroelectronics STR9xx processor
internal flash.
TABLE 2 Configuration file commands.
SWII-B-RDI-Drv 2.28.08.12.51 80
31