1
Server
series
SIGNUM SYSTEMS CORPORATION
GDB Server for ARM, XScale and Cortex
User
Manual
COPYRIGHT NOTICE
Copyright (c) 2011 by Signum Systems Corporation. All rights are reserved worldwide. No part of this publication may be
reproduced, transmitted, transcribed, stored in a retrieval system, or translated into any language or computer language, in
any form or by any means, electronic, mechanical, magnetic, optical, chemical, manual, or otherwise, without the prior
written permission of Signum Systems.
DISCLAIMER
Signum Systems makes no representations or warranties with respect to the contents hereof and specifically disclaims any
implied warranties of merchantability or fitness for any particular purpose. Also, Signum Systems reserves the right to
revise this publication and to make changes from time to time in the content hereof without obligation of Signum
Systems to notify any person or organization of such revision or changes.
WARRANTY
Signum Systems warrants to the original purchaser that this product is free of defects in material and workmanship and
performs to applicable published Signum Systems specifications for a period of SIX MONTHS from the date of
shipment. If defective, the product must be returned to Signum Systems, prepaid, within the warranty period, and it will
be repaired or replaced (at our option) at no charge. Equipment or parts which have been subject to misuse, abuse,
alteration, neglect, accident, unauthorized installation or repair are not covered by warranty. This warranty is in lieu of any
other warranty expressed or implied. IN NO EVENT SHALL SIGNUM SYSTEMS BE LIABLE FOR
CONSEQUENTIAL DAMAGES OF ANY KIND. It is up to the purchaser to determine the reliability and suitability of
this product for his particular application.
UM-GDB 3.4.10.12.31 830
1211 FLYNN RD., UNIT #104
CAMARILLO, CA 93012, U.S.A
PHONE 805 • 383 • 3682
W W W . S I G N U M . C O M
Table of Contents
Preliminaries
1
License
1
Installation
2
Installation on Windows
2
Installation on Linux
2
Configuring the Server
3
Usage
3
Emulation Parameter File
5
Macro/Initialization Files
5
Board and CPU Customization
6
Loading to Flash
6
Configuring the Debugger
7
GNU GDB Debugger
7
Code Sourcery G++ IDE
8
Using GDB with the GDB Server
10
The GDB Monitor Command
10
Coprocessor and Peripheral Registers
11
Debugging Embedded Linux
13
i
GDB
server
Preliminaries
SigGdbServer is an implementation ofthe GDB Server for the Signum JTAGjet
emulator. It is used to debug ARM processors with GDB based debuggers on
Windows systems.
License
The SigGdbServer server is designed for the use with the Signum JTAGjet emulator. This
server-emulator tandem requires a license. If your emulator does not have it, an external license
file must be obtained from Signum Systems. Once received, the Jxxxxx-Gdb.lic file needs to be
placed in the directory where SigGdbServer.exe resides. (The xxxxx part of the actual file name
is the serial number of your JTAGjet emulator.) Alternately, the license file can be placed in the
C:\Signum\Licenses folder where it becomes available to other applications, such as Chameleon
Debugger or Flasher.
1
SI GNUM
S YS TE MS
8 3 0
Installation
Installation on Windows
To install the server package on a Windows system, execute the setup_siggdbserver.exe program.
The default installation folder is C:\Signum\SigGdbServer.
If a system-level JTAGjet USB driver has not yet been installed on your computer, the system
will prompt you for the appropriate driver upon connecting the emulator to the USB port for
the first time. Point the installation program to the Drivers\USB subfolder of the installation
folder (e.g., C:\Signum\SigGdbServer\Drivers\USB).
Installation Directory Content
Table 1
lists the files found in the GDB server installation directory.
D E L I V E R A B L E
D E S C R I P T I O N
SigGdbServer.exe
Command line GDB server executable.
.\bin\*.*
Server executable components.
.\docs\siggdb_server_um.pdf
This document.
.\docs\*.*
Additional documentation.
.\cores\*.def
CP15 register definition files.
.\boards\*.par, *.ini
CPU and target specific parameter and board initialization files.
.\targets\*.def
Peripheral register definition files.
.\Drivers\USB\*.*
JTAGjet USB driver.
TABLE 1 The contents of the installation directory.
First Time Run
Make sure that your emulator is connected to a USB port. A dialog box will prompt you to select
the JTAGjet emulator to be used with the server. Your selection will be saved in the Windows
registry and used in subsequent debug sessions. To connect to another emulator, use the
-connect option, which allows you to specify a new emulator serial number.
License Installation
A new JTAGjet emulator for GDB Server comes with a license already installed in the hardware.
When converting (upgrading) a JTAGjet emulator to work with the GDB Server, Signum
provides an appropriate *.lic license file. Copy this file to either the C:\Signum\Licenses or the
SigGdbServer folder.
Installation on Linux
1.
2
Before installing SigGdbServer on a Linux computer for the first time, you must install the
JTAGjet USB driver and verify that it is working properly:
GDB
SER VER
FO R
AR M,
X SC AL E
AN D
COR TE X
U S E R
M A N U A L
2.
Install the JTAGjet USB driver for Linux from the jtagjetdrv_<version>-2.deb package: sudo
dpkg
--install
jtagjetdrv_1.2-2.deb.
Detailed instructions are in the
jtagjetdrv_README.txt file.
Install USBDiag from the USBDiag_<version>.tar archive. Detailed instructions are in the
USBDiag_README.txt file.
In a directory of your choice, unpack SigGdbServer for Linux from the
SigGdbServer-1.07.03.tar.gz tarball.
First Time Run
Make sure that your emulator is connected to a USB port. Execute the USBDiag program to
verify that the JTAGjet USB driver has been installed correctly:
./USBDiag -t
License Installation
A new JTAGjet emulator for Linux comes with a license already installed in the hardware. When
converting (upgrading) a JTAGjet emulator to work with the GDB Server, Signum provides an
appropriate *.lic license file. Copy this file to either the $HOME/Signum/Licenses or
/etc/Signum/Licenses directory. This will make the license available to all your Signum
applications. To make the license available exclusively to the Signum GDB server, put the license
file in the directory where you installed SigGdbServer.
Configuring the Server
Usage
SigGdbServer.exe displays usage information if executed with the –help option, or
without any options:
SigGdbServer Version 1.07 (C) Signum Systems Corp. 2006-2010
Usage:
SigGdbServer [options]
Options:
-help
- Display help.
-q [<file>]
- Quiet. Suppress messages or redirect to a file.
-s
- Use in pipe.
-reg <file>
- Load peripherals definition file.
Target connection options:
-connect
- Specify connection via a dialog box.
-connect <sn>
- Connect to the JTAGjet with serial number <sn>.
-cpu <cputype>
- The CPU core type: ARM7TDMI, ARM926EJ-S, C166 etc.
The <cputype>.par file will be used if it exists.
-nocpu
- Ignore any CPU connection errors and continue.
-emu <file> ...
- Set emulation parameters from <file>. CPU dependent.
-emu <n>=<v> ...
- Set emulation parameter <n> to <v>. CPU dependent.
-init <file> ...
- The initialization script file. Board dependent.
-term <file> ...
- The termination script file. Board dependent.
Flash programming options:
-flash <flash-type>[@<address>]
- Flash type and base address, cfi@0x10_0000.
-ram <RAM-size>@<address>
3
SI GNUM
S YS TE MS
8 3 0
-no-flash-write
- RAM for the flash programmer, 16k@0x0.
- Restrict flash write to context defined by commands
monitor flash before-load and
monitor flash after-load.
Examples
CONNECT TO THE IMX31 PROCESSOR (VERBOSE VERSION)
sigGdbServer -emu iMX31.par -init iMX31.ini
CONNECT TO THE IMX31 PROCESSOR
sigGdbServer -cpu iMX31 -init
This is a short version of the previous command line. The processor is
specified using the –cpu iMX31 option. The emulation parameter file
iMX31.par will be used if present. The –init option without a file name will
use the iMX31.ini file if present.
CONNECT TO THE IMX31 PROCESSOR, LOAD PERIPHERAL REGISTERS
sigGdbServer -cpu iMX31 -init –reg iMX31
Additional peripheral register definitions will be loaded from the
targets\iMX31.def file.
CONNECT TO THE IMX31 PROCESSOR WITH A NOR FLASH AT 0XA000_0000
sigGdbServer -cpu iMX31 –init \
-flash cfi@0xA000_0000 –ram 16k@0x1FFF_C000
CONNECT TO THE LUMINARY MICRO LM3SXXX PROCESSOR WITH AN INTERNAL
FLASH
sigGdbServer -emu LM3S.par \
-flash LM3S -ram 2k@0x20000000
CONNECT TO ATMEL AT91SAM3 PROCESSOR WITH AN INTERNAL FLASH
sigGdbServer -cpu ARM7TDMI -flash SAM7S
CONNECT TO ST MICROELECTRONICS STM32 PROCESSOR WITH A 512KB INTERNAL
FLASH
sigGdbServer -cpu STM32 –init \
-flash STM32@0x08000000,size=512 -ram 32k@0x20000000
CONNECT TO THE TOSHIBA TMPM3XX PROCESSOR WITH AN INTERNAL FLASH
sigGdbServer -cpu CORTEX-M3 \
-flash TMPM3,TMPM330FDFG -ram 32k@0x20000000
CONNECT TO THE NXP LPC17XX PROCESSOR WITH AN INTERNAL FLASH
sigGdbServer -cpu Cortex-M3 -flash LPC
CONNECT TO THE NXP LPC2XXX PROCESSOR WITH AN INTERNAL FLASH RUNNING
AT 12MHZ
sigGdbServer -cpu ARM7TDMI-S -flash LPC,f12000
4
GDB
SER VER
FO R
AR M,
X SC AL E
AN D
COR TE X
U S E R
M A N U A L
Emulation Parameter File
The core and CPU dependent emulation parameters are stored in the .par file used in
conjunction with the -emu option. These parameters are a subset of the parameter list displayed
by the Chameleon emu command. Refer to the .par files provided with the package for
guidelines for determining which of these parameters are essential to the operation of the server.
If the server package includes a .par file designated for your target, you can use it unmodified.
It is possible to apply multiple -emu file options and set individual emulation parameters using
the “-emu name=value” syntax.
Macro/Initialization Files
The .mac and .ini files used in conjunction with the -init and -term options allow you to utilize
the following subset of Chameleon Debugger’s macro commands.
C O M M A N D
D E S C R I P T I O N
S8/SB/S16/SW/S32/SD <addr> = <value>
Set Byte, 16 bit Word, 32 bit Double word.
S8/SB/S16/SW/S32/SD <addr> |= <value>
OR value with memory at <addr>
S8/SB/S16/SW/S32/SD <addr> &= <value>
AND value with memory at <addr>
S8/SB/S16/SW/S32/SD <addr> ^= <value>
XOR value with memory at <addr>
D8/DB/D16/DW/D32/DD <addr>
Reads Byte, 16 bit Word, 32 bit Double word. Displays
them when ECHO is on.
ECHO ON|OFF
ECHO control. OFF by default.
PAUSE <ms>
Pause the execution of commands for <ms>
milliseconds. Use, for example, to allow the PLL to
stabilize.
EMU <name> = <value>
Emulation parameters (the same as in Chameleon).
RESET [/HALT]
Reset the CPU and, optionally, stop the CPU if it did
not stop automatically after a reset.
STOP
Stop the CPU.
GO [<start-addr>] [TILL <break-addr>…]
Start the CPU at an optional start address and set
optional breakpoints.
RUNTIMEOUT <ms>
Stop the CPU started by the GO TILL command after
<ms> milliseconds. The default timeout is 5 sec. A
value of zero denotes no timeout.
MEM SPACE
Display the current memory space (when ECHO is
on).
MEM SPACE DEFAULT
Select the default (index 0) memory space.
MEM SPACE <space-index>
Select the memory space defined by an index. E.g.,
0x1F - CP15 register access; 0x1E - CP14 register
access.
TABLE 2 Chameleon macro commands that can be use with the –init and -term options.
5
SI GNUM
S YS TE MS
8 3 0
You cannot use Chameleon’s startup macro as is.
However, most Chameleon macros can be modified for the
use with the GDB server.
Note:
Board and CPU Customization
Connecting to custom-made boards and processors involves the following steps.
1.
2.
3.
Appropriately modify the emulation parameter file specified in the -emu option. If
Chameleon Debugger is connected to the CPU, some of the parameters returned by the emu
command may need to be stored in this file. Start the GDB server to verify the connection
to the target.
Adjust the startup macro and termination macro used with the -init and -term options,
respectively. The initialization macro should enable RAM on the target, set up the PLL, and
kill the watchdogs. If you are loading code to flash, enable write access to the flash.
When testing your macros, use the ECHO ON directive to receive screen feedback. Also,
utilize the DB, DW and DD macro commands to validate your settings.
Loading to Flash
The GDB server can load the code directly to flash memory. The flash type and its base address
should be provided through the –flash option. Examples of how to configure the GDB server
for several microcontrollers with internal flash memory are shown on page 4.
The current version of the server supports the following flash types:
external CFI compatible NOR flash,
internal flash in most microcontrollers based on the ARM7, ARM9, and Cortex-M3 cores.
Some target systems utilize RAM to improve programming speed. Use the –ram option to
specify the size and location of a RAM buffer on the target processor. Typically, 2KB of RAM is
ample for efficient flash programming.
For more information on the supported flash types and flash specific parameters see CommandLine Flasher for ARM, XScale and Cortex: User Manual, available at signum.com/tecdoc.htm.
There is no need to define in the debugger where the flash is located. Writing to flash memory
from within the debugger invokes the flash programmer automatically. This allows you both to
download the code to the flash using simple load and file commands and to write directly at an
arbitrary flash address using the -data-write-memory command or an assignment expression like
this:
(gdb) set *(char *)0x100 = 0x12
To restrict flash programming to code loading, call the server with the -no-flash-write option.
This option requires any loading to the flash to be preceded by the “monitor flash before-load”
and followed by the “monitor flash after-load” GDB commands.
6
GDB
SER VER
FO R
AR M,
X SC AL E
AN D
COR TE X
U S E R
M A N U A L
Configuring the Debugger
GNU GDB Debugger
Start the GDB server as described in the Configuring the Server section (page 3). The server
should report a successful connection to the target processor.
C:\Signum\SigGdbServer>SigGdbServer -cpu iMX31 -reg iMX31 -init
SigGdbServer Version 1.07 (C) Signum Systems Corp. 2006-2010
Starting ...
OK - Connected to the emulator ...
Found boards/iMX31.par file ...
OK - Emulation configured using boards/iMX31.par file ...
OK - Connected to the CPU ...
OK - CPU initialization script executed ...
Waiting (romek2, 169.254.81.233):2000
Start the GDB debugger and execute the “target remote <host>:<port>” command to establish
a connection with the GDB server, as shown in the following examples.
Connecting to the server from a remote host computer named “labstation” via port 2000:
(gdb) target remote labstation:2000
Connecting to the server on the local machine:
(gdb) target remote localhost:2000
The server will report a successful connection. If GDB can read an XML target description from
a target, the server will load the available register definition files:
Connected from: (localhost, 127.0.0.1)
Loading registers from C:\Signum\SigGdbServer\targets\iMX31.def ...OK
Loading registers from C:\Signum\SigGdbServer\cores\ARM1136J-S.def ...OK
The following is an example of the initial stage of a typical remote debug session.
$ arm-elf-gdb x.elf
GNU gdb 5.3
Copyright 2002 Free Software Foundation, Inc.
GDB is free software, covered by the GNU General
Public License, and you are
welcome to change it and/or distribute copies of it
under certain conditions.
Type "show copying" to see the conditions.
There is absolutely no warranty for GDB. Type
"show warranty" for details.
This GDB was configured as "--host=i686-pc-cygwin -target=arm-elf"...
(gdb) set remote verbose-resume off
(gdb) target remote labstation:2000
Remote debugging using labstation:2000
main () at x.c:34
34 a = 0;
(gdb) load x.elf
Loading section .text, size 0x1f10 lma 0x8000
7
SI GNUM
S YS TE MS
8 3 0
Loading section ..rodata, size 0x29 lma 0x9f10
Loading section .data, size 0x850 lma 0xa03c
Loading section .ctors, size 0x8 lma 0xa88c
Loading section ..dtors, size 0x8 lma 0xa894
Start address 0x8000, load size 10137
Transfer rate: 81096 bits in <1 sec, 151
bytes/write.
(gdb) p /x $pc
$1 = 0x8000
(gdb) break main
Breakpoint 1 at 0x8220: file x.c, line 34.
(gdb) c
Continuing.
Breakpoint 1, main () at x.c:34
34 a = 0;
...
Communicating with the GDB Server Via a Pipe
Usually, SigGdbServer is started independently of the debugger and acts as a standalone server
that communicates with the debugger over a TCP/IP network connection. When GDB
disconnects from the target, the server remains in standby, waiting for the debugger to initiate a
new connection. Multiple debuggers can use the server to access the same target, albeit not
simultaneously.
The server may also be started directly from the GDB debugger using a pipe. So started
SigGdbServer receives commands from the debugger on its standard input and sends answers
on its standard output. No network connection is used. This mode allows the debugger to run
the GDB server locally, possibly connecting each time to a different target.
To start the server using a pipe, enter in GDB
(gdb) target remote | C:/Signum/SigGdbServer/SigGdbServer.exe –s -cpu iMX31
-init -target iMX31
The –s option enables communication through the standard input and output rather than
through a TCP/IP network, while suppressing the informational messages displayed by the
server on its console when started standalone. It is possible, however, to redirect the suppressed
messages to a file using the –q <file> option.
Code Sourcery G++ IDE
1.
Create a new Debug Configuration in the Sourcery G++ IDE debugger and set it up to
work with the JTAGjet GDB Server.
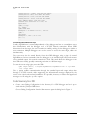
Choose Debug Configuration form the Run menu to open the dialog box in Figure 1.
8
GDB
SER VER
FO R
AR M,
X SC AL E
AN D
COR TE X
U S E R
M A N U A L
FIGURE 1 Creating a new debug configuration.
In the dialog box, select the Sourcery G++ Debug and press the New button to create a
new configuration.
2.
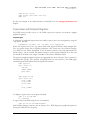
In the newly created “Debug with JTAGjet” configuration, open the Debugger tab. In the
Debugger drop-down menu, select Sourcery G++ External Embedded Server for ARM
EABI. In the Debugger Options group, open the Connection tab and specify the host name
and a port number for the GDB server (Figure 2).
FIGURE 2 Selecting External Embedded Server and connection parameters.
3.
JTAGjet GDB Server ver. 1.06 and earlier require the verbose-resume mode to be disabled.
Add the following command to your .gdbinit file:
set remote verbose-resume off
Alternately, you can use the locgdb.ini file provided with the server. It is located in the
SigGdbServer installation directory (C:\Signum\SigGdbServer\ in standard installation).
Enter the path to it in the “GDB Command File” field in the Main tab (Figure 1).
FIGURE 3 Using the GDB startup command file.
4.
Before you open the debug perspective and begin a debugging session, run the GDB Server,
as described in the Configuring the Server section (page 3). The server should report a
successful connection to the target processor.
9
SI GNUM
S YS TE MS
8 3 0
5.
To start a new debugging session, from the debug history list, select the debug configuration
you created—in our example, “Debug with JTAGjet”—or open the Debug Configuration
dialog box by selecting Debug Configuration from the Debug As option in the project popup menu. Press the Debug button.
Using GDB with the GDB Server
The GDB Monitor Command
SigGdbServer provides the following commands for sending special requests to the GDB server.
JTAGjet GDB Server commands:
flash before-load - before loading a new program
flash after-load - after loading a new program
set verify-memory 0|1 – verify when writing memory
status - display the processor status
do <macro-file>
- execute a macro file
Any macro language command (see SigGdbServer User Manual for a list of
available commands).
The above commands are available in the GDB debugger as monitor commands. For instance:
(gdb) monitor flash before-load
The
flash before-load
Flash
and
flash after-load
commands are described in section
Loading to
(page 6).
The set verify-memory command controls memory verification by the server after writing. As
write operations involving 4 or less bytes may be attempts to access memory-mapped I/O
registers, they are not verified.
The monitor command allows you to execute the macro commands listed in Table 2 (page 5). A
set of commands found in Table 2 can be stored in a file and executed with the use of the do
<macro-file> command. The examples below illustrate the command usage.
(gdb) monitor do C:\Signum\SigGdbServer\boards\iMX31.ini
(gdb) monitor reset /halt
(gdb) monitor d32 0x10000000
Some monitor commands may change the state of the processor. To let GDB notice such a
change, delay the monitor command until the next continue command, using the –delay, or –d,
option. For instance:
(gdb) monitor –d reset
(gdb) cont
Some processors may stop on reset, usually at the reset vector. The cont command will report
the processor status as halted. If the processor does not stop after reset, press CTRL-C key
combination to halt it.
Delayed monitor commands are combined and executed at once by the next
command:
(gdb) monitor –d reset
(gdb) monitor –d pause 100
10
continue
GDB
SER VER
FO R
AR M,
X SC AL E
AN D
COR TE X
U S E R
M A N U A L
(gdb) monitor –d stop
(gdb) # Reset, wait 100ms, then stop.
(gdb) cont
See also an example of the delayed monitor command use in the
chapter.
Debugging Embedded Linux
Coprocessor and Peripheral Registers
The GDB server provides access to the ARM coprocessor registers and memory mapped
peripheral registers.
Peripheral Registers
A definition of peripheral registers may be loaded as a part of the server configuration, using the
–reg option, like this:
sigGdbServer -cpu iMX31 -init –reg iMX31 –reg c:\myboard.def
Notice the repeated use of the –reg option which loads register definitions from multiple files.
The –reg option accepts files in Signum Chameleon (.def) format only. See Chameleon Debugger:
User Manual for the format description. If the file name extension or the file path matches its
default value, it can be omitted. The default extension of the register definition file is .def, and
the default file location is the “target” subfolder of the server’s installation folder.
The memory mapped peripheral registers are aggregated into the io structure. The io structure is
subdivided into groups. (The structure and group names are case-sensitive.) The GDB ptype
command returns information about the register list structure:
(gdb) ptype $io
type = struct io {
CCM CCM;
IOMUXC IOMUXC;
GPIO1 GPIO1;
…
}
(gdb) ptype $io.CCM
type = struct CCM {
int32_t CCMR;
int32_t PDR0;
int32_t PDR1;
…
int32_t LTBR0;
}
To display a register value, use the print command.
(gdb) p /x $io.CCM.CCMR
$2 = 0x74b097d
A register can be modified using the set var command.
(gdb) set var $io.CCM.CCMR=0x74b0b7c
Some Eclipse debugger versions, such as Sourcery G++ IDE, display the peripheral registers in
the register window as the IO group.
11
SI GNUM
S YS TE MS
8 3 0
Coprocessor Registers
Coprocessor registers are defined for a core rather than a processor. The register description
comes from the cores\<core>.def file which has the same format as the peripheral registers file.
In our iMX31 processor (ARM1136J-S core) example, the register description is taken from the
core\ARM1136J-S.def file. You should avoid modifying this file.
The CP<nr> structure contains the definition of the coprocessor register. For instance, all CP15
registers are members of the $CP15 structure:
(gdb) ptype $CP15
type = struct CP15 {
int32_t ID;
int32_t CACHE_TYPE;
int32_t TCM_STATUS;
int32_t TLB_TYPE;
int32_t CONTROL;
...
}
To display a register value, use the print command.
(gdb) p /x $CP15.CONTROL
$1 = 0xe5287a
A register can be modified using the set var command:
(gdb) set var $CP15.CONTROL=0x51078
Alternatively, coprocessor registers may be accessed using one of the monitor commands. (See
Table 2 on page 5 for a list of available commands.) For instance,
(gdb)
(gdb)
(gdb)
(gdb)
(gdb)
(gdb)
Use the show
example:
monitor
monitor
monitor
monitor
monitor
monitor
mem
s32
d32
s32
d32
mem
convenience
space 0x1F
0x0400 = 0x78
0x0400
0x0C00 = 0xFFFFFFFF
0x0C00
space default memory
command to display a complete list of processor registers. For
(gdb) show convenience
$CP15 = {ID = 1090949733, CACHE_TYPE = 487661906, TCM_STATUS = 0,
CONTROL = 327800, TTBR = 0, DAC = 4294967295, DFSR = 46, IFSR = 68,
...
DTLB_LOCKDOWN_VICTIM = 0, WB_DRAIN = 1090949733, FCSE_PID = 0,
CONTEXT_ID = 0}
$io = {TC0 = {TC0_CCR = 0, TC0_CMR = 0, TC0_CV = 0, TC0_RA = 0, TC0_RB = 0,
TC0_RC = 0, TC0_SR = 0, TC0_IER = 0, TC0_IDR = 0, TC0_IMR = 0,
TC1_CCR = 0, TC1_CMR = 0, TC1_CV = 0, TC1_RA = 0, TC1_RB = 0, TC1_RC = 0,
TC1_SR = 0, TC1_IER = 0, TC1_IDR = 0, TC1_IMR = 0, TC2_CCR = 0,
TC2_CMR = 0, TC2_CV = 0, TC2_RA = 0, TC2_RB = 0, TC2_RC = 0, TC2_SR = 0,
TC2_IER = 0, TC2_IDR = 0, TC2_IMR = 0, TC3_CCR = 0, TC3_CMR = 0,
...
12
GDB
SER VER
FO R
AR M,
X SC AL E
AN D
COR TE X
U S E R
M A N U A L
Debugging Embedded Linux
This is an example of loading a Linux kernel to RAM.
...
(gdb) # Reset the processor and stop it.
(gdb) # Use the delayed (-d option) monitor command
(gdb) # that will be executed by the next 'continue'.
(gdb) monitor -d reset /halt
Command delayed.
(gdb) c
Continuing.
(gdb) # Set a breakpoint at the kernel entry point.
(gdb) hbreak *0x90008000
Hardware assisted breakpoint 5 at 0x90008000
(gdb) c
Continuing.
Breakpoint 5, 0x90008000 in ?? ()
(gdb) # Load the kernel image linked to a virtual address
(gdb) # (0xC000_0000 for the ARM architecture).
(gdb) # Offset the virtual address so that the code is loaded
(gdb) # at a physical RAM address (here, 0x9000_0000).
(gdb) monitor set verify-memory 1
(gdb) load L:/Linux/ltib/rpm/BUILD/linux/vmlinux 0xD0000000
Loading section .text.head, size 0x240 lma 0x90008000
Loading section .init, size 0x1edc0 lma 0x90008240
Loading section .text, size 0x34f5b8 lma 0x90027000
Loading section .text.init, size 0xd4 lma 0x903765b8
Loading section __ksymtab, size 0x53b8 lma 0x90377000
Loading section __ksymtab_gpl, size 0x1d90 lma 0x9037c3b8
Loading section __kcrctab, size 0x29dc lma 0x9037e148
Loading section __kcrctab_gpl, size 0xec8 lma 0x90380b24
Loading section __ksymtab_strings, size 0xf86c lma 0x903819ec
Loading section __param, size 0xda8 lma 0x90391258
Loading section .data, size 0x265a8 lma 0x90392000
Loading section .init.rodata, size 0x100 lma 0x903b85a8
Start address 0xc0008000, load size 3865908
Transfer rate: 158 KB/sec, 15779 bytes/write.
Warning: the current language does not match this frame.
(gdb) # The start address is in the virtual memory.
(gdb) # Change it to the physical memory address where
(gdb) # the code has been loaded.
(gdb) p /x $pc
$9 = 0xc0008000
(gdb) set $pc=0x90008000
(gdb) p /x $pc
$10 = 0x90008000
(gdb) # Examine the kernel_entry() parameters.
(gdb) p /x $r0
$11 = 0x0
13
SI GNUM
S YS TE MS
8 3 0
(gdb)
(gdb)
$12 =
(gdb)
(gdb)
$13 =
# machid
p /x $r1
0x84d
# boot args
p /x $r2
0x90000100
(gdb) # Set a hardware breakpoint at start_kernel().
(gdb) hbreak start_kernel
Hardware assisted breakpoint 6 at 0xc00087b0: file init/main.c, line 547.
(gdb) c
Continuing.
Breakpoint 6, start_kernel () at init/main.c:547
547
in init/main.c
(gdb) p /x $pc
$14 = 0xc00087b0
(gdb) # The virtual memory is initialized. We can debug the kernel now.
...
14