1
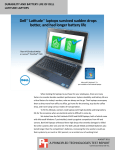
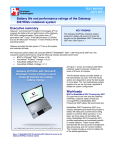
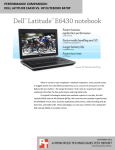
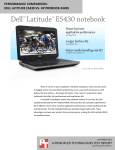
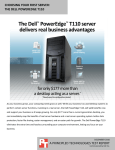
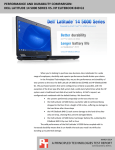
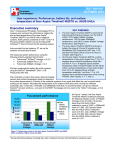
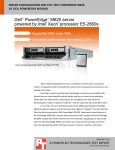
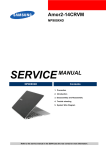
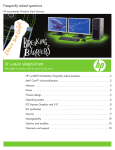
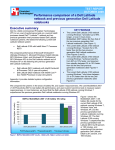
AR COMPARISON OF PERFORMANCE AND BATTERY LIFE ON DELL LATITUDE AND HP PAVILION NOTEBOOK SYSTEMS Workers can be only as productive as their tools allow them to be. On a sluggish system, the most basic office tasks can become exercises in frustration, lowering user productivity and morale. On a notebook system, battery life also factors into the user experience; simply put, longer is better. Principled Technologies ran a set of industry-standard benchmarks to measure system performance and battery life. We tested two Dell notebook systems powered by 2nd generation Intel Core processors, a mid-range Dell Latitude E6420 notebook and a high-end Dell Latitude E6520, and two HP notebooks powered by AMD processors, a mid-range HP Pavilion dm1z and a high-end HP Pavilion dv6z Select Edition. The Intel Core processor-based Dell Latitude systems delivered longer battery life—as much as 62 minutes longer—and higher benchmark scores—as much as 384.5 percent higher—than the corresponding HP Pavilion systems, making Dell a great choice for productivity and user satisfaction in the workplace. MAY 2011 A PRINCIPLED TECHNOLOGIES TEST REPORT Commissioned by Dell Inc. DELL AND INTEL DELIVER PERFORMANCE AND BATTERY LIFE Responsive performance enhances worker productivity. That’s why, when choosing notebook systems for the workplace, it makes sense to purchase systems powerful enough to execute tasks quickly and efficiently. It also makes sense to purchase notebooks that can run for a long time on a single battery charge. We used MobileMark 2007 v1.06 Productivity 2007 to test battery life and SYSmark 2007 Preview v1.06 and MAXON CINEBENCH R10 to test overall system performance. In our tests, the Intel Core processorbased Dell Latitude E6420 notebook and Dell Latitude E6520 delivered considerably better battery life and performance. (Learn more about the systems we tested in Appendix A and more about the testing we conducted in Appendix B.) Figure 1 shows the BAPCo MobileMark 2007 battery life testing results. The Dell Latitude E6420 notebook, with a score of 428 minutes, outperformed the HP Pavilion dm1z notebook’s score of 366 by 16.9 percent, or 62 minutes. The Dell Latitude E6520’s score of 293 minutes was 15.4 percent higher—providing an extra 39 minutes of life—than Minutes BAPCo MobileMark 2007 1.06 Battery Life 500 400 300 200 100 0 428 366 293 254 the HP Pavilion dv6z Select Edition’s 254-minute score. SYSmark 2007 Preview v1.06 measures system performance in four workload Dell Latitude E6420 (Intel Core i5) HP Pavilion dm1z (AMD DualCore) Mid-range notebooks Dell Latitude HP Pavilion E6520 dv6z (Intel Core i7) Select Edition (AMD Phenom II) scenarios: e-learning, office productivity, video creation, and 3D modeling. High-end notebooks Figure 1: MobileMark 2007 Preview battery life results for our test systems. Higher numbers are better. A comparison of performance and battery life on Dell Latitude and HP Pavilion notebook systems A Principled Technologies test report 2 Figure 2 shows the Score SYSmark 2007 Preview v1.06 Rating SYSmark 2007 Preview 272 300 250 200 150 100 50 0 performance results for the four 193 notebook systems. The Dell 100 57 Latitude E6420 notebook, with a score of 193, outperformed the HP Pavilion dm1z notebook by Dell Latitude E6420 HP Pavilion dm1z Mid-range notebooks Dell Latitude E6520 HP Pavilion dv6z Select Edition High-end notebooks Figure 2: SYSmark 2007 Preview productivity results for our test systems. Higher numbers are better. 238.6 percent. The Dell Latitude E6520’s score of 272 was 172.0 percent higher than the HP Pavilion dv6z Select Edition’s score of 100. MAXON CINEBENCH consists of two main components. The first test sequence targets the computer’s main processor. CINEBENCH plays a scene that makes use of various CPU-intensive features. During the first run, the benchmark uses only one CPU or CPU core to determine a reference value. On computers with multiple CPUs or cores, CINEBENCH runs a second test using all available CPU power. The benchmark produces a single-CPU score for all computers, and a multiple-CPU score for those computers with multiple cores. As Figure 3 shows, the Dell MAXON CINEBENCH R10 Single CPU 6,000 Latitude E6420 notebook, with a 5,258 5,134 single-CPU score of 5,134, Score 4,000 2,000 1,156 2,071 dm1z notebook by 344.1 percent. 0 Dell Latitude HP Pavilion Dell Latitude HP Pavilion E6420 dm1z E6520 dv6z (Intel Core i5) (AMD Dual- (Intel Core i7) Select Edition Core) (AMD Phenom II) Mid-range notebooks outperformed the HP Pavilion High-end notebooks The Dell Latitude E6520’s singleCPU score of 5,258 was 153.9 percent higher than the HP Pavilion dv6z Select Edition’s score of 2,071. Figure 3: CINEBENCH R10 Single CPU test results for our test systems. Higher numbers are better. A comparison of performance and battery life on Dell Latitude and HP Pavilion notebook systems A Principled Technologies test report 3 As Figure 4 shows, the Dell MAXON CINEBENCH R10 Multiple CPU 20,000 15,000 Score Latitude E6420 notebook, with a 18,807 multiple-CPU score of 10,669, 10,669 8,358 10,000 dm1z notebook by 384.5 percent. 2,202 5,000 outperformed the HP Pavilion The Dell Latitude E6520’s multiple- 0 Dell Latitude HP Pavilion Dell Latitude HP Pavilion E6420 dm1z E6520 dv6z (Intel Core i5) (AMD Dual- (Intel Core i7) Select Edition Core) (AMD Phenom II) Mid-range notebooks High-end notebooks CPU score of 18,807 was 125.0 percent higher than the HP Pavilion dv6z Select Edition’s score of 8,358. Figure 4: CINEBENCH R10 multiple-CPU test results for our test systems. Higher numbers are better. TEST RESULTS Figures 5 and 6 show a detailed breakdown of benchmark results for the four test systems. These results represent the median of three test runs. Appendix C presents the results from all three runs. Mid-range systems BAPCo MobileMark 2007 1.06 Battery Life (minutes) BAPCo SYSmark 2007 Preview v1.06 MAXON CINEBENCH R10 Single CPU MAXON CINEBENCH R10 Multiple CPU Dell Latitude E6420 (Intel Core i5) HP Pavilion dm1z (AMD Dual-Core) 428 366 193 5,134 10,669 57 1,156 2,202 Percentage improvement with Dell Latitude E6420 (Intel Core i5) 62 (16.9%) 136 (238.6%) 3,978 (344.1%) 8,467 (384.5%) Figure 5: Benchmark score for the mid-range systems. Higher numbers are better. High-end systems BAPCo MobileMark 2007 1.06 Battery Life (minutes) BAPCo SYSmark 2007 Preview v1.06 MAXON CINEBENCH R10 Single CPU MAXON CINEBENCH R10 Multiple CPU Dell Latitude E6520 (Intel Core i7) HP Pavilion dV6Z Select Edition (AMD Phenom II) 293 272 5,258 18,807 254 100 2,071 8,358 Percentage improvement with Dell Latitude E6520 (Intel Core i7) 39 (15.4%) 172 (172.0%) 3,187 (153.9%) 10,449 (125.0%) Figure 6: Benchmark score for the high-end systems. Higher numbers are better. A comparison of performance and battery life on Dell Latitude and HP Pavilion notebook systems A Principled Technologies test report 4 SUMMARY Workers need notebook systems that allow them to do their jobs, in a timely manner and without the frustration and delays that underperforming systems cause. In our tests, we found that Dell Latitude notebooks powered by the Intel Core processor family outperformed comparable HP Pavilion notebooks, while providing longer battery life. With up to 384.5 percent increased performance and up to 16.9 percent longer battery life over HP systems, Dell Latitude notebooks are an excellent choice to meet workers’ performance and productivity needs. A comparison of performance and battery life on Dell Latitude and HP Pavilion notebook systems A Principled Technologies test report 5 APPENDIX A – DETAILED SYSTEM CONFIGURATION INFORMATION Figure 7 presents each test system and the details of its configuration. System General Number of processor packages Number of cores per processor Number of hardware threads per core System power management policy Dell Latitude E6420 (Intel Core i5) Dell Latitude E6520 (Intel Core i7) HP Pavilion dv6z Select Edition (AMD Phenom II) HP Pavilion dm1z (AMD Dual-Core) 1 1 1 1 2 4 2 4 4 8 1 4 Dell Dell HP Recommended HP Recommended Enhanced Intel SpeedStep® Technology Enhanced Intel SpeedStep Technology AMD PowerNow!™ Technology (Cool’n’Quiet™ Technology) AMD PowerNow! Technology (Cool’n’Quiet Technology) 13-7/8” x 9-4/8” x 13/8” 15-1/8” x 10-1/4" x 13/8” 11-4/8” x 8-3/8” x 11/8” 15” x 9-7/8” x 1-3/8” 5 lbs. 5 oz. 6 lbs. 5 oz. 3 lbs. 6 oz. 5 lbs. 8 oz. Intel Core i5 2520M D2 Intel Core i7 2720QM D2 AMD Dual-Core Processor E-350 B0 AMD Phenom II N970 BL-C3 Socket 988B rPGA Socket 988B rPGA Socket FT1 BGA Socket S1 (638) 2.50 32 KB + 32 KB (per core) 512 KB (256 KB per core) 3 MB 2.20 32 KB + 32 KB (per core) 1 MB (256 KB per core) 6 MB 1.60 32 KB + 32 KB (per core) 1 MB (512 KB per core) N/A 2.20 64 KB + 64 KB (per core) 2 MB (512 KB per core) N/A Dell Dell HP HP 0K0DNP OJ4TFW 1611 1640 Motherboard chipset Intel QM67 Intel QM67 AMD A40/A50 Series FCH AMD 785GX BIOS name and version Dell A01 (03/02/2011) Dell A01 (03/02/2011) HP F.05 (03/04/2011) HP F.25 (02/15/2011) Processor powersaving option System dimensions (length x width x height) System weight CPU Vendor Name Model number Stepping Socket type and number of pins Core frequency (GHz) L1 cache L2 cache L3 cache Platform Vendor Motherboard model number A comparison of performance and battery life on Dell Latitude and HP Pavilion notebook systems A Principled Technologies test report 6 Dell Latitude E6420 (Intel Core i5) Dell Latitude E6520 (Intel Core i7) HP Pavilion dm1z (AMD Dual-Core) HP Pavilion dv6z Select Edition (AMD Phenom II) Micron® 8JSF25664HZ-1G4D1 PC3-10600S 1,333 Samsung M471B5273DHO-CH9 PC3-10600S 1,333 Hyundai HMT325S6BFR8C-H9 PC3-10600 1,333 Micron 16JSF51264HZ-1G4D1 PC3-10600S 1,333 1,333 1,333 1,066 1,333 9-9-9-24 9-9-9-24 7-7-7-20 9-9-9-24 4,096 8,192 4,096 8,192 2 x 2,048 MB 2 x 4,096 MB 2 x 2,048 MB 2 x 4,096 MB Double-sided Double-sided Double-sided Double-sided Dual Dual Dual Dual Western Digital WD2500BEKT75PVMT0 Samsung SSD PM810 Seagate ST9250410AS Samsung HM640JJ 1 1 1 1 250 16 7,200 SATA 3.0 Gb/s 128 128 N/A SATA II 3.0 Gb/s 640 16 7,200 SATA 3.0 Gb/s Controller Intel QM67 Intel QM67 Driver Intel 10.1.0.1008 (11/06/2010) Intel 10.1.0.1008 (11/06/2010) 250 16 7,200 SATA 3.0 Gb/s AMD A40/A50 Series FCH Microsoft 6.1.7600.20713 (06/21/2006) Windows 7 Professional 7600 N/A NTFS ACPI x64-based PC English Windows 7 Professional 7600 N/A NTFS ACPI x64-based PC English DirectX 11 DirectX 11 System Memory module(s) Vendor and model number Type Speed (MHz) Speed running in the system (MHz) Timing/Latency (tCLtRCD-tRP-tRASmin) Size (MB) Number of memory module(s) Chip organization (single-sided/doublesided) Channel (single/dual) Hard disk Vendor and model number Number of disks in system Size (GB) Buffer size (MB) RPM Type AMD SB800 Microsoft 6.1.7600.20713 (06/21/2006) Operating system Name Windows 7 Ultimate Build number Service Pack File system Kernel Language Microsoft DirectX® version 7600 N/A NTFS ACPI x64-based PC English Windows 7 Professional 7600 N/A NTFS ACPI x64-based PC English DirectX 11 DirectX 11 A comparison of performance and battery life on Dell Latitude and HP Pavilion notebook systems A Principled Technologies test report 7 System Graphics 1 Vendor and model number Type Chipset BIOS version Total available graphics memory (MB) Dedicated video memory (MB) System video memory (MB) Shared system memory (MB) Resolution Driver Dell Latitude E6420 (Intel Core i5) Dell Latitude E6520 (Intel Core i7) Intel HD Graphics 3000 Integrated Intel HD Graphics Family 2089.11 NVIDIA® NVS 4200M Discrete HP Pavilion dv6z Select Edition (AMD Phenom II) HP Pavilion dm1z (AMD Dual-Core) 75.19.17.1.2 AMD Radeon™ HD 6310M Integrated ATI Radeon HD 6310M BR39197.bin ATI Mobility Radeon HD 6550 Discrete ATI Mobility Radeon HD 6550 BR38060.010 1,696 4,095 1,972 4,083 64 512 384 1,024 0 0 0 0 1,632 3,583 1,588 3,059 1,366 x 768 x 32-bit 1,920 x 1,080 x 32-bit Intel 8.15.10.2266 (12/16/2010) NVIDIA 8.17.12.6696 (02/02/2011) 1,366 x 768 x 32-bit ATI Technologies Inc. 8.792.0.0 (11/09/2010) 1,366 x 768 x 32-bit ATI Technologies Inc. 8.770.2.2000 (09/29/2010) NVS 4200M Graphics 2 AMD M880G with ATI Mobility Radeon HD 4250 Integrated ATI Mobility Radeon HD 4250 VER010.094.001.045. 035812 Vendor and model number N/A N/A N/A Type N/A N/A N/A Chipset N/A N/A N/A BIOS version N/A N/A N/A N/A N/A N/A 3,131 N/A N/A N/A 320 N/A N/A N/A 0 N/A N/A N/A 2,811 N/A N/A N/A N/A N/A N/A 1,366 x 768 x 32-bit ATI Technologies Inc. 8.770.2.2000 (09/29/2010) Total available graphics memory (MB) Dedicated video memory (MB) System video memory (MB) Shared system memory (MB) Resolution Driver A comparison of performance and battery life on Dell Latitude and HP Pavilion notebook systems A Principled Technologies test report 8 System Dell Latitude E6420 (Intel Core i5) Sound card/subsystem Vendor and model Intel Display Audio number Dell Latitude E6520 (Intel Core i7) HP Pavilion dm1z (AMD Dual-Core) HP Pavilion dv6z Select Edition (AMD Phenom II) NVIDA High Definition Audio ATI High Definition Audio Device ATI Technologies Inc. 7.11.0.7710 (08/30/2010) ATI High Definition Audio Device ATI Technologies Inc. 7.11.0.7706 (05/06/2010) Realtek PCIe GBE Family Realtek 7.27.920.2010 (09/20/2010) Realtek PCIe GBE Family Realtek 7.23.623.2010 (06/23/2010) Intel 6.14.0.3074 (10/15/2010) NVIDIA 1.2.14.0 (12/13/2010) Intel 82579LM Gigabit Intel 82579LM Gigabit Intel 11.8.81.0 (10/28/2010) Intel 11.8.81.0 (10/28/2010) Intel Centrino™ Ultimate-N 6300 AGN Intel Centrino Ultimate-N 6300 AGN Ralink RT5390 Broadcom® 43224AG Intel 14.0.1.2 (12/21/2010) Intel 14.0.1.2 (12/21/2010) Ralink Technology Corp. 3.1.13.0 (11/04/2010) Broadcom 5.60.350.11 (05/07/2010) TSSTcorp TS-U333B DVD ROM TSSTcorp TS-U633J DVD+/-RW 3 2.0 eSATA, Media Card Reader Monitor LCD type Screen size Refresh rate(Hz) Battery Driver Ethernet Vendor and model number Driver Wireless Vendor and model number Driver Optical drive(s) Vendor and model number Type USB ports Number Type BD-ROM HP TS-L633R CD/DVD-RW 3 2.0 eSATA, HDMI, Media Card Reader 3 2.0 HDMI, Media Card Reader 3 2.0 eSATA, HDMI, Media Card Reader HD LED WXGA 14” 60 HD LED WXGA 15.6” 60 HD LED WXGA 11.6” 60 HD LED WXGA 15.6” 60 Type T54FJ Lithium-ion T54FJ Lithium-ion HSTNN-OB2D Lithium-ion HSTNN-DBOX Lithium-ion Size (length x width x height) 8-1/8” x 2” x 3/4" 8” x 2-3/8” x 1” 8” x 2” x 7/8” 5100 mAh / 10.8V (55Wh) 11 oz. 5100 mAh / 10.8V (55Wh) 11 oz. Other Rated capacity Weight 5400mAh/ 11.1V (60Wh) 11 oz. 8-1/8” x 2” x 3/4" 5400mAh/ 11.1V (60Wh) 11 oz. HP HSTNN-ID06 Figure 7: Configuration information for the four test systems. A comparison of performance and battery life on Dell Latitude and HP Pavilion notebook systems A Principled Technologies test report 9 APPENDIX B – ABOUT OUR TESTING The benchmark tests we conducted MobileMark 2007 v1.06 MobileMark 2007 is an industry-standard benchmark BAPCo created to measure system battery life and performance. MobileMark 2007 measures system battery life in minutes. MobileMark 2007 records system battery life at the start of the Productivity 2007 benchmark, and repeats the benchmark workload until the system battery life is depleted, or until the notebook system powers down due to low battery life. At the 7 percent battery life setting, MobileMark 2007 records a timestamp once per minute. At the end of the benchmark, it compares the beginning timestamp to the final (last recorded) timestamp. MobileMark 2007 derives its system battery life rating as the number of minutes between the start and end timestamps. MobileMark 2007 Productivity 2007 consists of the following applications and corresponding tasks: Microsoft Project 2003 (project management), Microsoft Excel 2003 (calculation sheets), Microsoft Outlook 2003 (emails, calendars, scheduler), Microsoft PowerPoint 2003 (slide presentations), Microsoft Word 2003 (formatted text documents), WinZip Computing and WinZip Pro 10.0 (compressed archives), Adobe Photoshop CS2 (manipulated and compressed images), Adobe Illustrator CS2 (manipulated images), and Adobe Flash 8 (vector graphics, animation). We followed the run rules that MobileMark 2007 specifies here: http://www.bapco.com/support/mobilemark2007/Manual/rules.html. SYSmark 2007 Preview v1.06 SYSmark 2007 Preview is a performance metric BAPCo created to measure system performance. SYSmark 2007 Preview determines its overall rating from the mean result from four workload scenarios: elearning, office productivity, video creation, and 3D modeling. SYSmark 2007 Preview records the time the system takes to complete each individual operation in each scenario. SYSmark 2007 Preview consists of the following applications and corresponding tasks: Adobe® After® Effects 7 (e-learning), Adobe Illustrator® CS2 (video creation), Adobe Photoshop® CS2 (video creation), AutoDesk® 3ds Max® 8 (3D modeling), Macromedia® Flash 8 (e-learning), Microsoft® Excel® 2003 (office productivity), Microsoft Outlook® 2003 (office productivity), Microsoft PowerPoint® 2003 (office productivity), Microsoft Word 2003 (office productivity), Microsoft Project 2003 (office productivity), Microsoft Windows A comparison of performance and battery life on Dell Latitude and HP Pavilion notebook systems A Principled Technologies test report 10 Media™ Encoder 9 series (video creation), Sony® Vegas 7 (video creation), SketchUp 5 (3D modeling), and WinZip® 10.0 (office productivity). To learn more, visit http://www.bapco.com/support/sysmark2007preview/Help/Help.html. MAXON CINEBENCH R10 CINEBENCH is a free, real-world cross platform test suite designed to evaluate and compare the CPU and graphics performance across various systems and platforms. Based on MAXON CINEMA 4D software, which creates 3D content, the benchmark consists of two main components: the graphics-card performance test, and the CPU performance test. CINEBENCH uses the processing power of a system to render 3D scenes that stress all available processor cores, and reports performance in points (pts). Higher scores are better, as they indicate a faster processor. To learn more, visit http://www.maxon.net. Detailed test methodology Measuring performance with BAPCo SYSmark 2007 Preview v1.06 Setting up the test 1. Reset the system to the base test image. 2. Disable the User Account Control. a. Click StartControl Panel. b. At the User Accounts and Family Safety settings screen, click Add or remove user account. c. At the User Account Control screen, click Continue. d. Click Go to the main User Accounts page. e. At the Make changes to your user account screen, click Turn User Account Control on or off. f. At the User Account Control screen, click Continue. g. Uncheck Use User Account Control to help protect your computer, and click OK. h. At the You must restart your computer to apply these changes screen, click Restart Now. 3. Purchase and install SYSmark 2007 Preview v1.05 from https://www.bapcostore.com/store/product.php?productid=16165&cat=251&page=1. 4. At the Welcome to InstallShield Wizard screen, click Next. 5. At the License Agreement screen, select I accept the terms in the License Agreement, and click Next. 6. At the Choose Destination Location screen, click Next. 7. At the Ready to Install the Program screen, click Install. 8. When the installation is complete, click Finish. Running the test 1. Launch SYSmark 2007 Preview by double-clicking the desktop icon. 2. Click Run. 3. Select Official Run, choose 3 Iterations, check the box beside run conditioning run, and enter a name for that run. A comparison of performance and battery life on Dell Latitude and HP Pavilion notebook systems A Principled Technologies test report 11 4. When the benchmark completes and the main SYSmark 2007 Preview menu appears, click Save FDR to create a report. Record the results for each iteration. Measuring battery life with BAPCo MobileMark 2007 v.1.06 Preparing to measure battery life with MobileMark 2007 v.1.06 We conditioned the battery prior to testing. To do so, we performed two complete drains of the battery, starting from a battery at 100 percent charge. To expedite the draining process, we ran the MobileMark 2007 Productivity 2007 test until the battery completely discharged. We recorded the room temperature at the beginning of each official run. Antivirus software conflicts MobileMark 2007 is not compatible with any virus-scanning software, so we uninstalled any such software that was present on the notebook PCs before we installed the benchmark. Pre-installed software conflicts MobileMark 2007 installs the following applications, which its test scripts employ: Adobe Photoshop 6.0.1 InterVideo WinDVD 6.0 Macromedia Flash 5.0 Microsoft Excel 2002 Microsoft Outlook 2002 Microsoft PowerPoint 2002 Microsoft Word 2002 Netscape Communicator 6.01 Network Associates McAfee VirusScan 5.13 WinZip Computing WinZip 8.0 If any of these applications are already on the system under test, they will cause problems with the benchmark due to software conflicts. To avoid any such issues, before we installed the benchmark, we uninstalled all conflicting pre-installed software applications, including different versions of any of the programs MobileMark 2007 uses. Installing MobileMark 2007 v.1.06 1. Reset the notebook to the base image using Symantec’s Ghost product. 2. Turn off the wireless network adapter by using the external toggle switch. 3. Insert the MobileMark 2007 Install DVD in the notebook PC’s DVD drive. 4. At the Welcome screen, click Next. 5. Accept the license agreement, and click Next. 6. At the Ready to Install the Program screen, click Install. 7. Run the BAPCo Auto-configuration tool, v.1.3.2, to set the power options. A comparison of performance and battery life on Dell Latitude and HP Pavilion notebook systems A Principled Technologies test report 12 a. b. c. d. Insert the Auto-configuration tool in the notebook PC’s DVD drive. Double-click BAPCo_AutoConfig.exe. Type M to choose MobileMark 2007. Type 3 to choose the changes that produce the best possible scores, as follows: i. Set Critical battery alarm to 0%. ii. Set Low battery alarm to 0%. iii. Disable screen saver. iv. Stop and disable Windows Update. v. Disable desktop cleanup wizard. vi. Disable Windows Security Center warnings. vii. Disable Windows Firewall. viii. Disable incoming Remote Desktop connections. ix. Disable Windows Error Reporting to Microsoft. x. Disable Windows Defender. Displaying brightness and power settings Because the brightness of a notebook’s display affects its battery life, BAPCo required that, before we tested with MobileMark 2007, we made sure the brightness of the notebook’s monitor was greater than or equal to 60 nits on a completely white screen while the notebook was unplugged and running on battery power. The measurement follows the standards from the Video Electronics Standards Association (www.vesa.org/Standards/summary/2001_6a.htm). We complied with this standard for all the tests we ran by setting each notebook PC’s brightness as close to 60 nits as we could without going below that brightness level. We used the following procedure, which assumes we began with the notebook plugged into the power supply, to meet this requirement before we started each test: 1. To create a completely blank white screen, open Microsoft Paint by clicking StartAll ProgramsAccessoriesPaint. 2. Open the Attributes by pressing Ctrl+E. 3. Enter dimensions that are larger than the current screen resolution. For example, if the screen resolution is 1,280 x 800, enter 1,600 for Width and 1,200 for Height. 4. Click OK. 5. Press Ctrl+F to view the bitmap image and render the screen completely white. 6. Wait 45 minutes to allow the screen to warm. 7. Unplug the notebook from the power supply, and measure the display’s brightness using a luminance meter in the center of the screen. (We use the Gossen Mavolux5032C.) 8. If the reading is below or significantly greater than 60 nits, use the notebook’s keyboard screenbrightness-adjustment keys to bring the display as close to 60 nits as possible, then retest. 9. Allow the notebook to run on battery power for 10 minutes, re-measure the display, and adjust the brightness up or down as necessary. A comparison of performance and battery life on Dell Latitude and HP Pavilion notebook systems A Principled Technologies test report 13 10. Verify that the notebook saved the brightness setting by plugging in the system, unplugging it, and taking another reading. If the notebook did not save this setting, use its power-management application(s) to set the brightness appropriately, and save that setting. Conditioning the battery 1. Plug the AC power adapter into the notebook PC, and completely charge the battery. 2. Install MobileMark 2007 v1.05, following the steps we outlined in the Installing MobileMark 2007 section. 3. Double-click the MobileMark 2007 icon on the desktop. 4. Highlight the Productivity 2007 item in the left panel. 5. Enter a name for this test in the Project Name field at the top-right panel, and click Next Step. 6. If MobileMark lists no problems or warnings, click Next Step. If it does list any problems or warnings, close MobileMark 2007, and correct the problem(s) before proceeding. 7. Unplug the AC power adapter. The Productivity 2007 test begins immediately. 8. The test is complete when the notebook PC has fully depleted its battery and is no longer operational when running on battery power. 9. Repeat steps 3 through 8 for the second conditioning run and for all official runs. 10. Plug the AC power adapter into the notebook PC, and completely charge the battery. Measuring battery life with MobileMark 2007 v.1.06 We performed the following steps to run the MobileMark Productivity 2007 benchmark: 1. 2. 3. 4. Double-click the MobileMark 2007 icon on the desktop. Select the Productivity 2007 test by highlighting it in the left panel. Enter a name for this test in the Project Name field in the top right panel, and click Next Step. If MobileMark lists no problems or warnings, click Next. If it does list any problems or warnings, close MobileMark 2007, and correct the problem(s) before proceeding. 5. Unplug the AC power adapter. The test begins immediately. 6. The Productivity 2007 test is complete when the notebook PC has fully depleted its battery and is no longer operational when running on battery power. We executed the Productivity 2007 test three times on each system configuration and used the average result of each set of three as the representative score for that test. 5. Configure the notebook with the standard battery and the BAPCo recommendations for running MobileMark 2007. 6. Execute the Productivity 2007 test three times in this configuration. 7. Configure the notebook with the maximum-sized battery available at the time of purchase and the BAPCo recommendations for running MobileMark 2007. 8. Execute the Productivity 2007 test three times in this configuration. Getting the MobileMark 2007 results After each MobileMark test completed, we plugged the AC power adapter into the notebook PC and turned on the system. MobileMark 2007 started automatically after the system booted, analyzed the test scores, and opened the Test Results Viewer with the results from the last test. A comparison of performance and battery life on Dell Latitude and HP Pavilion notebook systems A Principled Technologies test report 14 To submit these results to BAPCo, we saved the test results directory. To do so, we performed the following steps: Browse to the C:\ Program Files\BAPCo\MobileMark 2007\results directory. a. Select My Computer. b. Select Local Disk (C:). c. Select the Program Files directory. d. Select the BAPCo directory. e. Select the MobileMark2007 directory. f. Select the results directory. (Note: The name of the directory for the Productivity 2007 results is the name you gave the test in Step 6 of the MobileMark Productivity 2007 process.) Measuring performance with MAXON CINEBENCH R10 Setting up the test 1. Reset the system to the base test image. 2. Download CINEBENCHR10.zip from http://www.maxon.net/en/downloads/downloads/cinebench.html. 3. Right-click the CINEBENCH ZIP file, and choose Extract All. 4. Click Extract. Running the test 1. Launch CINEBENCH R10 by double-clicking the CINEBENCH R10.exe file in the CINEBENCH R10 folder. 2. Enter the MHz frequency of the processor in the MHz (real freq.) field. 3. Enter a name in the Tester field. 4. Click the Start all tests button. 5. When the picture finishes rendering in multi-processor mode, save the results. a. Click the To Clipboard button. b. Launch notepad and paste the results into an empty notepad document. c. Save the results in the format system_run_N.txt. 6. Close CINEBENCH R10. 7. Reboot the system. 8. Repeat steps 1 through 7 two times, and report the median. 1. A comparison of performance and battery life on Dell Latitude and HP Pavilion notebook systems A Principled Technologies test report 15 APPENDIX C – DETAILED RESULTS Figures 8 and 9 present the detailed test results for the systems. Dell Latitude E6420 HP Pavilion dm1z (Intel Core i5) (AMD Dual-Core) Mid-range systems Run 1 Run 2 Run 3 Run 1 Run 2 Run 3 BAPCo MobileMark 2007 1.06 Battery Life Rating (higher is better) MobileMark 2007 - Productivity - Battery Life 427 428 428 365 369 366 score (minutes) MobileMark 2007 - Productivity 301 295 295 83 83 83 Performance Qualification score BAPCo SYSmark 2007 Preview v1.06 SYSmark 2007 Preview v1.06 - E-Learning 168 169 170 52 52 52 SYSmark 2007 Preview v1.06 - VideoCreation 202 202 204 73 74 74 SYSmark 2007 Preview v1.06 - Productivity 180 182 179 50 51 50 SYSmark 2007 Preview v1.06 - 3D 227 223 227 56 56 56 MAXON CINEBENCH R10 CB Single - Median 5,074 5,134 5,143 1,158 1,156 1,148 CB Dual - Median 10,619 10,686 10,669 2,202 2,209 2,180 Open GL - Median 5,858 5,842 5,852 1,951 1,942 1,927 Multiprocessor Speedup - Median 2.09 2.08 2.07 1.9 1.91 1.9 Figure 8: Benchmark results for the two mid-range notebook systems. Higher numbers are better. Dell Latitude E6520 HP Pavilion dv6z Select Edition (Intel Core i7) (AMD Phenom II) Run 1 Run 2 Run 3 Run 1 Run 2 Run 3 BAPCo MobileMark 2007 1.06 Battery Life Rating (higher is better) MobileMark 2007 - Productivity - Battery Life 296 293 293 244 254 255 score (minutes) MobileMark 2007 - Productivity 358 361 366 133 96 124 Performance Qualification score BAPCo SYSmark 2007 Preview v1.06 SYSmark 2007 Preview v1.06 - E-Learning 219 218 219 70 70 70 SYSmark 2007 Preview v1.06 - VideoCreation 375 373 373 174 168 171 SYSmark 2007 Preview v1.06 - Productivity 237 238 238 77 78 77 SYSmark 2007 Preview v1.06 - 3D 283 283 283 107 110 112 MAXON CINEBENCH R10 CB Single 5,253 5,258 5,281 2,027 2,152 2,071 CB Dual 18,671 18,904 18,807 8,444 8,358 8,009 Open GL 5,342 5,367 5,407 3,866 3,853 3,723 Multiprocessor Speedup 3.55 3.60 3.56 4.16 3.88 3.87 tcvis-01 1.87 1.88 1.83 7.85 8.31 8.37 Figure 9: Benchmark results for the two high-end notebook systems. Higher numbers are better. High-end systems A comparison of performance and battery life on Dell Latitude and HP Pavilion notebook systems A Principled Technologies test report 16 ABOUT PRINCIPLED TECHNOLOGIES We provide industry-leading technology assessment and fact-based marketing services. We bring to every assignment extensive experience with and expertise in all aspects of technology testing and analysis, from researching new technologies, to developing new methodologies, to testing with existing and new tools. Principled Technologies, Inc. 1007 Slater Road, Suite 300 Durham, NC, 27703 www.principledtechnologies.com When the assessment is complete, we know how to present the results to a broad range of target audiences. We provide our clients with the materials they need, from market-focused data to use in their own collateral to custom sales aids, such as test reports, performance assessments, and white papers. Every document reflects the results of our trusted independent analysis. We provide customized services that focus on our clients’ individual requirements. Whether the technology involves hardware, software, Web sites, or services, we offer the experience, expertise, and tools to help our clients assess how it will fare against its competition, its performance, its market readiness, and its quality and reliability. Our founders, Mark L. Van Name and Bill Catchings, have worked together in technology assessment for over 20 years. As journalists, they published over a thousand articles on a wide array of technology subjects. They created and led the Ziff-Davis Benchmark Operation, which developed such industry-standard benchmarks as Ziff Davis Media’s Winstone and WebBench. They founded and led eTesting Labs, and after the acquisition of that company by Lionbridge Technologies were the head and CTO of VeriTest. Principled Technologies is a registered trademark of Principled Technologies, Inc. All other product names are the trademarks of their respective owners. Disclaimer of Warranties; Limitation of Liability: PRINCIPLED TECHNOLOGIES, INC. HAS MADE REASONABLE EFFORTS TO ENSURE THE ACCURACY AND VALIDITY OF ITS TESTING, HOWEVER, PRINCIPLED TECHNOLOGIES, INC. SPECIFICALLY DISCLAIMS ANY WARRANTY, EXPRESSED OR IMPLIED, RELATING TO THE TEST RESULTS AND ANALYSIS, THEIR ACCURACY, COMPLETENESS OR QUALITY, INCLUDING ANY IMPLIED WARRANTY OF FITNESS FOR ANY PARTICULAR PURPOSE. ALL PERSONS OR ENTITIES RELYING ON THE RESULTS OF ANY TESTING DO SO AT THEIR OWN RISK, AND AGREE THAT PRINCIPLED TECHNOLOGIES, INC., ITS EMPLOYEES AND ITS SUBCONTRACTORS SHALL HAVE NO LIABILITY WHATSOEVER FROM ANY CLAIM OF LOSS OR DAMAGE ON ACCOUNT OF ANY ALLEGED ERROR OR DEFECT IN ANY TESTING PROCEDURE OR RESULT. IN NO EVENT SHALL PRINCIPLED TECHNOLOGIES, INC. BE LIABLE FOR INDIRECT, SPECIAL, INCIDENTAL, OR CONSEQUENTIAL DAMAGES IN CONNECTION WITH ITS TESTING, EVEN IF ADVISED OF THE POSSIBILITY OF SUCH DAMAGES. IN NO EVENT SHALL PRINCIPLED TECHNOLOGIES, INC.’S LIABILITY, INCLUDING FOR DIRECT DAMAGES, EXCEED THE AMOUNTS PAID IN CONNECTION WITH PRINCIPLED TECHNOLOGIES, INC.’S TESTING. CUSTOMER’S SOLE AND EXCLUSIVE REMEDIES ARE AS SET FORTH HEREIN. A comparison of performance and battery life on Dell Latitude and HP Pavilion notebook systems A Principled Technologies test report 17