1
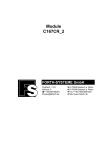
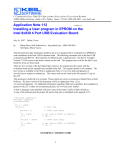
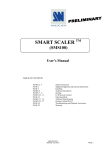
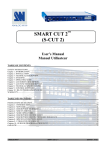
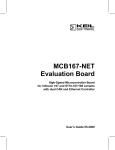
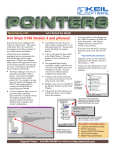
C COMPILERS • REAL-TIME OS • SIMULATORS • EDUCATION • EVALUATION BOARDS
Programming the Siemens C167CR CAN Interface: A Real Life Case:
Constructing the Hardware
Application Note 115b - Hooking up the CAN hardware and running the software:
Version 1.0
By Robert Boys, MIS
Keil Software, Inc.
1-800-348-8051 or [email protected]
This application note will instruct you on how to connect two Keil single board computers together to
construct a working two node CAN network. This article has instructions on loading and using the Keil
monitor and debugger to operate and evaluate the entire system. This note will also work on the Phytec
KitCON 167 board that is sold by Siemens.
Introduction
Gary Culp and Robert Boys wrote an article on the CAN bus in the Siemens Contact magazine in
February 1998. The basis of the article was making a two node CAN network using two Keil MCB167
evaluation boards. This article very briefly described the CAN bus, the Keil CAN libraries and RTOS,
the Keil C167CR microcontroller and the MCB167. It then described some unusual and interesting
aspects of programming the C167CR on-chip CAN controller. These were discovered during the
research phase of this article and deemed to be of enough interest to form the main content of the article.
The original article has become Keil Application Note # 115 and is available on the Keil Website:
www.keil.com/~market/115.pdf. The note you are now reading continues the original article and
completes the experiment. It describes the actual steps required to connect the two boards together and
getting the software running to display the expected results.
The Keil Tool Chain - an overview
The Keil Tool Chain fully supports the entire Siemens C166 and the SGS Thomson ST10
microcontroller lines. The Keil Tool Chain includes a C Compiler, Macro Assembler, Linker/Locator,
µVision IDE, and the dScope Simulator and Target Monitor.
The Keil tool chain consists of the following executables:
C Compiler
Assembler
Linker
Converter
dScope
µVision
c166.exe
a166.exe
L166.exe
oh166.exe
dsw166.exe (a Windows application)
uvw166e.exe (a Windows application)
These files are located in the c:\c166eval\bin directory for the evaluation version when installed on your
hard drive. The full version would locate them in the c:\c166\bin directory. They are DOS programs
except for µVision and dScope. Access to these programs from Windows is accomplished with
µVision. The entire tool set can be run from µVision or directly from DOS with your batch files. The
Evaluation version is limited in code size to 4Kbytes. Other than these restrictions, all features operate
normally.
1
µVision IDE
µVision is a Windows based front end for the C Compiler and Assembler. It was developed in the USA
as was the printed manual set. Compiler, Assembler and Linker options are set with simple mouse
clicks. µVision runs on Windows 3.1, 95 and NT. This Integrated Development Environment (IDE) has
been expressly designed with the user in mind. A full function editor is included. All IDE functions are
intuitive via pull down menus with prompted selections. An extensive Help utility is included. External
executables can be run from within µVision. This includes emulator software.
C166 C Compiler for the entire Siemens 166/167 family and SGS Thomson ST10
The C166 ANSI compiler and A166 assembler are designed specifically for the Siemens 161, 163,
C164CI, 165,166, 167, 167CR, and future derivatives. The C166 easily integrates with the Keil RTOS.
The C166 interfaces and passes debug information to the Keil dScope Simulator and all in-circuit
emulators. The Keil C166 provides the fastest and smallest code using industry benchmarks. The ST10
family, which is a second source of the C166 - is supported.
dScope Simulator
dScope is a software simulator. Your code can be debugged either in software on your PC or in your
target hardware. When operated in conjunction with the Keil monitor installed in your target hardware,
dScope becomes tScope. You have the ability to run/halt, set breakpoints, examine/change memory,
view the stack, view/set peripheral information and apply virtual external signals. dScope has a
Performance Analysis feature to ensure your code runs efficiently. dScope has a built-in
disassembler/assembler allowing you to make changes in your code without recompiling.
The evaluation version of the Keil 8051 tool set is restricted to a 2K code size and the code must be
located at 0x4000. The C166 version can produce up to 4K of code and does not have a starting
address restriction. Useful object code is produced. Other than these restrictions, the tool set works
exactly as the full version does. This allows you to fully evaluate the features and power of Keil
products on the Rigel board. The full version has no restrictions and is fully ANSI compliant.
FR166 Full-Function RTOS: Siemens 166/167 family and SGS Thomson ST10
The FR166 is a multitasking real-time operating system for the Siemens 166 family. You can manage
multiple tasks on a single CPU making your programs much easier to develop. The RTX166 Full
includes CAN libraries. The RTX166 Tiny is a subset of the RTX166 Full and is included with all
C166 C Compiler Kits. There are no royalty payments generated by using a Keil RTOS.
CAN Library - Controller Area Network
The RTX51 and RTX166 Full RTOS supports CAN controllers with the included libraries. The CAN
libraries are sold with the RTOS. The CAN interface is becoming popular for automotive and industrial
markets. Both 11 and 29 bit identifiers are supported. Keil C166 and 8051 C compilers interface with
the RTOS and CAN libraries. Keil supports all CAN microcontrollers based on the Siemens C505C,
C515C, C164-CI, and C167CR. Future CAN products based on these 8051 or C16x Families are
easily supported due to the flexible Keil Compiler design. The Siemens 81C90 CAN peripheral chip is
supported with a new Keil evaluation board. Contact Keil Software for details.
STARTING THE TUTORIAL
The Software
What you need to get started
1) Two Keil MCB167 evaluation boards with the CAN physical-layer interface added. You may be
able to substitute Phytec or Rigel boards. You need only install the proper monitor and boot files.
2) Two PCs with the Keil C166 tools installed and one serial port available for communication with
MCB167 boards. The 4K evaluation version of the Keil Tool Set can be used.
3) Note: you can use only one PC by switching between this single PC and the two boards either
manually or with a RS-232 switch box
4) Appropriate cable for connecting the CAN interfaces of the two MCB167 boards.
2
The CAN programs
Keil provides C source code for the A and the B boards. A runs a counter that determines how long it
has been activated in seconds. It also scans the CAN bus looking for a message from B. A sends a
message requesting this timer value. If B receives this message, it sends the timer message to A. A
then prints this value to the serial port window on the Keil debugger dScope.
The C source code, project files, compiled object files and startup files are available as file cansoft.zip
on the Keil website or was embedded in the file with this document. This file contains all the files
necessary to reproduce the two programs described in this application note and are listed below.
File
Description
a_canx1.c
main() module for program A
b_canx1.c
main() module for program B
timer.c
timer functions
can_ifc.c
CAN interface functions
timer.h
header file for timer
can_ifc.h
header file for CAN interface functions
canregs.h
header file describing CAN hardware
can_msgs.h
header file for CAN message id.'s
a_canx1.prj
project file for program a_canx1
b_canx1.prj
project file for program b_canx1
ax1_dsco.ini
dScope initialization file for program a_canx1
bx1_dsco.ini
dScope initialization file for program b_canx1
boot & monitor
dScope monitor kernel for the Keil MCB167 board
compiled.zip
compiled object files and listing files
Install these files in a directory of your choice. This tutorial used c:\can. Various other files will be
produced as a result of the compiling and linking process of the Keil Tool Set.
The Keil Tool Set - µVision, C compiler, linker, locator and dScope
This project uses the Keil µVision IDE to interface to the compiler and linker/locator and dScope to
interface to the two the Keil single board computers. You can use either one or two PCs to be the host
computer. The Keil evaluation software must be installed on each of these computers if you use two.
The evaluation software is capable of compiling and demonstrating this project.
Installing the Keil Software
Install the Keil Software development tools by completing the following steps:
1) Get the 2 disks from the Keil or Siemens CD-ROM, or the Web site,
www.keil.com/demo/ek166.htm or prepare to install them from the Keil CD-ROM in the directory
/ek166/.
2) To install the Keil EK166 evaluation software from the Keil CD-ROM, run the program
/ek166/setup.exe from within Windows. Use the default destination drive of c:\c166eval. If you
have downloaded two floppies from the web - install them in the usual manner.
3) If you ever need to reload a totally fresh copy of the Keil C Compiler - you must delete dsw166.ini
and uvw166e.ini from your c:\windows\ directory. These files are created and updated by µVision
and dScope to retain user settings. You may want to save the existing files under new names to
save your settings.
After you install the Keil development tools to Windows 3.11, a Keil program group or icons appears
on your desktop. (the Windows 95 version is shown in Figure 1). Recall dScope is the Keil Simulator
and µVision is the Keil Windows based user interface (or IDE = Integrated Development Environment).
3
FIGURE 1
For Windows 95 you must install the two icons manually as follows. If the two icons are visible in a
small window drag them onto the desktop. If they are not visible, follow these instructions:
1) right mouse click while in the Desktop and select New/Shortcut
2) The executable file you want to enter as the Command Line is c:\c166eval\bin\uvw166e.exe
3) The suggested name is µVision.
4) Repeat this process for c:\c166eval\bin\dsw166.exe and name it dScope.
The full version of the software installs these icons to the Windows 95 desktop.
The Hardware
The Keil MCB167 does not come with the physical layer circuitry to connect directly to the CAN bus.
This layer is easily provided with a Philips 82C250 driver chip. A schematic is provided below as
Figure 2. Wire wrap this circuit on the prototyping area of the MCB167. The location of P4.6 and P4.5
on the MCB167 is illustrated in Figure 6.
+5V
P4.6
P4.5
P4
C1
10µF
16V
22k
J1
1
8
2
7
3
Slope Control
A
U1
PCA82C250
Philips
6
C
B
SW1-7
R1 120
C167CR
5
4
CAN
Bus
7
2
6
SW1-8
FIGURE 2
This demonstration will work without R1 or the ground wire at SW1-8 connected but it is desired. The
22K slope control resistor can be directly connected from Pin 8 of U1 to ground. You will not need to
adjust the jumper positions on Pin 8 for this demonstration.
The on-chip CAN interface of the C167CR connects to the outside world through two pins on Port 4.
Port 4.5 is the CAN receive line and Port 4.6 is the CAN transmit line. These pins are shared by
address lines A21 and A22. These two modes are mutually exclusive. P4.5 and P4.6 can be CAN ports
or address ports. Not both at the same time. Addressing mode restrictions apply when using the CAN
interface.
Use the MCB167 default jumper settings and the standard 256K of RAM. J2 in particular must be
installed. This puts the C167 into the bootstrap mode upon a CPU reset. This is the method that dScope
uses to load the monitor kernel into the RAM of the MCB167.
When mon166.dll is selected within dScope, the file boot is first loaded using the C167 bootstrap
loader. Boot then loads monitor into the RMB 167-CRI’s RAM. These two programs must be in the
c:\c167eval\bin directory. If you load the properly configured monitor kernel into on-board FLASH or
EPROM memory, you need to deselect J2. For information concerning the Keil monitor see Readme.txt
in c:\c166eval\mon166.
4
Connecting it all together
1) Connect the power supply to the two boards
2) Complete the CAN physical layer connection between the two boards as appropriate for your setup.
Pins 7 and 6 of the 82C250 must be correctly connected together along with the ground wire. Use a
reasonable amount of wire. A few feet will do for this demonstration.
3) Connect the serial port of your PC to the COM connector of one of the MCB167 boards. If you are
using two PCs, connect the other serial cable to the second MCB167 and to the second PC.
Starting Everything Up
Starting µVision for the A board - the Keil IDE
Double-click on the µVision icon to start the user interface. The compiler, assembler, linker and dScope
will be called from within µVision in this tutorial. After you invoke µVision, the window shown in
Figure 3 appears. From this window, you can create projects, edit files, configure the tool, assemble,
link, and invoke the debugger. Everything is pre-configured for you for this project.
1) Open the Project menu and choose Open Project.
2) Select c:\can\a_canx1.prj and press OK.
3) Click on the Build All icon (it has three arrows pointing downwards) or open Project and select
Make: Build Project.
4) If the program specified (a_canx1.c) contains any errors, they will be shown on the screen.
5) If there are no errors, the code is assembled and linked and the executable code is ready to be
downloaded to the board. The code to be downloaded to the board will be the name of the project
with no filename extension. In this case this will be a_canx1. Click on OK in the Project Status
dialog box and continue to the next section. Note a HEX file could have been created. Other files
are created to help the debugging process.
6) If a list of errors appears, use the editor to correct the error(s) in the source code and save the file.
Then, repeat this section: beginning at step 1. There should be no errors. If there are, something
serious has gone wrong. Reload all the software.
FIGURE 3
5
Downloading the A Software to the MCB167
You are now ready to start the dScope debugger to download and execute code to the Keil A board.
1) Press the reset button. It is labeled RESET and is beside the 5 volt regulator chip.
2) Click on the debugger icon on the µVision toolbar. This icon is a “d” seen through a magnifying
glass and is yellow and blue in colour. This is the same icon installed for dScope in your desktop
area. If you leave the mouse pointer on an icon for a few seconds, the word “debug” will appear.
A window similar to that shown in Figure 4 is displayed. You may want to move and resize the
windows. The window marked “Module: <none>” is the Debug window. The Command window
can be used to enter commands.
3) You may need to open, resize and /or move some windows to make your screen look something like
Figure 4. The Debug, Command, and Serial I/O windows will be used. You may want to open the
Commands menu in the Debug Window and select Show Toolbar.
4) Note that the file ax1_dsco.ini configured and loaded dScope. This ASCII file can easily be edited.
Its location is specified in µVision in the Options menu under dScope Debugger. The object file
that was loaded into the MCB167 memory is a_canx1. This is the project name with no file
extension. The original C source code needs to be available for source-level debugging.
FIGURE 4
Running the A Software
1) Press Go
2) “Program A Start” with 4 characters beneath it will be displayed in the Serial I/O window. CAN
node A is successfully started. It is now waiting for a message from B (which is not started yet).
3) If you get errors - a section called Communication Setup - Help ! follows.
Starting µVision for the B board - the Keil IDE
Now you will start the B board. This board sends out a CAN message requesting a time stamp from A.
This time stamp will then be displayed in the Serial I/O window. The instructions are the same as for
the A board. Only the filenames change.
6
If using only one PC, move the serial COM cable to the second MCB167. The A board will continue to
operate without intervention of dScope. Start at instruction 1) below.
If you are using two PCs; double-click on the µVision icon on the second PC to start the user interface.
After you invoke µVision, the window shown in Figure 2 appears as before with A. Everything is preconfigured for you for this project.
1) Open the Project menu and choose Open Project.
2) Select c:\can\b_canx1.prj and press OK.
3) Click on the Build All icon (it has three arrows pointing downwards) or open Project and select
Make: Build Project.
4) If the program specified (b_canx1.c) contains any errors, they will be shown on the screen.
5) If there are no errors, the code is assembled and linked and the executable code is ready to be
downloaded to the board. The code to be downloaded to the board will be the name of the project
with no filename extension. In this case this will be b_canx1. Click on OK in the Project Status
dialog box and continue to the next section. Note a HEX file could have been created. Other files
are created to help the debugging process.
6) If a list of errors appears, use the editor to correct the error(s) in the source code and save the file.
Then, repeat this section: beginning at step 1. There should be no errors. If there are, something
serious has gone wrong. Reload everything again. The software has been thoroughly tested.
Downloading the B Software to the MCB167
You are now ready to start the dScope debugger to download and execute code to the Keil B board.
1) Press the reset button.
2) Click on the debugger icon on the µVision toolbar.
3) You may need to open, resize and /or move some windows to make your screen look something like
Figure 4. The Debug, Command, and Serial I/O windows will be used. You may want to open the
Commands menu in the Debug Window and select Show Toolbar.
4) Note that the file bx1_dsco.ini configured and loaded dScope. This ASCII file can easily be edited.
Its location is specified in µVision in the Options menu under dScope Debugger.
Running the A Software
1) Press Go
2) “Program B Start” will be displayed in the Serial I/O window on the B PC as shown below. Every
second a new number indicating in seconds how long A has been running will be displayed in the
Serial I/O window shown below. CAN node B is started. B requests A send the time stamp, then B
displays it. You now have a running CAN node to experiment with. Congratulations !
3) If you get errors - a section called Communication Setup - Help ! follows.
4) If you get no errors and the Serial windows indicate that both program A and B have started but no
numbers appear in the B Serial window: there is probably something wrong with the physical CAN
network. The next section describes testing each CAN node to help you track the problems.
The first 11 seconds of A running and displaying on B
7
COMMUNICATIONS SETUP - Help !
You need to follow these instructions if proper communication was not established. After a series of
attempts, dScope will error out as indicated in the No Target System Found ! dialog box.
Select the appropriate configuration. Select the appropriate COM port for your system. The speed must
be 9600 for the C167 with a 5 Mhz crystal. Select 19,200 if 9600 does not work.. This depends on
which version of the monitor you have installed. Monitors for 19.2, 38.4, and 57.6 Kbaud are available
from Keil.
After you set the COM port and baud rate correctly, click on Try Again.
FIGURE 5
If you receive Figure 5 as an error message in dScope; the wrong version of the monitor kernel is
loaded into the MCB167 memory. dScope uses the files boot and monitor to load into the Keil board
RAM. The correct files must be loaded into your hard drive where the Keil evaluation software
(EK166) was loaded. (default = c:\c166eval\bin). These files are default with the Keil software.
Copies are available in the file cansoft.zip that came with this document and it is also available at
www.keil.com/~market/.
The serial FIFO buffer in Windows 95 can cause transmission problems. dScope may have problems
completing the communication initialization process. This can be intermittent. The FIFO can be
disabled under "controlpanel/system/device_manager/Port Settings/Advanced". Make sure “Use
FIFO buffers” in this menu is not activated.
Notes on using RESET in dScope and the MCB167
1) dScope in simulator mode: When you are using dScope as a simulator (i.e. no target hardware),
pressing the 'reset' button does not cause a running simulation to stop at the current point of
execution. Reset starts the application from the beginning address (0) again. This situation is
evident in example 15 where a reset causes the program to re-run. Press the “Stop” button to halt a
program normally.
2) dScope in monitor mode (tScope): The monitor is running in the target hardware. A tScope 'reset'
sets the IPC to zero and does some other initializations if no user application was started. It is not
as good as a hardware reset. The best method to stop an application that is running is to press the
“STOP” button rather than the “RESET” button in tScope.
'stop' tries to stop a running application when the 'use serial interrupt' option is enabled - or - if not
enabled, a dialog box is displayed where you can select the next step. This has the advantage of
seeing the 'infinite loop' where your program is stuck. With reset, you are starting at address 0
again.
3) The Keil board does have a hardware NMI button.
8
Testing the MCB167 CAN Interface
At this point you will have two boards with the physical layer installed, the Keil Tool Set installed, and
the CAN sample programs copied to the c:\can directory. In order to make sure the boards are working
correctly; a simple test is provided. This may save you plenty of time. You will need an oscilloscope or
other method of determining the existence of a 1 Mhz TTL level data stream.
This test will allow you to determine if each board is capable of sending a CAN message on to the
physical layer. You can view a TTL level waveform with an oscilloscope when program B is running.
You do not need to have the other node working or connected. It is best if they are not connected.
1) Connect the board you want to test to the PC COM port and start program B as described above.
Press GO to run the B program. “Program B Start” will be displayed in the Serial I/O window.
2) Measure P4.6 (transmit) with an oscilloscope. Figure 6 illustrates the position of these points. You
should see a digital data signal of 4.5 volts p-p as shown in Figure 7.
3) If the 82C250 is connected, a similar data signal of about 4 volts will be shown on P4.5 (receive).
4) Note that if you stop the CPU with the STOP button, this signal does not stop. This demonstrates
the fact that the CAN controller does not need CPU intervention to operate.
5) Check the physical CAN signals on Pins 6 and 7 of the 82C250. Each signal will be about 1.5 and
2 volts p-p respectively. Remember these outputs/inputs are a differential pair, so in order to see
the true waveform, you will need to use a two channel scope set to ADD with one channel inverted
from the other. This will give the same signal as Figure 6 but at about 2 volts p-p.
6) Test the other board in the same fashion.
FIGURE 6
FIGURE 7
Notes:
1) If P4.6 and P4.5 are not connected to anything; P4.6 would sometimes not put any signal out. The
CPU had to be stopped, the dScope RESET activated and GO pressed again. The dScope reset is
the icon with the small red “T” pointing into a circle on the dScope toolbar or the RESET button on
the Toolbox window. Sometimes I had to reload the object file again. A signal would never appear
on the Receive (P4.4) in this case.
9
2) If I connected a resistor ( 2k or so) between P4.6 and P4.5, the appearance of a signal on the
Transmit pin would be appear more consistently and a smaller signal would appear on the Receive
pin P4.5.
3) If the 82C250 was connected; the system became very stable. Only switching a relatively heavy
load would cause the signals to disappear. A RESET and then a GO would restore operation.
4) The 120 Ω resistor (R1 in Figure 1) or the ground lead at SW1-8 do not need to be connected for
this demonstration to work. Using the ground is a good idea.
5) Program A does not put out any signal on its own.
6) If the CAN network is intact and running properly; the signals are similar but “fuzzier” indicating
the data is changing and the oscilloscope will not properly lock on to such a dynamic signal.
For more information you may visit these Web sites:
http://www.keil.com/can and www.keil.com/~market for CAN specific material
http://www.keil.com/~market - Technical Marketing page.
http:/www.smi.siemens.com - for the Siemens page.
http:/www.st.com - for the SGS Thomson page
10