1
SigmaSystemCenter 3.0
Data Reference Guide
- Second Edition -
Copyright (C) NEC Corporation 2003-2012. All rights reserved.
Disclaimer of Warranty
All the information, text, graphics, links or other items contained within this document is provided by
copyright law.
All Rights Reserved. No part of this document may be reproduced or transmitted without permission of
NEC.
NEC may make changes to this document, at any time without notice.
NEC assumes no responsibility for errors or omissions in this document.
THIS DOCUMENT IS PROVIDED "AS IS" WITHOUT WARRANTY OF ANY KIND, EITHER
EXPRESS OR IMPLIED, INCLUDING WITHOUT LIMITATION THE IMPLIED WARRANTIES OF
MERCHANTABILITY, FITNESS FOR A PARTICULAR PURPOSE AND NON-INFRINGEMENT.
NEC does not warrant the accuracy or completeness of this document.
Trademark Information
▪ SigmaSystemCenter, MasterScope and SIGMABLADE are registered trademarks or trademarks of
NEC Corporation.
▪ ESMPRO is a registered trademark or trademark of NEC Corporation in Japan and other
countries.
▪ Microsoft, Windows, Windows Server, Windows Vista, Internet Explorer, SQL Server, and Hyper-V
are registered trademarks of Microsoft Corporation in the United States and other countries.
▪ Linux is a registered trademark or trademark of Linus Torvalds in the U.S. and/or other countries.
▪ Red Hat is a registered trademark or trademark of Red Hat, Inc. in the U.S. and/or other countries.
▪ Intel, and Itanium are trademarks of Intel Corporation in the U.S. and/or other countries.
▪ Apache, Apache Tomcat and Tomcat are registered trademarks or trademarks of The Apache
Software Foundation.
▪ NetApp, Data ONTAP, FilerView, MultiStore, vFiler, Snapshot and FlexVol are trademarks or
registered trademarks of NetApp, Inc. in the United States and/or other countries.
Other names and brands used in this document may be registered trademarks or trademarks of their
respective owners.
Note that (R) and TM marks are not indicated in this document.
Contents
Preface ................................................................................................................................. 5
How to Use This Manual ....................................................................................................................... 5
Manual Organization ............................................................................................................................. 5
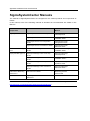
SigmaSystemCenter Manuals .............................................................................................................. 6
Document Conventions......................................................................................................................... 8
1.
Error Events and Policy Actions .................................................................................. 11
1.1.
1.2.
Event Monitoring and Policy .................................................................................................... 12
Events SigmaSystemCenter Can Detect ................................................................................. 13
1.2.1.Events NEC ESMPRO Manager Can Detect ........................................................................................... 16
1.2.2.Checking Events that Can Be Detected Through NEC ESMPRO Manager ............................................. 20
1.2.3.Events SystemProvisioning Can Detect ................................................................................................... 22
1.2.4.Events System Monitor - Performance Monitoring Services Can Detect .................................................. 23
1.2.5.Events the VMware (vCenter Server) Compatible Function Can Detect .................................................. 25
1.2.6.Events the VMware (ESXi) Compatible Function Can Detect .................................................................. 33
1.2.7.Events the Optimized Placement Can Detect........................................................................................... 34
1.2.8.Events the Out-of-Band Management Can Detect ................................................................................... 35
1.2.9.Events the Hyper-V Cluster Function Can Detect..................................................................................... 54
1.3.
1.4.
Policy Setting ........................................................................................................................... 57
Configuring Actions .................................................................................................................. 58
1.4.1.Flow Control of Multiple Actions ............................................................................................................... 58
1.4.2.Suppression of Action Execution (Suppression of Error Event) ................................................................ 62
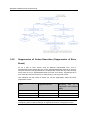
1.4.3.Grouping Multiple Events ......................................................................................................................... 63
1.5.
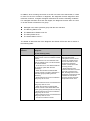
About Diagnosis ....................................................................................................................... 64
1.5.1.Diagnosis Function ................................................................................................................................... 64
1.5.2.Sensor Diagnosis ..................................................................................................................................... 67
1.5.3.Hardware Parts Status Diagnosis ............................................................................................................. 70
1.5.4.Total Recover Diagnosis .......................................................................................................................... 74
1.6.
About Standard Policy ............................................................................................................. 77
1.6.1.Settings of a Standard Policy ................................................................................................................... 78
1.6.2.Settings of a Standard Policy (N+1) ......................................................................................................... 82
1.6.3.Settings of a Standard Policy (Virtual Machine) ....................................................................................... 88
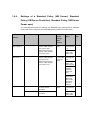
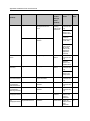
1.6.4.Settings of a Standard Policy (VM Server), Standard Policy (VM Server Predictive), Standard
Policy (VM Server Power save) ..................................................................................................... 91
1.6.5.Standard Policy (VM Server ESXi) ........................................................................................................... 93
1.6.6.Settings of a Standard Policy (VM Server Hyper-V), a Standard Policy (VM Server Hyper-V
Predictive), And a Standard Policy (VM Server Hyper-V Power Save) .......................................... 95
1.6.7.Settings of a System Policy (Manager)..................................................................................................... 97
1.6.8.Settings of HW Predictive Monitoring Events ........................................................................................... 99
1.7.
List of Policy Actions ................................................................................................................ 105
1.7.1.Notification/ E-mail, Event Log ................................................................................................................. 106
1.7.2.Machine Status / Set Ready Status .......................................................................................................... 108
1.7.3.Machine Status / Set Degraded Status..................................................................................................... 108
1.7.4.Machine Status / Set Faulted Status ........................................................................................................ 108
1.7.5.Machine Status / Set Faulted Status by Sensor Diagnosis....................................................................... 108
1.7.6.Machine Status / Set Ready Status by HardwarePartsStatus Diagnosis.................................................. 109
1.7.7.Machine Status / Set Ready Status by Total Recover Diagnosis ............................................................. 110
1.7.8.Action for Machine / Startup Machine ....................................................................................................... 110
1.7.9.Action for Machine / Reboot Machine ....................................................................................................... 110
1.7.10.Action for Machine / Shutdown Machine ................................................................................................ 110
1.7.11.Action for Machine / Turn on LED........................................................................................................... 110
1.7.12.Action for Machine / Turn off LED........................................................................................................... 111
1.7.13.Action for Machine / Replace Machine ................................................................................................... 111
1.7.14.Action for machine / Replace machine(Immediate Power OFF) ............................................................. 111
1.7.15.Action for machine / Diagnose and Power OFF...................................................................................... 111
1.7.16.Action for Group / Scaleout Add a Machine to the Group ....................................................................... 112
1.7.17.Action for Group / Scaleout Startup Machines in the Group ................................................................... 112
Appendix A Network Ports and Protocols
1.7.18.Action for Group / Create a Machine to the Group ..................................................................................112
1.7.19.Action for Group / Scalein Delete a Machine From the Group ................................................................112
1.7.20.Action for Group / Delete a Virtual Machine From the Group ..................................................................113
1.7.21.Action for Group / Scalein Suspend Machines in the Group .................................................................113
1.7.22.Action for Group / Scalein Shutdown Machines in the Group..................................................................113
1.7.23.Action for Group / Apply VM Optimized Placement Rule.........................................................................113
1.7.24.Action for Group / Refill the Reserved VM Server ...................................................................................113
1.7.25.Action for VMS / Move all running VMs on the VM server. (Failover) ......................................................114
1.7.26.Action for VMS / Move all running VMs on the VM server. (Migration) ....................................................114
1.7.27.Action for VMS / Move all running VMs on the VM server. (Migration, Failover) .....................................114
1.7.28.Action for VMS / Move all VMs on the VM server. (Failover)...................................................................115
1.7.29.Action for VMS / Move all VMs on the VM server. (Migration).................................................................115
1.7.30.Action for VMS / Move all VMs on the VM server. (Migration, Failover) ..................................................115
1.7.31.Action for VMS / Move all VMs on the VM Server. (Quick Migration, Failover) .......................................116
1.7.32.Action for VMS / Power Save VM server .................................................................................................116
1.7.33.Action for VMS / Load Balance VM server ..............................................................................................116
1.7.34.Action for VMS / Apply VM Optimized Placement Rule ...........................................................................116
1.7.35.Action for VMS / Shutdown VM Server(Predictive)..................................................................................117
1.7.36.Execute Local Script................................................................................................................................117
1.7.37.Reset of an Action Execution Result .......................................................................................................117
2.
Logs ...............................................................................................................................119
2.1.
2.2.
Types of Logs ........................................................................................................................... 120
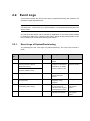
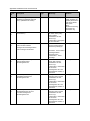
Event Logs ............................................................................................................................... 121
2.2.1.Event Logs of SystemProvisioning ............................................................................................................121
2.2.2.Event Logs Regarding Compatibility With NEC ESMPRO Manager .........................................................166
2.3.
List of Log Files ........................................................................................................................ 167
2.3.1.Logs of SystemProvisioning ......................................................................................................................167
2.3.2.Logs of DPM .............................................................................................................................................170
2.3.3.Logs of System Monitor - Performance Monitoring Services.....................................................................175
2.3.4.Logs of NEC ESMPRO Manager ..............................................................................................................175
Appendix A
Network Ports and Protocols ...................................................................189
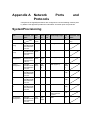
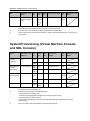
SystemProvisioning............................................................................................................................... 189
SystemProvisioning (Virtual Machine Console and SOL Console) ...................................................... 190
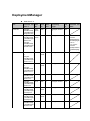
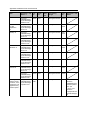
DeploymentManager ............................................................................................................................. 191
NEC ESMPRO Manager ....................................................................................................................... 196
System Monitor - Performance Monitoring Services ............................................................................ 198
Adding ICMP Echo Reply to the Exception List of Windows Server 2008 Firewall .............................. 199
Appendix B
Transferring the Configuration Database ................................................205
Using Windows Authentication Login.................................................................................................... 205
Using SQL Authentication Login ........................................................................................................... 211
Appendix C
How to Estimate Database Usage ............................................................215
SystemProvisioning............................................................................................................................... 215
System Monitor - Performance Monitoring Services ............................................................................ 218
DeploymentManager ............................................................................................................................. 219
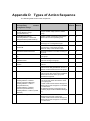
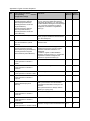
Appendix D
Types of Action Sequence........................................................................221
Appendix E
Revision History ........................................................................................225
Appendix F
License Information ..................................................................................227
Preface
How to Use This Manual
SigmaSystemCenter Data Reference Guide is intended for administrators of SigmaSystemCenter and
explains its information of maintenance. This manual is a supplement to SigmaSystemCenter
Configuration Guide.
Manual Organization
Part I
Maintenance Information
1
"Error Events and Policy Actions": Describes the list of error events that
SigmaSystemCenter can detect, the list of actions of policies, and the default disposals.
"Logs": Explains the Event logs that are displayed by SigmaSystemCenter.
2
Appendices
Appendix A
Appendix B
Appendix C
Appendix D
Appendix E
Appendix F
"Network Ports and Protocols"
"Transferring the Configuration Database"
"How to Estimate Database Usage"
"Types of Action Sequence"
"Revision History"
"License Information"
Appendix A Network Ports and Protocols
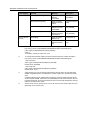
SigmaSystemCenter Manuals
The manuals of SigmaSystemCenter are configured for the various products and components as
follows.
In this manual, each of the following manuals is described as "How Manuals Are Called in This
Manual."
Products
or
Manuals
Components
SigmaSystemCenter 3.0
How Manuals Are Called in This
Manual
SigmaSystemCenter 3.0 First Step Guide
SigmaSystemCenter
First Step Guide
SigmaSystemCenter 3.0 Installation Guide
SigmaSystemCenter
Installation Guide
SigmaSystemCenter 3.0 Configuration
Guide
SigmaSystemCenter
Configuration Guide
SigmaSystemCenter 3.0 Reference Guide
SigmaSystemCenter
Reference Guide
NEC ESMPRO Manager
5.43
NEC ESMPRO Manager Ver.5.4 Installation
Guide
NEC ESMPRO Manager
Installation Guide
DeploymentManager 6.0
DeploymentManager Ver6.0 First Step
Guide
DeploymentManager
First Step Guide
DeploymentManager Ver6.0 Installation
Guide
DeploymentManager
Installation Guide
DeploymentManager Ver6.0 Operation
Guide
DeploymentManager
Operation Guide
DeploymentManager Ver6.0 Reference
Guide
DeploymentManager
Reference Guide
System Monitor - Performance Monitoring
Services User’s Guide
System Monitor - Performance
Monitoring Services
User’s Guide
SigmaSystemCenter SSC Command
Reference
SSC Command Reference
System Monitor Performance Monitoring
Services 5.0
Reference: All the latest SigmaSystemCenter manuals are available in the following URL.
http://www.nec.com/sigmasystemcenter/en/support/index.html
The information regarding product summary, installation, configuration, operation and maintenance
of SigmaSystemCenter are included in the following four manuals. The purposes of the manuals are
as follows.
SigmaSystemCenter First Step Guide
This manual is intended for users who use SigmaSystemCenter for the first time and explains the
product summary, system design methods and operating environment.
SigmaSystemCenter Installation Guide
This manual is intended for system administrators who install, upgrade, or uninstall
SigmaSystemCenter and explains how to.
SigmaSystemCenter Configuration Guide
This manual is intended for system administrators who configure the whole system after installation
and who operate and maintain the system after the configuration. Actual operational flow is used to
explain the process from the configuration after installation to the operating procedures. This manual
also explains the maintenance process.
SigmaSystemCenter Reference Guide
This manual is intended for administrators of SigmaSystemCenter and explains its functions, the
operational methods, information of maintenance and trouble shooting, and lists all the operating
screens. This manual is a supplement to SigmaSystemCenter Installation Guide and
SigmaSystemCenter Configuration Guide.
Appendix A Network Ports and Protocols
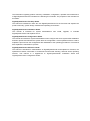
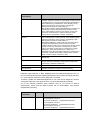
Document Conventions
In this manual, information that needs attention and references are described as follows:
Note: indicates caution notes, and supplementary explanation for functions, operations,
and settings.
Reference: indicates why and where you should refer to.
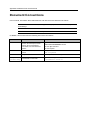
In addition, this manual uses the following document conventions.
Convention
Used Item
Example
Bold font
Items that a user selects on a
screen, short text input, screen
names, short command-line
commands, and command-line
options
Type Exit and click Enter.
User License Confirmation screen
Use the –prt command.
Use the /a option.
Italic font
Book or manual titles, and variable
names
Configuration Guide
Quotation marks
Chapter titles and default values
See Chapter 9, "Add a Computer."
Monospace font
Long text inputs, messages and
command-line commands
Type the following text:
(courier new)
add GroupName
Confidential-Class B
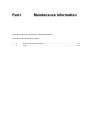
Part I
Maintenance Information
This part describes the maintenance of SigmaSystemCenter.
This part contains the following chapters:
•
•
1
2
Error Events and Policy Actions ................................................................................11
Logs .........................................................................................................................119
1.
Error Events and Policy Actions
This chapter explains the errors that SigmaSystemCenter can detect and the details of policy
actions to which corresponding event handler settings to the assumable errors can be configured.
This chapter contains the following sections:
•
•
•
•
•
•
•
1.1
1.2
1.3
1.4
1.5
1.6
1.7
Event Monitoring and Policy ..................................................................................... 12
Events SigmaSystemCenter Can Detect .................................................................. 13
Policy Setting ............................................................................................................ 57
Configuring Actions ................................................................................................... 58
About Diagnosis ........................................................................................................ 64
About Standard Policy .............................................................................................. 77
List of Policy Actions ............................................................................................... 105
Appendix A Network Ports and Protocols
1.1. Event Monitoring and Policy
SigmaSystemCenter can monitor events and performance of managed machines. It
can also change configuration of machines to restore from an event or error and notify
a user that an event or error occurred.
SigmaSystemCenter works with multiple compatible products and components, such
as NEC ESMPRO Manager, NEC ESMPRO Agent, VMware vCenter Server, and
System Monitor - Performance Monitoring Services for monitoring the running status,
events, and performance of managed machines. If a compatible product or component
detects a status change of a managed machine, it notifies the event to the policy
control processing of SigmaSystemCenter.
The policy control processing of SigmaSystemCenter outputs the event information to
Operation Logs, and then, executes the processing to cope with the event according to
policy setting.
You can set actions to execute against each event, order to process events, and
execution conditions for policy setting. In addition, you can assign policy setting to each
operation group and model.
1.2. Events SigmaSystemCenter Can Detect
Monitoring products and components that SigmaSystemCenter can work with and what
they monitor are as follows:
Note: A registry path of Windows OS is different according to whether it is x86 OS or
x64 OS. The registry path in this section is indicated in the x86 OS format. If you are
using x64 OS, substitute "HKEY_LOCAL_MACHINE\SOFTWARE\Wow6432Node" for
"HKEY_LOCAL_MACHINE\SOFTWARE."
NEC ESMPRO Manager and NEC ESMPRO Agent
NEC ESMPRO Manager requests NEC ESMPRO Agent on a managed machine
to acquire information by SNMP periodically and if NEC ESMPRO Manager cannot
acquire the information, NEC ESMPRO Manager regards that the managed
machine is down and notifies Machine inaccessible error event to the policy control
processing of SigmaSystemCenter. NEC ESMPRO Manager also can monitor the
threshold of statistical information of each resource and notify events.
NEC ESMPRO Agent always monitor each resource status of a managed machine.
If NEC ESMPRO Agent detects a failure of a resource, it notifies NEC ESMPRO
Manager of the failure. NEC ESMPRO Manager notifies the policy control
processing of SigmaSystemCenter of the failure.
For ESX, if the monitoring module of the HDD access impossible is installed with
NEC ESMPRO Agent on a machine, NEC ESMPRO Agent can detect the "No
response from the server" even when a HDD cannot be accessed.
Reference: For the details of or how to obtain the HDD Access Monitoring Module,
contact our sales representative.
SystemProvisioning
SystemProvisioning executes the following periodical monitoring as alive
monitoring for managed machines:
•
Examining the communication with Ping (Ping monitoring)
•
Connecting to the specified TCP port (Port monitoring)
Furthermore, SystemProvisioning can monitor managed machines whether they
function as virtual machine servers or not. It is called virtual machine server
monitoring and is available for Xen, Hyper-V, and KVM.
Appendix A Network Ports and Protocols
System Monitor - Performance Monitoring Services
System Monitor - Performance Monitoring Services notifies the policy control
processing of SigmaSystemCenter when statistics on CPU load factor of a
managed machine, a status of utilization, such as disk utilization, or statistics
information of multiple machines in a group exceeds the threshold value.
In addition, System Monitor - Performance Monitoring Services executes high or
low load alert monitoring of virtual machine servers that triggers the actions of the
VM Optimized Placement.
Monitoring through VMware vCenter Server
SigmaSystemCenter executes the following monitoring through vCenter Server.
•
Connection check of a virtual machine server (VMware)
•
CPU usage rate of a virtual machine server (VMware)
•
Memory usage rate of a virtual machine server (VMware)
•
Heartbeat status of a virtual machine (VMware)
•
CPU usage rate of a virtual machine (VMware)
•
Memory usage rate of a virtual machine (VMware)
•
Power status of a virtual machine (VMware)
•
Datastore usage rate
•
Allocation rate of disk on a datastore
•
Status of a datastore connection
•
Status of a network connection
When a failure occurs, an alert is generated in vCenter Server. If an alert related to
the above is generated, SigmaSystemCenter notifies it of its policy control
processing.
Monitoring VMware ESXi
If a managed machine is VMware ESXi, SigmaSystemCenter monitors the
machine directly by connecting remotely to monitor its running status.
To monitor the existence of a machine, SigmaSystemCenter checks the
connection from a management server to VMware ESXi. If the connection is
disconnected, the component notifies the policy control processing of
SigmaSystemCenter of Machine inaccessible error event and if the connection
recovers, SigmaSystemCenter notifies its policy control processing of a Machine
inaccessible error recovery event. In addition, SigmaSystemCenter checks the
disk access status periodically and if the check fails, SigmaSystemCenter notifies
its policy control processing of a Hard disk failure event.
Optimized Placement function
Optimized Placement provides the load balancing function. When the load
balancing function determines that high load status cannot be resolved even if all
virtual machine servers in a group are used, it notifies the policy control processing
of SigmaSystemCenter of Scaleout Recommendation event.
Optimal Placement monitors the value of "Consumed" and "Actually Consumed" in
resource pools, and, when it excesses or goes down its thresholds, this function
reports the events of resource pool consumption to SigmaSystemCenter policy
control.
Out-of-Band Management
Out-of-Band Management receives PET directly from BMC of managed machines
and manages them to detect abnormality and failure in the hardware. Out-of-Band
Management can detect an event corresponds to the hardware failure event that is
detected by NEC ESMPRO Manager and NEC ESMPRO Agent. A difference is
Out-of-Band Management does not use services on OS. Therefore, Out-of-Band
Management can detect hardware failure events even when OS cannot be
accessed.
Out-of-Band Management monitors voltages and temperatures of chassis, and
predicts that hardware will be in critical failure status to notify the policy control
processing of SigmaSystemCenter of HW Predictive events
Note: A managed machine where NEC ESMPRO Agent is installed does not send
PET but sends NEC ESMPRO Agent's reports. However, both NEC ESMPRO
Agent's reports and PET might be sent depending on the timing of hardware
failures. Even if this is the case, Out-of-Band Management events will not occur on
the machine managed by NEC ESMPRO Agent.
Monitoring through Microsoft Failover Cluster
If a node of a Hyper-V virtual machine server or a Hyper-V virtual machine
managed
by
Microsoft
Failover
Cluster
and
SigmaSystemCenter,
SigmaSystemCenter obtains events from Microsoft Failover Cluster and notifies
the policy control processing of SigmaSystemCenter of the events.
To make SigmaSystemCenter work with the Microsoft Failover Cluster as the
above mentioned, add the Hyper-V cluster as a subsystem.
Microsoft Failover Cluster is a high-available system, so the virtual machines
running on it are also high-available. For example, when a virtual machine fails,
Microsoft Failover Cluster failovers the virtual machine to another node.
SigmaSystemCenter obtains Microsoft Failover Cluster events such as node down
or virtual machine failure, updates the database, and notifies system
administrators of the events.
Following subsections explains the events that these products or components can
detect and the checking procedure of detected events.
Appendix A Network Ports and Protocols
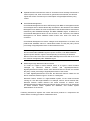
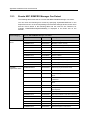
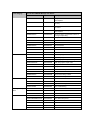
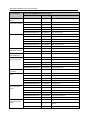
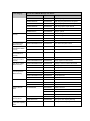
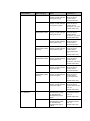
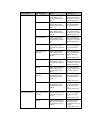
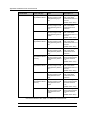
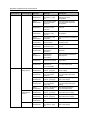
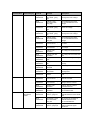
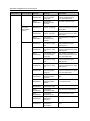
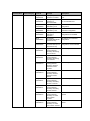
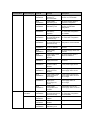
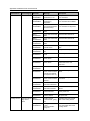
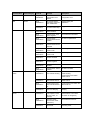
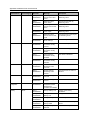
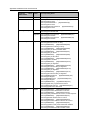
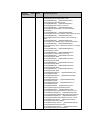
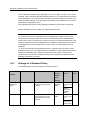
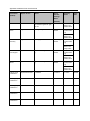
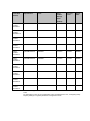
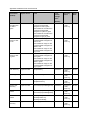
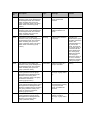
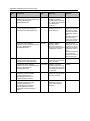
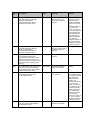
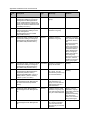
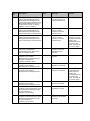
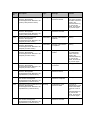
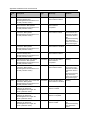
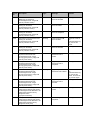
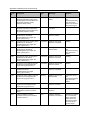
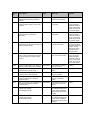
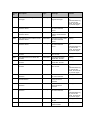
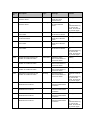
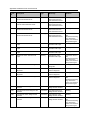
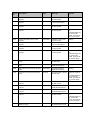
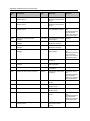
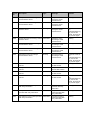
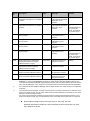
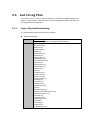
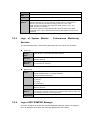
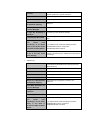
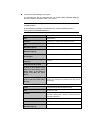
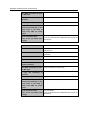
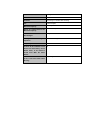
1.2.1.
Events NEC ESMPRO Manager Can Detect
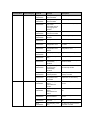
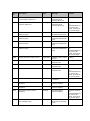
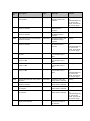
The following table shows the error events that NEC ESMPRO Manager can detect.
You can check the following error events by specifying "SystemMonitorEvent" in the
Report Source box on the Corresponding Event Handler Settings window, and a value
that the Source Name in the following table and the event ID are combined, for
example, ESMFSSERVICE[0XC00403E8], is displayed in the Event box on the
window.
Event Category
Hard disk recovery
failure
Hard disk
replacement failure
Events NEC ESMPRO Manager Can Detect
Source Name
Event ID
Description
ESMDISKARRAY
0X800403E9
Disk Array Logical Device Critical
ASMBENOTIFY
0X0000200C
Member is down on array
ASMBENOTIFY
0X0000200D
Member is missing on array
ASMBENOTIFY
0X0000200E
Array is off-line; member failed
ASMBENOTIFY
0X00002023
Array is critical
ASMBENOTIFY
0X0000205C
Array is still critical
ASMBENOTIFY
0X0000B00E
Device is failed
ASMBENOTIFY
0X0000B033
Array is degraded
ASMBENOTIFY
0X0000B034
Second-level array is degraded
ASMBENOTIFY
0X0000B036
Array is degraded
ASMBENOTIFY
0X0000B037
Second-level array is degraded
ESMDISKARRAY
0XC00403F3
Disk Array Physical Device Dead
ESMDISKARRAY
0XC00403F7
Disk Array Physical Device Dead
ESMDISKARRAY
0X800403FC
Disk Array Physical Device S.M.A.R.T.
Error
ESMSTORAGESERVICE
0X800403E8
Hard Disk Failure Prediction:Exceed
Threshold
ESMSTORAGESERVICE
0X800403E9
Hard Disk Failure Prediction:S.M.A.R.T.
Error
ASMBENOTIFY
0X00002014
Reconstruct aborted due to I/O error
ASMBENOTIFY
0X00002017
Verify aborted due to I/O error, no
miscompares
ASMBENOTIFY
0X00002019
Initialize aborted due to I/O error
ASMBENOTIFY
0X0000202D
Reconstruct failed to start due to I/O error
ASMBENOTIFY
0X00002035
Update of array drives failed after Initialize
ASMBENOTIFY
0X00002038
Scheduled Reconstruct failed to start
ASMBENOTIFY
0X00002039
Scheduled Verify failed to start
ASMBENOTIFY
0X0000204E
Verify utility failed to start
ASMBENOTIFY
0X00002059
Dedicated spare not functional
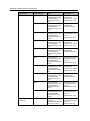
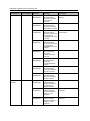
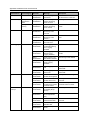
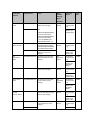
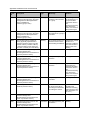
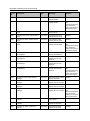
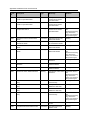
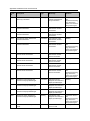
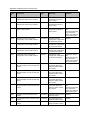
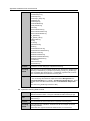
Event Category
Hard disk failure
CPU load failure
CPU degeneracy
failure
CPU failure
Events NEC ESMPRO Manager Can Detect
Source Name
Event ID
Description
ASMBENOTIFY
0X00002085
Verify aborted due to I/O error with fixed
miscompares
ASMBENOTIFY
0X00002090
Recovered error: SMART event received
for array
ASMBENOTIFY
0X00002091
Recovered error: SMART event received
for device
ASMBENOTIFY
0X00002094
I/O error aborted Verify, unfixed
miscompares
ASMBENOTIFY
0X000020AD
Device is down. A Hard Drive is down or
no longer responding.
ASMBENOTIFY
0X0000B069
Array is dead
ASMBENOTIFY
0X0000B090
Non-corrected ECC error found
ASMBENOTIFY
0X0000B11E
Channel offline
ASMBENOTIFY
0X0000B11F
Channel offline
ASMBENOTIFY
0X0000B121
Channel offline
ASMBENOTIFY
0X0000B122
Channel offline
ASMBENOTIFY
0X0000B123
Channel offline
ESMDISKARRAY
0XC00403EA
Disk Array Logical Device Offline
ESMDISKARRAY
0XC00403EC
Disk Array Logical Device Offline
ESMDISKARRAY
0X80040407
Disk Array Option report Warning
ESMDISKARRAY
0XC0040408
Disk Array Option report Fatal
ASMBENOTIFY
0X0000200F
Array is off-line
ASMBENOTIFY
0X0000B057
Array is dead
ASMBENOTIFY
0X0000B058
Second-level array is dead
ASMBENOTIFY
0X0000B05A
Array is dead
ASMBENOTIFY
0X0000B05B
Second-level array is dead
ASMBENOTIFY
0X0000B06A
Second-level array is dead
ESMCPUPERF
0XC0000064
CPU Load Error
ESMCPUPERF
0XC0000068
CPU Load Error
ESMCPUPERF
0X80000066
CPU Load Warning
ESMCPUPERF
0X8000006A
CPU Load Warning
ESMCOMMONSERVICE
0X800002BD
CPU Reduce
ESMCOMMONSERVICE
0X800002BF
CPU Reduce
ESMCOMMONSERVICE
0XC0000838
CPU Module FRB
ESMCOMMONSERVICE
0XC0000451
CPU Internal error
ESMCOMMONSERVICE
0XC0000454
CPU thermal trip event
ESMCOMMONSERVICE
0XC0000523
Processor Disabled
ESMCOMMONSERVICE
0xC0000947
Processor Error
ESMCOMMONSERVICE
0XC0000B04
CPU Self-Test Error
ESMCOMMONSERVICE
0XC0000B07
CPU Initialize Error
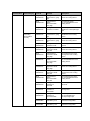
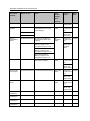
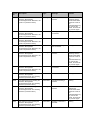
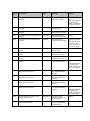
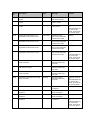
Appendix A Network Ports and Protocols
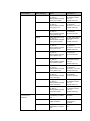
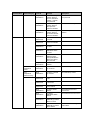
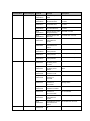
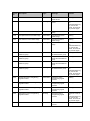
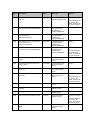
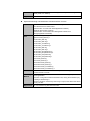
Event Category
Events NEC ESMPRO Manager Can Detect
Source Name
Event ID
Description
CPU temperature
failure
ESMCOMMONSERVICE
0XC0000454
CPU thermal trip event
Memory
degeneration failure
ESMCOMMONSERVICE
0X800002BE
Memory Reduce
ESMCOMMONSERVICE
0X800002C6
Memory Reduce
ESMCOMMONSERVICE
0X80000515
POST memory resize
ESMCOMMONSERVICE
0X8000051A
POST cache Reduce
ESMCOMMONSERVICE
0XC000051C
Cache ECC multi
ESMCOMMONSERVICE
0XC000044C
ECC Multiple Error
ESMCOMMONSERVICE
0XC00008FC
ECC Uncorrectable Error
ESMCOMMONSERVICE
0XC0000903
ECC Uncorrectable Error
ESMCOMMONSERVICE
0xC0000959
Memory Error
ESMCOMMONSERVICE
0XC0000B18
Memory Parity Error
ESMCOMMONSERVICE
0xC0000B24
Memory Temperature Error
Memory
degeneration failure
ESMCOMMONSERVICE
0X80000BC2
Memory Utilization Warning
ESMCOMMONSERVICE
0XC0000BC0
Memory Utilization Error
Machine
inaccessible error
ESMDSVNT
0XC0000002
No response from the server
Prediction: chassis
temperature failure
ESMCOMMONSERVICE
0XC0000066
Temp Lower Error
ESMCOMMONSERVICE
0XC0000070
Temp Lower Limit Error
ESMCOMMONSERVICE
0XC0000064
Temp Upper Error
ESMCOMMONSERVICE
0XC0000072
Temp Upper Limit Error
ESMCOMMONSERVICE
0XC000093E
Temperature Error
Prediction: power
unit failure
ESMCOMMONSERVICE
0XC0000915
Power Unit Reduction
Prediction: voltage
failure
ESMCOMMONSERVICE
0XC00001FD
Voltage Lower Limit Error
ESMCOMMONSERVICE
0XC00001FF
Voltage Lower Limit Error
ESMCOMMONSERVICE
0XC0000203
Voltage Upper Limit Error
ESMCOMMONSERVICE
0XC0000205
Voltage Upper Limit Error
ESMCOMMONSERVICE
0XC0000932
Voltage Error
ESMCOMMONSERVICE
0XC00000C8
Fan Unit Error
ESMCOMMONSERVICE
0XC00000D0
Fan Lower Limit Error
ESMCOMMONSERVICE
0XC00000D2
Fan Lower Limit Error
ESMCOMMONSERVICE
0XC00000D6
Fan Upper Limit Error
ESMCOMMONSERVICE
0XC00000D8
Fan Upper Limit Error
ESMCOMMONSERVICE
0XC0000A8C
Liquid Leak Error
ESMDSIKARRAY
0X400403E8
Disk Array Logical Device Online
ESMDSIKARRAY
0X400403EB
Disk Array Logical Device Consistency
Check
ESMDSIKARRAY
0X400403F2
Disk Array Physical Device Online
Memory failure
Prediction:
fan/cooling device
failure
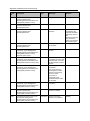
Recovery from the
hard disk recovery
failure
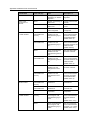
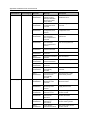
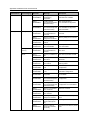
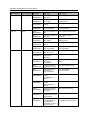
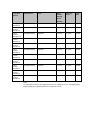
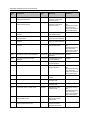
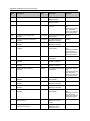
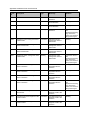
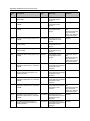
Event Category
Events NEC ESMPRO Manager Can Detect
Source Name
Event ID
Description
ESMDSIKARRAY
0X400403F4
Disk Array Physical Device Rebuild
ESMDSIKARRAY
0X400403F5
Disk Array Physical Device Hot Spare
ESMDSIKARRAY
0X400403F6
Disk Array Physical Device Ready
ESMDSIKARRAY
0X40040406
Disk Array Option report Normal
ASMBENOTIFY
0X00002013
Reconstruct completed
ASMBENOTIFY
0X0000B02D
Array is optimal
ESMCPUPERF
0X40000067
CPU Warning Recovered
ESMCPUPERF
0X4000006B
CPU Warning Recovered
ESMCPUPERF
0X80000065
CPU Error Recovered
ESMCPUPERF
0X80000069
CPU Error Recovered
CPU temperature
failure recovery
ESMCOMMONSERVICE
0X40000949
CPU thermal trip Recovered
Memory
degeneration failure
recovery
ESMCOMMONSERVICE
0X80000BC1
Memory Utilization Error Recovered
ESMCOMMONSERVICE
0X40000BC3
Memory Utilization Warning Recovered
Machine
inaccessible error
recovery
ESMDSVNT
0X40000001
The server access recovered
Clear Alert: chassis
temperature failure
recovery
ESMCOMMONSERVICE
0X8000006B
Temp Lower Error Recovered
ESMCOMMONSERVICE
0X8000006A
Temp Upper Error Recovered
ESMCOMMONSERVICE
0X800001FE
Voltage Lower Limit Error Recovered
ESMCOMMONSERVICE
0X80000204
Voltage Upper Limit Error Recovered
ESMCOMMONSERVICE
0X40000BAD
Voltage Recovery
ESMCOMMONSERVICE
0X800000D1
Fan Lower Limit Error Recovered
ESMCOMMONSERVICE
0X800000D7
Fan Upper Limit Error Recovered
ESMCOMMONSERVICE
0X400002C3
Cooler Reduced
ESMCOMMONSERVICE
0X400000CD
Fan Unit Error Recovered
CLUSTERPRO
0XC00008A4
Server down
CLUSTERPRO X
0X40000002
Server down
EXPRESSCLUSTER X
0X40000002
Server down
CLUSTERPRO
0XC0005217
Public LAN error
0XC000521B
Public LAN error
0XC000521C
Public LAN error
0XC000521D
Public LAN error
ESMFSSERVICE
0XC00403E8
File system free capacity:Fatal
ESMFSSERVICE
0X800403E9
File system free capacity:Warning
ESMFSSERVICE
0X400403EA
File system free capacity:Normal
CPU load failure
recovery
Clear Alert: voltage
failure recovery
Clear Alert:
fan/cooling device
failure recovery
Cluster: Node down
Cluster: Network
failure
File system free
capacity failure
Recover from File
system free capacity
failure
Appendix A Network Ports and Protocols
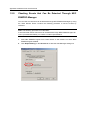
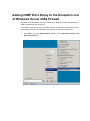
1.2.2.
Checking Events that Can Be Detected Through NEC
ESMPRO Manager
You can refer to events that can be detected through NEC ESMPRO Manager by using
the "Save Monitor Event". Perform the following procedure to see the events by
reference.
Note: The following procedure is for Windows.
A document that shows events that can be detected through NEC ESMPRO Agent for
Linux is provided individually, so contact our sales representative.
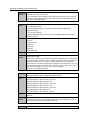
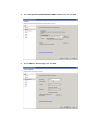
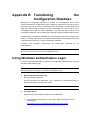
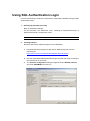
1.
Start NEC ESMPRO Agent from Control Panel on the machine on which NEC
ESMPRO Agent installed.
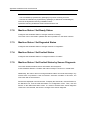
2.
Click Report Setting on the General tab to start the Alert Manager setting tool.
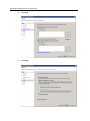
3.
Select Save Monitor Event from the Options menu on the Alert Manager setting
tool.
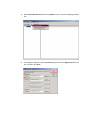
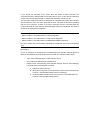
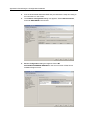
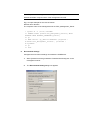
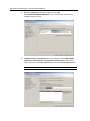
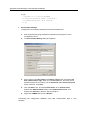
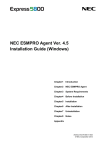
4.
The dialog box appears. Select the EventLog check box and Agent Events check
box, and then click Save.
Appendix A Network Ports and Protocols
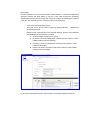
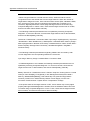
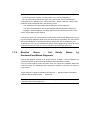
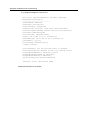
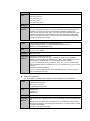
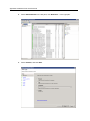
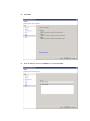
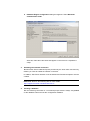
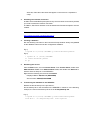
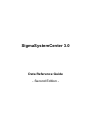
5.
The system starts writing the monitoring target to a file. The following dialog box is
displayed during writing.
6.
When the writing process finishes, the dialog box disappears.
Writing the monitoring target is now complete.
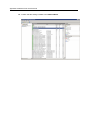
The first line is a header and from the second line, the written file is created in the CSV
format. See the event which "Manager" field is YES.
Note: The events that SigmaSystemCenter can detect through NEC ESMPRO
Manager are only default events monitored by NEC ESMPRO Agent. If you changed
the monitoring target, you may not be able to check the event properly.
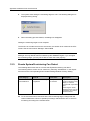
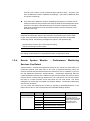
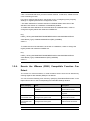
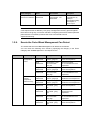
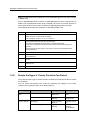
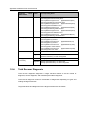
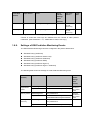
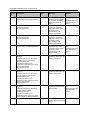
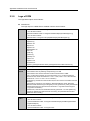
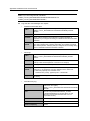
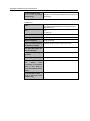
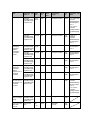
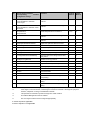
1.2.3.
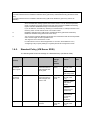
Events SystemProvisioning Can Detect
The following table shows the error events that SystemProvisioning can detect.
The following failure events can be checked by selecting "AliveMonitor" in the Report
Source list in the Corresponding Event Handler Settings window of Policy Setting.
Event Category
Event ID
Event Name
Description
Machine
inaccessible error
[PeriodicalAliveMonitor]
TargetDown
No response from
the machine.
SystemProvisioning
could not receive a Ping
Reply or could not
connect with a specified
port.
If the target is virtual
machine server, it is not
functioning as a virtual
machine server.
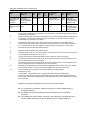
To set over 250 units of machines as the Port monitoring target, change both the
values of Maximum number of parallel processings and Maximum time of one time
monitoring according to the formula below:
Formula: (the number of Port monitoring target machine units) * 20 [sec] / (the
value of Maximum number of parallel processings) < (the value of Maximum time
of one time monitoring)
If the value of the Maximum number of parallel processings is increased, time to
monitor machines at one time becomes short but loads of the management server
increase. If the value of the Maximum time of one time monitoring is increased,
loads of the management server decrease but time to monitor machines at one
time becomes long.
Note: Depending on the number of SystemProvisioning's alive monitoring target
machines and the power status of the machines, the monitoring time can be much
longer. If the monitoring of all the target machines takes longer than the specified
monitoring interval, the following messages are output in the operations log:
periodical alive monitor: Got a slow response x[sec].
And the monitoring interval is x[sec].
Reference: For the setting of monitoring intervals, see Subsection 2.4.9, "Configuring
the Setting of Alive Monitor" in SigmaSystemCenter Configuration Guide.
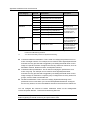
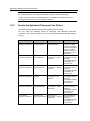
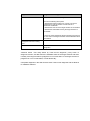
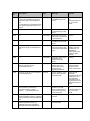
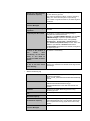
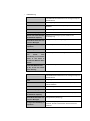
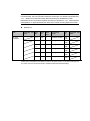
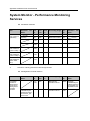
1.2.4.
Events
System
Monitor
-
Performance
Monitoring
Services Can Detect
System Monitor - Performance Monitoring Services can monitor the load status of a
monitored machine, and send alert as an event to SystemProvisioning when the
machine exceeds the threshold and when the machine recovers. In addition, if you use
the VM Optimized Placement, System Monitor - Performance Monitoring Services
notifies SystemProvisioning of the VM Server high load event when the load of a virtual
machine server exceeds the high load bound, or the VM Server low load event when
the load of a virtual machine server falls below the low load bound. The Event
Categories of events that are notified from System Monitor - Performance Monitoring
Services are as follows.
You can check the following error events by specifying "SystemMonitorPerf" in the
Report Source box on the Corresponding Event Handler Settings window.
Event Category
Event ID
Event Name
Description
Customized
Machine Notification
10000001
Customized machine notification1
10000002
Customized machine notification2
10000003
Customized machine notification3
10000004
Customized machine notification4
Performance data of
the target machine
exceeded the threshold
value / recovered from
the excess of the
threshold value. *1
10000005
Customized machine notification5
10000006
Customized machine notification6
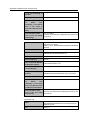
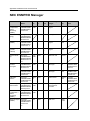
Appendix A Network Ports and Protocols
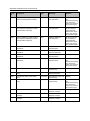
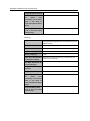
Event Category
Customized Group
Notification
VM Server
Notification
Event ID
Event Name
Description
10000007
Customized machine notification7
10000008
Customized machine notification8
10000009
Customized machine notification9
1000000A
Customized machine notification10
11000001
Customized group notification1
11000002
Customized group notification2
11000003
Customized group notification3
11000004
Customized group notification4
11000005
Customized group notification5
11000006
VM Server high load
The CPU usage rate of
the virtual machine
server exceeded the
high load bound. *2
11000007
VM Server low load
The CPU usage rate of
the virtual machine
server fell below the
low load bound. *2
Performance data of
the target group
exceeded the threshold
value / recovered from
the excess of the
threshold value. *1
*1
You set content of the notification and the threshold values from System Monitor Performance Monitoring Services.
*2
You set the boundary value from SystemProvisioning.
Customized Machine Notification: This is used for notifying the performance error
event of a single machine. For example, this is used for when SigmaSystemCenter
executes recovery process that is triggered by exceeding threshold value of CPU
usage of a specific machine. Configure the recovery actions for machines, such as
Shutdown machine, Reboot machine, and Replace machine.
Customized Group Notification: This is used for notifying the performance error
event of a group. For example, this is used for when SigmaSystemCenter
executes recovery process that is triggered by exceeding threshold value of CPU
usage average of machines in a specific group. Configure the recovery actions for
groups, such as Scale In and Scale Out.
VM Server Notification: This is used for notifying SystemProvisioning of the
performance error event when you use the VM Optimized Placement. Configure
the recovery actions, such as Load balance VM server and Power save VM server.
You can configure the contents of custom notification events on the management
console of System Monitor - Performance Monitoring Services.
Reference: See System Monitor - Performance Monitoring Services User’s Guide for
details regarding threshold monitoring and performance data.
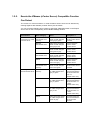
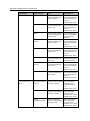
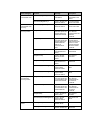
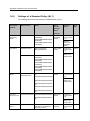
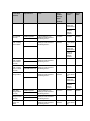
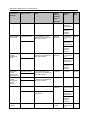
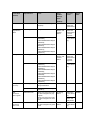
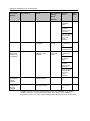
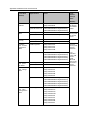
1.2.5.
Events the VMware (vCenter Server) Compatible Function
Can Detect
The events on virtual machines or virtual machine servers that can be detected by
working together with VMware (vCenter Server) are as follows.
You can check the following error events by specifying "VMwareProvider" in the Report
Source box on the Corresponding Event Handler Settings window.
Classification
Event Category
Error
Description *1
Status of the
connection to a virtual
machine server
Machine
inaccessible error
recovery
Alarm Host connection
state on VMS changed
from gray to green
The response from the
virtual machine server
is revived.
Machine
inaccessible error
Alarm Host connection
state on VMS changed
from gray to red
Lost the response
from the virtual
machine server.
Others
Alarm Host connection
state on VMS changed
from green to gray
Lost the response
from the virtual
machine server.
Machine
inaccessible error
Alarm Host connection
state on VMS changed
from green to red
Lost the response
from the virtual
machine server.
Others
Alarm Host connection
state on VMS changed
from red to gray
Lost the response
from the virtual
machine server.
Machine
inaccessible error
recovery
Alarm Host connection
state on VMS changed
from red to green
The response from the
virtual machine server
is revived.
CPU load failure
recovery
Alarm Host CPU Usage
on VMS changed from
gray to green
The CPU usage rate
of the virtual machine
server becomes less
than n %.
CPU usage rate on a
virtual machine server
(Default value: 75%)
Others
Alarm Host CPU Usage
on VMS changed from
gray to yellow
The CPU usage rate
of the virtual machine
server becomes n %
or more.
(Default value: 75%)
CPU load failure
Alarm Host CPU Usage
on VMS changed from
gray to red
The CPU usage rate
of the virtual machine
server becomes n %
or more.
(Default value: 90%)
Others
Alarm Host CPU Usage
on VMS changed from
green to gray
The CPU usage rate
of the virtual machine
server becomes
unknown.
Appendix A Network Ports and Protocols
Classification
Usage rate of memory
on a virtual machine
server
Event Category
Error
Description *1
Others
Alarm Host CPU Usage
on VMS changed from
green to yellow
The CPU usage rate
of the virtual machine
server becomes n %
or more.
(Default value: 75%)
CPU load failure
Alarm Host CPU Usage
on VMS changed from
green to red
The CPU usage rate
of the virtual machine
server becomes n %
or more.
(Default value: 90%)
Others
Alarm Host CPU Usage
on VMS changed from
yellow to gray
The CPU usage rate
of the virtual machine
server becomes
unknown.
CPU load failure
recovery
Alarm Host CPU Usage
on VMS changed from
yellow to green
The CPU usage rate
of the virtual machine
server becomes less
than n %.
(Default value: 75%)
CPU load failure
Alarm Host CPU Usage
on VMS changed from
yellow to red
The CPU usage rate
of the virtual machine
server becomes n %
or more.
(Default value: 90%)
Others
Alarm Host CPU Usage
on VMS changed from
red to gray
The CPU usage rate
of the virtual machine
server is unknown.
CPU load failure
recovery
Alarm Host CPU Usage
on VMS changed from
red to green
The CPU usage rate
of the virtual machine
server becomes less
than n %.
(Default value: 75%)
Others
Alarm Host CPU Usage
on VMS changed from
red to yellow
The CPU usage rate
of the virtual machine
server becomes less
than n %.
(Default value: 90%)
Memory
degeneration failure
recovery
Alarm Host Memory
Usage on VMS changed
from gray to green
The memory usage
rate of the virtual
machine server
becomes less than
n %.
(Default value: 75%)
Others
Alarm Host Memory
Usage on VMS changed
from gray to yellow
The memory usage
rate of the virtual
machine server
becomes n % or more.
(Default value: 75%)
Memory
degeneration failure
Alarm Host Memory
Usage on VMS changed
from gray to red
The memory usage
rate of the virtual
machine server
becomes n % or more.
(Default value: 90%)
Classification
Event Category
Error
Description *1
Others
Alarm Host Memory
Usage on VMS changed
from green to gray
The memory usage
rate of the virtual
machine server
becomes unknown.
Others
Alarm Host Memory
Usage on VMS changed
from green to yellow
The memory usage
rate of the virtual
machine server
becomes n % or more.
(Default value: 75%)
Memory
degeneration failure
Alarm Host Memory
Usage on VMS changed
from green to red
The memory usage
rate of the virtual
machine server
becomes n % or more.
(Default value: 90%)
Others
Alarm Host Memory
Usage on VMS changed
from yellow to gray
The memory usage
rate of the virtual
machine server
becomes unknown.
Memory
degeneration failure
recovery
Alarm Host Memory
Usage on VMS changed
from yellow to green
The memory usage
rate of the virtual
machine server
becomes less than
n %.
(Default value: 75%)
Allocation rate of disk
on a Datastore
Memory
degeneration failure
Alarm Host Memory
Usage on VMS changed
from yellow to red
The memory usage
rate of the virtual
machine server
becomes n % or more.
(Default value: 90%)
Others
Alarm Host Memory
Usage on VMS changed
from red to gray
The memory usage
rate of the virtual
machine server
becomes unknown.
Memory
degeneration failure
recovery
Alarm Host Memory
Usage on VMS changed
from red to green
The memory usage
rate of the virtual
machine server
becomes less than
n %.
(Default value: 75%)
Others
Alarm Host Memory
Usage on VMS changed
from red to yellow
The memory usage
rate of the virtual
machine server is less
than n %.
(Default value: 90%)
Others
Alarm DataStore
Overallocation on disk
on DATASTORE
changed from gray to
green
The allocation rate of
the Datastore is less
than n %.
(Default value: 400)
Others
Alarm Datastore
Overallocation on disk
on DATASTORE
changed from gray to
yellow
The allocation rate of
the Datastore is less
than n %.
(Default value: 700)
Appendix A Network Ports and Protocols
Classification
Usage rate of disk on
a Datastore
Event Category
Error
Description *1
Others
Alarm Datastore
Overallocation on disk
on DATASTORE
changed from gray to
red
The allocation rate of
the Datastore
becomes n % or more.
(Default value: 700)
Others
Alarm Datastore
Overallocation on disk
on DATASTORE
changed from green to
gray
The allocation rate of
the Datastore
becomes unknown.
Others
Alarm Datastore
Overallocation on disk
on DATASTORE
changed from green to
yellow
The allocation rate of
the Datastore is less
than n %.
(Default value: 700)
Others
Alarm Datastore
Overallocation on disk
on DATASTORE
changed from green to
red
The allocation rate of
the Datastore
becomes n % or more.
(Default value: 700)
Others
Alarm Datastore
Overallocation on disk
on DATASTORE
changed from yellow to
gray
The allocation rate of
the Datastore
becomes unknown.
Others
Alarm Datastore
Overallocation on disk
on DATASTORE
changed from yellow to
green
The allocation rate of
the Datastore is less
than n %.
(Default value: 400)
Others
Alarm Datastore
Overallocation on disk
on DATASTORE
changed from yellow to
red
The allocation rate of
the Datastore
becomes n % or more.
(Default value: 700)
Others
Alarm Datastore
Overallocation on disk
on DATASTORE
changed from red to
gray.
The allocation rate of
the Datastore
becomes unknown.
Others
Alarm Datastore
Overallocation on disk
on DATASTORE
changed from red to
green
The allocation rate of
the Datastore is less
than n %.
(Default value: 400)
Others
Alarm Datastore
Overallocation on disk
on DATASTORE
changed from red to
yellow
The allocation rate of
the Datastore is less
than n %.
Alarm Datastore usage
on disk on
DATASTORE changed
from gray to green
The disk usage rate of
the Datastore is less
than n %.
(Default value: 75)
Others
(Default value: 700)
Classification
Event Category
Error
Description *1
Others
Alarm Datastore usage
on disk on
DATASTORE changed
from gray to yellow
The disk usage rate of
the Datastore is less
than n %.
(Default value: 85)
Others
Alarm Datastore usage
on disk on
DATASTORE changed
from gray to red
The disk usage rate of
the Datastore
becomes n % or more.
(Default value: 85)
Others
Alarm Datastore usage
on disk on
DATASTORE changed
from green to gray
The disk usage rate of
the Datastore
becomes unknown.
Others
Alarm Datastore usage
on disk on
DATASTORE changed
from green to yellow
The disk usage rate of
the Datastore is less
than n %.
Alarm Datastore usage
on disk on
DATASTORE changed
from green to red
The disk usage rate of
the Datastore
becomes n % or more.
Others
Alarm Datastore usage
on disk on
DATASTORE changed
from yellow to gray
The disk usage rate of
the Datastore
becomes unknown.
Others
Alarm Datastore usage
on disk on
DATASTORE changed
from yellow to green
The disk usage rate of
the Datastore is less
than n %.
(Default value: 75)
Others
Alarm Datastore usage
on disk on
DATASTORE changed
from yellow to red
The disk usage rate of
the Datastore
becomes n % or more.
(Default value: 85)
Others
Alarm Datastore usage
on disk on
DATASTORE changed
from red to gray
The disk usage rate of
the Datastore
becomes unknown.
Others
Alarm Datastore usage
on disk on
DATASTORE changed
from red to green
The disk usage rate of
the Datastore is less
than n %.
(Default value: 75)
Others
Alarm Datastore usage
on disk on
DATASTORE changed
from red to yellow
The disk usage rate of
the Datastore is less
than n %.
Hard disk failure
Storage path
connectivity on VMS is
lost
Cannot access to the
Datastore.
Hard disk failure
VMFS heartbeat on
VMS is timedout
VMFS volume
connectivity is
degraded.
Others
Storage path
redundancy on VMS is
lost
Storage redundancy is
lost.
Others
Status of the
connection to a
Datastore
(Default value: 85)
(Default value: 85)
(Default value: 85)
Appendix A Network Ports and Protocols
Classification
Status of the
connection to a
network
State of heart beat of
a virtual machine
Power status of a
virtual machine
Usage rate of CPU on
a virtual machine
Event Category
Error
Description *1
Others
Storage path
redundancy on VMS is
degraded
Storage redundancy is
degraded.
Others
Network connectivity on
VMS is lost
Cannot connect to the
network.
Others
Network redundancy on
VMS is lost
Network redundancy
is lost.
Others
Network redundancy on
VMS is degraded
Network redundancy
is degraded.
Machine
inaccessible error
recovery
Alarm Virtual Machine
Heartbeat on VM
changed from gray to
green
The heart beat value
of the virtual machine
becomes more than
the threshold value.
(Default value: 5)
Machine
inaccessible error
Alarm Virtual Machine
Heartbeat on VM
changed from gray to
red
The heart beat value
of the virtual machine
becomes less than the
threshold value.
(Default value:5)
Others
Alarm Virtual Machine
Heartbeat on VM
changed from green to
gray
The heart beat value
becomes unknown.
Machine
inaccessible error
Alarm Virtual Machine
Heartbeat on VM
changed from green to
red
The heart beat value
of the virtual machine
becomes less than the
threshold value.
(Default value: 5)
Others
Alarm Virtual Machine
Heartbeat on VM
changed from red to
gray
The heart beat value
becomes unknown.
Machine
inaccessible error
recovery
Alarm Virtual Machine
Heartbeat on VM
changed from red to
green
The heart beat value
of the virtual machine
becomes more than
the threshold value.
(Default value: 5)
Machine
inaccessible error
recovery
VM on VMS in DC is
powered on
The virtual machine is
powered ON.
Machine
inaccessible error
VM on VMS in DC is
powered off
The virtual machine is
powered OFF.
Others
VM on VMS in DC is
suspended
The virtual machine is
suspended.
CPU load failure
recovery
Alarm Virtual Machine
CPU Usage on VM
changed from gray to
green
The CPU usage rate
of the virtual machine
becomes less than
n %.
(Default value: 75%)
Others
Alarm Virtual Machine
CPU Usage on VM
changed from gray to
yellow
The CPU usage rate
of the virtual machine
becomes n % or more.
(Default value: 75%)
Classification
Event Category
Error
Description *1
CPU load failure
Alarm Virtual Machine
CPU Usage on VM
changed from gray to
red
The CPU usage rate
of the virtual machine
becomes n % or more.
(Default value: 90%)
Others
Alarm Virtual Machine
CPU Usage on VM
changed from green to
gray
The CPU usage rate
of the virtual machine
becomes unknown.
Others
Alarm Virtual Machine
CPU Usage on VM
changed from green to
yellow
The CPU usage rate
of the virtual machine
becomes n % or more.
(Default value: 75%)
CPU load failure
Alarm Virtual Machine
CPU Usage on VM
changed from green to
red
The CPU usage rate
of the virtual machine
becomes n % or more.
Others
Alarm Virtual Machine
CPU Usage on VM
changed from yellow to
gray
The CPU usage rate
of the virtual machine
becomes unknown.
CPU load failure
recovery
Alarm Virtual Machine
CPU Usage on VM
changed from yellow to
green
The CPU usage rate
of the virtual machine
becomes less than
n %.
(Default value: 75%)
CPU load failure
Alarm Virtual Machine
CPU Usage on VM
changed from yellow to
red
The CPU usage rate
of the virtual machine
becomes n % or more.
(Default value: 90%)
Others
Alarm Virtual Machine
CPU Usage on VM
changed from red to
gray
The CPU usage rate
of the virtual machine
becomes unknown.
CPU load failure
recovery
Alarm Virtual Machine
CPU Usage on VM
changed from red to
green
The CPU usage rate
of the virtual machine
becomes less than
n %.
(Default value: 90%)
(Default value: 75%)
Usage rate of memory
on a virtual machine
Others
Alarm Virtual Machine
CPU Usage on VM
changed from red to
yellow
The CPU usage rate
of the virtual machine
becomes less than
n %.
(Default value: 90%)
Memory
degeneration failure
recovery
Alarm Virtual Machine
Memory Usage on VM
changed from gray to
green
The CPU usage rate
of the virtual machine
becomes less than
n %.
(Default value: 75%)
Others
Alarm Virtual Machine
Memory Usage on VM
changed from gray to
yellow
The memory usage
rate of the virtual
machine becomes n %
or more.
(Default value: 75%)
Appendix A Network Ports and Protocols
Classification
Event Category
Error
Description *1
Memory
degeneration failure
Alarm Virtual Machine
Memory Usage on VM
changed from gray to
red
The memory usage
rate of the virtual
machine becomes n %
or more.
(Default value: 90%)
Others
Alarm Virtual Machine
Memory Usage on VM
changed from green to
gray
The memory usage
rate of the virtual
machine becomes
unknown.
Others
Alarm Virtual Machine
Memory Usage on VM
changed from green to
yellow
The memory usage
rate of the virtual
machine becomes n %
or more.
(Default value: 75%)
Memory
degeneration failure
Alarm Virtual Machine
Memory Usage on VM
changed from green to
red
The memory usage
rate of the virtual
machine becomes n %
or more.
(Default value: 90%)
Others
Alarm Virtual Machine
Memory Usage on VM
changed from yellow to
gray
The memory usage
rate of the virtual
machine becomes
unknown.
Memory
degeneration failure
recovery
Alarm Virtual Machine
Memory Usage on VM
changed from yellow to
green
The CPU usage rate
of the virtual machine
becomes less than
n %.
(Default value: 75%)
Memory
degeneration failure
Alarm Virtual Machine
Memory Usage on VM
changed from yellow to
red
The memory usage
rate of the virtual
machine becomes n %
or more.
(Default value: 90%)
Others
Alarm Virtual Machine
Memory Usage on VM
changed from red to
gray
The memory usage
rate of the virtual
machine becomes
unknown.
Memory
degeneration failure
recovery
Alarm Virtual Machine
Memory Usage on VM
changed from red to
green
The CPU usage rate
of the virtual machine
becomes less than
n %.
(Default value: 75%)
Others
*1
Note:
Alarm Virtual Machine
Memory Usage on VM
changed from red to
yellow
The CPU usage rate
of the virtual machine
becomes less than
n %.
(Default value: 90%)
You can change the CPU usage rate, the memory usage rate, the datastore usage
rate and the allocation rate of disk on a datastore in vCenter Server.
▪ The event of The heart beat value of the virtual machine is less than the threshold
value. can be detected when you start a virtual machine. In that case, enable the error
event controlling function.
For how to configure the function, see Section 4.10.5, "Configuring Policy Property
Settings" in SigmaSystemCenter Configuration Guide.
▪ The alarm definitions of virtual machines in Heartbeat status and events of the
allocation rate of disk on a datastore are disabled by default.
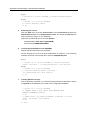
To enable the alarm definitions of virtual machines in Heartbeat status, create or
change the registry below and restart the PVMService.
Key:
HKEY_LOCAL_MACHINE\SOFTWARE\NEC\PVM\Provider\VM\VMware\Event
Value Name (Type): DisableHeartbeatEvent (REG_DWORD)
Value: 0
To enable events of the allocation rate of disk on a datastore, create or change the
registry below and restart the PVMService.
Key:
HKEY_LOCAL_MACHINE\SOFTWARE\NEC\PVM\Provider\VM\VMware\Event
Value Name (Type): DisableDatastore (REG_DWORD)
Value: 0
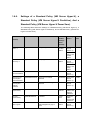
1.2.6.
Events the VMware (ESXi) Compatible Function Can
Detect
The events on virtual machines or virtual machine servers that can be detected by
working together with VMware (ESXi) are as follows.
You can check the following error events by specifying "StandaloneEsxProvider" in the
Report Source box on the Corresponding Event Handler Settings window.
Event Category
Error
Description
Hard disk failure
Alarm Datastore on VMS can not be
available
Cannot use Datastore from a
virtual machine server.
VMFS heartbeat on VMS is timedout
VMFS volume connectivity is
degraded.
Machine
inaccessible error
Alarm Host connection state on VMS
changed from green to red
Lost the response from the
virtual machine server.
Machine
inaccessible error
recovery
Alarm Host connection state on VMS
changed from red to green
The response from the virtual
machine server is revived.
Note:
Appendix A Network Ports and Protocols
▪ If you execute the restart operation of the PVMService and a virtual machine server,
the "Hard disk failure" event that has already notified might be notified again.
▪ There is a case where the "Hard disk failure" is notified if a network failure occurs
while SigmaSystemCenter is checking the datastore.
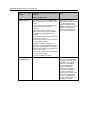
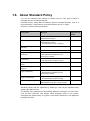
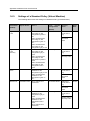
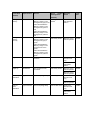
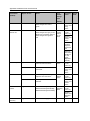
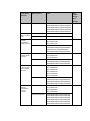
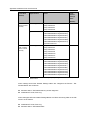
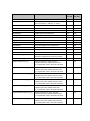
1.2.7.
Events the Optimized Placement Can Detect
The events that the Optimized Placement can detect are as follows.
You can check the following events by specifying "VM Optimized Placement
notification" in the Event Category box on the Corresponding Event Handler Settings
window.
Event Category
Event
Event Name
Description
VM Optimized
Placement notification
Scaleout
Recommendation
Scaleout
Recommendation
As a result of load
balancing, a virtual
machine that can be
moved is detected, but
there is not virtual
machine server in a
group that can be a
destination.
VM Optimized
Placement notification
Resource-Pool
Critical Asserted
Resource Pool
Consumption : Critical
Asserted
The value exceeded
its threshold (100% by
default) in
consumption/actually
consumption of
resource pool.
VM Optimized
Placement notification
Resource-Pool
Warning Asserted
Resource Pool
Consumption : Warning
Asserted
The value exceeded
its threshold (80% by
default) in
consumption/actually
consumption of
resource pool.
VM Optimized
Placement notification
Resource-Pool Info
Asserted
Resource Pool
Consumption : Info
Asserted
The value exceeded
its threshold (60% by
default) in
consumption/actually
consumption of
resource pool.
VM Optimized
Placement notification
Resource-Pool
Critical Deasserted
Resource Pool
Consumption : Critical
Deasserted
The value below its
threshold (100% by
default) in
consumption/actually
consumption of
resource pool.
VM Optimized
Placement notification
Resource-Pool
Warning Deasserted
Resource Pool
Consumption : Warning
Deasserted
The value below its
threshold (80% by
default) in
consumption/actually
consumption of
resource pool.
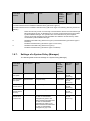
Event Category
Event
Event Name
Description
VM Optimized
Placement notification
Resource-Pool Info
Deasserted
Resource Pool
Consumption : Info
Deasserted
The value below its
threshold (60% by
default) in
consumption/actually
consumption of
resource pool.
Note: The "Scaleout Recommendation" and resource pool consumption notification
event reports resource deficiency of a group. Configure the recovery process against
the event for the group, not for each machine. Configuring the event to detect optimized
placement are unnecessary because the event is an internal event of
SystemProvisioning.
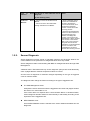
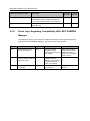
1.2.8.
Events the Out-of-Band Management Can Detect
The events that the Out-of-Band Management can detect are as follows.
You can check the following error events by specifying the category in the Event
Category and "OobManagement" in the Report Source.
Classification
Event Category
Event ID
Message
Description
Temperature
Prediction:chassi
s temperature
failure
[PET]
0x00010102
Temperature: Lower
Critical - going low
Fell below the lower critical
limit of the temperature.
[PET]
0x00010104
Temperature: Lower
Non-recoverable going low
Fell below the lower
non-recoverable limit of the
temperature.
[PET]
0x00010109
Temperature: Upper
Critical - going high
Exceeded the upper critical
limit of the temperature.
[PET]
0x0001010B
Temperature: Upper
Non-recoverable going high
Exceeded the upper
non-recoverable limit of the
temperature.
[PET]
0x80010102
Temperature: Lower
Critical - going high
Recovered from the lower
critical limit of the temperature.
[PET]
0x80010109
Temperature: Upper
Critical - going low
Recovered from the upper
critical limit of the temperature.
[PET]
0x00010100
Temperature: Lower
Non-critical - going
low
Fell below the lower warning
limit of the temperature.
[PET]
0x80010100
Temperature: Lower
Non-critical - going
high
Recovered from the lower
warning limit of the
temperature.
[PET]
0x80010104
Temperature: Lower
Non-recoverable going high
Recovered from the lower
non-recoverable limit of the
temperature.
[PET]
0x00010107
Temperature: Upper
Non-critical - going
high
Exceeded the upper warning
limit of the temperature.
Clear Alert:
chassis
temperature
failure recovery
Others
Appendix A Network Ports and Protocols
Classification
Voltage
Event Category
Prediction:
voltage failure
Clear Alert:
voltage failure
recovery
Others
Event ID
Message
Description
[PET]
0x80010107
Temperature: Upper
Non-critical - going
low
Recovered from the upper
warning limit of the
temperature.
[PET]
0x8001010B
Temperature: Upper
Non-recoverable going low
Recovered from the upper
non-recoverable limit of the
temperature.
[PET]
0x00010301
Temperature:
Monitoring event
occurred
An event of the temperature
occurred.
[PET]
0x80010301
Temperature:
Monitoring event
cleared
Recovered from an even of the
temperature.
[PET]
0x00010501
Temperature: Limit
Exceeded
The temperature exceeded the
limit.
[PET]
0x80010501
Temperature: Limit
Not Exceeded
The temperature did not
exceed the limit.
[PET]
0x00010700
Temperature:
Transition to OK
The temperature became
normal.
[PET]
0x80010700
Temperature:
Transition to
Abnormal
The temperature became
abnormal.
[PET]
0x00010701
Temperature:
Transition to
Non-Critical
The temperature became the
warning level.
[PET]
0x00010702
Temperature:
Transition to Critical
The temperature became the
critical level.
[PET]
0x00010703
Temperature:
Transition to
Non-recoverable
The temperature became the
non-recoverable level.
[PET]
0x00020102
Voltage: Lower
Critical - going low
Fell under the lower critical limit
of the voltage.
[PET]
0x00020104
Voltage: Lower
Non-recoverable going low
Fell under the lower
non-recoverable limit of the
voltage.
[PET]
0x00020109
Voltage: Upper
Critical - going high
Exceeded the upper critical
limit of the voltage.
[PET]
0x0002010B
Voltage: Upper
Non-recoverable going high
Exceeded the upper
non-recoverable limit of the
voltage.
[PET]
0x00020703
Voltage: Transition to
Non-recoverable
The voltage became the
non-recoverable level.
[PET]
0x80020102
Voltage: Lower
Critical - going high
Recovered from the lower
critical limit of the voltage.
[PET]
0x80020109
Voltage: Upper
Critical - going low
Recovered from the upper
critical limit of the voltage.
[PET]
0x00020700
Voltage: Transition to
OK
The voltage became normal.
[PET]
0x00020100
Voltage: Lower
Non-critical - going
low
Fell below the lower warning
limit of the voltage.
Classification
Current
FAN
Event Category
Others
Prediction:fan/co
oling device
failure
Event ID
Message
Description
[PET]
0x80020100
Voltage: Lower
Non-critical - going
high
Recovered from the lower
warning limit of the voltage.
[PET]
0x80020104
Voltage: Lower
Non-recoverable going high
Recovered from the lower
non-recoverable limit of the
voltage.
[PET]
0x00020107
Voltage: Upper
Non-critical - going
high
Exceeded the upper warning
limit of the voltage.
[PET]
0x80020107
Voltage: Upper
Non-critical - going
low
Recovered from the upper
warning limit of the voltage.
[PET]
0x8002010B
Voltage: Upper
Non-recoverable going low
Recovered from the upper
non-recoverable limit of the
voltage.
[PET]
0x00020301
Voltage: Monitoring
event occurred
An event of the voltage
occurred.
[PET]
0x80020301
Voltage: Monitoring
event cleared
Recovered from an event of
the voltage.
[PET]
0x00020501
Voltage: Limit
Exceeded
The voltage exceeded the limit.
[PET]
0x80020501
Voltage: Limit Not
Exceeded
The voltage did not exceed the
limit.
[PET]
0x00020601
Voltage: Performance
Lags
Detected the voltage warning.
[PET]
0x80020601
Voltage: Performance
Met
Recovered from the voltage
warning.
[PET]
0x80020700
Voltage: Transition to
Abnormal
The voltage became abnormal.
[PET]
0x00020701
Voltage: Transition to
Non-Critical
The voltage became the
warning level.
[PET]
0x00020702
Voltage: Transition to
Critical
The voltage became the critical
level.
[PET]
0x00030301
Current: Monitoring
event occurred
An event of voltage / electric
currents occurred.
[PET]
0x80030301
Current: Monitoring
event cleared
Recovered from an event of
voltage / electric currents.
[PET]
0x00030501
Current: Limit
Exceeded
Voltage / electric currents
exceeded the limit.
[PET]
0x80030501
Current: Limit Not
Exceeded
Voltage / electric currents did
not exceed the limit.
[PET]
0x00040102
Fan(Speed): Lower
Critical - going low
The number of revolution of
FAN fell below the lower critical
limit.
[PET]
0x00040104
Fan(Speed): Lower
Non-recoverable going low
The number of revolution of
FAN fell below the lower
non-recoverable limit.
[PET]
0x00040109
Fan(Speed): Upper
Critical - going high
The number of revolution of
FAN exceeded the upper
critical limit.
Appendix A Network Ports and Protocols
Classification
Event Category
Clear Alert:
fan/cooling
device failure
recovery
Others
Event ID
Message
Description
[PET]
0x0004010B
Fan(Speed): Upper
Non-recoverable going high
The number of revolution of
FAN exceeded the upper
non-recoverable limit.
[PET]
0x00040301
Fan(Speed):
Monitoring event
occurred
An event of FAN occurred.
[PET]
0x80040102
Fan(Speed): Lower
Critical - going high
The number of revolution of
FAN recovered from the lower
critical limit.
[PET]
0x80040109
Fan(Speed): Upper
Critical - going low
The number of revolution of
FAN recovered from the upper
critical limit.
[PET]
0x80040301
Fan(Speed):
Monitoring event
cleared
Recovered from an event of
FAN.
[PET]
0x00040100
Fan(Speed): Lower
Non-critical - going
low
The number of revolution of
FAN fell below the lower
warning limit.
[PET]
0x80040100
Fan(Speed): Lower
Non-critical - going
high
The number of revolution of
FAN recovered from the lower
warning limit.
[PET]
0x80040104
Fan(Speed): Lower
Non-recoverable going high
The number of revolution of
FAN recovered from the lower
non-recoverable limit.
[PET]
0x00040107
Fan(Speed): Upper
Non-critical - going
high
The number of revolution of
FAN exceeded the upper
warning limit.
[PET]
0x80040107
Fan(Speed): Upper
Non-critical - going
low
The number of revolution of
FAN recovered from the upper
warning limit.
[PET]
0x8004010B
Fan(Speed): Upper
Non-recoverable going low
The number of revolution of
FAN recovered from the upper
non-recoverable limit.
[PET]
0x00040401
Fan(Speed):
Predictive Failure
occurred
The FAN status exceeded the
limit.
[PET]
0x80040401
Fan(Speed):
Predictive Failure
cleared
The FAN status became did
not exceed the limit.
[PET]
0x00040601
Fan(Speed):
Performance Lags
Detected the FAN warning.
[PET]
0x80040601
Fan(Speed):
Performance Met
Recovered the FAN warning.
[PET]
0x00040700
Fan(Speed):
Transition to OK
The FAN became normal.
[PET]
0x80040700
Fan(Speed):
Transition to
Abnormal
FAN became abnormal.
[PET]
0x00040701
Fan(Speed):
Transition to
Non-Critical
The FAN became the warning
level.
Classification
Security
Event Category
Others
Event ID
Message
Description
[PET]
0x00040702
Fan(Speed):
Transition to Critical
The FAN became the critical
level.
[PET]
0x00040703
Fan(Speed):
Transition to
Non-recoverable
The FAN became
non-recoverable level.
[PET]
0x00040B00
Fan(Speed):
Redundancy Full
The FAN is redundant
configuration.
[PET]
0x00040B01
Fan(Speed):
Redundancy Lost
The FAN became not
redundant configuration.
[PET]
0x00040B02
Fan(Speed):
Redundancy
Degraded
The FAN is not redundant
configuration but available.
[PET]
0x00040B03
Fan(Speed):
Non-Redundant(Suffic
ient Resources)
The FAN is non-redundant
configuration.
[PET]
0x00040B05
Fan(Speed):
Non-Redundant(Insuff
icient Resources)
The FAN is non-redundant
configuration and unavailable.
[PET]
0x00050301
Physical
Security(Chassis
Intrusion): Monitoring
event occurred
The cover opened.
[PET]
0x80050301
Physical
Security(Chassis
Intrusion): Monitoring
event cleared
The cover closed.
[PET]
0x00056F00
Physical
Security(Chassis
Intrusion): General
Chassis Intrusion
occurred
The cover opened.
[PET]
0x80056F00
Physical
Security(Chassis
Intrusion): General
Chassis Intrusion
cleared
The cover closed.
[PET]
0x00056F01
Physical
Security(Chassis
Intrusion): Drive Bay
Intrusion occurred
The Drive Bay cover opened.
[PET]
0x80056F01
Physical
Security(Chassis
Intrusion): Drive Bay
Intrusion cleared
The Drive Bay cover closed.
[PET]
0x00056F02
Physical
Security(Chassis
Intrusion): I/O Card
area Intrusion
occurred
The cover of IO card area
opened.
[PET]
0x80056F02
Physical
Security(Chassis
Intrusion): I/O Card
area Intrusion cleared
The cover of IO card area
closed.
Appendix A Network Ports and Protocols
Classification
Security
Violation
Event Category
Others
Event ID
Message
Description
[PET]
0x00056F03
Physical
Security(Chassis
Intrusion): Processor
area Intrusion
occurred
The cover of CPU area
opened.
[PET]
0x80056F03
Physical
Security(Chassis
Intrusion): Processor
area Intrusion cleared
The cover of CPU area closed.
[PET]
0x00056F04
Physical
Security(Chassis
Intrusion): LAN Leash
Lost (System is
unplugged from LAN)
occurred
The LAN cable is
disconnected.
[PET]
0x80056F04
Physical
Security(Chassis
Intrusion): LAN Leash
Lost (System is
unplugged from LAN)
cleared
The LAN cable is connected.
[PET]
0x00056F05
Physical
Security(Chassis
Intrusion):
Unauthorized dock
occurred
Unauthorized dock occurred.
[PET]
0x80056F05
Physical
Security(Chassis
Intrusion):
Unauthorized dock
cleared
Unauthorized dock cleared.
[PET]
0x00056F06
Physical
Security(Chassis
Intrusion): FAN area
intrusion occurred
The FAN cover opened.
[PET]
0x80056F06
Physical
Security(Chassis
Intrusion): FAN area
intrusion cleared
The FAN cover closed.
[PET]
0x00066F00
Platform Security
Violation Attempt:
Secure Mode (Front
Panel Lockout)
Violation attempt
Front Panel Lockout
[PET]
0x00066F01
Platform Security
Violation Attempt:
Pre-boot Password
Violation - user
password
Entered an incorrect user
password.
[PET]
0x00066F02
Platform Security
Violation Attempt:
Pre-boot Password
Violation - setup
password
Entered an incorrect setup
password.
Classification
CPU
Event Category
Event ID
Message
Description
[PET]
0x00066F03
Platform Security
Violation Attempt:
Pre-boot Password
Violation - network
boot password
Entered an incorrect network
boot password.
[PET]
0x00066F04
Platform Security
Violation Attempt:
Other pre-boot
Password Violation
Entered an incorrect password.
[PET]
0x00066F05
Platform Security
Violation Attempt:
Out-of-band Access
Password Violation
OOB access password
violation.
[PET]
0x00070702
Processor: Transition
to Critical
CPU became critical.
[PET]
0x00070703
Processor: Transition
to Non-recoverable
CPU became non-recoverable.
[PET]
0x00076F00
Processor: IERR
occurred
A CPU internal error occurred.
[PET]
0x00076F02
Processor:
FRB1/BIST failure
occurred
A CPU error occurred.
[PET]
0x00076F04
Processor:
FRB3/Processor
Startup/Initialization
failure (CPU didn't
start) occurred
An initialization error occurred.
[PET]
0x00076F08
Processor: Processor
disabled
CPU was disabled.
CPU
temperature
failure
[PET]
0x00076F01
Processor: Thermal
Trip occurred
CPU thermal trip occurred.
CPU
temperature
failure recovery
[PET]
0x80076F01
Processor: Thermal
Trip cleared
CPU thermal trip ended.
Others
[PET]
0x00070700
Processor: Transition
to OK
CPU became normal.
[PET]
0x80070700
Processor: Transition
to Abnormal
CPU became abnormal.
[PET]
0x00070701
Processor: Transition
to Non-Critical
CPU became non-critical.
[PET]
0x80076F00
Processor: IERR
cleared
Recovered from the CPU
internal error.
[PET]
0x80076F02
Processor:
FRB1/BIST failure
cleared
Recovered from the CPU error.
[PET]
0x00076F03
Processor:
FRB2/Hang in POST
failure occurred
Hang in POST failure occurred.
[PET]
0x80076F03
Processor:
FRB2/Hang in POST
failure cleared
Recovered from the Hang in
POST failure.
CPU failure
Appendix A Network Ports and Protocols
Classification
Power Supply
Event Category
Others
Event ID
Message
Description
[PET]
0x80076F04
Processor:
FRB3/Processor
Startup/Initialization
failure (CPU didn't
start) cleared
Recovered from the
initialization error.
[PET]
0x00076F05
Processor:
Configuration Error
occurred
A CPU configuration error
occurred.
[PET]
0x80076F05
Processor:
Configuration Error
cleared
Recovered from the CPU
configuration error.
[PET]
0x00076F06
Processor: SM BIOS
'Uncorrectable
CPU-complex Error'
occurred
A System error occurred on the
system bus.
[PET]
0x80076F06
Processor: SM BIOS
'Uncorrectable
CPU-complex Error'
cleared
Recovered from the system
error on the system bus.
[PET]
0x00076F07
Processor: Processor
Presence detected
CPU is implemented.
[PET]
0x80076F07
Processor: Processor
Removed
CPU is removed.
[PET]
0x80076F08
Processor: Processor
Enabled
CPU is enabled.
[PET]
0x00076F09
Processor: Terminator
Presence Detected
The terminator is implemented.
[PET]
0x80076F09
Processor: Terminator
Removed
The terminator is removed.
[PET]
0x00076F0A
Processor: Processor
Automatically
Throttled
A CPU automatically throttle
occurred.
[PET]
0x80076F0A
Processor: Processor
Recovered from
Automatically
Throttled
Recovered from a CPU
automatically throttle.
[PET]
0x00080301
Power Supply:
Monitoring event
occurred
An even t of the power supply
device occurred.
[PET]
0x80080301
Power Supply:
Monitoring event
cleared
Recovered from a power
supply device event.
[PET]
0x00080700
Power Supply:
Transition to OK
The power supply device
became normal.
[PET]
0x80080700
Power Supply:
Transition to
Abnormal
The power supply device
became abnormal.
[PET]
0x00080701
Power Supply:
Transition to
Non-Critical
The power supply device
became warning status.
[PET]
0x00080702
Power Supply:
Transition to Critical
The power supply device
became critical.
Classification
Power Unit
Event Category
Event ID
Message
Description
[PET]
0x00080703
Power Supply:
Transition to
Non-recoverable
The power supply device
became non-recoverable.
[PET]
0x00080B00
Power Supply:
Redundancy Full
The power supply device is
redundant configuration.
[PET]
0x00080B01
Power Supply:
Redundancy Lost
The power supply device
became not redundant
configuration.
[PET]
0x00080B02
Power Supply:
Redundancy
Degraded
The power supply device is
non-redundant configuration
but available.
[PET]
0x00080B03
Power Supply:
Non-Redundant(Suffic
ient Resources)
The power supply device is
non-redundant configuration.
[PET]
0x00080B05
Power Supply:
Non-Redundant(Insuff
icient Resources)
The FAN is non-redundant
configuration and unavailable.
[PET]
0x00086F00
Power Supply:
Presence detected
The power supply device was
detected.
[PET]
0x80086F00
Power Supply:
Removed
The power supply device was
removed.
[PET]
0x00086F01
Power Supply: Power
Supply Failure
detected
The power supply device’s
failure was detected.
[PET]
0x80086F01
Power Supply: Power
Supply Recovered
The power supply device
recovered.
[PET]
0x00086F02
Power Supply:
Predictive Failure
detected
Predictive failure was detected
on the power supply device.
[PET]
0x00086F03
Power Supply: Power
Supply input lost
(AC/DC)
Power supply input from the
power supply device is lost.
[PET]
0x00086F04
Power Supply: Power
Supply input lost or
out-of-range
Power supply input from the
power supply device is lost or
out-of-range.
[PET]
0x00086F05
Power Supply: Power
Supply input
out-of-range, but
present
Power supply input from the
power supply device is
out-of-range.
[PET]
0x00086F06
Power Supply:
Configuration error
occurred
Configuration error of the
power supply device occurred.
Prediction:power
unit failure
[PET]
0x00090B05
Power Unit:
Non-Redundant(Insuff
icient Resources)
The power unit is
non-redundant configuration
and unavailable.
Others
[PET]
0x00090901
Power Unit: Device
Enabled
The power unit is enabled.
[PET]
0x80090901
Power Unit: Device
Disabled
The power unit is disabled.
[PET]
0x00090B00
Power Unit:
Redundancy Full
The power unit is redundant.
Appendix A Network Ports and Protocols
Classification
Cooling Device
Event Category
Prediction:fan/co
oling device
failure
Event ID
Message
Description
[PET]
0x00090B01
Power Unit:
Redundancy Lost
The power unit became
non-redundant.
[PET]
0x00090B02
Power Unit:
Redundancy
Degraded
The power unit became
non-redundant but available.
[PET]
0x00090B03
Power Unit:
Non-Redundant(Suffic
ient Resources)
The power unit is
non-redundant configuration.
[PET]
0x00090C00
Power Unit: D0 Power
State
Device Power State is D0.
[PET]
0x00090C01
Power Unit: D1 Power
State
Device Power State is D1.
[PET]
0x00090C02
Power Unit: D2 Power
State
Device Power State is D2.
[PET]
0x00090C03
Power Unit: D3 Power
State
Device Power State is D3.
[PET]
0x00096F00
Power Unit: Power Off
/ Power Down
The power unit is powered
OFF.
[PET]
0x80096F00
Power Unit: Power
ON
The power unit is powered ON.
[PET]
0x00096F01
Power Unit: Power
Cycle
Power Cycle was executed.
[PET]
0x00096F02
Power Unit: 240VA
Power Down
240VA is Power Down.
[PET]
0x00096F03
Power Unit: Interlock
Power Down
The side cover was opened
and Power Down was
executed.
[PET]
0x00096F04
Power Unit: AC lost
AC is lost.
[PET]
0x00096F05
Power Unit: Soft
Power Control Failure
(unit did not respond
to request to turn on)
Power Control by software
failed.
[PET]
0x80096F05
Power Unit: Soft
Power Control Failure
cleared
Power Control by software
recovered.
[PET]
0x00096F06
Power Unit: Power
Unit Failure detected
Power unit failure occurred.
[PET]
0x80096F06
Power Unit: Power
Unit Failure cleared
Recovered from the power unit
failure.
[PET]
0x00096F07
Power Unit: Predictive
Failure detected
Detected the predictive failure
of the power unit.
[PET]
0x80096F07
Power Unit: Predictive
Failure cleared
Cleared the predictive failure of
the power unit.
[PET]
0x000A0102
Cooling Device:
Lower Critical - going
low
Fell below the lower critical
limit of the cooling device.
[PET]
0x000A0104
Cooling Device:
Lower
Non-recoverable going low
Fell below the lower
non-recoverable limit of the
cooling device.
Classification
Event Category
Clear Alert:
fan/cooling
device failure
recovery
Others
Event ID
Message
Description
[PET]
0x000A0109
Cooling Device:
Upper Critical - going
high
Exceeded the upper critical
limit of the cooling device.
[PET]
0x000A010B
Cooling Device:
Upper
Non-recoverable going high
Exceeded the upper
non-recoverable limit of the
cooling device.
[PET]
0x000A0702
Cooling Device:
Transition to Critical
The cooling device became the
critical level. The liquid might
spill.
[PET]
0x800A0102
Cooling Device:
Lower Critical - going
high
Recovered from the lower
critical limit of the cooling
device.
[PET]
0x800A0109
Cooling Device:
Upper Critical - going
low
Fell below the upper critical
limit of the cooling device.
[PET]
0x000A0700
Cooling Device:
Transition to OK
The cooling device became
normal.
[PET]
0x000A0100
Cooling Device:
Lower Non-critical going low
Fell below the lower warning
limit of the cooling device.
[PET]
0x800A0100
Cooling Device:
Lower Non-critical going high
Recovered from the lower
warning limit of the cooling
device.
[PET]
0x800A0104
Cooling Device:
Lower
Non-recoverable going high
Recovered from the lower
non-recoverable limit of the
cooling device.
[PET]
0x000A0107
Cooling Device:
Upper Non-critical going high
Exceeded the upper warning
limit of the cooling device.
[PET]
0x800A0107
Cooling Device:
Upper Non-critical going low
Recovered from the upper
warning limit of the cooling
device.
[PET]
0x800A010B
Cooling Device:
Upper
Non-recoverable going low
Recovered from the upper
non-recoverable limit of the
cooling device.
[PET]
0x800A0700
Cooling Device:
Transition to
Abnormal
The cooling device became
abnormal.
[PET]
0x000A0701
Cooling Device:
Transition to
Non-Critical
The cooling device became the
warning level.
[PET]
0x000A0703
Cooling Device:
Transition to
Non-recoverable
The cooling device became the
non-recoverable level.
The liquid might spill.
[PET]
0x000A0B00
Cooling Device:
Redundancy Full
The cooling device is
redundant configuration.
[PET]
0x000A0B01
Cooling Device:
Redundancy Lost
The cooling device became not
redundant configuration.
Appendix A Network Ports and Protocols
Classification
Memory
Event Category
Event ID
Message
Description
[PET]
0x000A0B02
Cooling Device:
Redundancy
Degraded
The cooling device is not
redundant but available.
[PET]
0x000A0B03
Cooling Device:
Non-Redundant(Suffic
ient Resources)
The cooling device is
non-redundant configuration.
[PET]
0x000A0B05
Cooling Device:
Non-Redundant(Insuff
icient Resources)
The cooling device is
non-redundant configuration
and unavailable.
[PET]
0x000C6F01
Memory:
Uncorrectable ECC
occurred
Uncorrectable ECC error
occurred.
[PET]
0x000C6F02
Memory: Memory
Parity Error occurred.
Memory Parity Error occurred.
[PET]
0x000C0702
Memory: Transition to
Critical
The memory became critical.
[PET]
0x000C0703
Memory: Transition to
Non-recoverable
Memory became
non-recoverable.
Memory failure
recovery
[PET]
0x800C6F01
Memory:
Uncorrectable ECC
cleared
Recovered from Uncorrectable
ECC error.
Others
[PET]
0x000C0700
Memory: Transition to
OK
The memory became normal.
[PET]
0x800C0700
Memory: Transition to
Abnormal
The memory became
abnormal.
[PET]
0x000C0701
Memory: Transition to
Non-Critical
The memory became the
warning status.
[PET]
0x000C0B00
Memory: Redundancy
Full
The memory is redundant
configuration.
[PET]
0x000C0B01
Memory: Redundancy
Lost
The memory became not
redundant configuration.
[PET]
0x000C0B02
Memory: Redundancy
Degraded
The memory is not redundant
but available.
[PET]
0x000C0B03
Memory:
Non-Redundant(Suffic
ient Resources)
The memory is non-redundant
configuration.
[PET]
0x000C0B05
Memory:
Non-Redundant(Insuff
icient Resources)
The memory is non-redundant
configuration and unavailable.
[PET]
0x000C6F00
Memory: Correctable
ECC occurred
1bit error occurred.
[PET]
0x800C6F00
Memory: Correctable
ECC cleared
Recovered from 1bit error.
[PET]
0x800C6F02
Memory: Memory
Parity Error cleared
Recovered from Memory Parity
Error.
[PET]
0x000C6F03
Memory: Memory
Scrub Failed (stuck
bit)
Memory Scrub failed.
[PET]
0x800C6F03
Memory: Memory
Scrub Error cleared
(stuck bit)
Recovered from Memory Scrub
error.
Memory failure
Classification
Slot
Event Category
Others
Event ID
Message
Description
[PET]
0x000C6F04
Memory: Memory
Device Disabled
The memory is disabled.
[PET]
0x800C6F04
Memory: Memory
Device Enabled
The memory is enabled.
[PET]
0x000C6F05
Memory: Correctable
ECC / other
correctable memory
error logging limit
reached
1bit error occurs frequently.
[PET]
0x800C6F05
Memory: Correctable
ECC have receded.
1bit error was receded.
[PET]
0x000C6F06
Memory: Presence
detected
The memory is implemented.
[PET]
0x800C6F06
Memory: Removed
The memory is removed.
[PET]
0x000C6F07
Memory:
Configuration error
Memory configuration error
occurred.
[PET]
0x800C6F07
Memory:
Configuration Error
cleared
Recovered from memory
configuration error.
[PET]
0x000C6F08
Memory: Spare entity
A spare of the memory.
[PET]
0x800C6F08
Memory: Not spare
entity
Primary memory.
[PET]
0x000C6F09
Memory: Memory
Automatically
Throttled.
The memory automatically
throttle occurred.
[PET]
0x800C6F09
Memory: Memory
recovered from
Automatically
Throttled.
Recovered from the memory
automatically throttle.
[PET]
0x000C6F0A
Memory: Critical
Overtemperature.
Over temperature of the
memory occurred.
[PET]
0x800C6F0A
Memory: Memory
Temperature Error
Recovered
Recovered from the over
temperature of the memory.
[PET]
0x000D0801
Drive Slot(Bay):
Device
Inserted/Device
Present
Devices are implemented on
the slot.
[PET]
0x800D0801
Drive Slot(Bay):
Device
Removed/Device
Absent
Devices are removed from the
slot.
[PET]
0x000D6F00
Drive Slot(Bay):
Device Presence
Devices are implemented on
the slot.
[PET]
0x800D6F00
Drive Slot(Bay):
Removed
Devices are removed from the
slot.
[PET]
0x000D6F01
Drive Slot(Bay): Drive
Fault
The failure of the drive device
of the slot occurred.
Appendix A Network Ports and Protocols
Classification
POST Memory
POST Error
Event logging
System Event
Critical
Interrupt
Event Category
Event ID
Message
Description
[PET]
0x800D6F01
Drive Slot(Bay): Drive
Recovered
Recovered from the failure of
the drive device of the slot.
Memory
degeneration
failure
[PET]
0x000E0301
POST Memory
Resize: Monitoring
event occurred
Memory resize occurred.
Memory failure
recovery
[PET]
0x800E0301
POST Memory
Resize: Monitoring
event cleared
Recovered from the memory
resize.
Others
[PET]
0x000F0301
POST Error:
Monitoring event
occurred
POST error occurred.
[PET]
0x800F0301
POST Error:
Monitoring event
cleared
Recovered from the POST
error.
[PET]
0x000F6F00
POST Error: System
Firmware Error.
Firmware error occurred.
[PET]
0x00106F00
Event Logging:
Correctable Memory
Error Logging
Disabled
1bit error records are invalid.
[PET]
0x00106F01
Event Logging:
Specific Event
Logging Disabled
Specified events records are
invalid.
[PET]
0x00106F02
Event Logging: Log
Area Reset / Cleared
All event logs were deleted.
[PET]
0x00106F03
Event Logging: All
Event Logging
Disabled
All events records are invalid.
[PET]
0x00106F04
Event Logging: SEL
Full
SEL space is full.
Delete SEL.
[PET]
0x00106F05
Event Logging: SEL
Almost Full
SEL space is almost full.
Delete SEL.
[PET]
0x00126F00
System Event:
System Reconfigured
The system was reconfigured.
[PET]
0x00126F01
System Event: OEM
System Boot Event
OEM System Boot Event
occurred.
[PET]
0x00126F02
System Event:
Undetermined system
hardware failure
Undetermined system
hardware failure occurred.
[PET]
0x00136F00
Critical Interrupt: Front
Panel NMI (Dump
Switch)
The Dump Switch was pushed.
[PET]
0x00136F01
Critical Interrupt: Bus
Timeout(EISA/ISA
Bus)
Bus Timeout occurred.
[PET]
0x00136F02
Critical Interrupt: I/O
channel check NMI
I/O channel check by NMI
occurred.
[PET]
0x00136F03
Critical Interrupt:
Software NMI
Software NMI occurred.
[PET]
0x00136F04
Critical Interrupt: PCI
PERR
PCI PERR occurred.
Others
Others
Others
Classification
Button/Switch
Module/Board
Chassis
Event Category
Others
Others
Others
Event ID
Message
Description
[PET]
0x00136F05
Critical Interrupt: PCI
SERR
PCI SERR occurred.
[PET]
0x00136F06
Critical Interrupt: EISA
Fail Safe Timeout
EISA Fail Safe Timeout
occurred.
[PET]
0x00136F07
Critical Interrupt: Bus
Correctable Error
Bus Correctable Error
occurred.
[PET]
0x00136F08
Critical Interrupt: Bus
Uncorrectable Error
Bus Uncorrectable Error
occurred.
[PET]
0x00136F09
Critical Interrupt: Fatal
NMI (port61h bit7)
Fatal NMI occurred.
[PET]
0x00136F0A
Critical Interrupt: Bus
Fatal error
Bus Fatal error occurred.
[PET]
0x00140801
Button/Switch: Device
Inserted/Device
Present
The button is implemented.
[PET]
0x80140801
Button/Switch: Device
Removed/Device
Absent
The button was removed.
[PET]
0x00146F00
Button/Switch: Power
Button pressed
The power button was pressed.
[PET]
0x00146F01
Button/Switch: Sleep
Button pressed
The sleep button was pressed.
[PET]
0x00146F02
Button/Switch: Reset
Button pressed
The reset button was pressed.
[PET]
0x00150301
Module/Board:
Monitoring event
occurred
The module failure occurred.
[PET]
0x80150301
Module/Board:
Monitoring event
cleared
Recovered from the module
failure.
[PET]
0x00150700
Module/Board:
Transition to OK
The module became normal.
[PET]
0x80150700
Module/Board:
Transition to
Abnormal
The module became abnormal.
[PET]
0x00150701
Module/Board:
Transition to
Non-Critical
The module became the
warning status.
[PET]
0x00150702
Module/Board:
Transition to Critical
The module became critical.
[PET]
0x00150703
Module/Board:
Transition to
Non-recoverable
The module became
non-recoverable.
[PET]
0x00150801
Module/Board: Device
Inserted/Device
Present
The module is implemented.
[PET]
0x80150801
Module/Board: Device
Removed/Device
Absent
The module was removed.
[PET]
0x00180700
Chassis: Transition to
OK
The chassis became normal.
Appendix A Network Ports and Protocols
Classification
Chip set
Cable
Event Category
Others
Others
Event ID
Message
Description
[PET]
0x80180700
Chassis: Transition to
Abnormal
The chassis became abnormal.
[PET]
0x00180701
Chassis: Transition to
Non-Critical
The chassis became the
warning status.
[PET]
0x00180702
Chassis: Transition to
Critical
The chassis became critical.
[PET]
0x00180703
Chassis: Transition to
Non-recoverable
The chassis became
non-recoverable.
[PET]
0x00190700
Chip Set: Transition to
OK
The chip set became normal.
[PET]
0x80190700
Chip Set: Transition to
Abnormal
The chip set became
abnormal.
[PET]
0x00190701
Chip Set: Transition to
Non-Critical
The chip set became the
warning status.
[PET]
0x00190702
Chip Set: Transition to
Critical
The chip set became critical.
[PET]
0x00190703
Chip Set: Transition to
Non-recoverable
The chip set became
non-recoverable.
[PET]
0x001B0700
Cable/Interconnect:
Transition to OK
The cable became normal.
[PET]
0x801B0700
Cable/Interconnect:
Transition to
Abnormal
The cable became abnormal.
[PET]
0x001B0701
Cable/Interconnect:
Transition to
Non-Critical
The cable became the warning
status.
[PET]
0x001B0702
Cable/Interconnect:
Transition to Critical
The cable became critical.
[PET]
0x001B0703
Cable/Interconnect:
Transition to
Non-recoverable
The cable became
non-recoverable.
[PET]
0x001B0801
Cable/Interconnect:
Device
Inserted/Device
Present
The cable is implemented.
[PET]
0x801B0801
Cable/Interconnect:
Device
Removed/Device
Absent
The cable was removed.
[PET]
0x001B6F00
Cable/Interconnect:
Cable/Interconnect is
connected
The cable is connected.
[PET]
0x801B6F00
Cable/Interconnect:
Cable/Interconnect is
disconnected
The cable is disconnected.
[PET]
0x001B6F01
Cable/Interconnect:
Configuration Error Incorrect cable
connected / Incorrect
interconnection
Configuration error occurred.
Incorrect cable is connected.
Classification
OS
Slot/Connector
ACPI Power
State
Watchdog
Timer
Event Category
Others
Others
Others
Others
Event ID
Message
Description
[PET]
0x801B6F01
Cable/Interconnect:
Configuration Error
cleared
Recovered from the
Configuration error.
[PET]
0x00206F00
OS Stop/Shutdown:
Critical stop during OS
load / Initialization
Stopped during OS
initialization.
[PET]
0x00206F01
OS Stop/Shutdown:
Run-time Critical Stop
Stopped while OS is running.
[PET]
0x00216F00
Slot/Connector: Fault
Status asserted
The slot became abnormal.
[PET]
0x80216F00
Slot/Connector: Fault
Status negated
Recovered from slot failure.
[PET]
0x00216F02
Slot/Connector:
Slot/Connector Device
Installed
The slot is implemented.
[PET]
0x80216F02
Slot/Connector:
Slot/Connector Device
Removed
The slot was removed.
[PET]
0x00216F05
Slot/Connector: Slot
Power is OFF
The slot is powered OFF.
[PET]
0x80216F05
Slot/Connector: Slot
Power is ON
The slot is powered ON.
[PET]
0x00216F07
Slot/Connector:
Interlock asserted
Interlock occurred.
[PET]
0x80216F07
Slot/Connector:
Interlock negated
Recovered from Interlock.
[PET]
0x00216F08
Slot/Connector: Slot is
Disabled
The slot is disabled.
[PET]
0x80216F08
Slot/Connector: Slot is
Enabled
The slot is enabled.
[PET]
0x00226F00
System ACPI Power
State: S0/G0 Working
System ACPI Power State:
S0/G0 Working
System ACPI Power State:
S5/G2 Soft off
[PET]
0x00226F05
System ACPI Power
State: S5/G2 Soft off
System ACPI Power State:
S5/G2 Soft off
[PET]
0x00226F07
System ACPI Power
State: G3 Mechanical
Off
System ACPI Power State: G3
Mechanical Off
[PET]
0x00226F09
System ACPI Power
State: G1 Sleeping
System ACPI Power State: G1
Sleeping
[PET]
0x00236F00
Watchdog Timer:
Timer expired, status
only (no action, no
interrupt)
Watchdog Timer was not
updated within a time frame.
(No Action is configured.)
[PET]
0x80236F00
Watchdog Timer:
Recover from Timer
expired only
Recovered from time-out.
[PET]
0x00236F01
Watchdog Timer:
Hard Reset
Executed Hard reset by
Watchdog Timer.
Appendix A Network Ports and Protocols
Classification
Device
ASIC/IC
LAN
Event Category
Others
Others
Others
Event ID
Message
Description
[PET]
0x80236F01
Watchdog Timer:
Recover from Hard
Reset
Recovered from Hard reset by
Watchdog Timer.
[PET]
0x00236F02
Watchdog Timer:
Power Down
Executed Power OFF by
Watchdog Timer.
[PET]
0x80236F02
Watchdog Timer:
Recover from Power
Down
Recovered from Power OFF by
Watchdog Timer.
[PET]
0x00236F03
Watchdog Timer:
Power Cycle
Executed Power Cycle by
Watchdog Timer.
[PET]
0x80236F03
Watchdog Timer:
Recover from Power
Cycle
Recovered from Power Cycle
by Watchdog Timer.
[PET]
0x00236F08
Watchdog Timer:
Timer interrupt
Timer interrupt occurred.
[PET]
0x00256F00
Entity Presence
Information: Entity
Present
The device is implemented.
[PET]
0x00256F01
Entity Presence
Information: Entity
Absent
The device is empty.
[PET]
0x00256F02
Entity Presence
Information: Entity
Disabled
The device is disabled.
[PET]
0x80256F02
Entity Presence
Information: Entity
Enabled
The device is enabled.
[PET]
0x00260301
Monitor ASIC/IC:
Monitoring event
occurred
An event occurred on ASIC/IC.
[PET]
0x80260301
Monitor ASIC/IC:
Monitoring event
cleared
Recovered from an event on
ASIC/IC.
[PET]
0x00270301
LAN: Monitoring event
occurred
An event occurred on LAN.
[PET]
0x80270301
LAN: Monitoring event
cleared
Recovered from a LAN event.
Management
Subsystem
Others
[PET]
0x00286F03
Management
Subsystem Health:
Management
Controller unavailable
BMC is unavailable.
Battery
Others
[PET]
0x00296F00
Battery: Battery Low
Voltage of the battery
decreases.
[PET]
0x80296F00
Battery: Recover from
Battery Low
Voltage recovered.
[PET]
0x00296F01
Battery: Battery Failed
The battery failed.
[PET]
0x80296F01
Battery: Recover from
Battery Failed
Recovered from the battery
failure.
[PET]
0x00296F02
Battery: Battery
detected
Detected a battery.
Classification
Event Category
Event ID
Message
Description
[PET]
0x80296F02
Battery: No Battery
Battery not found.
Appendix A Network Ports and Protocols
Note: SigmaSystemCenter handles PET as an OOB Management event. PET is a type
of SNMP Trap.
Even if SigmaSystemCenter receives an OOB Management event corresponding to
SNMP Trap, SigmaSystemCenter does not display the event on the Web Console in
some cases because such events are filtered by SigmaSystemCenter internally.
The following table shows the conditions for discarding SNMP Trap.
1.2.9.
#
Case of discarding SNMP Trap
1
SigmaSystemCenter discards SNMP Trap except PET.
SNMP Trap has a value called "Enterprise".
The "Enterprise" of PET is "1.3.6.1.4.1.3183.1.1".
2
SigmaSystemCenter discards PET retransmitted.
It happens that the BMC retransmit PET to SigmaSystemCenter.
In this case, SigmaSystemCenter checks the value of PET called "Sequence
Number".
If the sequence number of PET is equal to the previous, SigmaSystemCenter
discards the latter.
4
SigmaSystemCenter discards PET from a machine managed by ESMPRO.
5
SigmaSystemCenter discards PET from the sensor which SigmaSystemCenter has
no information of.
6
SigmaSystemCenter discards PET from the machine whose account information is
not set.
7
SigmaSystemCenter discards PET which seems to mean the same event as the
previous one.
8
SigmaSystemCenter discards PET which doesn't exist on the list above.
Events the Hyper-V Cluster Function Can Detect
The events that the Hyper-V Cluster function can detect from Microsoft Failover Cluster
are as follows.
You can check the following error events by specifying the category in the Event
Category and "HyperVProvider" in the Report Source.
Event Category
Event ID
Message
Description
Cluster: Node
down
Node[Down]
Hyper-V Cluster
Node Down
A cluster node is
down.
Cluster[NotRunning]
Hyper-V Cluster Not
Running
Connection to the
cluster is lost.
Node[Up] *4
Hyper-V Cluster
Node Up
A cluster node is
up.
Cluster[Running]
Hyper-V Cluster
Running
Connection to the
cluster is
re-established.
Cluster: Node up
Event Category
Event ID
Message
Description
Machine
inaccessible error
Resources(VM)[Failed]
Hyper-V Cluster VM
Unavailable
A virtual machine is
unavailable to the
cluster.
Resources(VM)[Offline] *1
Hyper-V Cluster VM
Resource Offline
A virtual machine
resource is offline.
Machine
inaccessible error
recovery
Resources(VM)[Online]
Hyper-V Cluster VM
Resource Online
A virtual machine
resource is online.
Hard disk
recovery failure
CSV[Scarce] *2
Hyper-V Cluster
CSV free space has
dropped below the
minimum threshold.
Free space of a
CSV disk has
dropped below the
minimum
threshold.
CSV[Critical] *3
Hyper-V Cluster
CSV free space has
dropped below the
critical threshold.
VMs are in
Paused-Critical
state.
VMs are in
Paused-Critical
state because free
space of a CSV
disk has dropped
below the critical
threshold.
CSV[Maintenance]
Hyper-V Cluster
CSV Maintenance
Status
CSV status is
Maintenance
CSV[NoAccess]
Hyper-V Cluster
CSV No Access
Status
CSV status is
NoAccess
CSV[NoDirectIO]
Hyper-V Cluster
CSV No Direct IO
Status
CSV status is
NoDirectIO
Resources(PhysicalDisk)[Failed]
Hyper-V Cluster
Physical Disk
Resource Failed
Disk resource
failed.
Resources(PhysicalDisk)[Offline]
Hyper-V Cluster
Physical Disk
Resource Offline
Disk resource is
offline.
CSV[Abundant] *2
Hyper-V Cluster
CSV free space has
increased above the
minimum threshold.
Free space of a
CSV disk has
increased above
the minimum
threshold.
CSV[NonCritical] *3
Hyper-V Cluster
CSV free space has
increased above the
critical threshold.
Free space of a
CSV disk has
increased above
the critical
threshold.
CSV[NoFaults]
Hyper-V Cluster No
Faults Status
CSV status is
NoFaults
Resources(PhysicalDisk)[Online]
Hyper-V Cluster
Physical Disk
Resource Online
Disk resource is
online.
Network[Down]
Hyper-V Cluster
Network Down
A network is down.
Network[Partitioned]
Hyper-V Cluster
Network Partitioned
A network is
partitioned.
Recovery from
the hard disk
recovery failure
Cluster: Network
failure
Appendix A Network Ports and Protocols
Event Category
Cluster: Network
recovery
Event ID
Message
Description
Network[Unavailable]
Hyper-V Cluster
Network
Unavailable
A network is
unavailable.
NetworkInterface[Failed]
Hyper-V Cluster
Network Interface
Failed
A network interface
failed.
NetworkInterface[Unavailable]
Hyper-V Cluster
Network Interface
Unavailable
A network interface
is unavailable.
NetworkInterface[Unreachable]
Hyper-V Cluster
Network Interface
Unreachable
A network interface
is unreachable.
Network[Up]
Hyper-V Cluster
Network Up
A network is up.
NetworkInterface[Up]
Hyper-V Cluster
Network Interface
Up
A network interface
is up.
*1
Disabled by default. To enable this event, modify the registry:
Key: HKEY_LOCAL_MACHINE\SOFTWARE\NEC\PVM\Provider\VM\HyperV\
Value (Type): EnableVMOffEvent (REG_DWORD)
Value: 1
To disable it, change the value from 1 to 0.
*2
To change the thresholds of disk free space and disk usage rate, modify the registry:
Key: HKEY_LOCAL_MACHINE\SOFTWARE\NEC\PVM\Provider\VM\HyperV\
▪ Disk free space
Value (Type): FreeSpaceThreshold (REG_DWORD)
Default Value: 2048 (MB)
▪ Disk usage rate
Value (Type): DiskUsageThreshold (REG_DWORD)
Default Value: 75 (%)
*3
Virtual machines go into the Paused-Critical state if the free space of CSV falls below
200MB. CSV[Critical] event is notified when a virtual machine is in the Paused-Critical
state.
CSV[NonCritical] event is notified when the capacity monitoring detects the free space
of CSV exceeds 200MB, which does not automatically recover virtual machines from its
Paused-Critical state. Those virtual machines need to be manually started after verifying
that there is sufficient free space.
*4
Cluster: Node recovery events do not occur in all recovery case. Events might not occur
depending on the recovery way.
1.3. Policy Setting
Policy settings are created based on standard policies prepared for each machine type
and usage. You can assign different policy settings to each group and model.
SigmaSystemCenter specifies a managed machine or a group (model) by using a
notified event that is sent when any status change happens, and checks the policy
setting assigned to the group (model). If any action against the status change event is
set in the policy setting, SigmaSystemCenter executes the action.
Appendix A Network Ports and Protocols
1.4. Configuring Actions
Normally, you set an action to each single event; however, you can also set an action
to multiple events collectively if you want to execute the same action to all events in the
same event category. In addition, you can specify multiple actions to execute and also
conditions to execute an action.
If you do not set any action to an event, SigmaSystemCenter does not execute any
action but outputs the operations log for the event. Even if you set any action to an
event, SigmaSystemCenter does not execute any action in a situation when the
suppression conditions of the action are satisfied.
1.4.1.
Flow Control of Multiple Actions
The number of actions settable to an event is 30 at the maximum. If you specify
multiple actions, SigmaSystemCenter executes the actions in the order registered in
the setting window (from top to bottom).
From the second action or later, the result of the target action can be specified as an
execution condition for the next action.
The target action, the above mentioned, is defined as follows:
If any value is NOT set for the Label of an action, the target action is the one registered
just above the action of which the Label is not set.
If any value is set for the Label of an action, the target action is the one registered in the
number indicated in the Label.
According to the result of the target action, the execution condition can be specified as
follows:
Success
Executes the next action if the target action ends normally.
If the target action is not executed or the target action ends with an error, the next
action is not executed.
Completed
Executes the next action when the target action is completed.
If the target action is not executed, the next action is not executed.
Failed
Executes the next action if the target action ends abnormally.
If the target action is not executed or the target action ends normally, the next
action is not executed.
If you cancel the execution of an action while the action is being executed, the
execution process is aborted and the job ends with an error. In this case, the following
actions are not executed and end no matter what execution results are set.
The execution result of all actions is displayed as completed only when all the actions
are completed. If even one action ends with an error, the result of all actions is ending
with an error. However, if Reset of an action execution result is executed after the
action ended with an error and also all the following actions are completed, the result of
all actions is displayed as completed.
Note: There is an exception to the following actions:
▪ Machine status / Set faulted status by sensor diagnosis
▪ Machine status / Set ready status by Total recover diagnosis
▪ Machine status / Set ready status by HardwarePartsStatus diagnosis
Execution results of them are always displayed as "completed" even if they end with an
error.
[Example1]
This is an example of configuring the corresponding event handler settings against a
Machine inaccessible error which has been occurred on a virtual machine server.
•
Type of the managed target: virtual machine server
•
Occurred event: Machine inaccessible error
•
Details of the corresponding event handler settings. What is surrounded by
round blackets is the execution condition.
1.
Diagnose and Power OFF
2.
Move all running VMs on the VM server (,which is executed when the
number 1 event handler setting ends successfully.)
3.
Scaleout Add a machine to the group (,which is executed when the
number 2 event handler setting ends.)
Appendix A Network Ports and Protocols
In this case, SigmaSystemCenter executes the event handler settings as follows:
[Example2]
Assume that there is an environment where System Monitor - Performance Monitoring
Services monitors the load status of a group. If the load exceeds the threshold,
SigmaSystemCenter executes Scale Out. This is an example of switching the scripts to
notify the user depending on the execution result of the Scale Out.
•
Type of the managed target: group
•
Occurred event: group custom report by System Monitor - Performance
Monitoring Services
•
Details of the corresponding event handler settings. What is surrounded by
round blackets is the execution condition.
1.
Scaleout Add a machine to the group
2.
Execute Local Script *Notification of Success (If the number 1 event
handler setting ends successfully)
3.
Execute Local Script *Notification of Failed (If the number 1 event
handler setting fails)
4.
Reset of an action execution result (If the number 3 event handler
setting ends successfully)
In this case, SigmaSystemCenter executes the event handler settings as follows:
Appendix A Network Ports and Protocols
1.4.2.
Suppression of Action Execution (Suppression of Error
Event)
As for a part of error events, such as Machine inaccessible error, even if
SigmaSystemCenter detects the error event, SigmaSystemCenter waits for a recovery
event for the error event generated for a certain period of time and only if the recovery
event does not occur, SigmaSystemCenter executes a set action, supposing that an
error event and recovery event occur continuously in a short period of time.
The followings are the events to which you can set suppression setting and their
suppression events.
Events
Suppression Events
Monitoring
time
of
a
suppression event (Default
Value)
CPU load failure
CPU load failure recovery
180 seconds
Machine inaccessible error
start up machine
180 seconds
Shortage of Memory
Shortage of Memory recovery
60 seconds
Reference: For instructions on how to set suppression events, see Subsection 4.10.5,
"Configuring Policy Property Settings" in SigmaSystemCenter Configuration Guide.
1.4.3.
Grouping Multiple Events
You can select either a single event or all events in the same event category for an
event that corresponds to an action to execute.
If you select all events, set actions are executed when any of events that are set to the
same event category.
Note that you cannot set multiple corresponding event handler settings for the same
event.
Appendix A Network Ports and Protocols
1.5. About Diagnosis
1.5.1.
Diagnosis Function
SigmaSystemCenter's diagnosis function enables detailed diagnosis of a failed
environment where the Machine inaccessible error occurred. By setting a policy action
of the diagnosis function, you can set recovery process to be executed only if the
recovery setting is required.
A policy action of the diagnosis function, Diagnose and Power OFF, ends with an error
if the recovery process cannot be executed because the error has an influence on a
whole group or if an error machine is judged normal. If the diagnosis function judges
that there is a possibility for the recovery process to succeed, the function aborts the
managed machine and completes the process. Ensure to set Success to the execution
condition of recovery action after executing the Diagnose and Power OFF action.
Note: The root password must be set for ESX. If not, verification of connection will fail.
The root password can be set from the Virtual Resource tab or the Subsystem Edit
window. The Virtual Resource tab appears by clicking the Environment icon on the
Management view. The Subsystem Edit window appears by clicking the Subsystem
icon on the Management view.
For further information on how to set the root password, see Subsection 2.4.6,
"Configuring the Root Password of a Virtual Machine Server" in SigmaSystemCenter
Configuration Guide.
The diagnosis function can be used only when a managed machine is a virtual machine
server (VMware, XenServer). If the Diagnose and Power OFF action is executed on a
managed machine other than virtual machine servers (VMware, XenServer), Diagnosis
will not be executed but Shutdown or Power OFF will be executed. For the details of
the policy action, see Subsection 1.7.15, "Action for machine / Diagnose and Power
OFF".
The diagnosis function checks the following points:
If the function can connect to VMware vCenter Server or Pool Master of XenServer
that manages an error machine
If there are two or more managed machines that raises Faulted as their Hardware
Status in a group to which the error machine belongs
If the function connects to an (host) OS of managed machines
(The function checks this point on up to five machines in the same group as the
error machine other than the error machine.)
If a managed machine can access to the shared disk in use
(A managed machine checks this point on up to five machines in the same group
as the error machine other than the error machine.)
In addition, when checking connection to an OS or access to the shared disk, if a fault
is found on the error machine in diagnosis, the diagnosis function diagnoses other
machines; however, it targets managed machines that meet the following conditions.
For managed machines other than the targets, the diagnosis function does not count
on as the number of machines in a group.
Managed in the same operation group with the error machine
The Running Status is On
The Maintenance Status is not On
The Policy Status is On
The Power Status is On or -
The details of abnormal end of the Diagnose and Power OFF action are as shown in
the following table:
Type
of
machine
failed
Conditions to cause abnormal end of
Notes
diagnosis
(In the checking order)
ESX Server
▪ A SigmaSystemCenter management
server cannot connect to VMware vCenter
Server.
▪ Connection to an error machine ends
with an authority error or is disconnected
on vCenter Server.
▪ There are two or more failed machines
in one group (other than the error
machine).
▪ When the number of machines that
cannot connect to an OS of machines in
the same group (including the error
machine).
- When there are two to four machines in
the group: two or more
- When there are five or more machines in
the group: three or more
▪ When the number of machines that
cannot connect to the shared disk in the
same group (including the error machine)
- When there are two to four machines in
the group: two or more
- When there are five or more machines in
the group: three or more
▪ If an error machine is normal.
▪ When a
SigmaSystemCenter
management server cannot
connect to vCenter Server,
the Job ends with an error
because the diagnosis
function cannot control the
recovery process.
▪ When there are many
machines that cannot connect
to an OS or access to the
disk, the diagnosis function
judges the circumstances that
it should not execute the
recovery process and ends
the process with an error.
Appendix A Network Ports and Protocols
Type
of
failed
machine
Conditions to cause abnormal end of
Notes
diagnosis
(In the checking order)
ESXi Standalone
▪ If connection to an error machine ends
with an authority error or is disconnected
in SSC.
▪ There are two or more failed machines
in one group (other than the error
machine).
▪ When the number of machines that
cannot connect to an OS of machines in
the same group (including the error
machine)
- When there are two to four machines in
the group: two or more
- When there are five or more machines in
the group: three or more
▪ When there are many
machines that cannot connect
to an OS or access to the
disk, the diagnosis function
judges the circumstances that
it should not execute the
recovery process and ends
the process with an error.
▪ When the number of machines that
cannot connect to the shared disk in the
same group (including the error machine)
- When there are two to four machines in
the group: two or more
- When there are five or more machines in
the group: three or more
▪ If an error machine is normal.
XenServer
Pool
Master Machine
▪ If an error machine is normal.
▪ If connection to Pool Master
or access to the disk failed,
the diagnosis function cannot
check the status of Slave
machines in Pool Master
because the diagnosis
function checks Slave
machines in Pool Master
through the Pool Master. In
this case, the diagnosis
function cannot judge if it can
recover the circumstances;
however, it completes the
process because there is a
possibility of recovery.
Type
of
failed
machine
Conditions to cause abnormal end of
Notes
diagnosis
(In the checking order)
XenServer
Machine
Slave
▪ Cannot connect to XenServer Pool
Master.
▪ Cannot access to the shared disk
through XenServer Pool Master.
▪ When a machine cannot
connect to Pool Master or
access to the disk, the
process ends with an error
because the diagnosis
function cannot control the
recovery process.
▪ Because the shared disk's
check to a Slave machine is
executed through Pool
Master, if the diagnosis
function can access to the
shared disk, a Slave machine
can connect to the shared
disk or not. In this case, the
diagnosis function shows
preference on the assumption
of error occurrence and
completes the process to
execute the recovery process.
1.5.2.
Sensor Diagnosis
Sensor diagnosis receives events of managed machines and analyzes whether the
sensor statuses of the powered on managed machines have any trouble.
Sensor diagnosis needs communicating with BMC of managed machines through OOB
Management.
"Machine status / Set faulted status by sensor diagnosis" policy action ends abnormally
when it judges that the machine suspected of failure is normal.
And the rules of diagnosis of machines changes depending on the type of triggered
event or machine status.
The diagnosis rules change as follows according to the type of triggered event.
The OOB Management event
Analyzes the sensor which has sent the triggered event alone and judges whether
the sensor is in critical state or not.
If the sensor does not respond due to communication failure or hardware failure,
sensor diagnosis decides whether it ends normally or abnormally according to the
importance of the triggered event.
NEC ESMPRO event
One of NEC ESMPRO events is relevant to the sensor status and treated as to be
diagnosed.
Appendix A Network Ports and Protocols
Receiving the NEC ESMPRO event relevant to the sensor status, sensor
diagnosis analyzes the statuses of sensors whose types are the same as the
sensor which has sent the triggered event. If any sensor does not respond due to
communication failure or hardware failure, sensor diagnosis decides whether it
ends normally or abnormally according to the importance of the triggered event.
The target NEC ESMPRO event is as follows:
Target event
Source
SystemMonitorEvent
ESMCOMMONSERVICE
ESMLOCALPOLLING
Sensor diagnosis skips diagnosing for NEC ESMPRO events other than the
above.
Other events
For events other than the OOB Management events and the NEC ESMPRO event,
sensor diagnosis does not execute diagnosis but set faulted status, and ends
normally. If the sensor which has sent the event does not respond due to
communication failure or hardware failure, sensor diagnosis set faulted status on
the sensor.
There are cases where sensor diagnosis cannot obtain the sensor status properly
because of the machine power status. In this case the sensor diagnosis returns the
result as follows according to the machine power status.
When the machine power status changes while sensor diagnosis is running
This case may occur if the machine is automatically shut down or rebooted by HW
failure. In this case, sensor diagnosis judges that the machine has HW failure and
sets faulted status, and ends normally.
When the machine power status is already off before the sensor diagnosis runs
The machine power may have been turned off before sensor diagnosis runs
because the machine had been in critical or non-recoverable state. In this case,
sensor diagnosis judges that the machine has HW failure and sets faulted status,
and ends normally.
Note:
▪ Sensor diagnosis targets the power-on machine where HW failure occurred.
Therefore, you cannot obtain an accurate result if you execute sensor diagnosis for the
power-off machine.
▪ When you executes sensor diagnosis for the machine which the OOB Management is
not enabled, sensor diagnosis sets faulted status and ends normally.
▪ The criteria of severity of sensor status are independent from event categories.
Therefore, sensor diagnosis may judge the machine is normal even when "Machine
status / Set faulted status by sensor diagnosis" policy action is set for the events
classified into failure category.
The following table shows the relationship among the type of triggered event, the
connection status and the machine status when the triggered event happens, and the
result of action in detail.
If the machine power is on before and after executing sensor diagnosis
The type of the triggered
Connection
event
status
and
machine
OobManagement event and
the target ESMPRO event to
be diagnosed
The sensor, which sent a
predictive event, is in critical
state.
This action sets faulted status
and ends normally.
The sensor, which sent a
predictive event, is in warning
or normal state.
There is no failure, and this
action does not set faulted
state and ends abnormally.
This action cannot get
information of the sensor
which sent a predictive event.
This action ends in a status
depends on the event severity.
If the severity of event is
critical, this action sets faulted
status and ends normally.
▪ This action could not
communicate with BMC.
This action ends in a status
depends on the event severity.
If the severity of event is
critical, this action sets faulted
status and ends normally.
▪ This action failed to execute
IPMI command to BMC.
▪ An unexpected error
occurred.
Other events
Do not depend on connection
and machine status.
result of action
This action sets faulted status
and ends normally.
The following table shows the relationship between power status of the machine and
result of action.
These situations have a priority over the above sensor diagnosis results.
Appendix A Network Ports and Protocols
Power status
result of action
The power status changes before and after
sensor diagnosis.
This action sets faulted status and ends
normally.
The power status is off before the sensor
diagnosis.
This action sets faulted status and ends
normally.
Sensor diagnosis called from Total recover diagnosis explained in Subsection 1.5.4,
"Total Recover Diagnosis" analyses all the sensors of a target managed machine
regardless of triggered events, and judges the target managed machine is Normal only
when all the sensors are normal. For a target machine with any sensor is not Normal,
sensor diagnosis judges the target machine is Abnormal and ends abnormally.
When sensor diagnosis cannot obtain sensor status due to power status of a target
machine, the sensor diagnosis also judges the target machine is Abnormal and ends
abnormally.
Set ready status by Total recover diagnosis, a policy action of diagnosis function, sets
Normal for the hardware status of the target machine and ends normally if the target
machine is judged to be in normal status.
1.5.3.
Hardware Parts Status Diagnosis
Hardware Parts Status diagnosis diagnoses the status of a target machine based on
the hardware parts statuses configured according to which event happens.
SigmaSystemCenter checks the hardware parts statuses created or updated based on
the events notified from related products or related functions. When all the hardware
parts statuses are normal, SigmaSystemCenter judges the target machine is in normal
status.
"Machine status / Set ready status by HardwarePartsStatus diagnosis", policy action of
diagnosis function, sets Normal for the hardware status of the target machine and ends
normally if the target machine is judged to be in normal status. If the target machine is
judged to be not in normal status, it ends abnormally.
Related products and related functions offers events relevant to the hardware parts
statuses are as follows:
Related Products / Related
Hardware Parts Status Name
Functionalities
NEC ESMPRO
Battery / Boot Error / Button/Switch / Cable/Interconnect /
Chassis / Chip Set / ClusterLan / ClusterNode / Cooling Device
/ CpuDegeneracy / CpuLoad / Critical Interrupt / DeadOrAlive /
Disk / DiskRecovery / DiskReplace / Drive Slot(Bay) / Entity
Presence Information / Event Logging / Fan(Speed) /
Management Subsystem Health / Memory /
MemoryDegeneration / Module/Board(Missing) / OS Boot / OS
Critical Stop / Physical Security(Chassis Intrusion) / POST
Error / POST Memory Resize / Power Supply / Power Unit /
Processor / Slot/Connector / System ACPI Power State /
System Event / Temperature / Voltage / Watchdog1
Out-of-Band Management
(Sensor)
Battery / Button/Switch / Cable/Interconnect / Chassis / Chip
Set / Cooling Device / Critical Interrupt / Drive Slot(Bay)/ Entity
Presence Information / Event Logging / Fan(Speed) / LAN /
Management Subsystem Health / Memory /
Module/Board(Missing) / Monitor ASIC/IC / OS Critical Stop /
Physical Security(Chassis Intrusion) / Platform Security
Violation Attempt / POST Error / POST Memory Resize / Power
Supply / Power Unit / Processor / Slot/Connector / System
ACPI Power State / System Event / Temperature / Voltage /
Watchdog1 / Other Units-based Sensor / Other FRU /
Watchdog Timer / Microcontroller/Coprocessor / Add-in Card /
Terminator / System Boot Initiated / Platform Alert / Session
Audit / Version Change / FRU State / OEM
Hyper-V
NetworkInterface / Node / Resources (VM) / OSStatus /
DiskAccess
VMware (ESX, ESXi)
Connection State / Cpu Usage / Heartbeat State / Memory
Usage / Network Connectivity / Power State / Storage Path
Connectivity / OSStatus / DiskAccess
Citrix XenServer
OSStatus / DiskAccess
Alive Monitoring
AliveMonitoringState / PingState / PortConnectivity
Hardware parts statuses of NEC ESMPRO and Out-of-Band Management do not
recover automatically because SigmaSystemCenter cannot realize the target machine
is in normal status unless the sensor diagnosis is executed.
Therefore, enable Out-of-Band Management to use Total recover diagnosis, execute
Composite Diagnosis in the Web Console, or execute Reset(Ready) manually.
As for the following hardware parts statuses, they do not recover to Normal
automatically. Check that the target machine has no abnormalities, and execute
Reset(Ready) manually.
Hardware
Parts
Status
Corresponding Event
Faulted
[Source]CLUSTERPRO
[ID]0xC0005217(21015)
[Summary]Public LAN error
[Source]CLUSTERPRO
[ID]0xC000521B(21019)
[Summary]Public LAN error
[Source]CLUSTERPRO
[ID]0xC000521C(21020)
[Summary]Public LAN error
[Source]CLUSTERPRO
[ID]0xC000521D(21021)
Status Name
ClusterLan
Appendix A Network Ports and Protocols
Hardware
Parts
Status
Corresponding Event
Status Name
[Summary]Public LAN error
ClusterNode
Faulted
[Source]CLUSTERPRO
[ID]0xC00008A4(2212)
[Summary]Server down
[Source]CLUSTERPRO X
[ID]0x40000002(2)
[Summary]Server down
[Source]EXPRESSCLUSTER X
[ID]0x40000002(2)
[Summary]Server down
CpuDegeneracy
Faulted
[Source]ESMCommonService
[Summary]CPU Module FRB
[ID]0xC0000838(2104)
Degraded
[Source]ESMCommonService
[Summary]CPU Reduce
[Source]ESMCommonService
[Summary]CPU Reduce
[ID]0x800002BD(701)
[ID]0x800002BF(703)
DiskRecovery
Degraded
[Source]ASMBENotify
[ID]0x0000200C(8204)
[Summary]Member is down on array
[Source]ASMBENotify
[ID]0x0000200D(8205)
[Summary]Member is missing on array
[Source]ASMBENotify
[ID]0x0000200E(8206)
[Summary]Array is off-line; member failed
[Source]ASMBENotify
[ID]0x00002023(8227)
[Summary]Array is critical
[Source]ASMBENotify
[ID]0x0000205C(8284)
[Summary]Array is still critical
[Source]ASMBENotify
[ID]0x0000B00E(45070)
[Summary]Device is failed
[Source]ASMBENotify
[ID]0x0000B033(45107)
[Summary]Array is degraded
[Source]ASMBENotify
[ID]0x0000B034(45108)
[Summary]Second-level array is degraded
[Source]ASMBENotify
[ID]0x0000B036(45110)
[Summary]Array is degraded
[Source]ASMBENotify
[ID]0x0000B037(45111)
[Summary]Second-level array is degraded
[Source]ESMMylexService
[ID]0x800403E9(1001)
[Summary]Not Support
[Source]ESMAMIService
[ID]0x800403E9(1001)
[Summary]Not Support
[Source]ESMDiskArray
[ID]0x800403E9(1001)
[Summary]Disk Array Logical Device Critical
[Source]ESM Mylex Service
[ID]0x80040205(517)
[Summary]System Drive CRITICAL
DiskReplace
Faulted
[Source]ASMBENotify
[ID]0x00002014(8212)
[Summary]Reconstruct aborted due to I/O error
[Source]ASMBENotify
[ID]0x00002017(8215)
[Summary]Verify aborted due to I/O error, no miscompares
[Source]ASMBENotify
[ID]0x00002019(8217)
[Summary]Initialize aborted due to I/O error
[Source]ASMBENotify
[ID]0x0000202D(8237)
[Summary]Reconstruct failed to start due to I/O error
[Source]ASMBENotify
[ID]0x00002035(8245)
[Summary]Update of array drives failed after Initialize
[Source]ASMBENotify
[ID]0x00002038(8248)
[Summary]Scheduled Reconstruct failed to start
Hardware
Parts
Status
Corresponding Event
Status Name
[Source]ASMBENotify
[ID]0x00002039(8249)
[Summary]Scheduled Verify failed to start
[Source]ASMBENotify
[ID]0x0000204E(8270)
[Summary]Verify utility failed to start
[Source]ASMBENotify
[ID]0x00002059(8281)
[Summary]Dedicated spare not functional
[Source]ASMBENotify
[ID]0x00002085(8325)
[Summary]Verify aborted due to I/O error with fixed
miscompares
[Source]ASMBENotify
[ID]0x00002090(8336)
[Summary]Recovered error: SMART event received for array
[Source]ASMBENotify
[ID]0x00002091(8337)
[Summary]Recovered error: SMART event received for
device
[Source]ASMBENotify
[ID]0x00002094(8340)
[Summary]I/O error aborted Verify, unfixed miscompares
[Source]ASMBENotify
[ID]0x000020AD(8365)
[Summary]Device is down. A Hard Drive is down or no longer
responding.
[Source]ASMBENotify
[ID]0x0000B069(45161)
[Summary]Array is dead
[Source]ASMBENotify
[ID]0x0000B090(45200)
[Summary]Non-corrected ECC error found
[Source]ASMBENotify
[ID]0x0000B11E(45342)
[Summary]Channel offline
[Source]ASMBENotify
[ID]0x0000B11F(45343)
[Summary]Channel offline
[Source]ASMBENotify
[ID]0x0000B121(45345)
[Summary]Channel offline
[Source]ASMBENotify
[ID]0x0000B122(45346)
[Summary]Channel offline
[Source]ASMBENotify
[ID]0x0000B123(45347)
[Summary]Channel offline
[Source]ESMMylexService
[ID]0xC00403EB(1003)
[Summary]Not Support
[Source]ESMMylexService
[ID]0x800403F0(1008)
[Summary]Not Support
[Source]ESMAMIService
[ID]0xC00403ED(1005)
[Summary]Not Support
[Source]ESMAMIService
[ID]0x800403F3(1011)
[Summary]Not Support
[Source]ESMDiskArray
[ID]0xC00403F3(1011)
[Summary]Disk Array Physical Device Dead
[Source]ESMDiskArray
[ID]0x800403FC(1020)
[Summary]Disk Array Physical Device S.M.A.R.T. Error
[Source]ESMStorageService [ID]0x800403E8(1000)
[Summary]Hard Disk Failure Prediction:Exceed Threshold
[Source]ESMStorageService [ID]0x800403E9(1001)
[Summary]Hard Disk Failure Prediction:S.M.A.R.T. Error
[Source]ESM Mylex Service
[ID]0xC0040200(512)
[Summary]Physical Device DEAD
[Source]ESM Storage Service [ID]0xC00423F6(9206)
[Summary]HD:Fatal Recovered Error
[Source]ESM Storage Service [ID]0x800423F5(9205)
[Summary]HD:Warning Recovered Error
Appendix A Network Ports and Protocols
Hardware
Parts
Status
Corresponding Event
Status Name
[Source]ESM Storage Service [ID]0xC00423F8(9208)
[Summary]HD:Fatal Not Ready Error
[Source]ESM Storage Service [ID]0x800423F7(9207)
[Summary]HD:Warning Not Ready Error
[Source]ESM Storage Service [ID]0xC00423FA(9210)
[Summary]HD:Fatal Medium Error
[Source]ESM Storage Service [ID]0x800423F9(9209)
[Summary]HD:Warning Medium Error
[Source]ESM Storage Service [ID]0xC00423FC(9212)
[Summary]HD:Fatal Hardware Error
[Source]ESM Storage Service [ID]0x800423FB(9211)
[Summary]HD:Warning Hardware Error
MemoryDegeneration
network connectivity
storage path
connectivity
1.5.4.
Faulted
[Source]ESMCommonService
[Summary]Memory Reduce
[Source]ESMCommonService
[Summary]Memory Reduce
[Source]ESMCommonService
[Summary]POST cache Reduce
[Source]ESMCommonService
[Summary]Cache ECC multi
[ID]0x800002BE(702)
[ID]0x800002C6(710)
[ID]0x8000051A(1306)
[ID]0xC000051C(1308)
Faulted
Network connectivity on VMS is lost
Degraded
Network redundancy on VMS is lost
Network redundancy on VMS is degraded
Faulted
Storage path connectivity on VMS is lost
Degraded
Storage path redundancy on VMS is lost
Storage path redundancy on VMS is degraded
Total Recover Diagnosis
Total recover diagnosis diagnoses a target machine based on all the results of
diagnosis, sensor diagnosis, and hardware parts status diagnosis.
Total recover diagnosis varies its combination of diagnoses depending on types and
settings of target machines.
Target machines and diagnoses for the target machines are as follows:
Target Machine
Diagnosis for the Target Machine
Virtual machine server
Executes Subsection 1.5.1, "Diagnosis Function."
Checks the following three points:
▪ Whether the target machine can connect to its virtual
infrastructure, such as VMware vCenter Server or
XenServer PoolMaster.
▪ Whether the host OS of the target machine is connectable
▪ Whether the shared disk used by the target machine is
accessible
* Does not check whether the target machine group has two
or more units of managed machines whose hardware status
are Faulted.
A machine on which Out-of-Band
Management function is being
used
Executes Subsection 1.5.2, "Sensor Diagnosis."
All machines
Executes Subsection 1.5.3, "Hardware Parts Status
Diagnosis."
"Machine status / Set ready status by Total recover diagnosis", policy action of
diagnosis function, sets Normal for the hardware status of the target machine and ends
normally if the target machine is judged to be in normal status. If the target machine is
judged to be not in normal status, it ends abnormally.
Composite diagnosis in the Web Console uses Total recover diagnosis and set Normal
for hardware statuses.
Appendix A Network Ports and Protocols
Note:
▪ When a target machine is a virtual machine server, XenServer slaves cannot
recognize access to the shared disk from the target machine. When the number of
target disks to diagnose is zero, other virtual machine servers (ESX, standalone ESXi,
Xen, and Hyper-V) also cannot recognize the target disks are accessible or not.
Therefore, SigmaSystemCenter cannot judge the target machine is Normal using
Composite Diagnosis. In above cases, check that the target machine has no trouble,
and execute Clear Failure Status manually.
▪ The following hardware parts statuses are not updated by executing Composite
Diagnosis. To recover to Normal, check that the target machine has no abnormalities,
and execute Reset(Ready) manually.
ClusterLan / ClusterNode / Connection State / Cpu Usage / CpuDegeneracy / CpuLoad
/ DeadOrAlive / Disk / DiskRecovery / DiskReplace / Heartbeat State / Memory Usage /
MemoryDegeneration / Network Connectivity / NetworkInterface / Node / Power State /
Resources(VM) / Storage Path Connectivity / AliveMonitoringState / PingState /
PortConnectivity
▪ The following hardware parts statuses regarding VMware are recovered by total
recover diagnosis if the corresponding statuses are recovered.
Cpu Usage / Memory Usage / Hertbeat State / Connection State
▪ If OOB Management is not enabled, the following hardware parts statuses are not
updated by executing Composite Diagnosis. To recover to Normal, check that the
target machine has no abnormalities, and execute Reset(Ready) manually.
Battery / Boot Error / Cable/Interconnect / Chassis / Chip Set / Cooling Device / Critical
Interrupt / Drive Slot(Bay) / Fan(Speed) / LAN / Management Subsystem Health /
Memory / Module/Board(Missing) / OS Critical Stop / Physical Security(Chassis
Intrusion) / POST Error / POST Memory Resize / Power Supply / Power Unit /
Processor / Slot/Connector / System Event / Temperature / Voltage
▪ If the power status of the target machine is OFF, sensor status may not be judged
properly although OOB Management is enabled, then the hardware status cannot be
recovered using Composite Diagnosis. In such a case, check that the target machine
has no trouble, and execute Clear Failure Status manually.
1.6. About Standard Policy
You can use standard action settings to handle errors for each type or usage of
managed machine as standard policies.
Contents of policy setting differ according to types of managed machine, such as a
physical machine, virtual machine, and virtual machine server, or usage.
There are 11 kinds of Standard Policies:
Policy Name
Managed
Registered by
Default
Standard Policy
Physical machines other than ones used as
virtual machine servers
OK
Standard Policy (N+1)
Physical machines other than ones used as
virtual machine servers
* Corresponding to the N+1 replacing
-
Standard Policy (Virtual
Machine)
Virtual Machine
OK
Standard Policy (VM Server)
Virtual Machine Server
OK
Standard Policy (VM Server
Predictive)
Virtual Machine Server
* Management that Predictive event
monitoring is enabled
-
Standard Policy (VM Server
Power save)
Virtual Machine Server
* Corresponding to the power saving
-
Standard Policy (VM Server
ESXi)
Virtual Machine Server (ESXi)
-
Standard Policy (VM Server
Hyper-V)
Virtual Machine Server (Hyper-V)
-
Standard Policy (VM Server
Hyper-V Predictive)
Virtual Machine Server (Hyper-V)
* Management that Predictive event
monitoring is enabled
-
Standard Policy (VM Server
Hyper-V Power save)
Virtual Machine Server (Hyper-V)
* Corresponding to the power saving
-
System Policy (Manager)
A manager that manages resources used by
SigmaSystemCenter (e.g. vCenter Server).
OK
Standard policies that are registered by default are "OK" will be registered when
applying the edition license.
The System Policy (Manager) is automatically applied to managers to monitor them,
such as share resources. One System Policy (Manager) exists on one system.
Configuring the System Policy on a group is unnecessary because it is not applied for
managed machines.
Appendix A Network Ports and Protocols
Do not delete the System Policy (Manager) or do not change its name. If its name is
changed, it will not be automatically applied because it is not recognized as the System
Policy (Manager). If the System Policy (Manager) should be deleted by mistake or its
name should be changed, it can be restored by restarting the PVMService. It cannot be
added from the Add Policy menu.
When disabling the System Policy (Manager), disable the monitoring event setting.
Refer to the tables for each setting in the following subsections.
Note:
▪ If you select an event of a Standard Policy configured with multiple events on the
Policy Property Setting window and open the Corresponding Event Handler Setting
window of the event, the All event in category check box is selected automatically, and
Others is displayed in the Event Category box. In addition, Component Events column
is displayed below the Event Name box, on which a list of corresponding events is
displayed.
▪ In an environment where SigmaSystemCenter is upgraded from an earlier version,
Standard Policy may not correspond with the explanations in the following subsections
because the Standard Policy remains the same as before. When a new policy is
created in the environment, a Standard Policy that is configured as explained in the
following subsections is created.
1.6.1.
Settings of a Standard Policy
The following table shows the settings of a Standard Policy.
Event Name
Report Source
Event
(Default)
Event
Recovery
Event
Handler
Action
State
Notification/
E-mail, Event
Log
Enable
Settings
Name
(Default)
CPU
degeneracy
failure
SystemMonitorEvent
All events in the CPU
degeneracy failure event
category
Set
Degraded
Status
Machine
status / Set
degraded
status
CPU failure
SystemMonitorEvent
All events in the CPU failure
event category and CPU
temperature failure event
category
Set Faulted
Status
Notification/
E-mail, Event
Log
Machine
status / Set
faulted status
Enable
Event Name
Report Source
Event
(Default)
Event
Recovery
Event
Handler
Action
State
Notification/
E-mail, Event
Log
Enable
Settings
Name
(Default)
CPU load
failure
SystemMonitorEvent
All events in the CPU load
failure event category
VMwareProvider
and
Set Faulted
Status
Machine
status / Set
faulted status
ESMCpuPerf[0x80000065]
CPU Error Recovered
ESMCpuPerf[0x80000069]
CPU Error Recovered
(* For compatibility from
SigmaSystemCenter 1.3)
CPU load
failure recovery
disk
replacement
failure
SystemMonitorEvent
ESMCpuPerf[0x40000067]
CPU Warning Recovered
ESMCpuPerf[0x4000006B]
CPU Warning Recovered
VMwareProvider
All events in the CPU load
failure recovery event
category
SystemMonitorEvent
All events in the Hard disk
replacement failure event
category
Set Ready
Status
Notification/
E-mail, Event
Log
Enable
Machine
status / Set
ready status
Set
degraded
status
Notification/
E-mail, Event
Log
Enable
Machine
status / Set
degraded
status
Disk failure
SystemMonitorEvent
All events in the Hard disk
failure event category
Set Faulted
Status
Notification/
E-mail, Event
Log
Enable
Machine
status / Set
faulted status
disk recovery
failure
SystemMonitorEvent
All events in the Hard disk
recovery failure event
category
Set
degraded
status
Notification/
E-mail, Event
Log
Enable
Machine
status / Set
degraded
status
Recovery from
the disk
recovery failure
SystemMonitorEvent
All events in the Recovery
from the hard disk recovery
failure event category
Set Ready
Status
Notification/
E-mail, Event
Log
Enable
Machine
status / Set
ready status
machine down
SystemMonitorEvent
VMwareProvider
All events in the Machine
inaccessible error event
category
Set Faulted
Status
Notification/
E-mail, Event
Log
Machine
Enable
Appendix A Network Ports and Protocols
Event Name
Report Source
Event
(Default)
Event
Recovery
Event
Handler
Action
State
Settings
Name
(Default)
status / Set
faulted status
AliveMonitor
start up
machine
SystemMonitorEvent
All events in the Machine
inaccessible error recovery
event category
Set Ready
Status
VMwareProvider
Enable
Machine
status / Set
ready status
AliveMonitor
Memory
degeneration
failure
Notification/
E-mail, Event
Log
SystemMonitorEvent
All events in the Memory
degeneration failure event
category
VMwareProvider
Alarm Virtual Machine
Memory Usage on VM
changed from green to red
Set
Degraded
status
Notification/
E-mail, Event
Log
Enable
Machine
status / Set
degraded
status
Alarm Virtual Machine
Memory Usage on VM
changed from yellow to red
Alarm Virtual Machine
Memory Usage on VM
changed from gray to red
Memory failure
SystemMonitorEvent
All events in the Memory
failure event category
Set Faulted
Status
Notification/
E-mail, Event
Log
Enable
Machine
status / Set
faulted status
Cluster:Node
has stopped
SystemMonitorEvent
CLUSTERPRO[0xC00008A4]
Set Faulted
Status
Notification/
E-mail, Event
Log
Enable
Machine
status / Set
faulted status
Cluster:Network
failure
SystemMonitorEvent
CLUSTERPRO[0xC0005217]
Set Faulted
Status
Notification/
E-mail, Event
Log
Enable
Machine
status / Set
faulted status
custom group
notification 1
SystemMonitorPerf
11000001
no action
no action
Disable
custom group
notification 2
SystemMonitorPerf
11000002
no action
no action
Disable
custom group
notification 3
SystemMonitorPerf
11000003
no action
no action
Disable
custom group
notification 4
SystemMonitorPerf
11000004
no action
no action
Disable
Event Name
Report Source
Event
(Default)
Event
Recovery
Event
Handler
Action
State
Settings
Name
(Default)
custom group
notification 5
SystemMonitorPerf
11000005
no action
no action
Disable
custom
machine
notification 1
SystemMonitorPerf
10000001
no action
no action
Disable
custom
machine
notification 10
SystemMonitorPerf
1000000A
no action
no action
Disable
custom
machine
notification 2
SystemMonitorPerf
10000002
no action
no action
Disable
custom
machine
notification 3
SystemMonitorPerf
10000003
no action
no action
Disable
custom
machine
notification 4
SystemMonitorPerf
10000004
no action
no action
Disable
custom
machine
notification 5
SystemMonitorPerf
10000005
no action
no action
Disable
custom
machine
notification 6
SystemMonitorPerf
10000006
no action
no action
Disable
custom
machine
notification 7
SystemMonitorPerf
10000007
no action
no action
Disable
custom
machine
notification 8
SystemMonitorPerf
10000008
no action
no action
Disable
custom
machine
notification 9
SystemMonitorPerf
10000009
no action
no action
Disable
*
You can set a suppression event for each of the machine down event and the CPU load failure
event.
For instructions on how to set a suppression event, see Subsection 4.10.5, "Configuring Policy
Property Settings" in SigmaSystemCenter Configuration Guide.
Appendix A Network Ports and Protocols
1.6.2.
Settings of a Standard Policy (N+1)
The following table shows the settings of a Standard Policy (N+1).
Event Name
Report Source
Event
(Default)
Event
Recovery
Event
Handler
Action
State
Notification/
E-mail, Event
Log
Enable
Settings
Name
(Default)
CPU
degeneracy
failure
CPU failure
CPU load
failure
CPU load
failure recovery
CPU thermal
failure
SystemMonitorEvent
OobManagement
ESMCOMMONSERVICE[0X
800002BD]
ESMCOMMONSERVICE[0X
800002BF]
ESMCOMMONSERVICE[0X
C0000838]
Set
Degraded
Status
[PET] 0x00076F00
[PET] 0x00076F08
Set Faulted
Status
Machine
status / Set
degraded
status
ESMCOMMONSERVICE[0X
C0000451]
ESMCOMMONSERVICE[0X
C0000523]
ESMCOMMONSERVICE[0X
C0000947]
ESMCOMMONSERVICE[0X
C0000B04]
ESMCOMMONSERVICE[0X
C0000B07]
SystemMonitorEvent
VMwareProvider
ESMCPUPERF[0XC000006
4]
ESMCPUPERF[0X80000065
]
ESMCPUPERF[0X80000066
]
ESMCPUPERF[0XC000006
8]
ESMCPUPERF[0X80000069
]
ESMCPUPERF[0X8000006
A]
Set Faulted
Status
ESMCPUPERF[0X40000067
]
ESMCPUPERF[0X4000006
B]
Set Ready
Status
* See Subsection 1.6.8
"Settings of HW Predictive
Monitoring Events."
Replace
machine
OobManagement
Enable
Machine
status / Set
faulted status
SystemMonitorEvent
SystemMonitorEvent
Notification/
E-mail, Event
Log
Notification/
E-mail, Event
Log
Enable
Machine
status / Set
faulted status
Notification/
E-mail, Event
Log
Enable
Machine
status / Set
ready status
Notification/
E-mail, Event
Log
Enable
Event Name
Report Source
Event
(Default)
Event
Recovery
Event
Handler
Action
State
Settings
Name
(Default)
SystemMonitorEvent
Machine
status/ Set
faulted status
Action for
machine/
Replace
machine
CPU thermal
recovery
OobManagement
Predictive alert :
FAN / Cooling
device failure
OobManagement
SystemMonitorEvent
* See Subsection 1.6.8
"Settings of HW Predictive
Monitoring Events."
no action
no action
Disable
* See Subsection 1.6.8
"Settings of HW Predictive
Monitoring Events."
Replace
machine
Notification/
E-mail, Event
Log
Enable
SystemMonitorEvent
Machine
status/ Set
faulted status
Action for
machine/
Replace
machine
Clear alert :
FAN / Cooling
device failure
recovery
OobManagement
Clear alert :
FAN / Cooling
device normal
recovery
OobManagement
Predictive alert :
voltage failure
OobManagement
SystemMonitorEvent
SystemMonitorEvent
* See Subsection 1.6.8
"Settings of HW Predictive
Monitoring Events."
no action
no action
Disable
* See Subsection 1.6.8
"Settings of HW Predictive
Monitoring Events."
no action
no action
Disable
* See Subsection 1.6.8
"Settings of HW Predictive
Monitoring Events."
Replace
machine
Notification/
E-mail, Event
Log
Enable
SystemMonitorEvent
Machine
status/ Set
faulted status
Action for
machine/
Replace
machine
Clear alert :
voltage failure
recovery
OobManagement
Clear alert :
voltage normal
recovery
OobManagement
Predictive alert :
power unit
failure
OobManagement
SystemMonitorEvent
SystemMonitorEvent
* See Subsection 1.6.8
"Settings of HW Predictive
Monitoring Events."
no action
no action
Disable
* See Subsection 1.6.8
"Settings of HW Predictive
Monitoring Events."
no action
no action
Disable
* See Subsection 1.6.8
"Settings of HW Predictive
Monitoring Events."
Replace
machine
Notification/
E-mail, Event
Log
Enable
Appendix A Network Ports and Protocols
Event Name
Report Source
Event
(Default)
Event
Recovery
Event
Handler
Action
State
Settings
Name
(Default)
SystemMonitorEvent
Machine
status/ Set
faulted status
Action for
machine/
Replace
machine
Predictive alert :
Coolant leak
OobManagement
* See Subsection 1.6.8
"Settings of HW Predictive
Monitoring Events."
Replace
machine
SystemMonitorEvent
Notification/
E-mail, Event
Log
Enable
Machine
status/ Set
faulted status
Action for
machine/
Replace
machine
Predictive alert :
chassis
temperature
failure
OobManagement
* See Subsection 1.6.8
"Settings of HW Predictive
Monitoring Events."
Replace
machine
SystemMonitorEvent
Notification/
E-mail, Event
Log
Enable
Machine
status/ Set
faulted status
Action for
machine/
Replace
machine
Clear alert :
chassis
temperature
failure recovery
OobManagement
Clear alert :
chassis
temperature
normal
recovery
OobManagement
Machine Down
* See Subsection 1.6.8
"Settings of HW Predictive
Monitoring Events."
no action
no action
Disable
no action
no action
Disable
SystemMonitorEvent
* See Subsection 1.6.8
"Settings of HW Predictive
Monitoring Events."
SystemMonitorEvent
ESMDSVNT[0xC0000002]
Replace
machine
Notification/
E-mail, Event
Log
Enable
AliveMonitor
[PeriodicalAliveMonitor]
TargetDown
SystemMonitorEvent
Machine
status/ Set
faulted status
Action for
machine/
Replace
machine
start up
machine
SystemMonitorEvent
ESMDSVNT[0x40000001]
Set Ready
Status
Notification/
E-mail, Event
Log
Enable
Event Name
Report Source
Event
(Default)
Event
Recovery
Event
Handler
Action
State
Settings
Name
(Default)
Memory
degeneration
failure
Memory failure
Memory
Recovery
VMS
connection
state is green
VMS
connection
state is red
AliveMonitor
[PeriodicalAliveMonitor]
TargetUp
OobManagement
[PET] 0x000E0301
SystemMonitorEvent
ESMCOMMONSERVICE[0X
800002BE]
ESMCOMMONSERVICE[0X
800002C6]
ESMCOMMONSERVICE[0X
80000515]
ESMCOMMONSERVICE[0X
8000051A]
ESMCOMMONSERVICE[0X
C000051C]
OobManagement
[PET] 0x000C6F01
SystemMonitorEvent
ESMCOMMONSERVICE[0X
C000044C]
ESMCOMMONSERVICE[0X
C00008FC]
ESMCOMMONSERVICE[0X
C0000903]
ESMCOMMONSERVICE[0X
C0000959]
ESMCOMMONSERVICE[0X
C0000B18]
ESMCOMMONSERVICE[0X
C0000B24]
OobManagement
[PET] 0x800E0301
[PET] 0x800C6F01
SystemMonitorEvent
ESMCOMMONSERVICE[0X
40000B17]
VMwareProvider
VMwareProvider
Machine
status/ Set
faulted status
Diagnose the
Sensor / Set
Faulted
Status
Machine
status/ Set
faulted status
by sensor
diagnosis.
Enable
Notification/
E-mail, Event
Log
Diagnose the
Sensor / Set
Faulted
Status
Machine
status/ Set
faulted status
by sensor
diagnosis.
Enable
Notification/
E-mail, Event
Log
no action
no action
Disable
Alerm Host connection state
on VMS changed from gray
to green
Alerm Host connection state
on VMS changed from red to
green
Set Ready
Status
Notification/
E-mail, Event
Log
Disable
Alerm Host connection state
on VMS changed from green
to red
Set Faulted
Status
Machine
status / Set
ready status
Notification/
E-mail, Event
Log
Disable
Appendix A Network Ports and Protocols
Event Name
Report Source
Event
(Default)
Event
Recovery
Event
Handler
Action
State
Settings
Name
(Default)
Alerm Host connection state
on VMS changed from gray
to red
Cluster Node
Down
HyperVProvider
Node[Down]
Machine
status / Set
faulted status
Set Faulted
Status
Notification/
E-mail, Event
Log
Disable
Machine
status / Set
faulted status
Cluster Node
Recovery
HyperVProvider
Node[Up]
Set Ready
Status
Notification/
E-mail, Event
Log
Disable
Machine
status / Set
ready status
Cluster:Node
has stopped
SystemMonitorEvent
CLUSTERPRO[0xC00008A4
]
Set Faulted
Status
Notification/
E-mail, Event
Log
Enable
Machine
status / Set
faulted status
Cluster:Network
failure
SystemMonitorEvent
CLUSTERPRO[0xC0005217
]
Set Faulted
Status
Notification/
E-mail, Event
Log
Enable
Machine
status / Set
faulted status
custom group
notification 1
SystemMonitorPerf
11000001
no action
no action
Disable
custom group
notification 2
SystemMonitorPerf
11000002
no action
no action
Disable
custom group
notification 3
SystemMonitorPerf
11000003
no action
no action
Disable
custom group
notification 4
SystemMonitorPerf
11000004
no action
no action
Disable
custom group
notification 5
SystemMonitorPerf
11000005
no action
no action
Disable
Event Name
Report Source
Event
(Default)
Event
Recovery
Event
Handler
Action
State
Settings
Name
(Default)
custom
machine
notification 1
SystemMonitorPerf
10000001
no action
no action
Disable
custom
machine
notification 10
SystemMonitorPerf
1000000A
no action
no action
Disable
custom
machine
notification 2
SystemMonitorPerf
10000002
no action
no action
Disable
custom
machine
notification 3
SystemMonitorPerf
10000003
no action
no action
Disable
custom
machine
notification 4
SystemMonitorPerf
10000004
no action
no action
Disable
custom
machine
notification 5
SystemMonitorPerf
10000005
no action
no action
Disable
custom
machine
notification 6
SystemMonitorPerf
10000006
no action
no action
Disable
custom
machine
notification 7
SystemMonitorPerf
10000007
no action
no action
Disable
custom
machine
notification 8
SystemMonitorPerf
10000008
no action
no action
Disable
custom
machine
notification 9
SystemMonitorPerf
10000009
no action
no action
Disable
*
You can set a suppression event for each of the machine down event and the CPU load failure
event.
For instructions on how to set a suppression event, see Subsection 4.10.5, "Configuring Policy
Property Settings" in SigmaSystemCenter Configuration Guide.
Appendix A Network Ports and Protocols
1.6.3.
Settings of a Standard Policy (Virtual Machine)
The following table shows the settings of a Standard Policy (Virtual Machine).
Event Name
Report Source
Event *1
Event
Handler
Settings Name
(Default)
Recovery
Event
Action
State
Notification/
E-mail, Event
Log
Enable
(Default)
High CPU
Load
High CPU
Load
Recovery
Machine
Down
Machine Off
VMwareProvider
VMwareProvider
VMwareProvider
VMwareProvider
Alarm Virtual Machine
CPU Usage on VM
changed from yellow to
red
Alarm Virtual Machine
CPU Usage on VM
changed from green to
red
Alarm Virtual Machine
CPU Usage on VM
changed from gray to red
Set Faulted Status
Alarm Virtual Machine
CPU Usage on VM
changed from gray to
green
Alarm Virtual Machine
CPU Usage on VM
changed from yellow to
green
Alarm Virtual Machine
CPU Usage on VM
changed from red to
green
Set Ready Status
Alarm Virtual Machine
Heartbeat on VM
changed from gray to red
Alarm Virtual Machine
Heartbeat on VM
changed from green to
red
Set Faulted Status
VM on VMS in DC is
powered off
Set Faulted Status
Machine status /
Set faulted
status
Notification/
E-mail, Event
Log
Enable
Machine status /
Set ready status
Notification/
E-mail, Event
Log
Enable
Machine status /
Set faulted
status
Notification/
E-mail, Event
Log
Enable
Machine status /
Set faulted
status
Machine Up
VMwareProvider
Alarm Virtual Machine
Heartbeat on VM
changed from gray to
green
Alarm Virtual Machine
Heartbeat on VM
changed from red to
green
VM on VMS in DC is
powered on
Set Ready Status
Notification/
E-mail, Event
Log
Machine status /
Set ready status
Enable
Event Name
Report Source
Event *1
Event
Handler
Settings Name
(Default)
Recovery
Event
Action
State
(Default)
Shortage of
Memory
VMwareProvider
Alarm Virtual Machine
Memory Usage on VM
changed from gray to red
Alarm Virtual Machine
Memory Usage on VM
changed from green to
red
Alarm Virtual Machine
Memory Usage on VM
changed from yellow to
red
Set Degraded
Status
Machine status /
Set degraded
status
Disable
Shortage of
Memory
recovery
VMwareProvider
Alarm Virtual Machine
Memory Usage on VM
changed from gray to
green
Alarm Virtual Machine
Memory Usage on VM
changed from red to
green
Alarm Virtual Machine
Memory Usage on VM
changed from yellow to
green
Set Ready Status
Machine status /
Set ready status
Disable
Target Down
AliveMonitor
No response from the
machine.
Set Faulted Status
Notification/
E-mail, Event
Log
Disable
Machine status /
Set faulted
status
Target Up
AliveMonitor
The machine access
recovered.
Set Ready Status
Machine status /
Set ready status
Disable
Machine status /
Set ready status
Machine Up
Notification
HyperVProvider
Resources(VM)[Online]
Set Ready Status
Notification/
E-mail, Event
Log
Enable
Machine status /
Set ready status
Machine
Down
Notification
HyperVProvider
Resources(VM)[Failed]
Set Faulted Status
Notification/
E-mail, Event
Log
Machine status /
Set faulted
status
Enable
Appendix A Network Ports and Protocols
Event Name
(Default)
Report Source
Event *1
Event
Handler
Settings Name
Recovery
Event
Action
State
(Default)
*1
A suppressing function is configured to event monitoring. (For the details of the suppressing
function, see Subsection 1.1.6, "Failure Recovery With a Policy" in SigmaSystemCenter
Configuration Guide.)
The corresponding events and suppressing events are as follows:
▪ The suppressing event of the event High CPU Load is High CPU Load Recovery and Machine
Off.
▪ The suppressing event of the event High CPU Load Recovery is High CPU Load and Machine
Off.
▪ The suppressing event of the event Machine Down is Machine Up
▪ The suppressing event of the event Machine Up is Machine Down
▪ The suppressing event of the event Shortage of Memory is Shortage of Memory recovery and
Machine Off.
▪ The suppressing event of the event Shortage of Memory recovery is Shortage of Memory and
Machine Off.
In addition, the time to monitor these suppressing events is set to 180 seconds.
*2
Suppression events of the Policy Property setting window cannot be set on the above events.
*3
For a Xen environment, enable the events whose names are Target Down and Target Up and
report source is AliveMonitor because events from the virtual infrastructure do not occur. For
details, see Subsection 2.12.11, "Alive Monitoring Virtual Machines" in SigmaSystemCenter
Overview Reference Guide.
1.6.4.
Settings of a Standard Policy (VM Server), Standard
Policy (VM Server Predictive), Standard Policy (VM Server
Power save)
The following table shows the settings of a Standard Policy (VM Server), a Standard
Policy (VM Server Predictive) and a Standard Policy (VM Server Power save).
Event Name
Report Source
Event
(Default)
Event
Recovery
Event
Handler
Action
State
Notification/
E-mail, Event
Log
Disable
Settings
Name
(Default)
VMS connection
state is green *1
VMS connection
state is red *1
VMwareProvider
VMwareProvider
Alarm Host connection
state on VMS changed
from gray to green
Alarm Host connection
state on VMS changed
from red to green
Set Ready
Status
Alarm Host connection
state on VMS changed
from gray to red
Alarm Host connection
state on VMS changed
from green to red
Move all
running VMs
on the VM
server
Machine
status / Set
ready status
Notification/
E-mail, Event
Log
Disable
Machine
status / Set
faulted status
Action for
machine/
Diagnose
and Power
OFF
Action for
VMS / Move
all running
VMs on the
VM server.
(Migration,
Failover)
Machine Up
SystemMonitorEvent
ESMDSVNT[0x40000001]
he server access
recovered
AliveMonitor
The machine access
recovered.
Set Ready
Status
Notification/
E-mail, Event
Log
Machine
status / Set
ready status
Enable
Appendix A Network Ports and Protocols
Event Name
Report Source
Event
(Default)
Event
Recovery
Event
Handler
Action
State
Notification/
E-mail, Event
Log
Enable
Settings
Name
(Default)
Machine Down
SystemMonitorEvent
AliveMonitor
ESMDSVNT[0xC0000002]
No response from the
server
Move all
running
VMs on the
VM server
Machine
status / Set
faulted status
Action for
machine/
Diagnose and
Power OFF
No response from the
machine.
Action for
VMS / Move
all running
VMs on the
VM server.
(Migration,
Failover)
Cluster Node
Down
HyperVProvider
Node[Down]
Set Faulted
Status
Notification/
E-mail, Event
Log
Disable
Machine
status / Set
faulted status
Cluster Node
Recovery
HyperVProvider
Node[Up]
Set Ready
Status
Notification/
E-mail, Event
Log
Disable
Machine
status / Set
ready status
Scaleout
Recommendation
OptimizedPlacement
Scaleout
Recommendation
Notification
Notification/
E-mail, Event
Log
Enable
Resource Pool
Consumption :
Critical Asserted
OptimizedPlacement
Resource-Pool Critical
Asserted
Notification
Notification/
E-mail, Event
Log
Enable
Resource Pool
Consumption :
Warning Asserted
OptimizedPlacement
Resource-Pool Warning
Asserted
Notification
Notification/
E-mail, Event
Log
Enable
over
load(SysmonPerf)
SystemMonitorPerf
11000006
load
balance
Action for
VMS / Load
balance
VMServer
Enable
low
load(SysmonPerf)
SystemMonitorPerf
11000007
power save
Action for
VMS / Power
save
VMserver
*2
In addition to the above events, the HW Predictive event (see Subsection 1.6.8) is provided.
▪ The HW Predictive event is disabled in Standard Policy (VM Server) and Standard Policy (VM Server Power
save).
▪ The HW Predictive event is enabled in Standard Policy (VM Server Predictive). (Recovery actions are
disabled.)
*1
This is a monitoring setting for events of machine down and startup of a virtual machine
server available with working together with vCenter Server. You can select the operation
mode of configuring to switch machine down and startup machine available with working
together with NEC ESMPRO Manager and restoration process.
If you use ESX 5.0, work with it by switching to "machine down" or "startup machine" in the
Recovery Action so that vCenter Server can monitor events.
*2
Disabled in Standard Policy (VM Server) and Standard Policy (VM Server Predictive).
Enabled in Standard Policy (VM Server Power save).
*3
You can set the Suppress Machine inaccessible error towards the VMS Access Impossible
event and the Target Access Impossible event.
The Suppress CPU Load failure is not set.
For instructions on how to set the suppression on an event, see Subsection 4.10.5,
"Configuring Policy Property Settings" in SigmaSystemCenter Configuration Guide.
1.6.5.
Standard Policy (VM Server ESXi)
The following table shows the settings of a Standard Policy (VM Server ESXi).
Event Name
Report Source
Event
(Default)
Event Handler
Recovery
Event
Settings
Action
State
Notification/
E-mail, Event
Log
Enable
Name
(Default)
VMS
connection
state is green
VMS
connection
state is red
StandaloneEsxProvider
StandaloneEsxProvider
Alarm Host
connection state on
VMS changed from
red to green
Set Ready
Status
Alarm Host
connection state on
VMS changed from
green to red
Move all VMs
on the VM
server
Machine status /
Set ready status
Notification/
E-mail, Event
Log
Enable
Machine status /
Set faulted
status
Action for
machine/
Diagnose and
Power OFF
Action for VMS /
Move all VMs
on the VM
server.
(Failover)
Target Down
AliveMonitor
No response from the
machine.
Move all VMs
on the VM
server
Notification/
E-mail, Event
Log
Disable
Appendix A Network Ports and Protocols
Event Name
Report Source
Event
(Default)
Event Handler
Recovery
Event
Settings
Action
State
Name
(Default)
Machine status /
Set faulted
status
Action for
machine/
Diagnose and
Power OFF
Action for VMS /
Move all VMs
on the VM
server.
(Failover)
Target Up
AliveMonitor
The machine access
recovered.
Set Ready
Status
Notification/
E-mail, Event
Log
Disable
Machine status /
Set ready status
Alarm
Datastore on
VMs can not
be available
StandaloneEsxProvider
Alarm Datastore on
VMS can not be
available
Move all VMs
on the VM
server
Notification/
E-mail, Event
Log
Enable
Machine status /
Set faulted
status
Action for
machine/
Diagnose and
Power OFF
Action for VMS /
Move all VMs
on the VM
server.
(Failover)
Resource Pool
Consumption :
Critical
Asserted
OptimizedPlacement
Resource-Pool
Critical Asserted
Notification
E-mail, Event
Log
Enable
Resource Pool
Consumption :
Warning
Asserted
OptimizedPlacement
Resource-Pool
Warning Asserted
Notification
Notification/
E-mail, Event
Log
Enable
*
In addition to the above events, the HW Predictive event (see Subsection 1.6.8 ) is set to
"enabled". (However, an event that Recovery Action is No Action is set to "disabled".)
*
Suppression events of the Policy Property setting window cannot be set on the above events.
1.6.6.
Settings of a Standard Policy (VM Server Hyper-V), a
Standard Policy (VM Server Hyper-V Predictive), And a
Standard Policy (VM Server Hyper-V Power Save)
The following table shows the settings of a Standard Policy (VM Server Hyper-V), a
Standard Policy (VM Server Hyper-V Predictive), and a Standard Policy (VM Server
Hyper-V Power Save).
Event Name
Report Source
Event
(Default)
Event
Recovery
Event
Handler
Action
State
Notification/
E-mail,
Event Log
Enable
Settings
Name
(Default)
Cluster Node
Down *1
HyperVProvider
Node[Down]
Set
Faulted
Status
Machine
status / Set
faulted
status
Cluster Node
Recovery *1
HyperVProvider
Node[Up]
Set Ready
Status
Notification/
E-mail,
Event Log
Enable
Machine
status / Set
ready
status
Scaleout
Recommendation
OptimizedPlacement
Scaleout Recommendation
Notification
Notification/
E-mail,
Event Log
Enable
Resource Pool
Consumption :
Critical Asserted
OptimizedPlacement
Resource-Pool Critical
Asserted
Notification
Notification/
E-mail,
Event Log
Enable
Resource Pool
Consumption :
Warning
Asserted
OptimizedPlacement
Resource-Pool Warning
Asserted
Notification
Notification/
E-mail,
Event Log
Enable
over load
(SysmonPerf)
SystemMonitorPerf
11000006
load
balance
Action for
VMS/ Load
balance
VMServer
Enable
low load
(SysmonPerf)
SystemMonitorPerf
11000007
power
save
Action for
VMS/
Power save
Vmserver *
*2
VMS connection
state is green
VMwareProvider
Alarm Host connection state on
VMS changed from gray to
green
Set Ready
Status
Notification/
E-mail,
Event Log
Disable
Appendix A Network Ports and Protocols
Event Name
Report Source
Event
(Default)
Event
Recovery
Event
Handler
Action
State
Settings
Name
(Default)
Alarm Host connection state on
VMS changed from red to
green
VMS connection
state is red
VMwareProvider
Alarm Host connection state on
VMS changed from gray to red
Alarm Host connection state on
VMS changed from green to
red
Machine
status / Set
ready
status
Move all
running
VMs on
the VM
server
Notification/
E-mail,
Event Log
Disable
Machine
status / Set
faulted
status
Action for
machine/
Diagnose
and Power
OFF
Action for
VMS/ Move
all VMs on
the VM
server.
(Migration,
Failover)
Machine Up
Machine Down
Network Interface
Failure
SystemMonitorEvent
ESMDSVNT[0x40000001] The
server access recovered
AliveMonitor
The machine access
recovered.
SystemMonitorEvent
ESMDSVNT[0xC0000002] No
response from the server
AliveMonitor
No response from the
machine.
HyperVProvider
NetworkInterface[Failed]
NetworkInterface[Unavailable]
NetworkInterface[Unreachable]
Set Ready
Status
Notification/
E-mail,
Event Log
Disable
Machine
status / Set
ready
status
Set
Faulted
Status
Notification/
E-mail,
Event Log
Disable
Machine
status / Set
faulted
status
Set
Degraded
status
Notification/
E-mail,
Event Log
*3
Machine
status / Set
degraded
status
Network Interface
Recovery
HyperVProvider
NetworkInterface[Up]
no action
no action
Disable
Event Name
Report Source
Event
(Default)
Event
Recovery
Event
Handler
Action
State
Settings
Name
(Default)
In addition to the above events, the HW Predictive event (see Subsection 1.6.8) is provided.
▪ The HW Predictive event is disabled in Standard Policy (VM Server Hyper-V).
▪ The HW Predictive event is enabled in Standard Policy (VM Server Hyper-V Predictive). (Recovery events are
disabled.)
*1
Failure and recovery events of connectivity to virtual machine servers are monitored through
Microsoft Failover Cluster. An alternative way to monitor virtual machine servers is provided
by NEC ESMPRO Manager. The operation form of the alternative way is that replaces
recovery action with "Machine Access Impossible" and "Machine Access Recovery" which
are detected by NEC ESMPRO Manager.
*2
Disabled in Standard Policy (VM Server Hyper-V) and Standard Policy (VM Server Hyper-V
Predictive).
Enabled in Standard Policy (VM Server Hyper-V Power save)
*3
Disabled in Standard Policy (VM Server Hyper-V) .
Enabled in Standard Policy (VM Server Hyper-V Predictive)
1.6.7.
Settings of a System Policy (Manager)
The following table shows the settings of a System Policy (Manager).
Event Name
Report Source
Event
(Default)
Event
Recovery
Event
Handler
Action
State
Settings
Name
(Default)
CSV Scarce
Free Space
HyperVProvider
CSV[Scarce]
Notification
Notification/
E-mail,
Event Log
Enable
CSV Abundant
Free Space
HyperVProvider
CSV[Abundant]
Notification
Notification/
E-mail,
Event Log
Disable
CSV
Paused-Critical
HyperVProvider
CSV[Critical]
Notification
Notification/
E-mail,
Event Log
Enable
CSV
Paused-Critical
Recovery
HyperVProvider
CSV[NonCritical]
Notification
Notification/
E-mail,
Event Log
Disable
Datastore
Overallocation
on disk to red
VMwareProvider
Alarm Datastore Overallocation
on disk on DATASTORE
changed from green to red
Alarm Datastore Overallocation
on disk on DATASTORE
changed from yellow to red
Alarm Datastore Overallocation
on disk on DATASTORE
changed from gray to red
Notification
Notification/
E-mail,
Event Log
Enable
Appendix A Network Ports and Protocols
Event Name
Report Source
Event
(Default)
Event
Recovery
Event
Handler
Action
State
Settings
Name
(Default)
Datastore
Overallocation
on disk to
green
VMwareProvider
Alarm Datastore Overallocation
on disk on DATASTORE
changed from red to green
Alarm Datastore Overallocation
on disk on DATASTORE
changed from yellow to green
Alarm Datastore Overallocation
on disk on DATASTORE
changed from gray to green
Notification
Notification/
E-mail,
Event Log
Disable
Datastore
usage on disk
to red
VMwareProvider
Alarm Datastore usage on disk
on DATASTORE changed from
green to red
Alarm Datastore usage on disk
on DATASTORE changed from
yellow to red
Alarm Datastore usage on disk
on DATASTORE changed from
gray to red
Notification
Notification/
E-mail,
Event Log
Enable
Datastore
usage on disk
to green
VMwareProvider
Alarm Datastore usage on disk
on DATASTORE changed from
red to green
Alarm Datastore usage on disk
on DATASTORE changed from
yellow to green
Alarm Datastore usage on disk
on DATASTORE changed from
gray to green
Notification
Notification/
E-mail,
Event Log
Disable
CSV Recovery
HyperVProvider
CSV[NoFaults]
Notification
Notification/
E-mail,
Event Log
Enable
CSV Degraded
HyperVProvider
CSV[NoDirectIO]
Notification
Notification/
E-mail,
Event Log
Enable
CSV Failure
HyperVProvider
CSV[NoAccess]
CSV[Maintenance]
Notification
Notification/
E-mail,
Event Log
Enable
Cluster Disk
Recovery
HyperVProvider
Resources(PhysicalDisk)[Online]
Notification
Notification/
E-mail,
Event Log
Enable
Cluster Disk
Failure
HyperVProvider
Resources(PhysicalDisk)[Offline]
Resources(PhysicalDisk)[Failed]
Notification
Notification/
E-mail,
Event Log
Enable
Network
Failure
HyperVProvider
Network[Down]
Network[Partitioned]
Network[Unavailable]
Notification
Notification/
E-mail,
Event Log
Enable
Network
Recovery
HyperVProvider
Network[Up]
Notification
Notification/
E-mail,
Event Log
Enable
Event Name
Report Source
Event
(Default)
Event
Recovery
Event
Handler
Action
State
Settings
Name
(Default)
Cluster Down
HyperVProvider
Cluster[NotRunning]
Notification
Notification/
E-mail,
Event Log
Enable
Cluster Up
HyperVProvider
Cluster[Running]
Notification
Notification/
E-mail,
Event Log
Enable
*
Suppression events of the Policy Property setting window cannot be set on the above events.
Content of mails and event logs are different from the content of other policies’
notification. (See Subsection 1.7.1, "Notification/ E-mail, Event Log".)
1.6.8.
Settings of HW Predictive Monitoring Events
The HW Predictive Monitoring events are configured in the policies listed below:
Standard Policy (VM Server)
Standard Policy (VM Server Power save)
Standard Policy (VM Server Predictive)
Standard Policy (VM Server ESXi)
Standard Policy (VM Server Hyper-V)
Standard Policy (VM Server Hyper-V Predictive)
The following table shows the settings of a HW Predictive Monitoring event.
Event Name
Report Source
Event
Event
Handler
(Default)
Settings
Name
(Default)
Memory
degeneration
failure
OobManagement
[PET] 0x000E0301
SystemMonitorEvent
ESMCOMMONSERVICE[0X80000515]
Memory failure
OobManagement
[PET] 0x000C6F01
SystemMonitorEvent
ESMCOMMONSERVICE[0XC000044C]
ESMCOMMONSERVICE[0XC0000903]
OobManagement
[PET] 0x800E0301
[PET] 0x800C6F01
SystemMonitorEvent
ESMCOMMONSERVICE[0X40000B17]
Memory
Recovery
Diagnose
the Sensor /
Set Faulted
Status
Diagnose
the Sensor /
Set Faulted
Status
no action
Appendix A Network Ports and Protocols
Event Name
Report Source
Event
Event
Handler
(Default)
Settings
Name
(Default)
Processor
disabled
OobManagement
[PET] 0x00076F00
[PET] 0x00076F08
SystemMonitorEvent
ESMCOMMONSERVICE[0XC0000451]
ESMCOMMONSERVICE[0XC0000523]
CPU thermal
failure
OobManagement
[PET] 0x00076F01
SystemMonitorEvent
ESMCOMMONSERVICE[0XC0000454]
Move all
running VMs
on the VM
server
CPU thermal
recovery
OobManagement
[PET] 0x80076F01
no action
SystemMonitorEvent
ESMCOMMONSERVICE[0X40000949]
Predictive
alert : chassis
temperature
failure
OobManagement
[PET] 0x00010102
[PET] 0x00010104
[PET] 0x00010109
[PET] 0x0001010B
Move all
running VMs
/ Server
shutdown
SystemMonitorEvent
ESMCOMMONSERVICE[0XC0000066]
ESMCOMMONSERVICE[0XC0000070]
ESMCOMMONSERVICE[0XC0000064]
ESMCOMMONSERVICE[0XC000093E]
ESMCOMMONSERVICE[0XC0000072]
Predictive
alert : power
unit failure
OobManagement
[PET] 0x00090B05
SystemMonitorEvent
ESMCOMMONSERVICE[0XC0000915]
* For
Standard
Policy (VM
Server
ESXi),
"Move all
VMs on the
VM server /
Server
shutdown"
Predictive
alert : voltage
failure
OobManagement
[PET] 0x00020102
[PET] 0x00020104
[PET] 0x00020109
[PET] 0x0002010B
[PET] 0x00020703
SystemMonitorEvent
ESMCOMMONSERVICE[0XC00001FD]
ESMCOMMONSERVICE[0XC00001FF]
ESMCOMMONSERVICE[0XC0000203]
ESMCOMMONSERVICE[0XC0000205]
ESMCOMMONSERVICE[0XC0000932]
OobManagement
[PET] 0x000A0102
[PET] 0x000A0104
[PET] 0x000A0109
[PET] 0x000A010B
[PET] 0x00040102
[PET] 0x00040104
[PET] 0x00040109
[PET] 0x0004010B
[PET] 0x00040301
Predictive
alert : FAN /
Cooling device
failure
Diagnose
the Sensor /
Set Faulted
Status
Event Name
Report Source
Event
Event
Handler
(Default)
Settings
Name
(Default)
SystemMonitorEvent
ESMCOMMONSERVICE[0XC00000D0]
ESMCOMMONSERVICE[0XC00000D2]
ESMCOMMONSERVICE[0XC00000D6]
ESMCOMMONSERVICE[0XC00000D8]
ESMCOMMONSERVICE[0XC00000C8]
Predictive
alert : Coolant
leak
OobManagement
[PET] 0x000A0702
SystemMonitorEvent
ESMCOMMONSERVICE[0XC0000A8C]
Clear alert :
chassis
temperature
failure recovery
OobManagement
[PET] 0x80010102
[PET] 0x80010109
[PET] 0x00010701
SystemMonitorEvent
ESMCOMMONSERVICE[0X8000006B]
ESMCOMMONSERVICE[0X8000006A]
ESMLOCALPOLLING[0X8000006A]
ESMCOMMONSERVICE[0X8000093F]
OobManagement
[PET] 0x80020102
[PET] 0x80020109
[PET] 0x00020701
SystemMonitorEvent
ESMCOMMONSERVICE[0X800001FE]
ESMCOMMONSERVICE[0X80000204]
ESMCOMMONSERVICE[0X8000090F]
OobManagement
[PET] 0x800A0102
[PET] 0x800A0109
[PET] 0x80040102
[PET] 0x80040109
[PET] 0x00040701
[PET] 0x000A0701
SystemMonitorEvent
ESMCOMMONSERVICE[0X800000D1]
ESMCOMMONSERVICE[0X800000D7]
ESMCOMMONSERVICE[0X400002C3]
ESMCOMMONSERVICE[0X400000CD]
OobManagement
[PET] 0x80010100
[PET] 0x80010107
[PET] 0x80010301
[PET] 0x00010700
SystemMonitorEvent
ESMCOMMONSERVICE[0X40000068]
ESMCOMMONSERVICE[0X40000069]
ESMCOMMONSERVICE[0X40000908]
ESMCOMMONSERVICE[0X4000092F]
ESMCOMMONSERVICE[0X40000941]
ESMCOMMONSERVICE[0X40000943]
Clear alert :
voltage failure
recovery
Clear alert :
FAN / Cooling
device failure
recovery
Clear alert :
chassis
temperature
normal
recovery
no action
no action
no action
no action
Appendix A Network Ports and Protocols
Event Name
Report Source
Event
Event
Handler
(Default)
Settings
Name
(Default)
Clear alert :
voltage normal
recovery
Clear alert :
FAN / Cooling
device normal
recovery
*
OobManagement
[PET] 0x80020100
[PET] 0x80020107
[PET] 0x80020301
[PET] 0x00020700
SystemMonitorEvent
ESMCOMMONSERVICE[0X400001FC]
ESMCOMMONSERVICE[0X40000202]
ESMCOMMONSERVICE[0X40000902]
ESMCOMMONSERVICE[0X40000931]
ESMCOMMONSERVICE[0X40000BAD]
ESMCOMMONSERVICE[0X400001FA]
SystemMonitorEvent
OobManagement
[PET] 0x80040100
[PET] 0x80040107
[PET] 0x80040301
[PET] 0x00040700
[PET] 0x800A0100
[PET] 0x800A0107
[PET] 0x000A0700
SystemMonitorEvent
ESMCOMMONSERVICE[0X400000CF]
ESMCOMMONSERVICE[0X400000D5]
ESMCOMMONSERVICE[0X4000090D]
ESMCOMMONSERVICE[0X40000911]
ESMCOMMONSERVICE[0X40000B01]
ESMCOMMONSERVICE[0X400002C3]
ESMCOMMONSERVICE[0X400000CA]
ESMCOMMONSERVICE[0X400000CD]
ESMCOMMONSERVICE[0X40000945]
no action
no action
Suppression events of the Policy Property setting window cannot be set on the
above events.
Action settings that Event Handler Settings Name are "Diagnose the Sensor / Set
Faulted Status" are as follows:
Machine status / Set faulted status by sensor diagnosis
Notification/ E-mail, Event Log
Action settings that Event Handler Settings Name are "Move all running VMs on the VM
server" are as follows:
Notification/ E-mail, Event Log
Machine status / Set faulted status
Action for VMS / Move all running VMs on the VM server. (Failover)
Action settings that Event Handler Settings Name are "Move all running VMs / Server
shutdown" (for Standard Policy (VM Server ESXi), "Move all VMs on the VM server /
Server shutdown") are as follows:
For policies other than Standard Policy (VM Server ESXi)
•
Machine status / Set faulted status by sensor diagnosis
•
Notification/ E-mail, Event Log
•
Action for VMS / Move all running VMs on the VM server. (Migration, Failover)
•
Action for machine / Shutdown VM Server (Predictive)
* It must be executed after starting virtual machines.
For Standard Policy (VM Server ESXi)
•
Machine status / Set faulted status by sensor diagnosis
•
Notification/ E-mail, Event Log
•
Action for VMS / Move all VMs on the VM server (Quick Migration, Failover)
•
Action for VMS / Shutdown VM Server (Predictive)
* In the case of ESXi, the virtual machines that were Failovered are not started.
This action executes operations for the process of Failover which enables the next
startup of the virtual machines, but does not execute the startup operation.
Appendix A Network Ports and Protocols
Note:
▪ To detect OOB Management events, see Section 3.10, "Preparing for the Use of
Out-of-Band (OOB) Management" in SigmaSystemCenter Configuration Guide and
perform the procedures from Subsection 3.10.1, "Configuring IP Address of BMC" to
Subsection 3.10.3, "Configuring Alert Destination of PET and Alert Level." However,
OOB Management events cannot be detected from a managed machine where NEC
ESMPRO Agent is working.
▪ If you are using ESX (Linux), disable the shutdown function of a machine to be
monitored during an error occurrence, referring to Subsection 3.2.2, "Other Setting" in
NEC ESMPRO Agent (for Linux) User's Guide to use events of SystemMonitorEvent.
▪ If you are using Hyper-V (Windows), disable the shutdown function of a machine to
be monitored during the error occurrence by performing the following procedure:
1.
From Control Panel, double-click NEC ESMPRO Agent. Click the General tab and
Report Setting on the NEC ESMPRO Agent Properties dialog box to activate the
Alert Manager.
2.
Select Base Setting, located on the setting menu on the Alert Manager.
3.
Click the Function valid/invalid status on the setting of the time until shutdown,
located on the Other tab to change from green to red.
1.7. List of Policy Actions
In SigmaSystemCenter, you can customize actions for events of specified errors and
create a policy. SigmaSystemCenter provides the following actions.
Notification/ E-mail, Event Log
Machine status / Set ready status
Machine status / Set degraded status
Machine status / Set faulted status
Machine status / Set faulted status by sensor diagnosis
Machine status / Set ready status by HardwarePartsStatus diagnosis
Machine status / Set ready status by Total recover diagnosis
Action for machine / Startup machine
Action for machine / Reboot machine
Action for machine / Shutdown machine
Action for machine / Turn on LED
Action for machine / Turn off LED
Action for machine / Replace machine
Action for machine / Replace machine(Immediate Power OFF)
Action for machine / Diagnose and Power OFF
Action for Group / Scaleout Add a machine to the group
Action for Group / Scaleout Startup machines in the group
Action for Group / Create a machine to the group
Action for Group / Scalein Delete a machine from the group
Action for Group / Delete a virtual machine from the group
Action for Group / Scalein Suspend machines in the group
Action for Group / Scalein Shutdown machines in the group
Action for Group / Apply VM Optimized Placement Rule
Action for Group / Refill the reserved VM Server
Action for VMS / Move all running VMs on the VM server. (Failover)
Action for VMS / Move all running VMs on the VM server. (Migration)
Action for VMS / Move all running VMs on the VM server. (Migration, Failover)
Action for VMS / Move all VMs on the VM server. (Failover)
Action for VMS / Move all VMs on the VM server. (Migration, Failover)
Action for VMS / Move all VMs on the VM server. (Quick Migration, Failover)
Action for VMS / Power save VM server
Action for VMS / Load balance VM server
Action for VMS / Shutdown VM Server (Predictive)
Action for VMS / Apply VM Optimized Placement Rule
Execute Local Script
Reset of an action execution result
Appendix A Network Ports and Protocols
Note:
▪ Policy actions for moving a single virtual machine are abolished with
SigmaSystemCenter 2.0. In substitution, policy actions for Power save Virtual Machine
server and Load balance Virtual Machine Server are added,
If you were using the abolished policy actions before upgrading SigmaSystemCenter,
the policy actions are converted to No action.
▪ You need to note the point below for the actions:
Action for Group / Scalein Delete a machine from the group
Action for Group / Delete a virtual machine from the group
Action for Group / Scalein Suspend machines in the group
Action for Group / Scalein Shutdown machines in the group
Action for machine / Shutdown machine
Action for machine / Diagnose and Power OFF
If the number of machines normally running at the target group is under the specified
minimum number (set in the Min Running Machine Count box), the job ends normally
with warning and no action is executed. If zero is set in the Min Running Machine Count
box, there is a possibility that the number of machines normally activated reaches zero.
For details of the actions, see the following subsections.
Reference: For details of actions which are executed in the process of changing
machine configuration, see Section 1.5, "Changes in Machine Configuration" in
SigmaSystemCenter Overview Reference Guide.
1.7.1.
Notification/ E-mail, Event Log
Notifies detected contents and the start and result of actions by a policy by sending
emails and registering the event to the event logs.
Registering an event to the event logs and E-mail notification are commanded at the
timing of event detection, starting an action, or completing an action.
For details of setting E-mail destination address or other settings, see Subsection 2.4.2,
"Configuring the Mail Reporting" in SigmaSystemCenter Configuration Guide.
You cannot set E-mail notification and event log registration to each policy and event.
This action can be executed in parallel with other operations on the same machine.
The timings of notification, event log ID, and mail messages are as follows.
For the registration information according to event log ID, see Subsection 2.2.1, "Event
Logs of SystemProvisioning."
When receiving notification of an error
Event log ID: 502 and any of 530, 531, and 532
Mail message:
Received a notification. ("Report Information")
When starting process for an error
Event log ID: 502 and 540
Mail message:
The action ("Process Name") was started. Management ID:"Management ID"
When succeeding process for an error
Event log ID: 502 and 541
Mail message:
The action ("Process Name") has been completed. Management ID: "Management
ID"
When failing process for an error
Event log ID: 502 and 542
Mail message:
The action ("Process Name") was terminated because an error occurred.
Management ID: "Management ID"
When process for an error is canceled
Event log ID: 502 and 543
Mail message:
The action ("Process Name") has been canceled. Management ID: "Management
ID"
However, mail messages sent by System Policy (Manager) are as follows:
When receiving notification of an error
Event log ID: 502 and 536
Mail message:
found manager event
event number: "EventID"
manager name: "Manager Name"
event message: "Information"
Appendix A Network Ports and Protocols
Note:
▪ You are notified by SystemPolicy (Manager) only when receiving an event.
▪ Contents of notification by SystemPolicy (Manager) is defined in the following file,
stored in the SystemProvisioning installation folder:
SystemProvisioning installation folder\conf\PvmCustom.xml
1.7.2.
Machine Status / Set Ready Status
Configures the Hardware Status of a target machine to "Ready".
This action can be executed in parallel with other operations on the same machine.
1.7.3.
Machine Status / Set Degraded Status
Configures the Hardware Status of a target machine to "Degraded."
1.7.4.
Machine Status / Set Faulted Status
Configures the Hardware Status of t a target machine to "Faulted."
1.7.5.
Machine Status / Set Faulted Status by Sensor Diagnosis
This action obtains hardware sensor information and analyzes it.
It sets Hardware Status to "Faulted" and ends normally if a sensor is in critical state.
Additionally, this action does not change hardware status and ends abnormally if any
sensors have no problems. If the next action’s execution condition is "Success", the
next action will not be executed.
Sensors are displayed in the Sensor tab. To display the Sensor tab, click the Resource,
the Machine icon, and the IPMI information on Configuration menu. Then, click the
Sensor on the IPMI Information screen. If a sensor’s Exclude from sensor diagnosis
check box is not selected, the sensor is a target of the sensor diagnosis.
Note:
▪ To use this function correctly, see Subsection 1.5.2, "Sensor Diagnosis."
▪ You can see the detected sensor alerts at the Sensor tab, which is displayed by
clicking Resource - Machine icon - IPMI Information - Sensor. However, sensors with
problems might not be detected in the following cases:
▪ You collected sensor information after finishing the sensor diagnosis.
▪ You clicked the Refresh on the Sensor tab after finishing the sensor diagnosis.
▪ During the sensor diagnosis, "Faulted" status was set because the sensor could
not be read or BMC did not respond.
In the above cases, you cannot see the sensor alerts at the Sensor tab but you can see
logs of the sensor diagnosis at the Job List and the Event List instead. The Job List and
the Event List appear on the Main Window by clicking the Job on the Monitor view.
At the Job List, you can see the details of a job of sensor diagnosis by clicking an event
number link of the job. Also you can see it at the Event List in the same way.
1.7.6.
Machine
Status
/
Set
Ready
Status
by
HardwarePartsStatus Diagnosis
Checks that statuses relevant to a target machine in detail. If all the statuses are
normal, this action set Normal for the hardware status and ends normally.
If any not normal status exists, this action does not change the hardware status and
ends abnormally. The following action's execution condition is "Success", the action is
not executed.
Target statuses in detail are displayed in Resource - Machine Status Information -
Hardware Status (Status Detail) - Status List.
Reference: For details of hardware parts status diagnosis, see Subsection 1.5.3,
"Hardware Parts Status Diagnosis."
Appendix A Network Ports and Protocols
1.7.7.
Machine Status / Set Ready Status by Total Recover
Diagnosis
Diagnoses a target machine comprehensively based on the all statuses relevant to the
target machine (status as a virtual machine server, sensor status, and machine status
in detail). If this action judges the target machine is Normal, this action set Normal for
the hardware status and ends normally.
If this action judges the target machine is not normal, this action does not change the
hardware status and ends abnormally. If the following action's execution condition is
"Success", the action is not executed.
If the target machine is not a virtual machine server, diagnoses as a virtual machine
server are not executed. If the target machine is not managed by Out-of-Band
Management, the sensor diagnosis is not executed. In this case, this action judges the
status based on the results of available diagnoses.
Reference: For details of Total recover diagnosis, see Subsection 1.5.4, "Total
Recover Diagnosis."
1.7.8.
Action for Machine / Startup Machine
Starts a target machine.
1.7.9.
Action for Machine / Reboot Machine
Restarts a target machine.
1.7.10. Action for Machine / Shutdown Machine
Shuts down a target machine.
However, this action is not executed if there is only one machine that is running in not
faulted status, but powered ON status, left in a target group.
1.7.11. Action for Machine / Turn on LED
Requests a target machine to turn on the LED indicator.
This action can be executed in parallel with other operations on the same machine.
1.7.12. Action for Machine / Turn off LED
Requests a target machine to turn off the LED indicator.
This action can be executed in parallel with other operations on the same machine.
1.7.13. Action for Machine / Replace Machine
Replaces a target machine with a machine standing by in a pool or shared pool.
If SystemProvisioning failed to shut down the target machine, SystemProvisioning
executes Power OFF to the machine immediately.
The replaced machine is stood by in a group pool.
1.7.14. Action for machine / Replace machine(Immediate Power
OFF)
Replaces a target machine with a machine standing by in a pool or shared pool.
SystemProvisioning does not shut down the target machine and executes Power OFF
to the machine immediately.
The replaced machine is stood by in a group pool.
1.7.15. Action for machine / Diagnose and Power OFF
Diagnoses status of a target machine and if the machine can be powered off, executes
Power OFF to the machine immediately.
First, this action diagnoses whether SystemProvisioning can recover the failed
machine or not by the diagnosis function in detail. If the failed machine is a virtual
machine server (VMware or XenServer), SystemProvisioning executes the function.
By the result of diagnosis, if SystemProvisioning judges that the machine does not
need the recovery process or that SystemProvisioning should not execute the recovery
process at the timing because of the circumstances, the process ends with an error. If
SystemProvisioning judges that there is a possibility of recovery of the machine,
SystemProvisioning starts the Power OFF process of the failed machine to recover the
machine.
In the Power OFF process, SystemProvisioning checks whether it can connect to a
failed virtual machine server or not firstly, and if SystemProvisioning cannot connect to
the virtual machine server, the power control through DPM shuts down powered on
virtual machines on the virtual machine server. This shut down is for keeping the virtual
machines as safe as possible, supposing the status that although the management
server cannot access to the virtual machine server, the virtual machine server is not
actually down.
Appendix A Network Ports and Protocols
Secondly, SystemProvisioning executes ACPI shutdown on the failed machine. If it fails,
SystemProvisioning executes Power OFF to the failed machine and completes the
process for recovery process to be executed. If it fails the Power OFF process,
SystemProvisioning completes the process with Warning output to the Operations log
because there is a possibility of succeeding the following recovery processes.
If a failed machine is not a virtual machine server (VMware or XenServer),
SystemProvisioning does not execute the diagnosis process, shuts down the machine,
and completes the process. If it fails the execution of shut down, it executes Power
OFF. After executing Power OFF, SystemProvisioning completes the process
regardless of the execution result of Power OFF.
Reference: For the details of the diagnosis function, see Section 1.5, "About
Diagnosis."
1.7.16. Action for Group / Scaleout Add a Machine to the Group
Adds a machine in a target group to activate the machine.
1.7.17. Action for Group / Scaleout Startup Machines in the
Group
Starts up stopped machines in the machines that are added to a target group by
allocating a host to a resource.
1.7.18. Action for Group / Create a Machine to the Group
Creates and adds a machine (virtual machines) in a target group to activate the
machine.
1.7.19. Action for Group / Scalein Delete a Machine From the
Group
Deletes or stops one machine running in a target group according to the setting of a
target group.
The deleted machine is moved to a pool.
1.7.20. Action for Group / Delete a Virtual Machine From the
Group
Deletes a running machine (virtual machine) in the corresponding operation group.
Completely deletes the machine.
If a virtual machine server is being stopped, this action starts up the virtual machine
server to delete. If a policy with a power save event is applied for a virtual machine
server, the virtual machine server is shut down after the power save event occurs. In
other cases, delete virtual machines on a target virtual machine server and shut down
the virtual machine server when the virtual machine server starts up.
1.7.21. Action for Group /
Scalein Suspend Machines in the
Group
Suspends a machine running in a target group according to the setting of the target
group.
1.7.22. Action for Group / Scalein Shutdown Machines in the
Group
Stops a machine running in a target group according to the setting of the target group.
1.7.23. Action for Group / Apply VM Optimized Placement Rule
Relocates running virtual machines according to the Optimized Placement Rule on a
virtual machine server running in a target group.
If virtual machines are constrained on stopped virtual machine servers by the
Optimized Placement Rule, SystemProvisioning starts the corresponding virtual
machine servers and moves the virtual machines.
Operations are not executed to virtual machines to which the Optimized Placement
Rule is not set.
1.7.24. Action for Group / Refill the Reserved VM Server
Starts up a virtual machine server running on a target virtual machine model so that it
satisfies the condition of a spare machine in the Optimized Placement setting.
Appendix A Network Ports and Protocols
The spare virtual machine servers are selected from the ones on which no virtual
machine is running and not in failure status or maintenance status.
The number of spare machines is the value of "Specify the number of machines to
leave powered on even if they have no running VMs in order to respond quickly to load
changes. (Power Saving)" in Optimized Placement.
This action is enabled only for events detected in a virtual machine server.
"Action for VMS / Power Save VM server" has the same functions as this action, setting
both actions for one event is not recommended.
1.7.25. Action for VMS / Move all running VMs on the VM server.
(Failover)
Moves a virtual machine running on a target virtual machine server to other virtual
machine server.
As the moving method, Failover is used.
This action is only valid for events detected on virtual machine servers.
In addition, if the target virtual machine server is Pool Master of XenServer and the
machine is stopped, SystemProvisioning executes the process of switching Pool
Master with other virtual machine server.
1.7.26. Action for VMS / Move all running VMs on the VM server.
(Migration)
Moves a virtual machine running on a target virtual machine server to other virtual
machine server.
As the moving method, Migration is used.
This action is only valid for events detected on virtual machine servers.
In addition, if the target virtual machine server is Pool Master of XenServer and the
machine is stopped, SystemProvisioning executes the process of switching Pool
Master with other virtual machine server.
1.7.27. Action for VMS / Move all running VMs on the VM server.
(Migration, Failover)
Moves a virtual machine running on a target virtual machine server to other virtual
machine server.
As the moving method, Migration is used. If Migration fails, Failover is used.
This action is only valid for events detected on virtual machine servers.
In addition, if the target virtual machine server is Pool Master of XenServer and the
machine is stopped, SystemProvisioning executes the process of switching Pool
Master with other virtual machine server.
1.7.28. Action for VMS / Move all VMs on the VM server. (Failover)
Moves all virtual machines on a target virtual machine server to other virtual machine
server.
As the moving method, Failover is used.
This action is only valid for events detected on virtual machine servers.
In addition, if the target virtual machine server is Pool Master of XenServer and the
machine is stopped, SystemProvisioning executes the process of switching Pool
Master with other virtual machine server.
1.7.29. Action for VMS / Move all VMs on the VM server.
(Migration)
Moves all virtual machines on a target virtual machine server to other virtual machine
server.
As the moving method, Migration is used.
This action is only valid for events detected on virtual machine servers.
In addition, if the target virtual machine server is Pool Master of XenServer and the
machine is stopped, SystemProvisioning executes the process of switching Pool
Master with other virtual machine server.
1.7.30. Action for VMS / Move all VMs on the VM server.
(Migration, Failover)
Moves all virtual machines on a target virtual machine server to other virtual machine
server.
As the moving method, Migration is used. If Migration fails, Failover is used.
This action is only valid for events detected on virtual machine servers.
In addition, if the target virtual machine server is Pool Master of XenServer and the
machine is stopped, SystemProvisioning executes the process of switching Pool
Master with other virtual machine server.
Appendix A Network Ports and Protocols
1.7.31. Action for VMS / Move all VMs on the VM Server. (Quick
Migration, Failover)
Moves all virtual machines on a target virtual machine server to another virtual machine
server.
As the moving method, Quick Migration is used. If Quick Migration fails, Failover is
used.
This action is only valid for events detected on virtual machine servers.
In addition, if the target virtual machine server is Pool Master of XenServer and the
machine is stopped, SystemProvisioning executes the process of switching Pool
Master with another virtual machine server.
1.7.32. Action for VMS / Power Save VM server
Relocates a virtual machine on a virtual machine server, Move Virtual Machine,
according to the load status (low load) of the virtual machine server.
If a running virtual machine no longer exists after the relocation, stops the virtual
machine server to save power.
This action is implemented as an Optimized Placement action for the detected low load
of virtual machine server event (Report Source: SystemMonitorPerf, and Event ID:
11000007).
1.7.33. Action for VMS / Load Balance VM server
Relocates a virtual machine on a virtual machine server, Move Virtual Machine,
according to the load status (high load) of the virtual machine server to alleviate the
load.
If SystemProvisioning concludes that the load is not alleviated only with the running
virtual machine server, SystemProvisioning starts a stopped virtual machine server to
allocate virtual machines.
This action is implemented as an Optimized Placement action for the detected high
load of virtual machine server event (Report Source: SystemMonitorPerf, and Event ID:
11000006).
1.7.34. Action for VMS / Apply VM Optimized Placement Rule
Relocates virtual machines running on a target virtual machine server according to the
Optimized Placement Rule.
The target of this relocating is virtual machines which exists in another virtual machine
server and is pinned to the target virtual machine server, and also a virtual machine
which exists in the target virtual machine server and does not satisfy the Optimized
Placement Rule.
This action does not execute any operations for virtual machines to which the
Optimized Placement Rule is not set.
1.7.35. Action for VMS / Shutdown VM Server(Predictive)
Shut down the target virtual machine server.
However, if SystemProvisioning action judges that stopping the target virtual machine
is likely to cause a problem in management and control of SystemProvisioning, this
action is not executed. (For example, a target virtual machine server is Pool Master of
XenServer.)
1.7.36. Execute Local Script
Executes a local script to a corresponding machine or group.
A local script which will be executed with this action can be specified on the Action
Parameter Settings window. For how to set the setting, see Subsection 4.10.6,
"Configuring Event Handler Settings of a Policy Monitoring Event" in
SigmaSystemCenter Configuration Guide.
If you changed the local script name itself, specify its parameter (script file name) on
the Action Parameter Settings window again.
1.7.37. Reset of an Action Execution Result
Even when actions which have been executed until this action actually end abnormally,
this action does not reflect such results to the execution results of the jobs.
Combine the execution result of an action, "Failed", to use this action.
2.
Logs
This chapter explains the logs that SigmaSystemCenter outputs.
This chapter contains the following sections:
•
•
•
2.1
2.2
2.3
Types of Logs ......................................................................................................... 120
Event Logs .............................................................................................................. 121
List of Log Files ....................................................................................................... 167
Appendix A Network Ports and Protocols
2.1. Types of Logs
There are the following logs that SystemProvisioning outputs:
Operations Log
The operational situation of SystemProvisioning is recorded.
You can see the Operations Log on the Operations Log window in the Monitor
view.
The operations log displayed on this window is stored in the database. If the
number of logs exceeds the maximum output number, logs are deleted from the
oldest one.
In addition, you can output the logs in csv using the ssc command.
Event Log
You can check the event logs on Application on the Event Viewer.
Debug Log
SystemProvisioning outputs debug logs for failure analysis into a file. For the list of
debug logs, see Section 2.3, "List of Log Files."
2.2. Event Logs
This section provides the lists of Event logs of SystemProvisioning are related to the
operation in SigmaSystemCenter.
Reference: For the Event logs of System Monitor - Performance Monitoring Services,
see Section 9.1, "The Event Log" in System Monitor - Performance Monitoring Services
User’s Guide.
The events in this section can be checked on Application on the Event Viewer started
by clicking the Start menu, clicking Control Panel, double-clicking Administrative Tools
from Control Panel, and double-clicking Event Viewer.
2.2.1.
Event Logs of SystemProvisioning
The followings are the event logs of SystemProvisioning. The event source name is
PVM.
Event
Description
Type
Meanings
Solution
101
The PVM service started.
Information
The PVM Service is
started.
Nothing
102
Failed to start the PVM
service.(Content: Failed to
start["information"])
Error
An error occurred when
starting the PVM Service.
"Information": A module
name that failed to start.
Collect a log and
restart the service.
ID
Failed to start the PVM service.
(Content: Failed to start)
105
Stopping the PVM operation.
Error
An error occurred when
stopping the PVM
Service.
Collect a log.
106
Terminates the PVM service by the
stop operation
Information
The PVM Service is
stopped by a stop
operation.
Nothing
107
Product License expires in "number
of remaining days" day(s).
Information
The product license that
you are using is for
evaluation and it is going
to be expired in a week.
Update the license to
a full support
version.
107
Product License has expired.
Information
The product license for
evaluation has expired.
Update the license to
a full support
version.
Appendix A Network Ports and Protocols
Event
Description
Type
Meanings
Solution
150
Transaction log of configuration
database exceeded file size("file
size"). (FileName:"file name")
Information
Transaction log expands.
The transaction log
might degrades the
system performance
use almost all the
disk space.
Stop
SystemProvisioning
and shrink the
transaction log.
502
*1
Received a notification.
("information")
Information
Received notification of
an action of the policy
that contains
"Notification/ E-mail,
Event Log."
"Information": Description
of the notification
Nothing
502
*1
found manager event
event number:"EventID"
manager name:"Manager Name"
event message:"Information"
Information
(Notification of monitoring
such as a disk capacity
detected by Manager)
Nothing
502
*1
The action ("information") was
started. Management
ID:"Management ID"
Information
Started an action of the
policy that contains
"Notification/ E-mail,
Event Log."
"Information": Information
of the action
"Management ID": The
management number of
the action
Nothing
502
*1
The action ("information") has been
completed. Management
ID:"Management ID"
Information
Completed an action of
the policy that contains
"Notification/ E-mail,
Event Log."
"Information": Information
of the action
"Management ID": The
management number of
the action
Nothing
502
*1
The action ("information") was
terminated because an error
occurred. Management
ID:"Management ID"
Information
Failed to run an action of
the policy that contains
"Notification/ E-mail,
Event Log."
"Information": Information
of the action
"Management ID": The
management number of
the action
Nothing
ID
"EventID" : event number
"Manager Name" :
manager name
"Information" : Event
message
Event
Description
Type
Meanings
Solution
502
*1
The action ("information") has been
canceled. Management
ID:"Management ID"
Information
An action of the policy
that contains
"Notification/ E-mail,
Event Log" is canceled.
"Information": Information
of the action
"Management ID": The
management number of
the action
Nothing
510
An event was detected.
Target is "Target"
Event is "Event Message"
------------------------------------* Additional information. (see the
table below this table.)
Information
Information level
detection occurred at the
target machine.
*2
Nothing
511
An event was detected.
Target is "Target"
Event is "Event Message"
------------------------------------* Additional information. (see the
table below this table.)
Warning
Warning level detection
occurred at the target
machine.
*2
Nothing
512
An event was detected.
Target is "Target"
Event is "Event Message"
------------------------------------* Additional information. (see the
table below this table.)
Warning
Error level detection
occurred at the target
machine.
*2
Nothing
520
An event was detected.
Target is "Target"
Event is "Event Message"
------------------------------------* Additional information. (see the
table below this table.)
Information
Information level
detection occurred at the
target VM.
(Not registered by
default.)
Nothing
521
An event was detected.
Target is "Target"
Event is "Event Message"
------------------------------------* Additional information. (see the
table below this table.)
Warning
Warning level detection
occurred at the target
VM.
(Not registered by
default.)
Nothing
522
An event was detected.
Target is "Target"
Event is "Event Message"
------------------------------------* Additional information. (see the
table below this table.)
Warning
Error level detection
occurred at the target
VM.
(Not registered by
default.)
Nothing
ID
Appendix A Network Ports and Protocols
Event
Description
Type
Meanings
Solution
530
Received a notification. ("Event
Message" : "Target")
------------------------------------* Additional information. (see the
table below this table.)
Information
Information detection,
such as normalization set
to be monitored in a
policy, occurred at the
target machine.
Nothing
531
Received a notification. ("Event
Message" : "Target")
------------------------------------* Additional information. (see the
table below this table.)
Warning
Warning level detection
set to be monitored in a
policy occurred at the
target machine.
Nothing
532
Received a notification. ("Event
Message" : "Target")
------------------------------------* Additional information. (see the
table below this table.)
Warning
Error level detection,
such as normalization set
to be monitored in a
policy, occurred at the
target machine.
Nothing
536
found manager event
event number:"Event ID"
manager name:"Manager Name"
event message:"Event Message"
------------------------------------* Additional information. (see the
table below this table.)
Information
Information detection,
such as normalization set
to be monitored in a
policy, occurred at the
manager.
Nothing
537
found manager event
event number:"Event ID"
manager name:"Manager Name"
event message:"Event Message"
------------------------------------* Additional information. (see the
table below this table.)
Warning
Warning level detection
set to be monitored in a
policy occurred at the
manager.
(Not registered by
default.)
Nothing
538
found manager event
event number:"Event ID"
manager name:"Manager Name"
event message:"Event Message"
------------------------------------* Additional information. (see the
table below this table.)
Warning
Warning level detection
set to be monitored in a
policy occurred at the
manager.
(Not registered by
default.)
Nothing
540
The action ("Infomation") was
started. Management
ID:"Management ID"
------------------------------------* Additional information (see below)
Information
An action as an
autonomous control is
executed.
"Information": information
of the action
"Management ID":
Management ID of the
action
Nothing
ID
Event
Description
Type
Meanings
Solution
541
The action ("Infomation") has been
completed.Management
ID:"Management ID"
------------------------------------* Additional information. (see the
table below this table.)
Information
An action as an
autonomous control ends
successfully.
"Information": information
of the action
"Management ID":
Management ID of the
action
Nothing
542
The action ("Infomation") was
terminated because an error
occurred.Management
ID:"Management ID"
------------------------------------* Additional information. (see the
table below this table.)
Warning
An action as an
autonomous control ends
abnormally.
"Information": information
of the action
"Management ID":
Management ID of the
action
Nothing
543
The action ("Infomation") has been
canceled. Management
ID:"Management ID"
------------------------------------* Additional information. (see the
table below this table.)
Information
An action as an
autonomous control is
cancelled.
"Information": information
of the action
"Management ID":
Management ID of the
action
Nothing
2000
An exception occurred in the action
sequence execution management.
Description="description"
Error
An internal error occurred
in the action sequence
execution management
process.
Reading a registry
may have failed.
Check if the product
is installed properly.
2010
Could not load the action sequence
module that failed to register parts.
Parts name="part name"
Cause="cause"
Error
An internal error occurred
in the action sequence
execution management
process.
The process of
starting the service
may have failed.
Check if the product
is installed properly.
2012
Failed to read the action sequence
file. Cannot execute action
sequence. Action sequence
name:"name" Cause="cause"
Error
Cannot execute an action
sequence because the
system cannot find the
action sequence.
The action sequence
file does not exist.
Check if the file is in
a folder
SystemProvisioning
installation
path\ActionSequenc
e.
2021
Started the action starting up the
machine. Management
ID:"Management ID" Machine to be
started up.("machine name")
Information
Starts a machine.
Nothing
2022
Completed the action starting up the
machine. Management
ID:"Management ID" Machine to be
started up.("machine name")
Information
Completed starting a
machine.
Nothing
ID
Appendix A Network Ports and Protocols
Event
Description
Type
Meanings
Solution
2023
Aborted the action starting up the
machine. Management
ID:"Management ID" Machine to be
started up.("machine name")
Warning
Failed to start a machine.
The process of
starting the machine
has failed. Check the
cause in the
SystemProvisioning
log, remove the
cause, and execute
the process again.
2024
Canceled the action starting up the
machine. Management
ID:"Management ID" Machine to be
started up.("machine name")
Information
Starting a machine is
canceled.
Nothing
2025
Started the action shutting down the
machine. Management
ID:"Management ID" Machine to be
shut down.("machine name")
Information
Shuts down a machine.
Nothing
2026
Completed the action shutting down
the machine. Management
ID:"Management ID" Machine to be
shut down.("machine name")
Information
Shutting down a machine
completed.
Nothing
2027
Aborted the action shutting down the
machine. Management
ID:"Management ID" Machine to be
shut down.("machine name")
Warning
Failed to shut down a
machine.
The process of
shutting down the
machine has failed.
Check the cause in
the
SystemProvisioning
log, remove the
cause, and execute
the process again.
2028
Canceled the action shutting down
the machine. Management
ID:"Management ID" Machine to be
shut down.("machine name")
Information
Shutting down a machine
is canceled.
Nothing
2029
Started the action rebooting the
machine. Management
ID:"Management ID" The rebooting
machine.("machine name")
Information
Restarts a machine.
Nothing
2030
Completed the action rebooting the
machine. Management
ID:"Management ID" The rebooting
machine.("machine name")
Information
Completed restarting a
machine.
Nothing
2031
Aborted the action rebooting the
machine. Management
ID:"Management ID" The rebooting
machine.("machine name")
Warning
Failed to restart a
machine.
The process of
restarting the
machine has failed.
Check the cause in
the
SystemProvisioning
log, remove the
cause, and execute
the process again.
2032
Canceled the action rebooting the
machine. Management
ID:"Management ID" The rebooting
machine.("machine name")
Information
Restarting a machine is
canceled.
Nothing
ID
Event
Description
Type
Meanings
Solution
2033
Started the action adding the
machine to the group. Management
ID:"Management ID" The machine
which is waiting to the pool of a
group.("machine name") The group
which works a machine.("group
name")
Information
Adds a machine to a
group and start the
machine.
Nothing
2034
Completed the action adding the
machine to the group. Management
ID:"Management ID" The machine
which is waiting to the pool of a
group.("machine name")
Information
Completed a process of
adding a machine to a
group.
Nothing
2035
Aborted the action adding the
machine to the group. Management
ID:"Management ID" The machine
which is waiting to the pool of a
group.("machine name") The group
which works a machine.("group
name")
Warning
Failed to add a machine
to a group.
Activating the
machine in the group
has failed. Check the
cause in the
SystemProvisioning
log, remove the
cause, and execute
the process again. If
a machine with the
status displayed as
Error in the group,
delete the machine
from the group,
remove the cause of
the error, and then,
register the machine
to the group again.
2036
Canceled the action adding the
machine to the group. Management
ID:"Management ID" The machine
which is waiting to the pool of a
group.("machine name")
Information
Adding a machine to a
group Is canceled.
Nothing
2037
Started the action removing a
running machine from the group.
Management ID:"Management ID"
Machine to be running in the
group.("machine name") The group
in which the machine is
running.("group name")
Information
Makes a machine
running in a group stand
by.
Nothing
Started the action deleting substance
of the virtual machine from the group.
Management ID:"Management ID"
Machine to delete which is running in
the group.("machine name") The
group in which the machine is
running.("group name")
Information
Deletes a machine
(virtual machine) running
in a group from the
group, and delete the
resource.
Nothing
Completed the action removing a
running machine from the group.
Management ID:"Management ID"
Machine to be running in the
group.("machine name")
Information
Completed a process of
making a machine
running in a group stand
by,
Nothing
ID
2038
Appendix A Network Ports and Protocols
Event
Description
Type
Meanings
Solution
Completed the action deleting
substance of the virtual machine from
the group. Management
ID:"Management ID"
Information
Completed a process of
deleting a machine
(virtual machine) running
in a group from the group
and deleting the
resource.
Nothing
Aborted the action removing a
running machine from the group.
Management ID:"Management ID"
Warning
Failed to make a
machine running in a
group stand by,
The process of
making the machine
running in a group
stand by has failed.
Check the cause in
the
SystemProvisioning
log, remove the
cause, and execute
the process again.
Aborted the action deleting
substance of the virtual machine from
the group. Management
ID:"Management ID"
Warning
Failed to delete a
machine (virtual
machine) running in a
group from the group and
deleting the resource.
The process of
making the machine
running in a group
stand by has failed.
Check the cause in
the
SystemProvisioning
log, remove the
cause, and execute
the process again
Canceled the action removing a
running machine from the group.
Management ID:"Management ID"
Information
Making a machine
running in a group stand
by is canceled,
Nothing
Canceled the action deleting
substance of the virtual machine from
the group. Management
ID:"Management ID"
Information
Deleting a machine
(virtual machine) running
in a group from the group
and deleting the resource
is canceled.
Nothing
2042
Started the action replacing the
specified machine to standby
machine. Management
ID:"Management ID" Source
machine.("machine name")
Information
Replaces a machine
running in a group with a
stand by machine.
Nothing
2043
Completed the action replacing the
specified machine to standby
machine. Management
ID:"Management ID" Source
machine.("machine name")
Destination machine.("machine
name")
Information
Completed replacing a
machine running in a
group with a stand by
machine.
Nothing
ID
2040
2041
Event
Description
Type
Meanings
Solution
2044
Aborted the action replacing the
specified machine to standby
machine. Management
ID:"Management ID" Source
machine.("machine name")
Warning
Failed to replace a
machine running in a
group with a stand by
machine.
Replacing a machine
running in a group
with a stand by
machine has failed.
Check the cause in
the
SystemProvisioning
log, remove the
cause, and execute
the process again. If
a machine with the
status displayed as
Error in the group,
delete the machine
from the group,
remove the cause of
the error, and then,
register the machine
to the group again.
2045
Canceled the action replacing the
specified machine to standby
machine. Management
ID:"Management ID" Source
machine.("machine name")
Information
Replacing a machine
running in a group with a
stand by machine is
canceled.
Nothing
2050
Started the action changing the use
of a machine. Management
ID:"Management ID" Use change
machine.("machine name") Use
change former group.("group name")
Use change place group.("group
name")
Information
Changes a usage of a
machine.
Nothing
2051
Completed the action changing the
use of a machine. Management
ID:"Management ID" Use change
machine.("machine name")
Information
Completed changing a
usage of a machine.
Nothing
2052
Aborted the action changing the use
of a machine. Management
ID:"Management ID"
Warning
Failed to change a usage
of a machine.
Changing a usage of
the machine running
in the group to that of
other group has
failed. Check the
cause in the
SystemProvisioning
log, remove the
cause, and execute
the process again. If
a machine with the
status displayed as
Error in the group,
delete the machine
from the group,
remove the cause of
the error, and then,
register the machine
to the group again.
2053
Canceled the action changing the
use of a machine. Management
ID:"Management ID"
Information
Changing a usage of a
machine is canceled.
Nothing
ID
Appendix A Network Ports and Protocols
Event
Description
Type
Meanings
Solution
2054
Started the action creating a virtual
machine and adding it to the group.
Management ID:"Management ID"
VM to create("machine name") The
group which works a machine("group
name") The machine definition of VM
to create("host name")
Information
Creates a machine in a
group,
Nothing
2055
Completed the action creating a
virtual machine and adding it to the
group. Management
ID:"Management ID" the created
VM("machine name")
Information
Completed creating a
machine in a group.
Nothing
2056
Aborted the action creating a virtual
machine and adding it to the group.
Management ID:"Management ID"
the created VM("machine name")
Warning
Failed to create a
machine in a group.
Creating a machine
in a group has failed.
Check the cause in
the
SystemProvisioning
log, remove the
cause, and execute
the process again. If
a machine with the
status displayed as
Error in the group,
delete the machine
from the group,
remove the cause of
the error, and then,
register the machine
to the group again.
2057
Canceled the action creating a virtual
machine and adding it to the group.
Management ID:"Management ID"
the created VM("machine name")
Information
Creating a machine in a
group is canceled.
Nothing
2062
Started the action Move/Failover VM.
Management ID:"Management ID"
Target VM.("machine name")
Migration/QuickMigration.("True" or
"False") Move. ("True" or "False")
Failover. ("True" or "False")
Information
Moves a virtual machine
in a group. You can
execute this process only
for a virtual machine.
Nothing
2063
Completed the action Move/Failover
VM. Management ID:"Management
ID" VM for movement.("machine
name")
Information
Completed moving a
virtual machine in a
group. You can execute
this process only for a
virtual machine.
Nothing
2064
Aborted the action Move/Failover
VM. Management ID:"Management
ID"
Warning
Failed to move a virtual
machine in a group. You
can execute this process
only for a virtual machine.
Moving a virtual
machine in a group
has failed. Check the
cause in the
SystemProvisioning
log, remove the
cause, and execute
the process again.
2065
Canceled the action Move/Failover
VM. Management ID:"Management
ID"
Information
Moving a virtual machine
in a group is canceled.
You can execute this
process only for a virtual
machine.
Nothing
ID
Event
Description
Type
Meanings
Solution
2066
Started the action Move/Failover
VMs on the specified VM Server.
Management ID:"Management ID"
Source VM Server.("machine name")
Migration/QuickMigration.("True" or
"False") Move. ("True" or "False")
Failover. ("True" or "False")
Information
Execute Move or Failover
a virtual machine on a
virtual machine server.
Nothing
2067
Completed the action Move/Failover
VMs on the specified VM Server.
Management ID:"Management ID"
Source VM Server.("machine name")
Information
Completed Move or
Failover a virtual
machine on a virtual
machine server.
Nothing
2068
Aborted the action Move/Failover
VMs on the specified VM Server.
Management ID:"Management ID"
Source VM Server.("machine name")
Warning
Failed to Move or
Failover a virtual
machine on a virtual
machine server.
Moving a virtual
machine in a group
has failed. Check the
cause in the
SystemProvisioning
log, remove the
cause, and execute
the process again.
2069
Move/Failover VMs on the specified
VM Server. Management
ID:"Management ID" Source VM
Server.("machine name")
Information
Move or Failover a virtual
machine on a virtual
machine server is
canceled.
Nothing
2070
Started the action distributing
software to the machine.
Management ID:"Management ID"
Machine to distribute a
software.("machine name")
Information
Distributes software to a
machine.
Nothing
2071
Completed the action distributing
software to the machine.
Management ID:"Management ID"
Information
Completed distributing
software to a machine.
Nothing
2072
Aborted the action distributing
software to the machine.
Management ID:"Management ID"
Warning
Failed to distribute
software to a machine.
Distributing software
to a machine has
failed. Check the
cause in the
SystemProvisioning
log, remove the
cause, and execute
the process again.
2073
Canceled the action distributing
software to the machine.
Management ID:"Management ID"
Information
Distributing software to a
machine is canceled.
Nothing
2074
Started the action distributing
software to all machines in the group.
Management ID:"Management ID"
Group to distribute a
software.("group name")
Information
Distributes software to all
machines in a group.
Nothing
2075
Completed the action distributing
software to all machines in the group.
Management ID:"Management ID"
Group to distribute a
software.("group name")
Information
Completed distributing
software to all machines
in a group.
Nothing
ID
Appendix A Network Ports and Protocols
Event
Description
Type
Meanings
Solution
2076
Aborted the action distributing
software to all machines in the group.
Management ID:"Management ID"
Group to distribute a
software.("group name")
Warning
Failed to distribute
software to all machines
in a group.
Distributing software
to all machines in a
group has failed.
Check the cause in
the
SystemProvisioning
log, remove the
cause, and execute
the process again.
2077
Canceled the action distributing
software to all machines in the group.
Management ID:"Management ID"
Group to distribute a
software.("group name")
Information
Distributing software to
all machines in a group is
canceled.
Nothing
2079
The number of NICs ("number of
NICs") physically implemented to
machine ("machine name") and the
number of NICs ("number of NICs")
in the host setting ("host name") do
not match. Confirm your host setting.
Warning
The number of NICs on a
machine and that of the
Host Setting are different.
Check if the number
of NICs on a
machine is different
from the number of
NICs on the Host
Setting.
2080
Started the action suspending the
machine. Management
ID:"Management ID" The machine to
suspend.("machine name")
Information
Suspends a machine.
Nothing
2081
Completed the action suspending the
machine. Management
ID:"Management ID" The machine to
suspend.("machine name")
Information
Completed suspending a
machine.
Nothing
2082
Aborted the action suspending the
machine. Management
ID:"Management ID" The machine to
suspend.("machine name")
Warning
Failed to suspend a
machine.
A process of
suspending the
machine has failed.
Check the cause in
the
SystemProvisioning
log, remove the
cause, and execute
the process again.
2083
Canceled the action suspending the
machine. Management
ID:"Management ID" The machine to
suspend.("machine name")
Information
Suspending a machine is
canceled.
Nothing
2085
Failed to update status of the
Machine("machine name").
Information
A machine which status
is used is found when
checking the information
of starting the service.
(If an action
regarding the
machine was being
executed at the time,
this message is not
an error.)
2086
Started the action Power on the
machine. Management
ID:"Management ID" Machine to be
power on.("machine name")
Information
Powers on a machine.
Nothing
2087
Completed the action Power on the
machine. Management
ID:"Management ID" Machine to be
power on.("machine name")
Information
Completed powering ON
a machine.
Nothing
ID
Event
Description
Type
Meanings
Solution
2088
Aborted the action Power on the
machine. Management
ID:"Management ID" Machine to be
power on.("machine name")
Warning
Failed to power ON a
machine.
A process of
powering ON the
machine has failed.
Check the cause in
the
SystemProvisioning
log, remove the
cause, and execute
the process again.
2089
Canceled the action Power on the
machine. Management
ID:"Management ID" Machine to be
power on.("machine name")
Information
Powering ON a machine
is canceled.
Nothing
2090
Started the action Power off the
machine. Management
ID:"Management ID" Machine to be
power off.("machine name")
Information
Powers OFF a machine.
Nothing
2091
Completed the action Power off the
machine. Management
ID:"Management ID" Machine to be
power off.("machine name")
Information
Completed powering
OFF a machine.
Nothing
2092
Aborted the action Power off the
machine. Management
ID:"Management ID" Machine to be
power off.("machine name")
Warning
Failed to power OFF a
machine.
A process of
powering OFF the
machine has failed.
Check the cause in
the
SystemProvisioning
log, remove the
cause, and execute
the process again.
2093
Canceled the action Power off the
machine. Management
ID:"Management ID" Machine to be
power off.("machine name")
Information
Powering OFF a machine
is canceled.
Nothing
2094
Started the action resetting the
machine. Management
ID:"Management ID" The resetting
machine.("machine name")
Information
Resets a machine.
Nothing
2095
Completed the action resetting the
machine. Management
ID:"Management ID" The resetting
machine.("machine name")
Information
Completed resetting a
machine.
Nothing
2096
Aborted the action resetting the
machine. Management
ID:"Management ID" The resetting
machine.("machine name")
Warning
Failed to reset a
machine.
A process of
resetting the
machine has failed.
Check the cause in
the
SystemProvisioning
log, remove the
cause, and execute
the process again.
2097
Canceled the action resetting the
machine. Management
ID:"Management ID" The resetting
machine.("machine name")
Information
Resetting a machine is
canceled.
Nothing
ID
Appendix A Network Ports and Protocols
Event
Description
Type
Meanings
Solution
2098
Started the action Diagnose the
machine. Management
ID:"Management ID" Machine to be
Investigated.("machine name")
Information
Diagnoses a machine.
Nothing
2099
Completed the action Diagnose the
machine. Management
ID:"Management ID"
Information
Completed diagnosis.
Nothing
2100
Aborted the action Diagnose the
machine. Management
ID:"Management ID"
Warning
Failed to diagnose a
machine.
A process of
investigating the
machine has failed.
Check the cause in
the
SystemProvisioning
log, remove the
cause, and execute
the process again.
2101
Canceled the action Diagnose the
machine. Management
ID:"Management ID"
Information
Investigating a machine
is canceled.
Nothing
2102
Started the action Diagnose the
machine by Type. Management
ID:"Management ID" Machine to be
Investigated.("machine name")
Diagnosis type.("Type")
Information
Sensor diagnosis is
started.
Nothing
2103
Completed the action Diagnose the
machine by Type. Management
ID:"Management ID" Machine to be
Investigated.("machine name") (true)
Information
Sensor diagnosis is
completed. An error state
was detected. The state
is diagnosed as "faulted
status".
Nothing
2104
Aborted the action Diagnose the
machine by Type. Management
ID:"Management ID" Machine to be
Investigated.("machine name")
Warning
Sensor diagnosis is
completed.
Any errors were not
investigated in all the
sensors or the sensor
event occurred.
A process of
investigating the
hardware sensor status
is canceled.
Nothing
2105
Canceled the action Diagnose the
machine by Type. Management
ID:"Management ID" Machine to be
Investigated.("machine name")
Information
Sensor diagnosis is
canceled.
Nothing
2106
Started the action Power cycle the
machine. Management
ID:"Management ID" Machine to be
powercycled.("machine name")
Information
Power cycle of the
machine is started.
Nothing
2107
Completed the action Power cycle
the machine. Management
ID:"Management ID" Machine to be
powercycled.("machine name")
Information
Power cycle of the
machine is completed.
Nothing
ID
Event
Description
Type
Meanings
Solution
2108
Aborted the action Power cycle the
machine. Management
ID:"Management ID" Machine to be
powercycled.("machine name")
Warning
Power cycle of the
machine is aborted.
A process of Power
cycle of the machine
has failed. Check the
cause in the
SystemProvisioning
log, remove the
cause, and execute
the process again.
2109
Canceled the action Power cycle the
machine. Management
ID:"Management ID" Machine to be
powercycled.("machine name")
Information
Power cycle of the
machine is canceled.
Nothing
2110
Started the action Dump the
machine. Management
ID:"Management ID" Machine to be
dumped.("machine name")
Information
Dumping of the machine
is started.
Nothing
2111
Completed the action Dump the
machine. Management
ID:"Management ID" Machine to be
dumped.("machine name")
Information
Dumping of the machine
is completed.
Nothing
2112
Aborted the action Dump the
machine. Management
ID:"Management ID" Machine to be
dumped.("machine name")
Warning
Dumping of the machine
is failed.
A process of dump
the machine has
failed. Check the
cause in the
SystemProvisioning
log, remove the
cause, and execute
the process again.
2113
Canceled the action Dump the
machine. Management
ID:"Management ID" Machine to be
dumped.("machine name")
Information
Dumping of the machine
is canceled.
Nothing
2114
Started the action AcpiShutdown the
machine. Management
ID:"Management ID" Machine to be
acpishutdown.("machine name")
Information
AcpiShutdown of the
machine is started.
Nothing
2115
Completed the action AcpiShutdown
the machine. Management
ID:"Management ID" Machine to be
acpishutdown.("machine name")
Information
AcpiShutdown of the
machine is completed.
Nothing
2116
Aborted the action AcpiShutdown the
machine. Management
ID:"Management ID" Machine to be
acpishutdown.("machine name")
Warning
AcpiShutdown of the
machine is failed.
A process of
AcpiShutdown of the
machine has failed.
Check the cause in
the
SystemProvisioning
log, remove the
cause, and execute
the process again.
2117
Canceled the action AcpiShutdown
the machine. Management
ID:"Management ID" Machine to be
acpishutdown.("machine name")
Information
AcpiShutdown of the
machine is canceled.
Nothing
ID
Appendix A Network Ports and Protocols
Event
Description
Type
Meanings
Solution
2118
Started the action Turn on the LED of
machine. Management
ID:"Management ID" Machine to turn
on LED.("machine name")
Information
Turning on the LED of
the machine is started.
Nothing
2119
Completed the action Turn on the
LED of machine. Management
ID:"Management ID" Machine to turn
on LED.("machine name")
Information
Turning on the LED of
the machine is
completed.
Nothing
2120
Aborted the action Turn on the LED
of machine. Management
ID:"Management ID" Machine to turn
on LED.("machine name")
Warning
Turning on the LED of
the machine is Failed.
A process of tuning
on the LED of the
machine has failed.
Check the cause in
the
SystemProvisioning
log, remove the
cause, and execute
the process again.
2121
Canceled the action Turn on the LED
of machine. Management
ID:"Management ID" Machine to turn
on LED.("machine name")
Information
Turning on the LED of
the machine is canceled.
Nothing
2122
Started the action Turn off the LED of
machine. Management
ID:"Management ID" Machine to turn
off LED.("machine name")
Information
Turning off the LED of
the machine is started.
Nothing
2123
Completed the action Turn off the
LED of machine. Management
ID:"Management ID" Machine to turn
off LED.("machine name")
Information
Turning off the LED of
the machine is
completed.
Nothing
2124
Aborted the action Turn off the LED
of machine. Management
ID:"Management ID" Machine to turn
off LED.("machine name")
Warning
Turning off the LED of
the machine is failed.
A process of tuning
on the LED of the
machine has failed.
Check the cause in
the
SystemProvisioning
log, remove the
cause, and execute
the process again.
2125
Canceled the action Turn off the LED
of machine. Management
ID:"Management ID" Machine to turn
off LED.("machine name")
Information
Turning off the LED of
the machine is canceled.
Nothing
2126
Started the action Execute Load
Balancing for VM Server.
ID:"Management ID" Target VM
Server.("machine name")
Information
Load balancing for VM
Server is started.
Nothing
2127
Completed the action Execute Load
Balancing for VM Server.
ID:"Management ID" Target VM
Server.("machine name")
Information
Load balancing for VM
Server is completed.
Nothing
2128
Aborted the action Execute Load
Balancing for VM Server.
ID:"Management ID" Target VM
Server.("machine name")
Warning
Load balancing for VM
Server is failed.
Check the cause in
the
SystemProvisioning
log, remove the
cause.
ID
Event
Description
Type
Meanings
Solution
2129
Canceled the action Execute Load
Balancing for VM Server.
ID:"Management ID" Target VM
Server.("machine name")
Information
Load balancing for VM
Server is canceled.
Nothing
2130
Started the action Execute Power
Saving for VM Server
ID:"Management ID" Target VM
Server.("machine name")
Information
Power saving for VM
Server is started.
Nothing
2131
Completed the action Execute Power
Saving for VM Server
ID:"Management ID" Target VM
Server.("machine name")
Information
Power saving for VM
Server is completed.
Nothing
2132
Aborted the action Execute Power
Saving for VM Server
ID:"Management ID" Target VM
Server.("machine name")
Warning
Power saving for VM
Server is failed.
Check the cause in
the
SystemProvisioning
log, remove the
cause.
2133
Canceled the action Execute Power
Saving for VM Server
ID:"Management ID" Target VM
Server.("machine name")
Information
Power saving for VM
Server is canceled.
Nothing
2134
Started the action Apply VM
Optimized Placement Rule
ID:"Management ID" Target
Group.("group name") Target VM
Server.("host name")
Information
Apply VM Optimized
Placement Rule is
started.
Nothing
2135
Completed the action Apply VM
Optimized Placement Rule
ID:"Management ID" Target
Group.("group name") Target VM
Server.("host name")
Information
Apply VM Optimized
Placement Rule is
completed.
Nothing
2136
Aborted the action Apply VM
Optimized Placement Rule
ID:"Management ID" Target
Group.("group name") Target VM
Server.("host name")
Warning
Apply VM Optimized
Placement Rule is failed.
Check the cause in
the
SystemProvisioning
log, remove the
cause, and execute
the process again.
2137
Canceled the action Apply VM
Optimized Placement Rule
ID:"Management ID" Target
Group.("group name") Target VM
Server.("host name")
Information
Apply VM Optimized
Placement Rule is
canceled.
Nothing
2138
Started the action Composite
diagnosis and setting ready status
ID:"Management ID" Machine to be
diagnosed.("machine name")
Diagnosis Action
type.(RecoverCheck)
Information
Recover diagnosis is
started.
Nothing
2139
Completed the action Composite
diagnosis and setting ready status
ID:"Management ID" Machine to be
diagnosed.("machine name")
Diagnosis result.(True)
Information
Recover diagnosis is
completed.
Nothing
ID
Appendix A Network Ports and Protocols
Event
Description
Type
Meanings
Solution
2140
Aborted the action Composite
diagnosis and setting ready status
ID:"Management ID" Machine to be
diagnosed.("machine name")
Diagnosis result.(False)
Warning
Recover diagnosis is
failed.
Check the cause in
the
SystemProvisioning
log, remove the
cause, and execute
the process again.
2141
Canceled the action Composite
diagnosis and setting ready status
ID:"Management ID" Machine to be
diagnosed.("machine name")
Information
Recover diagnosis is
canceled.
Nothing
2142
Started the action shutting down
(predictive) for VM Server
ID:"Management ID" Target VM
Server.("host name")
Information
Shutting down a VM
Server is started.
Nothing
2143
Completed the action shutting down
(predictive) for VM Server
ID:"Management ID" Target VM
Server.("host name")
Information
Shutting down a VM
Server is completed.
Nothing
2144
Aborted the action shutting down
(predictive) for VM Server
ID:"Management ID" Target VM
Server.("host name")
Warning
Shutting down a VM
Server failed.
Check the cause in
the
SystemProvisioning
log, remove the
cause.
2145
Canceled the action shutting down
(predictive) for VM Server
ID:"Management ID" Target VM
Server.("host name")
Information
Shutting down a VM
Server is canceled.
Nothing
2146
Started the action refilling reserved
VM Server ID:"Management ID"
Target Group.("group name")
Information
Refilling reserved VM
Server is started.
Nothing
2147
Completed the action refilling
reserved VM Server
ID:"Management ID" Target
Group.("group name")
Information
Refilling reserved VM
Server is completed.
Nothing
2148
Aborted the action refilling reserved
VM Server ID:"Management ID"
Target Group.("group name")
Warning
Refilling reserved VM
Server failed.
Check the cause in
the
SystemProvisioning
log, remove the
cause.
2149
Canceled the action refilling reserved
VM Server ID:"Management ID"
Target Group.("group name")
Information
Refilling reserved VM
Server is canceled.
Nothing
2500
Software ("software name") will be
distributed to machine "machine
name".
Information
Distributes software to a
machine.
Nothing
2501
Failed to distribute software
("software name") to the machine
("machine name").
Error
Failed to distribute
software to a machine.
Distributing software
to a machine has
failed. Check the
cause in the log,
remove the cause,
and execute the
process again.
ID
Event
Description
Type
Meanings
Solution
2502
Software ("software name") has been
distributed to machine ("machine
name").
Information
Completed distributing
software to a machine.
Nothing
2652
VLAN ("VLAN name","port name") of
switch ("switch name") could not be
created.
Error
Failed to create a VLAN
of a switch.
Creating a VLAN of a
switch has failed.
Check the cause in
the log, remove the
cause, and execute
the process again.
2655
VLAN ("VLAN name") of switch
("switch name") could not be
removed.
Error
Failed to delete a VLAN
of a switch,
Deleting a VLAN of a
switch has failed.
Check the cause in
the log, remove the
cause, and execute
the process again.
2658
Port ("port name") could not be
registered to VLAN ("VLAN name") of
switch ("switch name").
Error
Failed to register a port to
a VLAN of a switch.
Registering a port to
a VLAN of a switch
has failed. Check the
cause in the log,
remove the cause,
and execute the
process again.
2659
Failed to remove port ("port name")
from VLAN ("VLAN name") because
it cannot connect to switch ("switch
name").
Error
Failed to remove a port
from a VLAN of a switch,
Removing a port
from a VLAN of a
switch has failed.
Check the cause in
the log, remove the
cause, and execute
the process again.
2666
VLAN ("VLAN name","port name") of
switch ("switch name") was created.
Information
Succeeded in creating a
VLAN of a switch,
Nothing
2667
VLAN ("VLAN name") of switch
("switch name") is not found.
Information
There is no VLAN of a
switch,
Nothing
2668
VLAN ("VLAN name") of switch
("switch name") was removed.
Information
Succeeded in deleting a
VLAN of a switch,
Nothing
2670
Port ("port name") was registered to
VLAN ("VLAN name") of switch
("switch name").
Information
Succeeded in registering
a port to a VLAN of a
switch,
Nothing
2671
Port ("port name") was removed from
VLAN ("VLAN name") of switch
("switch name").
Information
Succeeded in removing a
port from a VLAN of a
switch,
Nothing
2700
Startup for VM Server ("machine
name") was started.
ID:"Management ID"
Information
Starting up a VM Server
for Optimized Placement
or the action of Refilling
reserved VM Server was
started.
Nothing
2701
Startup for VM Server ("machine
name") was finished.
ID:"Management ID"
Information
Starting up a VM Server
for Optimized Placement
or the action of Refilling
reserved VM Server was
finished.
Nothing
ID
Appendix A Network Ports and Protocols
Event
Description
Type
Meanings
Solution
2702
Startup for VM Server ("machine
name") failed. ID:"Management ID"
Warning
Starting up a VM Server
for Optimized Placement
or the action of Refilling
reserved VM Server
failed.
Check the cause in
the
SystemProvisioning
log, remove the
cause.
2703
Shutdown for VM Server ("machine
name") was started.
ID:"Management ID"
Information
Shutting down a VM
Server for Optimized
Placement or the action
of shutting down
(predictive) for VM
Server was started.
Nothing
2704
Shutdown for VM Server ("machine
name") was finished.
ID:"Management ID"
Information
Shutting down a VM
Server for Optimized
Placement or the action
of shutting down
(predictive) for VM
Server was finished.
Nothing
2705
Shutdown for VM Server ("machine
name") failed. ID:"Management ID"
Warning
Shutting down a VM
Server for Optimized
Placement or the action
of shutting down
(predictive) for VM
Server failed.
Check the cause in
the
SystemProvisioning
log, remove the
cause.
2707
Either of the following messages is
displayed:
▪ Preparing failover for VM Server
("machine name") was started.
ID:"Management ID"
▪ Replacing master for VM
Server(from ("host name") to ("host
name")) was started.
ID:"Management ID"
Information
Preparing failover (or
Replacing master) for VM
Server was started.
Nothing
2708
Either of the following messages is
displayed:
▪ Preparing failover for VM Server
("machine name") was finished.
ID:"Management ID"
▪ Replacing master for VM
Server(from ("host name") to ("host
name")) was finished.
ID:"Management ID"
Information
Preparing failover (or
Replacing master) for VM
Server was finished.
Nothing
2709
Either of the following messages is
displayed:
▪ Preparing failover for VM Server
("machine name") failed.
ID:"Management ID"
▪ Replacing master for VM
Server(from ("host name") to ("host
name")) failed. ID:"Management ID"
Warning
Preparing failover (or
Replacing master) for VM
Server failed.
Check the cause in
the
SystemProvisioning
log, remove the
cause.
2720
*3
Information
Information of the action
of Load Balancing for VM
Server.
Nothing
ID
Event
Description
Type
Meanings
Solution
2721
*3
▪ There is no suitable VM server as
migration target. ID:"Management
ID"
▪ Load balancing is skipped because
the master ("machine name") is not
active.
Warning
Warning of the action of
Load Balancing for VM
Server.
Check the cause in
the
SystemProvisioning
log, remove the
cause.
2722
*3
Information
Information of the action
of Power Saving for VM
Server.
Nothing
2724
*3
Information
Information of the action
of Move all (running) VMs
on the VM server.
Nothing
2726
*3
Information
Information of the action
of Refilling reserved VM
Server.
Nothing
2727
Target group ("group name") is not
VM Server group. ID:"Management
ID"
Warning
The action of Refilling
reserved VM Server was
executed for Physical/VM
group.
The action of
Refilling reserved
VM Server is not
applicable to
Physical/VM group.
Check the policy
settings.
2728
*3
Information
Information of the action
of Shutting Down
(predictive) for VM
Server.
Nothing
2729
Shutdown is not allowed for VM
Server ("machine name").
ID:"Management ID"
Warning
If target VM Server is
shutting down, the
problem will occur in
management of
SigmaSystemCenter.
Check the trouble of
target VM Server,
and remove the
cause of the trouble.
2740
There is conflict in some restrictions.
ID:"Management ID"
Warning
There is conflict in some
rules for VM Optimized
Placement Rule.
Check the VM
Optimized
Placement Rule. See
Subsection 2.11.8,
"VM Optimized
Placement Rule" in
SigmaSystemCenter
Overview Reference
Guide.
2741
Following VMs may be remaining on
the VM Server ("host name") :
("machine name1, machine
name2, ...") ID:"Management ID"
Warning
Perhaps, some VMs
remains on the VM
Server for the action of
Move all (running) VMs
on the VM server.
Check the cause in
the
SystemProvisioning
log, remove the
cause.
2800
Start migrating the virtual
machine("Machine Name"). ("Migrate
Type") ManagementID:"Management
ID"
Information
Start migrating the virtual
machine.
Nothing
2801
Migrating the virtual
machine("Machine Name") to
("Migrate Type") has completed.
ManagementID:"Management ID"
Information
Completed migrating the
virtual machine.
Nothing
ID
Appendix A Network Ports and Protocols
Event
Description
Type
Meanings
Solution
2802
Failed to execute "Migrate Type" the
virtual machine("Machine Name").
Information
Failed to migrate the
virtual machine.
Check the cause in
the
SystemProvisioning
log, remove the
cause, and execute
the process again
2901
Failed to create the virtual machine.
The request for creating the virtual
machine failed. Cause:{0}
Error
Failed to create the
virtual machine.
An error occurred
when creating a
virtual machine.
Remove the cause
of the error and try
the operation again.
2903
Failed to delete the virtual machine.
The request for deleting the virtual
machine failed. Cause:{0}
Error
Failed to delete the
virtual machine.
An error occurred
when deleting a
virtual machine.
Remove the cause
of the error and try
the operation again.
3000
Started the action Add the
Datacenter.
Information
Started the action Add
the Datacenter.
Nothing
3001
Completed the action Add the
Datacenter.
Information
Completed the action
Add the Datacenter.
Nothing
3002
Canceled the action Add the
Datacenter.
Information
Canceled the action Add
the Datacenter.
Nothing
3003
Aborted the action Add the
Datacenter.
Warning
Aborted the action Add
the Datacenter.
Check the cause in
the
SystemProvisioning
log, remove the
cause, and execute
the process again.
3004
Started the action Add the disk array.
Information
Started the action Add
the disk array.
Nothing
3005
Completed the action Add the disk
array.
Information
Completed the action
Add the disk array.
Nothing
3006
Canceled the action Add the disk
array.
Information
Canceled the action Add
the disk array.
Nothing
3007
Aborted the action Add the disk
array.
Warning
Aborted the action Add
the disk array
Check the cause in
the
SystemProvisioning
log, remove the
cause, and execute
the process again.
3008
Started the action Register manager.
Information
Started the action
Register manager.
Nothing
3009
Completed the action Register
manager.
Information
Completed the action
Register manager.
Nothing
3010
Canceled the action Register
manager.
Information
Canceled the action
Register manager.
Nothing
ID
Event
Description
Type
Meanings
Solution
3011
Aborted the action Register
manager.
Warning
Aborted the action
Register manager.
Check the cause in
the
SystemProvisioning
log, remove the
cause, and execute
the process again.
3012
Started the action Add the virtual
machine server.
Information
Started the action Add
the virtual machine
server.
Nothing
3013
Completed the action Add the virtual
machine server.
Information
Completed the action
Add the virtual machine
server.
Nothing
3014
Canceled the action Add the virtual
machine server.
Information
Canceled the action Add
the virtual machine
server.
Nothing
3015
Aborted the action Add the virtual
machine server.
Warning
Aborted the action Add
the virtual machine
server.
Check the cause in
the
SystemProvisioning
log, remove the
cause, and execute
the process again.
3016
Started the action Delete SEL
records.
Information
Started the action Delete
SEL records.
Nothing
3017
Completed the action Delete SEL
records.
Information
Completed the action
Delete SEL records.
Nothing
3018
Canceled the action Delete SEL
records.
Information
Canceled the action
Delete SEL records.
Nothing
3019
Aborted the action Delete SEL
records.
Warning
Aborted the action Delete
SEL records
Check the cause in
the
SystemProvisioning
log, remove the
cause, and execute
the process again.
3020
Started the action Clone the virtual
machine.
Information
Started the action Clone
the virtual machine.
Nothing
3021
Completed the action Clone the
virtual machine.
Information
Completed the action
Clone the virtual
machine.
Nothing
3022
Canceled the action Clone the virtual
machine.
Information
Canceled the action
Clone the virtual
machine.
Nothing
3023
Aborted the action Clone the virtual
machine.
Warning
Aborted the action Clone
the virtual machine.
Check the cause in
the
SystemProvisioning
log, remove the
cause, and execute
the process again.
3024
Started the action Collect all data.
Information
Started the action Collect
all data.
Nothing
3025
Completed the action Collect all data.
Information
Completed the action
Collect all data.
Nothing
ID
Appendix A Network Ports and Protocols
Event
Description
Type
Meanings
Solution
3026
Canceled the action Collect all data.
Information
Canceled the action
Collect all data.
Nothing
3027
Aborted the action Collect all data.
Warning
Aborted the action
Collect all data.
Check the cause in
the
SystemProvisioning
log, remove the
cause, and execute
the process again.
3028
Started the action Collect data for
group.
Information
Started the action Collect
data for group.
Nothing
3029
Completed the action Collect data for
group.
Information
Completed the action
Collect data for group.
Nothing
3030
Canceled the action Collect data for
group.
Information
Canceled the action
Collect data for group.
Nothing
3031
Aborted the action Collect data for
group.
Warning
Aborted the action
Collect data for group.
Check the cause in
the
SystemProvisioning
log, remove the
cause, and execute
the process again.
3032
Started the action Collect data for
load balancer.
Information
Started the action Collect
data for load balancer.
Nothing
3033
Completed the action Collect data for
load balancer.
Information
Completed the action
Collect data for load
balancer.
Nothing
3034
Canceled the action Collect data for
load balancer.
Information
Canceled the action
Collect data for load
balancer.
Nothing
3035
Aborted the action Collect data for
load balancer.
Warning
Aborted the action
Collect data for load
balancer.
Check the cause in
the
SystemProvisioning
log, remove the
cause, and execute
the process again.
3036
Started the action Collect data for
manager.
Information
Started the action Collect
data for manager.
Nothing
3037
Completed the action Collect data for
manager.
Information
Completed the action
Collect data for manager.
Nothing
3038
Canceled the action Collect data for
manager.
Information
Canceled the action
Collect data for manager.
Nothing
3039
Aborted the action Collect data for
manager.
Warning
Aborted the action
Collect data for manager.
Check the cause in
the
SystemProvisioning
log, remove the
cause, and execute
the process again.
3040
Started the action Collect the
scenario.
Information
Started the action Collect
the scenario.
Nothing
3041
Completed the action Collect the
scenario.
Information
Completed the action
Collect the scenario.
Nothing
3042
Canceled the action Collect the
scenario.
Information
Canceled the action
Collect the scenario.
Nothing
ID
Event
Description
Type
Meanings
Solution
3043
Aborted the action Collect the
scenario.
Warning
Aborted the action
Collect the scenario.
Check the cause in
the
SystemProvisioning
log, remove the
cause, and execute
the process again.
3044
Started the action Collect data for
storage.
Information
Started the action Collect
data for storage.
Nothing
3045
Completed the action Collect data for
storage.
Information
Completed the action
Collect data for storage.
Nothing
3046
Canceled the action Collect data for
storage.
Information
Canceled the action
Collect data for storage.
Nothing
3047
Aborted the action Collect data for
storage.
Warning
Aborted the action
Collect data for storage.
Check the cause in
the
SystemProvisioning
log, remove the
cause, and execute
the process again.
3048
Started the action Collect data for
switch.
Information
Started the action Collect
data for switch.
Nothing
3049
Completed the action Collect data for
switch.
Information
Completed the action
Collect data for switch.
Nothing
3050
Canceled the action Collect data for
switch.
Information
Canceled the action
Collect data for switch.
Nothing
3051
Aborted the action Collect data for
switch.
Warning
Aborted the action
Collect data for switch.
Check the cause in
the
SystemProvisioning
log, remove the
cause, and execute
the process again.
3052
Started the action Connect
DiskVolume to machine.
Information
Started the action
Connect DiskVolume to
machine.
Nothing
3053
Completed the action Connect
DiskVolume to machine.
Information
Completed the action
Connect DiskVolume to
machine.
Nothing
3054
Canceled the action Connect
DiskVolume to machine.
Information
Canceled the action
Connect DiskVolume to
machine.
Nothing
3055
Aborted the action Connect
DiskVolume to machine.
Warning
Aborted the action
Connect DiskVolume to
machine.
Check the cause in
the
SystemProvisioning
log, remove the
cause, and execute
the process again.
3056
Started the action Connect to the
virtual machine server.
Information
Started the action
Connect to the virtual
machine server.
Nothing
3057
Completed the action Connect to the
virtual machine server.
Information
Completed the action
Connect to the virtual
machine server.
Nothing
ID
Appendix A Network Ports and Protocols
Event
Description
Type
Meanings
Solution
3058
Canceled the action Connect to the
virtual machine server.
Information
Canceled the action
Connect to the virtual
machine server.
Nothing
3059
Aborted the action Connect to the
virtual machine server.
Warning
Aborted the action
Connect to the virtual
machine server.
Check the cause in
the
SystemProvisioning
log, remove the
cause, and execute
the process again.
3060
Started the action Copy the virtual
machine.
Information
Started the action Copy
the virtual machine.
Nothing
3061
Completed the action Copy the
virtual machine.
Information
Completed the action
Copy the virtual machine.
Nothing
3062
Canceled the action Copy the virtual
machine.
Information
Canceled the action
Copy the virtual machine.
Nothing
3063
Aborted the action Copy the virtual
machine.
Warning
Aborted the action Copy
the virtual machine.
Check the cause in
the
SystemProvisioning
log, remove the
cause, and execute
the process again.
3064
Started the action Create datastore
Information
Started the action Create
datastore
Nothing
3065
Completed the action Create
datastore
Information
Completed the action
Create datastore
Nothing
3066
Canceled the action Create datastore
Information
Canceled the action
Create datastore
Nothing
3067
Aborted the action Create datastore
Warning
Aborted the action
Create datastore
Check the cause in
the
SystemProvisioning
log, remove the
cause, and execute
the process again.
3068
Started the action Create VLAN.
Information
Started the action Create
VLAN.
Nothing
3069
Completed the action Create VLAN.
Information
Completed the action
Create VLAN.
Nothing
3070
Canceled the action Create VLAN.
Information
Canceled the action
Create VLAN.
Nothing
3071
Aborted the action Create VLAN.
Warning
Aborted the action
Create VLAN.
Check the cause in
the
SystemProvisioning
log, remove the
cause, and execute
the process again.
3072
Started the action Create the virtual
machine without OS.
Information
Started the action Create
the virtual machine
without OS.
Nothing
3073
Completed the action Create the
virtual machine without OS.
Information
Completed the action
Create the virtual
machine without OS.
Nothing
ID
Event
Description
Type
Meanings
Solution
3074
Canceled the action Create the
virtual machine without OS.
Information
Canceled the action
Create the virtual
machine without OS.
Nothing
3075
Aborted the action Create the virtual
machine without OS.
Warning
Aborted the action
Create the virtual
machine without OS.
Check the cause in
the
SystemProvisioning
log, remove the
cause, and execute
the process again.
3076
Started the action Create the load
balancer group.
Information
Started the action Create
the load balancer group.
Nothing
3077
Completed the action Create the load
balancer group.
Information
Completed the action
Create the load balancer
group.
Nothing
3078
Canceled the action Create the load
balancer group.
Information
Canceled the action
Create the load balancer
group.
Nothing
3079
Aborted the action Create the load
balancer group.
Warning
Aborted the action
Create the load balancer
group.
Check the cause in
the
SystemProvisioning
log, remove the
cause, and execute
the process again.
3080
Started the action Create account
Information
Started the action Create
account
Nothing
3081
Completed the action Create account
Information
Completed the action
Create account
Nothing
3082
Canceled the action Create account
Information
Canceled the action
Create account
Nothing
3083
Aborted the action Create account
Warning
Aborted the action
Create account
Check the cause in
the
SystemProvisioning
log, remove the
cause, and execute
the process again.
3084
Started the action Create a snapshot.
Information
Started the action Create
a snapshot.
Nothing
3085
Completed the action Create a
snapshot.
Information
Completed the action
Create a snapshot.
Nothing
3086
Canceled the action Create a
snapshot.
Information
Canceled the action
Create a snapshot.
Nothing
3087
Aborted the action Create a
snapshot.
Warning
Aborted the action
Create a snapshot.
Check the cause in
the
SystemProvisioning
log, remove the
cause, and execute
the process again.
3088
Started the action Create the VLAN
into specified switch.
Information
Started the action Create
the VLAN into specified
switch.
Nothing
ID
Appendix A Network Ports and Protocols
Event
Description
Type
Meanings
Solution
3089
Completed the action Create the
VLAN into specified switch.
Information
Completed the action
Create the VLAN into
specified switch.
Nothing
3090
Canceled the action Create the
VLAN into specified switch.
Information
Canceled the action
Create the VLAN into
specified switch.
Nothing
3091
Aborted the action Create the VLAN
into specified switch.
Warning
Aborted the action
Create the VLAN into
specified switch.
Check the cause in
the
SystemProvisioning
log, remove the
cause, and execute
the process again.
3092
Started the action The Datacenter
delete.
Information
Started the action The
Datacenter delete.
Nothing
3093
Completed the action The
Datacenter delete.
Information
Completed the action
The Datacenter delete.
Nothing
3094
Canceled the action The Datacenter
delete.
Information
Canceled the action The
Datacenter delete.
Nothing
3095
Aborted the action The Datacenter
delete.
Warning
Aborted the action The
Datacenter delete.
Check the cause in
the
SystemProvisioning
log, remove the
cause, and execute
the process again.
3096
Started the action Delete datastore
Information
Started the action Delete
datastore
Nothing
3097
Completed the action Delete
datastore
Information
Completed the action
Delete datastore
Nothing
3098
Canceled the action Delete datastore
Information
Canceled the action
Delete datastore
Nothing
3099
Aborted the action Delete datastore
Warning
Aborted the action Delete
datastore
Check the cause in
the
SystemProvisioning
log, remove the
cause, and execute
the process again.
3100
Started the action Delete the disk
array.
Information
Started the action Delete
the disk array.
Nothing
3101
Completed the action Delete the disk
array.
Information
Completed the action
Delete the disk array.
Nothing
3102
Canceled the action Delete the disk
array.
Information
Canceled the action
Delete the disk array.
Nothing
3103
Aborted the action Delete the disk
array.
Warning
Aborted the action Delete
the disk array.
Check the cause in
the
SystemProvisioning
log, remove the
cause, and execute
the process again.
3104
Started the action Delete VLAN.
Information
Started the action Delete
VLAN.
Nothing
3105
Completed the action Delete VLAN.
Information
Completed the action
Delete VLAN.
Nothing
ID
Event
Description
Type
Meanings
Solution
3106
Canceled the action Delete VLAN.
Information
Canceled the action
Delete VLAN.
Nothing
3107
Aborted the action Delete VLAN.
Warning
Aborted the action Delete
VLAN.
Check the cause in
the
SystemProvisioning
log, remove the
cause, and execute
the process again.
3108
Started the action delete image
Information
Started the action delete
image
Nothing
3109
Completed the action delete image
Information
Completed the action
delete image
Nothing
3110
Canceled the action delete image
Information
Canceled the action
delete image
Nothing
3111
Aborted the action delete image
Warning
Aborted the action delete
image
Check the cause in
the
SystemProvisioning
log, remove the
cause, and execute
the process again.
3112
Started the action Delete the load
balancer group.
Information
Started the action Delete
the load balancer group.
Nothing
3113
Completed the action Delete the load
balancer group.
Information
Completed the action
Delete the load balancer
group.
Nothing
3114
Canceled the action Delete the load
balancer group.
Information
Canceled the action
Delete the load balancer
group.
Nothing
3115
Aborted the action Delete the load
balancer group.
Warning
Aborted the action Delete
the load balancer group.
Check the cause in
the
SystemProvisioning
log, remove the
cause, and execute
the process again.
3116
Started the action Unregistering
logical machine
Information
Started the action
Unregistering logical
machine
Nothing
3117
Completed the action Unregistering
logical machine
Information
Completed the action
Unregistering logical
machine
Nothing
3118
Canceled the action Unregistering
logical machine
Information
Canceled the action
Unregistering logical
machine
Nothing
3119
Aborted the action Unregistering
logical machine
Warning
Aborted the action
Unregistering logical
machine
Check the cause in
the
SystemProvisioning
log, remove the
cause, and execute
the process again.
3120
Started the action Delete account
Information
Started the action Delete
account
Nothing
ID
Appendix A Network Ports and Protocols
Event
Description
Type
Meanings
Solution
3121
Completed the action Delete account
Information
Completed the action
Delete account
Nothing
3122
Canceled the action Delete account
Information
Canceled the action
Delete account
Nothing
3123
Aborted the action Delete account
Warning
Aborted the action Delete
account
Check the cause in
the
SystemProvisioning
log, remove the
cause, and execute
the process again.
3124
Started the action Delete the
manager.
Information
Started the action Delete
the manager.
Nothing
3125
Completed the action Delete the
manager.
Information
Completed the action
Delete the manager.
Nothing
3126
Canceled the action Delete the
manager.
Information
Canceled the action
Delete the manager.
Nothing
3127
Aborted the action Delete the
manager.
Warning
Aborted the action Delete
the manager.
Check the cause in
the
SystemProvisioning
log, remove the
cause, and execute
the process again.
3128
Started the action Delete a snapshot.
Information
Started the action Delete
a snapshot.
Nothing
3129
Completed the action Delete a
snapshot.
Information
Completed the action
Delete a snapshot.
Nothing
3130
Canceled the action Delete a
snapshot.
Information
Canceled the action
Delete a snapshot.
Nothing
3131
Aborted the action Delete a
snapshot.
Warning
Aborted the action Delete
a snapshot.
Check the cause in
the
SystemProvisioning
log, remove the
cause, and execute
the process again.
3132
Started the action Delete the
template.
Information
Started the action Delete
the template.
Nothing
3133
Completed the action Delete the
template.
Information
Completed the action
Delete the template.
Nothing
3134
Canceled the action Delete the
template.
Information
Canceled the action
Delete the template.
Nothing
3135
Aborted the action Delete the
template.
Warning
Aborted the action Delete
the template.
Check the cause in
the
SystemProvisioning
log, remove the
cause, and execute
the process again.
3136
Started the action Delete the virtual
machine server.
Information
Started the action Delete
the virtual machine
server.
Nothing
3137
Completed the action Delete the
virtual machine server.
Information
Completed the action
Delete the virtual
machine server.
Nothing
ID
Event
Description
Type
Meanings
Solution
3138
Canceled the action Delete the virtual
machine server.
Information
Canceled the action
Delete the virtual
machine server.
Nothing
3139
Aborted the action Delete the virtual
machine server.
Warning
Aborted the action Delete
the virtual machine
server.
Check the cause in
the
SystemProvisioning
log, remove the
cause, and execute
the process again.
3140
Started the action Delete the VLAN
from switch.
Information
Started the action Delete
the VLAN from switch.
Nothing
3141
Completed the action Delete the
VLAN from switch.
Information
Completed the action
Delete the VLAN from
switch.
Nothing
3142
Canceled the action Delete the VLAN
from switch.
Information
Canceled the action
Delete the VLAN from
switch.
Nothing
3143
Aborted the action Delete the VLAN
from switch.
Warning
Aborted the action Delete
the VLAN from switch.
Check the cause in
the
SystemProvisioning
log, remove the
cause, and execute
the process again.
3144
Started the action Remove the
relation of VLAN from switch.
Information
Started the action
Remove the relation of
VLAN from switch.
Nothing
3145
Completed the action Remove the
relation of VLAN from switch.
Information
Completed the action
Remove the relation of
VLAN from switch.
Nothing
3146
Canceled the action Remove the
relation of VLAN from switch.
Information
Canceled the action
Remove the relation of
VLAN from switch.
Nothing
3147
Aborted the action Remove the
relation of VLAN from switch.
Warning
Aborted the action
Remove the relation of
VLAN from switch.
Check the cause in
the
SystemProvisioning
log, remove the
cause, and execute
the process again.
3148
Started the action Disconnect
DiskVolume to machine.
Information
Started the action
Disconnect DiskVolume
to machine.
Nothing
3149
Completed the action Disconnect
DiskVolume to machine.
Information
Completed the action
Disconnect DiskVolume
to machine.
Nothing
3150
Canceled the action Disconnect
DiskVolume to machine.
Information
Canceled the action
Disconnect DiskVolume
to machine.
Nothing
3151
Aborted the action Disconnect
DiskVolume to machine.
Warning
Aborted the action
Disconnect DiskVolume
to machine.
Check the cause in
the
SystemProvisioning
log, remove the
cause, and execute
the process again.
ID
Appendix A Network Ports and Protocols
Event
Description
Type
Meanings
Solution
3152
Started the action Disconnect from
the virtual machine server.
Information
Started the action
Disconnect from the
virtual machine server.
Nothing
3153
Completed the action Disconnect
from the virtual machine server.
Information
Completed the action
Disconnect from the
virtual machine server.
Nothing
3154
Canceled the action Disconnect from
the virtual machine server.
Information
Canceled the action
Disconnect from the
virtual machine server.
Nothing
3155
Aborted the action Disconnect from
the virtual machine server.
Warning
Aborted the action
Disconnect from the
virtual machine server.
Check the cause in
the
SystemProvisioning
log, remove the
cause, and execute
the process again.
3156
Started the action Execute local
script.
Information
Started the action
Execute local script.
Nothing
3157
Completed the action Execute local
script.
Information
Completed the action
Execute local script.
Nothing
3158
Canceled the action Execute local
script.
Information
Canceled the action
Execute local script.
Nothing
3159
Aborted the action Execute local
script.
Warning
Aborted the action
Execute local script.
Check the cause in
the
SystemProvisioning
log, remove the
cause, and execute
the process again.
3160
Started the action Sensor diagnosis.
Information
Started the action Sensor
diagnosis.
Nothing
3161
Completed the action Sensor
diagnosis.
Information
Completed the action
Sensor diagnosis.
Nothing
3162
Canceled the action Sensor
diagnosis.
Information
Canceled the action
Sensor diagnosis.
Nothing
3163
Aborted the action Sensor diagnosis.
Warning
Aborted the action
Sensor diagnosis.
Check the cause in
the
SystemProvisioning
log, remove the
cause, and execute
the process again.
3164
Started the action Diagnose the
machine.
Information
Started the action
Diagnose the machine.
Nothing
3165
Completed the action Diagnose the
machine.
Information
Completed the action
Diagnose the machine.
Nothing
3166
Canceled the action Diagnose the
machine.
Information
Canceled the action
Diagnose the machine.
Nothing
3167
Aborted the action Diagnose the
machine.
Warning
Aborted the action
Diagnose the machine.
Check the cause in
the
SystemProvisioning
log, remove the
cause, and execute
the process again.
ID
Event
Description
Type
Meanings
Solution
3168
Started the action Turn off LED
request
Information
Started the action Turn
off LED request
Nothing
3169
Completed the action Turn off LED
request
Information
Completed the action
Turn off LED request
Nothing
3170
Canceled the action Turn off LED
request
Information
Canceled the action Turn
off LED request
Nothing
3171
Aborted the action Turn off LED
request
Warning
Aborted the action Turn
off LED request
Check the cause in
the
SystemProvisioning
log, remove the
cause, and execute
the process again.
3172
Started the action Turn on LED
request
Information
Started the action Turn
on LED request
Nothing
3173
Completed the action Turn on LED
request
Information
Completed the action
Turn on LED request
Nothing
3174
Canceled the action Turn on LED
request
Information
Canceled the action Turn
on LED request
Nothing
3175
Aborted the action Turn on LED
request
Warning
Aborted the action Turn
on LED request
Check the cause in
the
SystemProvisioning
log, remove the
cause, and execute
the process again.
3176
Started the action Modify the disk
array.
Information
Started the action Modify
the disk array.
Nothing
3177
Completed the action Modify the disk
array.
Information
Completed the action
Modify the disk array.
Nothing
3178
Canceled the action Modify the disk
array.
Information
Canceled the action
Modify the disk array.
Nothing
3179
Aborted the action Modify the disk
array.
Warning
Aborted the action Modify
the disk array.
Check the cause in
the
SystemProvisioning
log, remove the
cause, and execute
the process again.
3180
Started the action Modify the disk
volume.
Information
Started the action Modify
the disk volume.
Nothing
3181
Completed the action Modify the disk
volume.
Information
Completed the action
Modify the disk volume.
Nothing
3182
Canceled the action Modify the disk
volume.
Information
Canceled the action
Modify the disk volume.
Nothing
3183
Aborted the action Modify the disk
volume.
Warning
Aborted the action Modify
the disk volume.
Check the cause in
the
SystemProvisioning
log, remove the
cause, and execute
the process again.
3184
Started the action Modify the load
balancer group.
Information
Started the action Modify
the load balancer group.
Nothing
ID
Appendix A Network Ports and Protocols
Event
Description
Type
Meanings
Solution
3185
Completed the action Modify the load
balancer group.
Information
Completed the action
Modify the load balancer
group.
Nothing
3186
Canceled the action Modify the load
balancer group.
Information
Canceled the action
Modify the load balancer
group.
Nothing
3187
Aborted the action Modify the load
balancer group.
Warning
Aborted the action Modify
the load balancer group.
Check the cause in
the
SystemProvisioning
log, remove the
cause, and execute
the process again.
3188
Started the action Modify the
manager.
Information
Started the action Modify
the manager.
Nothing
3189
Completed the action Modify the
manager.
Information
Completed the action
Modify the manager.
Nothing
3190
Canceled the action Modify the
manager.
Information
Canceled the action
Modify the manager.
Nothing
3191
Aborted the action Modify the
manager.
Warning
Aborted the action Modify
the manager.
Check the cause in
the
SystemProvisioning
log, remove the
cause, and execute
the process again.
3192
Started the action Edit a snapshot.
Information
Started the action Edit a
snapshot.
Nothing
3193
Completed the action Edit a
snapshot.
Information
Completed the action
Edit a snapshot.
Nothing
3194
Canceled the action Edit a snapshot.
Information
Canceled the action Edit
a snapshot.
Nothing
3195
Aborted the action Edit a snapshot.
Warning
Aborted the action Edit a
snapshot.
Check the cause in
the
SystemProvisioning
log, remove the
cause, and execute
the process again.
3196
Started the action Modify VLAN
Information
Started the action Modify
VLAN
Nothing
3197
Completed the action Modify VLAN
Information
Completed the action
Modify VLAN
Nothing
3198
Canceled the action Modify VLAN
Information
Canceled the action
Modify VLAN
Nothing
3199
Aborted the action Modify VLAN
Warning
Aborted the action Modify
VLAN
Check the cause in
the
SystemProvisioning
log, remove the
cause, and execute
the process again.
3200
Started the action Moving the virtual
machine server.
Information
Started the action Moving
the virtual machine
server.
Nothing
ID
Event
Description
Type
Meanings
Solution
3201
Completed the action Moving the
virtual machine server.
Information
Completed the action
Moving the virtual
machine server.
Nothing
3202
Canceled the action Moving the
virtual machine server.
Information
Canceled the action
Moving the virtual
machine server.
Nothing
3203
Aborted the action Moving the virtual
machine server.
Warning
Aborted the action
Moving the virtual
machine server.
Check the cause in
the
SystemProvisioning
log, remove the
cause, and execute
the process again.
3204
Started the action recovering a virtual
machine server
Information
Started the action
recovering a virtual
machine server
Nothing
3205
Completed the action recovering a
virtual machine server
Information
Completed the action
recovering a virtual
machine server
Nothing
3206
Canceled the action recovering a
virtual machine server
Information
Canceled the action
recovering a virtual
machine server
Nothing
3207
Aborted the action recovering a
virtual machine server
Warning
Aborted the action
recovering a virtual
machine server
Check the cause in
the
SystemProvisioning
log, remove the
cause, and execute
the process again.
3208
Started the action Bind the disk
volume.
Information
Started the action Bind
the disk volume.
Nothing
3209
Completed the action Bind the disk
volume.
Information
Completed the action
Bind the disk volume.
Nothing
3210
Canceled the action Bind the disk
volume.
Information
Canceled the action Bind
the disk volume.
Nothing
3211
Aborted the action Bind the disk
volume.
Warning
Aborted the action Bind
the disk volume.
Check the cause in
the
SystemProvisioning
log, remove the
cause, and execute
the process again.
3212
Started the action Collect specified
disk array information.
Information
Started the action Collect
specified disk array
information.
Nothing
3213
Completed the action Collect
specified disk array information.
Information
Completed the action
Collect specified disk
array information.
Nothing
3214
Canceled the action Collect specified
disk array information.
Information
Canceled the action
Collect specified disk
array information.
Nothing
ID
Appendix A Network Ports and Protocols
Event
Description
Type
Meanings
Solution
3215
Aborted the action Collect specified
disk array information.
Warning
Aborted the action
Collect specified disk
array information.
Check the cause in
the
SystemProvisioning
log, remove the
cause, and execute
the process again.
3216
Started the action Refresh the
machine information.
Information
Started the action
Refresh the machine
information.
Nothing
3217
Completed the action Refresh the
machine information.
Information
Completed the action
Refresh the machine
information.
Nothing
3218
Canceled the action Refresh the
machine information.
Information
Canceled the action
Refresh the machine
information.
Nothing
3219
Aborted the action Refresh the
machine information.
Warning
Aborted the action
Refresh the machine
information.
Check the cause in
the
SystemProvisioning
log, remove the
cause, and execute
the process again.
3220
Started the action Refresh the
network device information.
Information
Started the action
Refresh the network
device information.
Nothing
3221
Completed the action Refresh the
network device information.
Information
Completed the action
Refresh the network
device information.
Nothing
3222
Canceled the action Refresh the
network device information.
Information
Canceled the action
Refresh the network
device information.
Nothing
3223
Aborted the action Refresh the
network device information.
Warning
Aborted the action
Refresh the network
device information.
Check the cause in
the
SystemProvisioning
log, remove the
cause, and execute
the process again.
3224
Started the action Register the
machine to DeploymentManager
Information
Started the action
Register the machine to
DeploymentManagerr
Nothing
3225
Completed the action Register the
machine to DeploymentManager
Information
Completed the action
Register the machine to
DeploymentManager
Nothing
3226
Canceled the action Register the
machine to DeploymentManager
Information
Canceled the action
Register the machine to
DeploymentManager
Nothing
3227
Aborted the action Register the
machine to DeploymentManager
Warning
Aborted the action
Register the machine to
DeploymentManager
Check the cause in
the
SystemProvisioning
log, remove the
cause, and execute
the process again.
3228
Started the action Add a port to
VLAN.
Information
Started the action Add a
port to VLAN.
Nothing
ID
Event
Description
Type
Meanings
Solution
3229
Completed the action Add a port to
VLAN.
Information
Completed the action
Add a port to VLAN.
Nothing
3230
Canceled the action Add a port to
VLAN.
Information
Canceled the action Add
a port to VLAN.
Nothing
3231
Aborted the action Add a port to
VLAN.
Warning
Aborted the action Add a
port to VLAN.
Check the cause in
the
SystemProvisioning
log, remove the
cause, and execute
the process again.
3232
Started the action Remove the
registration machine from VLAN.
Information
Started the action
Remove the registration
machine from VLAN.
Nothing
3233
Completed the action Remove the
registration machine from VLAN.
Information
Completed the action
Remove the registration
machine from VLAN.
Nothing
3234
Canceled the action Remove the
registration machine from VLAN.
Information
Canceled the action
Remove the registration
machine from VLAN.
Nothing
3235
Aborted the action Remove the
registration machine from VLAN.
Warning
Aborted the action
Remove the registration
machine from VLAN.
Check the cause in
the
SystemProvisioning
log, remove the
cause, and execute
the process again.
3236
Started the action Disconnect disk
array from HBA.
Information
Started the action
Disconnect disk array
from HBA.
Nothing
3237
Completed the action Disconnect
disk array from HBA.
Information
Completed the action
Disconnect disk array
from HBA.
Nothing
3238
Canceled the action Disconnect disk
array from HBA.
Information
Canceled the action
Disconnect disk array
from HBA.
Nothing
3239
Aborted the action Disconnect disk
array from HBA.
Warning
Aborted the action
Disconnect disk array
from HBA.
Check the cause in
the
SystemProvisioning
log, remove the
cause, and execute
the process again.
3240
Started the action Revert a snapshot.
Information
Started the action Revert
a snapshot.
Nothing
3241
Completed the action Revert a
snapshot.
Information
Completed the action
Revert a snapshot.
Nothing
3242
Canceled the action Revert a
snapshot.
Information
Canceled the action
Revert a snapshot.
Nothing
3243
Aborted the action Revert a
snapshot.
Warning
Aborted the action Revert
a snapshot.
Check the cause in
the
SystemProvisioning
log, remove the
cause, and execute
the process again.
ID
Appendix A Network Ports and Protocols
Event
Description
Type
Meanings
Solution
3244
Started the action Scan datastore
Information
Started the action Scan
datastore
Nothing
3245
Completed the action Scan datastore
Information
Completed the action
Scan datastore
Nothing
3246
Canceled the action Scan datastore
Information
Canceled the action
Scan datastore
Nothing
3247
Aborted the action Scan datastore
Warning
Aborted the action Scan
datastore
Check the cause in
the
SystemProvisioning
log, remove the
cause, and execute
the process again.
3248
Started the action Change the name
of Datacenter.
Information
Started the action
Change the name of
Datacenter.
Nothing
3249
Completed the action Change the
name of Datacenter.
Information
Completed the action
Change the name of
Datacenter.
Nothing
3250
Canceled the action Change the
name of Datacenter.
Information
Canceled the action
Change the name of
Datacenter.
Nothing
3251
Aborted the action Change the name
of Datacenter.
Warning
Aborted the action
Change the name of
Datacenter.
Check the cause in
the
SystemProvisioning
log, remove the
cause, and execute
the process again.
3252
Started the action Set degraded
status to machine.
Information
Started the action Set
degraded status to
machine.
Nothing
3253
Completed the action Set degraded
status to machine.
Information
Completed the action Set
degraded status to
machine.
Nothing
3254
Canceled the action Set degraded
status to machine.
Information
Canceled the action Set
degraded status to
machine.
Nothing
3255
Aborted the action Set degraded
status to machine.
Warning
Aborted the action Set
degraded status to
machine.
Check the cause in
the
SystemProvisioning
log, remove the
cause, and execute
the process again.
3256
Started the action Register VLAN to
the machine.
Information
Started the action
Register VLAN to the
machine.
Nothing
3257
Completed the action Register VLAN
to the machine.
Information
Completed the action
Register VLAN to the
machine.
Nothing
3258
Canceled the action Register VLAN
to the machine.
Information
Canceled the action
Register VLAN to the
machine.
Nothing
ID
Event
Description
Type
Meanings
Solution
3259
Aborted the action Register VLAN to
the machine.
Warning
Aborted the action
Register VLAN to the
machine.
Check the cause in
the
SystemProvisioning
log, remove the
cause, and execute
the process again.
3260
Started the action Set the faulted
status to machine.
Information
Started the action Set the
faulted status to
machine.
Nothing
3261
Completed the action Set the faulted
status to machine.
Information
Completed the action Set
the faulted status to
machine.
Nothing
3262
Canceled the action Set the faulted
status to machine.
Information
Canceled the action Set
the faulted status to
machine.
Nothing
3263
Aborted the action Set the faulted
status to machine.
Warning
Aborted the action Set
the faulted status to
machine.
Check the cause in
the
SystemProvisioning
log, remove the
cause, and execute
the process again.
3264
Started the action Connect disk array
to HBA.
Information
Started the action
Connect disk array to
HBA.
Nothing
3265
Completed the action Connect disk
array to HBA.
Information
Completed the action
Connect disk array to
HBA.
Nothing
3266
Canceled the action Connect disk
array to HBA.
Information
Canceled the action
Connect disk array to
HBA.
Nothing
3267
Aborted the action Connect disk
array to HBA.
Warning
Aborted the action
Connect disk array to
HBA.
Check the cause in
the
SystemProvisioning
log, remove the
cause, and execute
the process again.
3268
Started the action Set ready status to
machine.
Information
Started the action Set
ready status to machine.
Nothing
3269
Completed the action Set ready
status to machine.
Information
Completed the action Set
ready status to machine.
Nothing
3270
Canceled the action Set ready status
to machine.
Information
Canceled the action Set
ready status to machine.
Nothing
3271
Aborted the action Set ready status
to machine.
Warning
Aborted the action Set
ready status to machine.
Check the cause in
the
SystemProvisioning
log, remove the
cause, and execute
the process again.
3272
Started the action Set maintenance
status of the machine.
Information
Started the action Set
maintenance status of
the machine.
Nothing
ID
Appendix A Network Ports and Protocols
Event
Description
Type
Meanings
Solution
3273
Completed the action Set
maintenance status of the machine.
Information
Completed the action Set
maintenance status of
the machine.
Nothing
3274
Canceled the action Set
maintenance status of the machine.
Information
Canceled the action Set
maintenance status of
the machine.
Nothing
3275
Aborted the action Set maintenance
status of the machine.
Warning
Aborted the action Set
maintenance status of
the machine.
Check the cause in
the
SystemProvisioning
log, remove the
cause, and execute
the process again.
3276
Started the action Change the
configuration of the virtual machine.
Information
Started the action
Change the configuration
of the virtual machine.
Nothing
3277
Completed the action Change the
configuration of the virtual machine.
Information
Completed the action
Change the configuration
of the virtual machine.
Nothing
3278
Canceled the action Change the
configuration of the virtual machine.
Information
Canceled the action
Change the configuration
of the virtual machine.
Nothing
3279
Aborted the action Change the
configuration of the virtual machine.
Warning
Aborted the action
Change the configuration
of the virtual machine.
Check the cause in
the
SystemProvisioning
log, remove the
cause, and execute
the process again.
3280
Started the action Composite
diagnosis based on state of VMS and
sensor
Information
Started the action
Composite diagnosis
based on state of VMS
and sensor
Nothing
3281
Completed the action Composite
diagnosis based on state of VMS and
sensor
Information
Completed the action
Composite diagnosis
based on state of VMS
and sensor
Nothing
3282
Canceled the action Composite
diagnosis based on state of VMS and
sensor
Information
Canceled the action
Composite diagnosis
based on state of VMS
and sensor
Nothing
3283
Aborted the action Composite
diagnosis based on state of VMS and
sensor
Warning
Aborted the action
Composite diagnosis
based on state of VMS
and sensor
Check the cause in
the
SystemProvisioning
log, remove the
cause, and execute
the process again.
3284
Started the action Unbind the disk
volume.
Information
Started the action Unbind
the disk volume.
Nothing
3285
Completed the action Unbind the disk
volume.
Information
Completed the action
Unbind the disk volume.
Nothing
3286
Canceled the action Unbind the disk
volume.
Information
Canceled the action
Unbind the disk volume.
Nothing
ID
Event
Description
Type
Meanings
Solution
3287
Aborted the action Unbind the disk
volume.
Warning
Aborted the action
Unbind the disk volume.
Check the cause in
the
SystemProvisioning
log, remove the
cause, and execute
the process again.
3288
Started the action Unregistering the
machine from DeploymentManager
Information
Started the action
Unregistering the
machine from
DeploymentManager
Nothing
3289
Completed the action Unregistering
the machine from
DeploymentManager
Information
Completed the action
Unregistering the
machine from
DeploymentManager
Nothing
3290
Canceled the action Unregistering
the machine from
DeploymentManager
Information
Canceled the action
Unregistering the
machine from
DeploymentManager
Nothing
3291
Aborted the action Unregistering the
machine from DeploymentManager
Warning
Aborted the action
Unregistering the
machine from
DeploymentManager
Check the cause in
the
SystemProvisioning
log, remove the
cause, and execute
the process again.
3292
Started the action Removed a port by
VLAN.
Information
Started the action
Removed a port by
VLAN.
Nothing
3293
Completed the action Removed a
port by VLAN.
Information
Completed the action
Removed a port by
VLAN.
Nothing
3294
Canceled the action Removed a port
by VLAN.
Information
Canceled the action
Removed a port by
VLAN.
Nothing
3295
Aborted the action Removed a port
by VLAN.
Warning
Aborted the action
Removed a port by
VLAN.
Check the cause in
the
SystemProvisioning
log, remove the
cause, and execute
the process again.
3296
Started the action Update account
Information
Started the action Update
account
Nothing
3297
Completed the action Update
account
Information
Completed the action
Update account
Nothing
3298
Canceled the action Update account
Information
Canceled the action
Update account
Nothing
3299
Aborted the action Update account
Warning
Aborted the action
Update account
Check the cause in
the
SystemProvisioning
log, remove the
cause, and execute
the process again.
3300
Started the action Notify group edit to
DPM.
Information
Started the action to
notify DPM to edit
groups.
Nothing
ID
Appendix A Network Ports and Protocols
Event
Description
Type
Meanings
Solution
3301
Completed the action Notify group
edit to DPM.
Information
Completed the action to
notify DPM to edit
groups.
Nothing
3302
Canceled the action Notify group edit
to DPM.
Information
Canceled the action to
notify DPM to edit
groups.
Nothing
3303
Aborted the action Notify group edit
to DPM.
Warning
Aborted the action to
notify DPM to edit
groups.
Check the cause in
the
SystemProvisioning
log, remove the
cause, and execute
the process again.
3304
Started the action Notify group move
to DPM.
Information
Started the action to
notify DPM to move
groups.
Nothing
3305
Completed the action Notify group
move to DPM.
Information
Completed the action to
notify DPM to move
groups.
Nothing
3306
Completed the action Notify group
move to DPM.
Information
Canceled the action to
notify DPM to move
groups.
Nothing
3307
Aborted the action Notify group move
to DPM.
Warning
Aborted the action to
notify DPM to move
groups.
Check the cause in
the
SystemProvisioning
log, remove the
cause, and execute
the process again.
3308
Started the action Notify the group
registration information on a machine
to DPM.
Information
Started the action to
notify DPM the registered
information of the
machine.
Nothing
3309
Completed the action Notify the
group registration information on a
machine to DPM.
Information
Completed the action to
notify DPM the registered
information of the
machine.
Nothing
3310
Canceled the action Notify the group
registration information on a machine
to DPM.
Information
Canceled the action to
notify DPM the registered
information of the
machine.
Nothing
3311
Aborted the action Notify the group
registration information on a machine
to DPM.
Warning
Aborted the action to
notify DPM the registered
information of the
machine.
Check the cause in
the
SystemProvisioning
log, remove the
cause, and execute
the process again.
3312
Started the action Notify the group
registration information on a machine
to DPM.
Information
Started the action to
notify DPM the registered
information of the
machine.
Nothing
3313
Completed the action Notify the
group registration information on a
machine to DPM.
Information
Completed the action to
notify DPM the registered
information of the
machine.
Nothing
ID
Event
Description
Type
Meanings
Solution
3314
Canceled the action Notify the group
registration information on a machine
to DPM.
Information
Canceled the action to
notify DPM the registered
information of the
machine.
Nothing
3315
Aborted the action Notify the group
registration information on a machine
to DPM.
Warning
Aborted the action to
notify DPM the registered
information of the
machine.
Check the cause in
the
SystemProvisioning
log, remove the
cause, and execute
the process again.
3316
Started the action Notify machine
move to DPM.
Information
Started the action to
notify DPM to move
machine.
Nothing
3317
Completed the action Notify machine
move to DPM.
Information
Completed the action to
notify DPM to move
machine.
Nothing
3318
Canceled the action Notify machine
move to DPM.
Information
Canceled the action to
notify DPM to move
machine.
Nothing
3319
Aborted the action Notify machine
move to DPM.
Warning
Aborted the action to
notify DPM to move
machine.
Check the cause in
the
SystemProvisioning
log, remove the
cause, and execute
the process again.
7000
User ("User Name") changed the
maintenance status of machine
("Machine Name") to [On].
Information
Maintenance ON of the
machine is success.
Nothing
7001
User ("User Name") changed the
maintenance status of machine
("Machine Name") to [Off]
Information
Maintenance OFF of the
machine is success.
Nothing
7002
User ("User Name") reset the failure
status of machine ("Machine Name").
Information
Reset the failure status of
the machine is success.
Nothing
7003
User ("User Name") reset the error
status of machine ("Machine Name").
Information
Reset the execution
result of the job of the
machine is success.
Nothing
*1
In SigmaSystemCenter 3.0, event ID:502 has not been recognized by report registration of ID=502 to
ESMPRO. In order to make ESMPRO recognize the event ID:502, start NEC ESMPRO Agent in the
control panel of the NEC ESMPRO Agent installed machine, and click Report Setting (R) in the General
tab to start Alert Manager. Then, set green icon ID=502 to be a monitored target from PVM application.
*2
If it is detected via NEC ESMPRO Manager and the target machine is a virtual machine, it is registered
as ID=52x.
*3
For information level messages, SystemProvisioning sends a message which does not influence on the
result of the target process. E.g) An action which moves all virtual machines is executed but any virtual
machine to be moved does not exist.
For warning level messages, SystemProvisioning sends a message which seriously influence on the
result of the target process. E.g.) A load balancing action is executed but the high load is not reduced.
ID
About output messages whose event IDs are 51X, 52X, 53X, and 54X
Additional information is added to output messages whose event IDs are 51X, 52X,
53X, and 54X as follows:
Appendix A Network Ports and Protocols
E.g.) Output message for event ID:541
The action (SetFaultedStatus) has been completed.
Management ID:00049-01
-----------------------------[EventNumber] RE00144
[EventType] Information
[EventCategory] TargetDown
[EventSource] VC[https://192.168.10.220:50443/sdk]
DataCenter[dataCenterB] ESX[192.168.220.142] VM[host10]
[Provider] VMwareProvider
[Provider(ID)] VMwareProvider
[Event] VM on VMS in DC is powered off
[EventMessage] VM on VMS in DC is powered off
[GroupName] \\yyy\vv
[PolicyName] Standard Policy
[JobId] 00049-01
[ActionSummary] Set the faulted status to machine.
[ActionDiscription] Machine status/ Set faulted status
[TargetMachineName(0):(Machine)] host10
[TargetMachineUnitName(0):(Machine)]
[TargetMachineUUID(0):(Machine)]
42176ffd-60d3-3133-8bf2-b1c048215206
(Machine) is Set the machine model.
Additional information is as follows:
Additional information name
Description
Event ID:
Event ID:
51X, 52X
53X, 54X
[EventNumber]
Number of the notified event
Yes
Yes
[EventType]
Type of the notified event
(any of "Information", "Warning", or "Error")
Yes
Yes
[EventCategory]
Category of the notified event
Yes
Yes
[EventSource]
Source of the notified event
Yes
Yes
[Provider]
Provider of the notified event
Yes
Yes
[Provider(ID)]
Provider (ID) of the notified event
Yes
Yes
[Event]
Information identifies the notified event
Yes
Yes
[EventMessage]
Message of the notified event
Yes
Yes
[ManagerName]
Manager name of the notified event
Yes
[GroupName]
Operation group name of the notified event
Yes
[PolicyName]
Policy name applied to the notified event
Yes
[JobId]
Job ID of the notified event
Yes
[ActionSummary]
Summary of the action executed / to be exectuted
Yes
[ActionDiscription]
Description of the action executed / to be executed
Yes
[WarningMessage]
Result of the action execution, not failed but
generated a supplementary (caution) message
Yes
[ExceptionMessage]
Action failed message
Yes
TargetGroupName(x):(yyy)
Group information for action execution
x indicates the order if multiple groups exist.
yyy is a parameter name in the action sequence.
Yes
TargetMachineName(x):(yyy)
Machine information for action execution
x indicates the order if multiple machines exist.
yyy is a parameter name in the action sequence.
Yes
TargetMachineUnitName(x):(yyy)
Machine information for action execution
x indicates the order if multiple machines exist.
yyy is a parameter name in the action sequence.
Yes
TargetMachineUUID(x):(yyy)
Machine information for action execution
x indicates the order if multiple machines exist.
yyy is a parameter name in the action sequence.
Yes
TargetHostName(x):(yyy)
Host information for action execution
x indicates the order if multiple hosts exist.
yyy is a parameter name in the action sequence.
Yes
TargetDiskPartitionName(x):(yyy)
Partition information for action execution
x indicates the order if multiple partitions exist.
yyy is a parameter name in the action sequence.
Yes
TargetManagerName(x):(yyy)
Manager information for action execution
x indicates the order if multiple machines exist.
yyy is a parameter name in the action sequence.
Yes
Appendix A Network Ports and Protocols
Additional information name
Description
Event ID:
Event ID:
51X, 52X
53X, 54X
other(x):(yyy)
Other information for action execution
x indicates the order if multiple machines exist.
yyy is a parameter name in the action sequence.
Yes
(yyy) is zzz
Explanation of yyy included in the action
information key.
Yes
2.2.2.
Event Logs Regarding Compatibility With NEC ESMPRO
Manager
The followings are the event logs that SystemProvisioning records regarding working
together with NEC ESMPRO Manager. The event source name is PVM.
Event ID
Description
Type
Meanings
Solution
101
NvBase System Service
has not been started.
Error
The service of NEC
ESMPRO Manager
(NvBase System Service)
is not started.
Check that the NvBase
System Service of NEC
ESMPRO Manager is
started. If it is not started,
start the service.
102
NvBase System Service
has been started. Resumed
monitoring events.
Information
Since the service of NEC
ESMPRO Manager
(NvBase System Service)
is started, monitoring
events was resumed.
Nothing
103
NvBase System Service is
not installed.
Error
NEC ESMPRO Manager
is not installed.
Install NEC ESMPRO
Manager.
2.3. List of Log Files
This section gives you lists of log files that each component of SigmaSystemCenter
outputs. To the log files, maximum size is set and SigmaSystemCenter manages the
files by generation management.
2.3.1.
Logs of SystemProvisioning
The logs SystemProvisioning outputs are as follows:
SystemProvisioning
Folder
SystemProvisioning installation folder\log\
(Default installation folder: C:\Program Files\NEC\PVM\log)
Files
ActionJob.log
ActionSequence.log
AliveMonitor.log
CacheManager.log
CmdbApi.log
CmdbApiAccess.log
CmdbConfig.log
CmdbConverter.log
CmdbSqlSession.log
ComponentManager.log
DataAccess.log
DataAccessError.log
DpmLibWrapper.log
DpmProvider.log
Engine.log
EsmproMonitor.log
EsmproProvider.log
HyperVProvider.log
InformationCollect.log
JobManager.log
KvmProvider.log
LibvirtWrapper.log
logAfterShutdown.log
loginit.log
MaintenanceCmdb.log
MaintenanceHardwarePartsStatus.log
ManagementLogWriter.log
PimProvider.log
PlacementEvent.log
ProviderCommon.log
PvmClarix.log
PvmEventlog.log
PvmiStorage.log
PvmMachineEvent.log
Appendix A Network Ports and Protocols
PvmNetApp.log
PvmNetvisorpro.log
PvmPimIpmi.log
PvmPimIpmi_Rmcp.log
PVMReport.log
PvmStorage.log
PvmSwitchBlade.log
PvmSymmetrix.log
pvmutl.log
ResourceEventList.log
ResourceEventListener.log
ResourceEventSender.log
rm_pfmAPI.log
rm_pfmAPI_old.log
SLBProvider.log
ssc.log
ssc-old.log
SystemEvent.log
Usual.log
UniversalConnector.log
UniversalConnectorDefect.log
VMwareProvider.log
VMwareProviderInfo.log
VMwareProviderEsxEvent.log
VMwareProviderEvent.log
VncClient.log
WebConnector.log
XenProvider.log
Contents
Operations los and debug logs of SystemProvisioning
Recording
Method
If the size of a log file exceeds the maximum size, the log file is backed up by
renaming it "filename.log.1" (except for pvmutl.log, ssc.log, rm_pfmAPI.log).
Just one backup file, "filename.log.1", is created as a general rule, but more
than one backup files are created for some log files.
Supplement
▪ You can check the log files with Text Editor.
▪ You can change the maximum output size from the Management tree Environment Setting icon - Log tab - The Maximum Output Size box. Some
log files' sizes could be twofold of the value of The Maximum Output Size
box.
(The size of rm_pfmAPI.log is fixed to 1 MB.)
SystemProvisioning Web Console
Folder
SigmaSystemCenter installation folder\PVM\Provisioning\Logs\
(Default installation folder: C:\Program Files\NEC\PVM\Provisioning\Logs)
Files
Web-GUI.log
Web-GUI.log.1
Contents
Error information and trace information of SystemProvisioning (GUI)
Recording
The maximum size of the file is 16 MB and the file is managed up until the
second generation.
When Web-GUI.log has reached the maximum size, it is renamed to
Method
Web-GUI.log.1 and the new Web-GUI.log is created. (If Web-GUI.log.1
already exists, it is deleted.)
Supplement
You can check the log files with Text Editor.
SystemProvisioning Virtual Machine Console and SOL Console
Folder
Application data folder of the current non-roaming user\SSC
▪ For Windows Server 2008 or later:
(Default value: C:\Users\User Name\AppData\Local\SSC)
▪ Windows Server 2003 or before:
(Default value: C:\Documents and Settings\User Name\Local
Settings\Application Data\SSC)
Files
HyperVConsole_Main.log
HyperVConsole_Main.log.1
KvmConsole_Main.log
KvmConsole_Main.log.1
KvmConsole_VncClient.log
KvmConsole_VncClient.log.1
SOLConsole_Main.log
SOLConsole_Main.log.1
SOLConsole_PimIpmiClient.log
SOLConsole_PimIpmiClient.log.1
SOLConsole_RmcpClient.log
SOLConsole_RmcpClient.log.1
VncConsole_Main.log
VncConsole_Main.log.1
XenServerConsole_Main.log
XenServerConsole_Main.log.1
XenServerConsole_VncClient.log
XenServerConsole_VncClient.log.1
Contents
Error information and trace information of SystemProvisioning Virtual Machine
Console and SOL Console.
Recording
The maximum size of each file is 4 MB and the file is managed up until the
second generation.
If the size of a log file exceeds the maximum size, the log file is backed up by
renaming it "filename.log.1."
Method
Because a log file is created only when a log is output, some files in the above
list may not exist.
Supplement
You can check the log files with Text Editor.
Appendix A Network Ports and Protocols
2.3.2.
Logs of DPM
The logs DPM outputs are as follows:
DPM Server
The logs output in a DPM Server installed machine are as follows:
Folder
DPM Server installation folder\Log\
▪ For x86 OS machines
(Default installation folder: C:\Program Files\NEC\DeploymentManager\Log)
▪ For x64 OS machines
(Default folder: C:\Program Files (x86)\NEC\DeploymentManager\Log)
Files
apiserv.csv
apitrace.log
bkressvc.csv
DepInit.csv
depssvc.csv
DIBPkgMake.csv
ftsvc.csv
pmdb.log
pminfo.log
pxemtftp.csv
pxesvc.csv
rupdssvc.csv
schwatch.csv
rupdssvc_Managed Machine Name_Managed Machine's MAC Address.log
Contents
Trace logs, error information, and database access logs of DPM
Recording
The maximum size of apitrace.log is 1 MB.
The maximum size of pmdb.log and pminfo.log is 16 KB.
The maximum size of files other than the above mentioned is 10 MB.
The *.csv files are managed up to five generations. (If a *.csv file exceeds the
maximum size, the file is renamed to "*.csv.1." Then, other "*.csv.n" files are also
renamed to "*.csv.n+1" and "*.csv.4" is deleted.)
If apitrace.log exceeds its maximum file size, the file content is overwritten from the
start line.
The pmdb.log, pminfo.log, and rupdssvc_Managed Machine Name_Managed
Machine's MAC Address.log is managed up to two generations. (If they exceed their
maximum file sizes, the file names are renamed to "*.log.bak"s and the original
"*.log.bak"s are deleted.)
Furthermore, each file can be deleted manually. (Because *.csv and apitrace.log
cannot be deleted if the DPM services are running, stop the DPM services and
delete the files manually.)
Method
Folder
DPM Server installation folder\Datafile\LogFile\SnrReport\
▪ For x86 OS machines:
(Default installation folder: C:\Program Files\NEC\DeploymentManager\Datafile\
LogFile\SnrReport)
▪ For x64 OS machines:
(Default installation folder: C:\Program Files
(x86)\NEC\DeploymentManager\Datafile\
LogFile\SnrReport)
Files
Scenario.rpt
Contents
Result of scenario execution
Recording
There is no limit for its file size.
You can delete the file on the DPM Web Console. (For deleting procedure, see
Subsection 4.5.2, "Delete Log" in DeploymentManager Reference Guide.)
Method
Folder
DPM Server installation folder\Datafile\LogFile\AuReport\
▪ For x86 OS machines:
(Default installation folder: C:\Program Files\NEC\DeploymentManager\Datafile\
LogFile\AuReport)
▪ For x64 OS machines:
(Default installation folder: C:\Program Files
(x86)\NEC\DeploymentManager\Datafile\
LogFile\AuReport)
Files
Index.rpt
Managed Machine's MAC Address.rpt
Contents
Execution logs of automatic update (automatic distribution of applications) on a
managed machine
Recording
The files are managed individually with a MAC address for each managed machine.
Each file has no limit for its file size.
The maximum number of logs can be set in the DPM Web Console.
If the number of logs exceeds the maximum, the oldest one is deleted or 10 % of the
oldest one is deleted.
For the setting of the maximum number of logs, see Subsection 4.7.2, "Maximum
Number of Logs Settings" in DeploymentManager Reference Guide.
Log files can be deleted in the DPM Web Console. (For deleting procedure, see
Subsection 4.7.4, "Delete Log" in DeploymentManager Reference Guide.)
Method
Folder
DPM Server installation folder\Datafile\JSLog\
▪ For x86 OS machines:
(Default installation folder: C:\Program
Files\NEC\DeploymentManager\Datafile\JSLog)
▪ For x64 OS machines:
(Default installation folder: C:\Program Files
(x86)\NEC\DeploymentManager\Datafile\
JSLog)
Files
CmdUserJSLog_YYYYMMDD.csv
CmdSelfJSLog_YYYYMMDD.csv
MngSelfJSLog_YYYYMMDD.csv
MngUserJSLog_YYYYMMDD.csv
(YYYYMMDD: Date)
* When DPM Server is installed in a machine, both Image Builder and DPM
Command Line are also installed in the same machine. Therefore, see the log
explanations in "◆Image Builder (Remote Console)" and "◆DPM Command Line"
described after this.
Contents
Audit log (Internal action in DPM Server / operation by a user)
Appendix A Network Ports and Protocols
Recording
Method
Each file is saved in its current date file.
Each file has no limit for its file size.
Current date files cannot be deleted if the DPM services are running, but the past
date files can be deleted manually. When 30 days pass after the create date, the
files are automatically deleted.
Folder
DPM Server installation folder\ WebServer\Logs\
▪ For x86 OS machines:
(Default installation folder: C:\Program Files\NEC\DeploymentManager\
WebServer\Logs\)
▪ For x64 OS machines:
(Default installation folder: C:\Program Files (x86)\NEC\DeploymentManager\
WebServer\Logs\)
Files
Browser.log
Error.log
JSOX-Event.csv
LibAPI.log
Polling.log
Trace.log
WebConsole.log
Contents
Failure information, trace, and Audit.log of the Web Console
Recording
Polling.log's maximum size is 1 MB. The maximum size of files other than the
Polling.log is 10 MB.
Polling.log is output only in the Polling.log file itself. JSOX-Event.csv is managed up
to two generations. (If JSOX-Event.csv exceeds its maximum file size, its filename is
renamed to JSOX-Event.csv.1 and the original JSOX-Event.csv.1 is deleted.)
Files other than the above mentioned are managed up to six generations. (If a *.log
file exceeds the maximum size, the file is renamed to "*.log.1." Then, other "*.log.n"
files are also renamed to "*.log.n+1" and "*.log.5" is deleted.)
Each file can be deleted manually.
Method
Folder
Folder for image\upload\dpmupload\
(Default installation folder: C:\Deploy\upload\dpmupload)
Files
Managed Machine's MAC Address_B.zip
Managed Machine's MAC Address_B_Error.zip
Managed Machine's MAC Address_R.zip
Managed Machine's MAC Address_R_Error.zip
Managed Machine's MAC Address_P.zip
Managed Machine's MAC Address_P_Error.zip
Managed Machine's MAC Address.zip
Managed Machine's MAC Address _Error.zip
Contents
Execution result of backup / restoration / disk configuration check on a managed
machine
Recording
Method
The files are managed individually with MAC address for each managed machine.
The maximum size of each file is about 50 KB. They are overwritten every time a
scenario is executed and can be deleted manually.
Folder
%SystemRoot%
(Default foler: C:\WINDOWS)
Files
Inst_Dpm_Db.log
Inst_Dpm_Ports.log
Inst_DPM_Mng.log
Inst_Dpm_Jre.log
Inst_DPM_Win_Cli.log
Contents
Installation logs of DPM
Recording
Each file has no limit for its file size.
Inst_Dpm_Db.log and Inst_Dpm_Jre.log are overwritten every time DPM Server is
installed, so their file sizes are not increased after installation of DPM Server.
The Inst_Dpm_Db.log and Inst_Dpm_Jre.log overwrite files of themselves for each
installation of DPM Server and their file size will not increase after installed DPM
server. In files other than those two files, their file size will increase monotonically.
Each file can be deleted manually.
Method
Folder
%ProgramFiles%\MSSQL10_50.DPMDBI\MSSQL\Log
(Default installation folder: C:\Program Files\Microsoft SQL Server\
MSSQL10_50.DPMDBI\MSSQL\Log)
Files
ERRORLOG
log_n.trc (n is a number)
Contents
SQL Server logs
Recording
Each file has no limit for its file size.
ERRORLOG is managed up to seven generations. (If SQL Server (DPMDBI)
restarts,, the file is renamed to "ERRORLOG.1." Then, other "ERRORLOG.n"s are
also renamed to "ERRORLOG.n+1"s and "ERRORLOG.6" is deleted.)
log_n.trc is managed up to five generations. (If log_1.trc - log_5.trc exist and SQL
Server (DPMDBI) service is restarted, the log_1.trc is deleted and log_6.trc is newly
created.)
ERRORLOG cannot be deleted.
log_n.trc cannot be deleted if SQL Server (DPMDBI) service is running, but past
logs can be deleted manually.
Method
DPM Client (Windows)
The logs output in a DPM Client installed machine (Windows) are as follows:
Folder
▪ For x86 OS machines:
C:\WINDOWS\system32
▪ For x64 OS machines:
C:\WINDOWS\SysWOW64
Files
DepAgent.log
rupdsvc.log
DPMTray.log
Contents
Service logs of DPM Client
Recording
The maximum size of DPMTray.log is 1 MB. The maximum size of the other files is 2
MB.
DepAgent.log and rupdsvc.log is managed up to two generations. (If they exceed
their maximum file sizes, the file names are renamed to "*.log.bak"s and the original
"*.log.bak"s are deleted.)
Each file can be deleted manually.
Method
Appendix A Network Ports and Protocols
Folder
%SystemRoot%\DeploymentManager\JSLog
(Default folder: C:\WINDOWS\DeploymentManager\JSLog)
Files
CliSelfJSLog_YYYYMMDD.csv
(YYYYMMDD: date)
Contents
Audit log (Internal working of DPM Client)
Recording
Each file has no limit for its file size.
Current date files cannot be deleted if the DPM services are running, but the past
date files can be deleted manually.
When 30 days pass after the create date, the files are automatically deleted.
Method
DPM Client (Linux)
The log output in a DPM Client installed machine (Linux) is as follows:
Folder
/opt/dpmclient/agent/log
File
depinst.log
Contents
Installation log of DPM Client (Linux)
Recording
The file has no limit for its file size and is overwritten every time DPM Client (Linux)
is installed.
The file can be deleted manually.
Method
Image Builder (Remote Console)
The log output in an Image Builder (Remote Console) installed machine is as
follows:
Folder
Image Builder (Remote Console) installation folder\Datafile\JSLog\
▪ For x86 OS machines:
(Default folder: C:¥Program Files¥NEC¥DeploymentManager\Datafile\JSLog)
▪ For x64 OS machines:
(Default folder: C:¥Program Files (x86)¥NEC¥DeploymentManager\Datafile\
JSLog)
Files
ImgUserJSLog_YYYYMMDD.csv
ImgSelfJSLog_YYYYMMDD.csv
(YYYYMMDD: Date)
Contents
Audit log (Operation by a user / internal action in Image Builder)
Recording
Each file has no limit for its file size.
Current date files cannot be deleted if the DPM services are running, but the past
date files can be deleted manually. When 30 days pass after the create date, the
files are automatically deleted.
Method
DPM Command Line
The log output in a DPM Command Line installed machine is as follows:
Folder
DPM Command Line installation folder\Datafile\Log\
▪ For x86 OS machines:
(Default folder: C:¥Program Files¥NEC¥DeploymentManager\Log)
▪ For x64 OS machines:
(Default folder: C:¥Program Files (x86)¥NEC¥DeploymentManager\Log)
Files
DPM_Trace1.csv
Contents
Audit log (Operation by a user / internal action in DPM Command Line)
Recording
The maximum size of DPM_Trace1.csv is 10 MB.
The file is managed up to five generations. (If DPM_Trace1.csv exceeds the
maximum size, the file is renamed to "DPM_Trace2.csv." Then, other
"DPM_Trace[n].csv" files are also renamed to "DPM_Trace[n+1].csv " and
"DPM_Trace5.csv" is deleted.)
Files can be deleted manually. (Because files cannot be deleted if the DPM
Command Line is running, delete the files manually after DPM Command Line is
exexuted.)
Method
2.3.3.
Logs of System Monitor - Performance Monitoring
Services
The logs System Monitor - Performance Monitoring Services outputs are as follows:
Event Log
Display
System Monitor - Performance Monitoring Services
Name
Contents
Error information and operating information of System Monitor - Performance
Monitoring Services
Recording
The maximum log size is 16,384KB and if the file size reaches the limit, events
are overwritten as necessary.
Method
Debug Logs
Folder
System Monitor - Performance Monitoring Services installation folder\log\
(Default installation folder: C:\Program Files\NEC\
SystemMonitorPerformance\log)
Files
rm_service.log
rm_client.log
rm_tool.log
rm_command.log
Contents
Error information and trace information of System Monitor - Performance
Monitoring Services
Recording
The default maximum log size is 10 MB and if a size of a file reaches the limit,
an output file is switched. (The size of rm_command.log is fixed to 1 MB.) The
file is managed up until the second generation.
Method
Supplement
2.3.4.
You can check the log files with Text Editor.
Logs of NEC ESMPRO Manager
There are two types of the log files that NEC ESMPRO Manager outputs; the logs that
the main Manager unit outputs and those that AlertManager unit outputs.
Appendix A Network Ports and Protocols
Note: If you are using x64 OS, substitute
"HKEY_LOCAL_MACHINE\SOFTWARE\Wow6432Node" for
"HKEY_LOCAL_MACHINE\SOFTWARE."
Logs that the main Manager unit outputs
•
Statistical information files
Folder
The esmpro directory in the directory that the registry
[HKEY_LOCAL_MACHINE\SOFTWARE\NEC\NVBASE] WorkDir
locates
Files
Files with a name of a server name with .dat or .bak added
Contents
A log of about 40 KB for each collection of output information is
outputted if you configure the setting for statistical information automatic
collection.
Recording
Data amount depends on the configuration of your monitored server.
The data is added when collecting information and updated if a period
(the default period is 100 days) that you configured on the setting dialog
box for statistical information automatic collection.
Method
•
•
Alert logs
Folder
The Alert directory in the directory that the registry
[HKEY_LOCAL_MACHINE\SOFTWARE\NEC\NVBASE] WorkDir
locates
Files
*.alg (One file for one subject)
al.idx (For alert list management / one line for one subject)
Contents
One log file of about 1 KB is outputted for one alert.
Recording
Method
If the number of logs exceeds the maximum number of logs on the Option
dialog box (*) of AlertViewer, logs are deleted from the oldest one.
(*) Web GUI: [Options] on the Header menu.
Windows GUI: [Tools] - [Options] menu - General tab
Supplement
If you use the AlertLogAutoSave Settings, files are saved according to
the setting.
Autodiscovery log
Folder
tmp\AutoDiscovery directory under the directory that is
indicated in the registry:
[HKEY_LOCAL_MACHINE\SOFTWARE\NEC\NVBASE]
WorkDir
Files
AutodiscoveryXXXXXXXXXXXXXX_YY.DBG
("XXXXXXXXXXXXXX" is the date when an auto
discovery process was executed and "YY" is a
sequential number.)
Contents
Internal logs of auto discovery process
Use
Failure analysis
Maximum Capacity
50 MB
Action of If a Size Reaches
the Maximum Capacity
Until What Generation the
Outputs a maximum capacity of 5 Mbyte log in one file at
one auto discovery process.
If the output exceeds the 5 Mbyte, create a new file by
adding "YY" of the file name part to output the log.
If the number of log files exceeds 10, the oldest log file is
overwritten.
Five generation
Files Are Managed
If Logs Are Increasing in
Operation
Increases each time an auto discovery process is
executed.
If Capacity Can Be Limited
The log file is not output if the following setting is
configured from the Windows GUI:
Click Start, click NEC ESMPRO Manager and click NEC
ESMPRO Manager to open the Operation Window.
From the Operation Window menu, select [Tools] [Autodiscover] - [Foreground] - [TCP/IP Hosts] to
open AutoDiscover(TCP/IP Hosts) window. Then, click
Details to open Details of AutoDiscover window.
If Output Datails Log check box is cleared, the log file is
not output any more.
If There Is No Problem If
No problem / Unnecessary
You
Delete
Files
Periodically / If You Delete
Them,
If
You
Need
to
Create Files With the Same
Names
If You Can Refer to Files
(If So, If You Can Check
Them Directly)
•
Yes (Text Editor)
However, the architecture is withheld as the logs are the
internal logs.
Status monitoring log
Folder
tmp\ESMDSVAP directory under the directory that is
indicated in the registry:
[HKEY_LOCAL_MACHINE\SOFTWARE\NEC\NVBASE]
WorkDir
Files
ESMDSVAPXXXXXXXXXXXXXX.log
ESMDSVAPXXXXXXXXXXXXXX.log.gz
("XXXXXXXXXXXXXX" is the date when the file was
created.)
Contents
Internal logs of SNMP Monitoring process / Ping
Monitoring process
Use
Failure analysis
Maximum Capacity
50 MB
Action of If a Size Reaches
the Maximum Capacity
Creates a new log file by updating the
"XXXXXXXXXXXXXX" part. A log file which reaches 50
MB is compressed to be log.gz (the size is about 1/20)
regulary.
Until What Generation the
21 generation
Files Are Managed
Appendix A Network Ports and Protocols
If Logs Are Increasing in
Increases.
Operation
If Capacity Can Be Limited
No
If There Is No Problem If
No problem / Unnecessary
You
Delete
Files
Periodically / If You Delete
Them,
If
You
Need
to
Create Files With the Same
Names
If You Can Refer to Files
(If So, If You Can Check
Them Directly)
Yes (Text Editor)
However, the architecture is withheld as the logs are the
internal logs.
Folder
tmp\ESMDSVAP directory under the directory that is
indicated in the registry:
[HKEY_LOCAL_MACHINE\SOFTWARE\NEC\NVBASE]
WorkDir
Files
CompressLogXXXXXXXXXXXXXX.log
Contents
Internal logs of compressing
ESMDSVAPXXXXXXXXXXXXXX.log
Use
Failure analysis
Maximum Capacity
500 KB
Action of If a Size Reaches
Creates a new log file by updating the
"XXXXXXXXXXXXXX" part.
the Maximum Capacity
Until What Generation the
Three generation
Files Are Managed
If Logs Are Increasing in
Operation
Increases each time
ESMDSVAPXXXXXXXXXXXXXX.log is compressed.
If Capacity Can Be Limited
No
If There Is No Problem If
No problem / Unnecessary
You
Delete
Files
Periodically / If You Delete
Them, If You Need to Create
Files With the Same Names
If You Can Refer to Files
(If So, If You Can Check
Them Directly)
•
Yes (Text Editor)
However, the architecture is withheld as the logs are the
internal logs.
Application log
Folder
C:\Program
Files\ESMPRO\ESMWEB\wbserver\webapps\esmpro\
WEB-INF\service
Files
hislog.txt
Contents
Events of communication with the management server
and the operation the operator executes.
Use
Application log
Maximum Capacity
2000 lines (by default)
Action of If a Size Reaches
Renames the file "hislog.bak" to create a new
"hislog.txt".
the Maximum Capacity
Until What Generation the
Two generation (hislog.txt、hislog.bak)
Files Are Managed
If Logs Are Increasing in
Increases up to the maximum capacity.
Operation
If Capacity Can Be Limited
Can be changed in the range of 2000 lines to 10000
lines.
If There Is No Problem If
No problem / Unnecessary
You
Delete
Files
Periodically / If You Delete
Them, If You Need to Create
Files With the Same Names
If You Can Refer to Files
(If So, If You Can Check
Them Directly)
•
If you delete the file, restart the following services:
▪ ESMPRO/SM Common Component
▪ ESMPRO/SM Web Container
Yes (Text Editor)
However, the architecture is withheld as the logs are the
internal logs.
System log
Folder
C:\Program
Files\ESMPRO\ESMWEB\wbserver\webapps\esmpro\
WEB-INF\service
Files
syslog.txt
Contents
Failure analysis for the product developer.
Use
System log
Maximum Capacity
250 KB
Action of If a Size Reaches
Renames the file "syslog.bak" to create a new
"syslog.txt".
the Maximum Capacity
Until What Generation the
Two generation (syslog.txt、syslog.bak)
Files Are Managed
If Logs Are Increasing in
Increases up to the maximum capacity.
Operation
If Capacity Can Be Limited
Yes
If There Is No Problem If
No problem / Unnecessary
You
Delete
Files
Periodically / If You Delete
Them,
If
You
Need
to
Create Files With the Same
Names
If you delete the file, restart the following services:
▪ ESMPRO/SM Common Component
▪ ESMPRO/SM Web Container
Appendix A Network Ports and Protocols
If You Can Refer to Files
(If So, If You Can Check
Them Directly)
•
Yes (Text Editor)
However, the architecture is withheld as the logs are the
internal logs.
Console log
Folder
C:\Program
Files\ESMPRO\ESMWEB\wbserver\webapps\esmpro\
WEB-INF\service
Files
xx.txt
xx: Server ID
Contents
Display data of the Remote Console.
Use
Console log
Maximum Capacity
64 KB (by default)
Action of If a Size Reaches
Renames the file xx.bak to create a new xx.txt.
the Maximum Capacity
Until What Generation the
Two generation (xx.txt、xx.bak)
Files Are Managed
If Logs Are Increasing in
Increases up to the maximum capacity.
Operation
If Capacity Can Be Limited
Can be changed in the range of 4 Kbytes - 1000 Kbytes.
If There Is No Problem If
No problem / Unnecessary
You
Delete
Files
Periodically / If You Delete
Them,
If
You
Need
to
Create Files With the Same
Names
If You Can Refer to Files
(If So, If You Can Check
Them Directly)
Yes (Text Editor)
•
Database log
Folder
C:\Program
Files\ESMPRO\ESMWEB\wbserver\webapps\esmpro\W
EB-INF\service
Files
rmmanager.log
Contents
Stores execution status of ExpressUpdate internal
database.
Use
Failure analysis
Maximum Capacity
3 MB
Action of If a Size Reaches
Deletes the rmmanager.log and creates a new
rmmanager.log
the Maximum Capacity
Until What Generation the
One generation (rmmanager.log)
Files Are Managed
If Logs Are Increasing in
Increases up to the maximum capacity of 3 MB.
Operation
If Capacity Can Be Limited
No
If There Is No Problem If
There is a problem with deleting files. / Unnecessary
You
Delete
Files
Periodically / If You Delete
Them, If You Need to
Create Files With the Same
Names
If You Can Refer to Files
Yes (Text Editor)
(If So, If You Can Check
Them Directly)
Folder
C:\Program
Files\ESMPRO\ESMWEB\wbserver\webapps\esmpro\W
EB-INF\service
Files
derby.log
Contents
Saves startup and execution status of ExpressUpdate
internal database.
Use
Failure analysis
Maximum Capacity
None
Action of If a Size Reaches
No action because there is no maximum capacity.
the Maximum Capacity
Until What Generation the
One generation (derby.log)
Files Are Managed
If Logs Are Increasing in
Operation
Increases only if any error occurs.
However, the file is cleared each time the service is
restarted.
Appendix A Network Ports and Protocols
If Capacity Can Be Limited
No
If There Is No Problem If
There is a problem with deleting files. / Unnecessary
You
Delete
Files
Periodically / If You Delete
Them,
If
You
Need
to
Create Files With the Same
Names
If You Can Refer to Files
Yes (Text Editor)
(If So, If You Can Check
Them Directly)
•
Axis2 log
Folder
C:\Program
Files\ESMPRO\ESMWEB\wbserver\webapps\esmpro\W
EB-INF\service
Files
axis2.log
Contents
Stores execution status of the common base.
Use
Failure analysis
Maximum Capacity
1 MB
Action of If a Size Reaches
Renames the axis2.log axis2.log.1 or axis2.log.2 and
creates a new axis2.log
the Maximum Capacity
Until What Generation the
Three generation (axis2.log, axis2.log.1, axis2.log.2)
Files Are Managed
If Logs Are Increasing in
Increases up to the maximum capacity of 1 MB.
Operation
If Capacity Can Be Limited
No
If There Is No Problem If
There is a problem with deleting files. / Unnecessary
You
Delete
Files
Periodically / If You Delete
Them, If You Need to
Create Files With the Same
Names
If You Can Refer to Files
(If So, If You Can Check
Them Directly)
Yes (Text Editor)
Logs that the AlertManager unit outputs
The following files are the examples that you installed NEC ESMPRO Manager
first in the default installation folder in the C drive.
Note: If NEC ESMPRO Agent is installed first, the default installation folder is
C:\ESM\AlertMan.
(If NEC ESMPRO Manager is installed first, the default installation folder is
C:\ProgramFiles\ESMPRO\AlertMan.)
Folder
C:\ProgramFiles\ESMPRO\AlertMan\Work\
Files
AMVSCKR.log
Contents
Internal logs of TCO/IP alert receiving process
Use
Failure analysis
Maximum Capacity
1000 Kbytes
Action of If a Size Reaches the
Renamed to a .bak file and .log is newly created.
Maximum Capacity
Until What Generation the Files
Second generation (.log and .bak)
Are Managed
If
Logs
Are
Increasing
in
Operation
Yes: If AlertManager receives TCP/IP alert, logs
increases.
If Capacity Can Be Limited
No
If There Is No Problem If You
No / No: No need for an empty file.
Delete Files Periodically / If You
Delete Them, If You Need to
Create Files With the Same
Names
If You Can Refer to Files
(If So, If You Can Check Them
Directly)
Yes (Text Editor)
However, the architecture is withheld as the logs are the
internal logs.
Folder
C:\ProgramFiles\ESMPRO\AlertMan\Work\
Files
NVCRTCPY.LOG
Contents
A log of settings of received information
An old file is deleted and a new file is created every time
alert table is reflected.
Use
Failure analysis
Maximum Capacity
1000 Kbytes
Action of If a Size Reaches the
A size does not increase.
Maximum Capacity
Appendix A Network Ports and Protocols
Until What Generation the Files
One generation
Are Managed
If
Logs
Are
Increasing
in
No: The file does not increase.
Operation
If Capacity Can Be Limited
No
If There Is No Problem If You
No / No: No need for an empty file.
Delete Files Periodically / If You
Delete Them, If You Need to
Create Files With the Same
Names
If You Can Refer to Files
(If So, If You Can Check Them
Directly)
Yes (Text Editor)
However, the architecture is withheld as the logs are the
internal logs.
Folder
C:\ProgramFiles\ESMPRO\AlertMan\Work\
Files
NvIRTCp2.log
NvIRTCpy.log
Contents
A log of internal process of settings of received
information
Use
Failure analysis
Maximum Capacity
1000 Kbytes
Action of If a Size Reaches the
Renamed to a .bak file and .log is newly created.
Maximum Capacity
Until What Generation the Files
Second generation (.log and .bak)
Are Managed
If
Logs
Are
Increasing
in
Yes: If you configure the setting of received information.
Operation
If Capacity Can Be Limited
No
If There Is No Problem If You
No / No: No need for an empty file.
Delete Files Periodically / If You
Delete Them, If You Need to
Create Files With the Same
Names
If You Can Refer to Files
(If So, If You Can Check Them
Directly)
Yes (Text Editor)
However, the architecture is withheld as the logs are the
internal logs.
Folder
C:\ProgramFiles\ESMPRO\NVWORK\AMWORK\SCK\
Files
AMVSCKR.LOG
Contents
Internal logs of TCO/IP alert receiving
Use
Failure analysis
Maximum Capacity
2000 Kbytes
Action of If a Size Reaches the
Information is updated from the oldest one
Maximum Capacity
Until What Generation the Files
One generation
Are Managed
If
Logs
Are
Increasing
in
Yes: If AlertManager receives TCP/IP information.
Operation
If Capacity Can Be Limited
No
If There Is No Problem If You
No
Delete Files Periodically / If You
Delete Them, If You Need to
Create Files With the Same
Names
If You Can Refer to Files
(If So, If You Can Check Them
Directly)
No (Binary)
Appendices
•
•
•
•
•
•
Appendix A Network Ports and Protocols ................................................................................ 189
Appendix B Transferring the Configuration Database ............................................................. 205
Appendix C How to Estimate Database Usage ....................................................................... 215
Appendix D Types of Action Sequence ................................................................................... 221
Appendix E Revision History .................................................................................................... 225
Appendix F License Information............................................................................................... 227
Appendix A Network
Protocols
Ports
and
Components in SigmaSystemCenter are configured to use the following network ports
by default. This appendix provides the information of network ports and protocols.
SystemProvisioning
Item
Execution File
Port
Proto
Direc
Name
No.
col
tion
Auto
matic
HTTP
>
DPM Server
ICMP
>
<
Managed machine
DPM Server
Connecting Target
Port
Execution File
No.
Name
80
Web service
(IIS)
Alive Monitoring
(Ping)
\Program
Files\NEC\PVM\
bin\PVMService
Proc.exe
Alive Monitoring
(Port)
\Program
Files\NEC\PVM\
bin\PVMService
Proc.exe
Auto
matic
TCP
>
Managed machine
Any
Hyper-V
Management
\Program
Files\WINDOW
S\System32\svc
host.exe
Auto
matic
TCP
(DCO
M)
>
WMI (Hyper-V)
135
Hyper-V
Management
\Program
Files\NEC\PVM\
bin\PVMService
Proc.exe
Auto
matic
TCP
(DCO
M)
>
WMI (Hyper-V)
102465535
*2
UC
*1
\Program
Files\NEC\PVM\
bin\PVMService
Proc.exe
26102
TCP
<
UC Client
Auto
matic
UCWebService
*1
\Program
Files\NEC\PVM\
bin\PVMService
Proc.exe
26150
TCP
<
UC Client
Auto
matic
Web API
*3
\Program
Files\NEC\PVM\
bin\PVMService
Proc.exe
26105
TCP
<
Web API Client
Auto
matic
80
TCP
<
A Web browser
Virtual machine
console
Auto
matic
Auto
matic
UDP
(IPMI
)
>
BMC
623
Web Console
Out-of-Band
Management
\Program
Files\NEC\PVM\
bin\PVMService
Proc.exe
Appendix A Network Ports and Protocols
Item
Execution File
Port
Proto
Direc
Name
No.
col
tion
\WINDOWS\Sys
tem32\snmptrap
.exe
162
UDP
(SNM
P
Trap)
162
<
Connecting Target
BMC
Port
Execution File
No.
Name
Auto
matic
*1
Used by connection from System Monitor - Performance Monitoring Services and
SystemProvisioning modules, including the Web Console and pvmutl.
*2
To restrict ports, note the points on Microsoft KB300083 and KB154596.
*3
This is used for the connection from modules co-working with SystemProvisioning . Contact us for
more details.
SystemProvisioning (Virtual Machine Console
and SOL Console)
Item *1
Execution File
Port
Proto
Direc
Connecting
Port
Execution File
Name *2
No.
col
tion
Target
No.
Name
Virtual Machine
Console
(Hyper-V)
HyperVConsole.
exe
Auto
matic
TCP
>
Hyper-V Host
2179
Auto
matic
TCP
>
Web Console
80
Virtual Machine
Console
(XenServer)
VncConsole.exe
Auto
matic
TCP
>
XenServer Host
443
Auto
matic
TCP
>
Web Console
80
Virtual Machine
Console (KVM)
VncConsole.exe
Auto
matic
TCP
>
KVM Host
590065535
*3
Auto
matic
TCP
>
Web Console
80
Auto
matic
UDP
(IPMI)
>
BMC
623
SOL Console
SOLConsole.ex
e
*1
A virtual machine console (VMware) connects to 902 port (TCP) of the VMware host. For details,
see product manuals of VMware, Inc.
*2
Execution files are saved in the following folders:
▪ For Windows Server 2008 or later
\Users\user name\AppData\Local\Apps\2.0\a randomly selected folder
▪ For Windows Server 2003 or before
\Documents and Settings\user name\Local Settings\Application Data\Apps\2.0\a randomly
selected folder
*3
If the port number of the virtual display is automatically assigned.
DeploymentManager
Item
DPM Server *9
Execution File
Port
Proto
Direc
Connecting
Port
Execution File
Name *1
No.
col
tion
Target
No.
Name
Power ON
\Program
Files\NEC\Depl
oymentManager
\magicsend.exe
Auto
matic
UDP
>
Managed machine
*3
5561
Shutdown
\Program
Files\NEC\Depl
oymentManager
\apiserv.exe
\Program
Files\NEC\Depl
oymentManager
\schwatch.exe
Auto
matic
TCP
>
Managed machine
56010
Network boot *4
DHCP server
or
\Program
Files\NEC\Depl
oymentManager
\pxesvc.exe *6
67
UDP(
DHCP
)
<
Managed machine
68
DHCP server
or
\Program
Files\NEC\Depl
oymentManager
\pxesvc.exe *6
67
UDP(
DHCP
)
>
Managed machine
68
\Program
Files\NEC\Depl
oymentManager
\pxesvc.exe
4011
UDP
<
Managed machine
68
\Program
Files\NEC\Depl
oymentManager
\pxesvc.exe
4011
UDP
<
Managed machine
4011
\Program
Files\NEC\Depl
oymentManager
\pxemtftp.exe
69
UDP
(TFTP
)
<
Managed machine
*5
\Program
Files\NEC\Depl
oymentManager
\pxemtftp.exe
69
UDP
(TFTP
)
>
Managed machine
*5
\Program
Files\NEC\Depl
oymentManager
\bkressvc.exe
56030
TCP
<
Managed machine
56030
▪ For a Windows
machine
\WINDOWS\sys
tem32\DepAgen
t.exe *2
▪ For a Linux
machine
/opt/dpmclient/a
gent/bin/Depagt
d
Appendix A Network Ports and Protocols
Item
Execution File
Port
Proto
Direc
Connecting
Port
Execution File
Name *1
No.
col
tion
Target
No.
Name
\Program
Files\NEC\Depl
oymentManager
\bkressvc.exe
56022
TCP
<
Managed machine
56022
OS installation
by disk
duplication
*7
\Program
Files\NEC\Depl
oymentManager
\ftsvc.exe
56023
TCP
<
Managed machine
Auto
matic
Backup *8
\Program
Files\NEC\Depl
oymentManager
\ftsvc.exe
56023
TCP
<
Managed machine
Auto
matic
\Program
Files\NEC\Depl
oymentManager
\bkressvc.exe
56020
TCP
<
Managed machine
56020
\Program
Files\NEC\Depl
oymentManager
\ftsvc.exe
56023
TCP
<
Managed machine
Auto
matic
\Program
Files\NEC\Depl
oymentManager
\bkressvc.exe
56020
TCP
<
Managed machine
56020
\Program
Files\NEC\Depl
oymentManager
\bkressvc.exe
56021
UDP
>
Managed machine
56021
\Program
Files\NEC\Depl
oymentManager
\ftsvc.exe
56023
TCP
<
Managed machine
Auto
matic
\Program
Files\NEC\Depl
oymentManager
\bkressvc.exe
56020
TCP
<
Managed machine
56020
\Program
Files\NEC\Depl
oymentManager
\rupdssvc.exe
Auto
matic
TCP
>
Managed machine
56000
Restore /
Multicast *8
Restore /
Unicast *8
Installing
Service Packs,
HorFixes, Linux
patch files, and
applications by
remote update
▪ For a Windows
machine
\WINDOWS\sys
tem32\rupdssvc.
exe ※2
▪ For a Linux
machine
/opt/dpmclient/a
gent/bin/Depagt
d
Item
Execution File
Port
Proto
Direc
Connecting
Port
Execution File
Name *1
No.
col
tion
Target
No.
Name
\Program
Files\NEC\Depl
oymentManager
\rupdssvc.exe
Auto
matic
UDP
>
Managed machine
56001
▪ For a Windows
machine
\WINDOWS\sys
tem32\rupdsvc.
exe *2
▪ For a Linux
machine
/opt/dpmclient/a
gent/bin/Depagt
d
\Program
Files\NEC\Depl
oymentManager
\rupdssvc.exe
56028
TCP
<
Managed machine
Auto
matic
▪ Only for a
Windows
machine
\WINDOWS\sys
tem32\rupdsvc.
exe *2
\Program
Files\NEC\Depl
oymentManager
\rupdssvc.exe
Auto
matic
TCP
>
Managed machine
56025
\WINDOWS\sys
tem32\rupdsvc.
exe *2
\Program
Files\NEC\Depl
oymentManager
\rupdssvc.exe
56024
TCP
<
Managed machine
Auto
matic
\WINDOWS\sys
tem32\rupdsvc.
exe *2
\Program
Files\NEC\Depl
oymentManager
\rupdssvc.exe
56028
TCP
<
Managed machine
Auto
matic
\WINDOWS\sys
tem32\rupdsvc.
exe *2
Applying a
package by
Automatic
Update
(request from a
managed
machine)
\Program
Files\NEC\Depl
oymentManager
\rupdssvc.exe
56024
TCP
<
Managed machine
Auto
matic
\WINDOWS\sys
tem32\rupdsvc.
exe *2
\Program
Files\NEC\Depl
oymentManager
\rupdssvc.exe
56028
TCP
<
Managed machine
Auto
matic
\WINDOWS\sys
tem32\rupdsvc.
exe *2
Acquisition of
OS and Hot Fix
Information of a
managed
machine
\Program
Files\NEC\Depl
oymentManager
\depssvc.exe
56011
TCP
<
Managed machine
Auto
matic
▪ For a Windows
machine
\WINDOWS\sys
tem32\ rupdsvc.
exe *2
▪ For a Linux
machine
/opt/dpmclient/a
gent/bin/Depagt
d
Operation
without a DHCP
Server
\Program
Files\NEC\Depl
oymentManager
\pxesvc.exe
56060
TCP
<
Managed machine
Auto
matic
Connection with
DPM Web
Console
Web service
(IIS)
80
*10
HTTP
<
DPM Web
Console
Auto
matic
Applying a
package by
Automatic
Update
(notification
from DPM
Server)
Appendix A Network Ports and Protocols
Item
Execution File
Port
Proto
Direc
Connecting
Port
Execution File
Name *1
No.
col
tion
Target
No.
Name
Connection with
Image Builder
(Remote
Console)
\Program
Files\NEC\Depl
oymentManager
\ftsvc.exe
56023
TCP
<
Image Builder
(Remote Console)
Auto
matic
\Program
Files\NEC\Depl
oymentManager
\DIBuilde.exe
Connection with
DPM Command
Line
Web service
(IIS)
80
*10
HTTP
<
DPM Command
Line
Auto
matic
\Program
Files\NEC\Depl
oymentManager
\dpmcmd.exe
*1
Paths of execution files in this table are described in the format of installing DPM Server in an x86
OS machine. If DPM Server is installed in an x64 OS machine, substitute "Program Files (x86)" for
"Program Files" in the paths.
*2
Paths of execution files in this table are described in the format of installing DPM Client (Windows)
in an x86 OS machine. If DPM Client (Windows) is installed in an x64 OS machine, substitute
"SysWOW64" for "system32" in the paths.
*3
The address for the machine in the same segment as the machine on which DPM Server is
installed is 255.255.255.255. Direct broadcast is used for the machine in the different segments.
E.g.) In the segment of 192.168.0.0 (MASK = 255.255.255.0), the address is 192.168.0.255.
*4
The series of flows are PXE boot (DHCP and tftp).
*5
Depends on the NIC ROM of the attached device.
*6
If a DHCP server is set up on the same machine, the DHCP server uses it. If a DHCP server is set
up on a different machine, pxesvc.exe uses it.
*7
The protocols and port numbers described in items of "Restore" are also necessary.
*8
To operate the system with a DHCP server, the protocols and the port numbers described in the
items of "Network boot" are also necessary.
To operate the system without a DHCP server, the protocol and the port number described in the
items of "Operation without a DHCP Server" are also necessary.
*9
Make this port available because the machines installed DPM Server use the port (TCP: 56050)
for the internal process - the connection between DPM Server and Web service (IIS).
*10
You can change the port number to be used by following procedures bellow.
Example) For IIS 7.0
1) Select Start – Administrative Tools - [Internet Information Services (IIS) Manager] .
2) The Internet Information Services (IIS) Manager window appears. Select Computer Name on
the tree view, and then right-click Web Sites - Web Site Name. And select Edit Bindings to change
the port number.
DPM Server uses the following protocols other than the above table.
As confirmation of existence, ICMP ECHO (ping) is used from DPM Server to
managed machines.
As restore and multicast, Multicast is used from DPM Server to managed
machines.
As installation of Service Packs, Hot Fixes, Linux patch files, and applications by
remote update, Multicast is used from DPM Server to managed machines.
Reference: To use a managed machine as a master machine or a master VM and join
it to the domain, the port of domain network must be open. For details, see Subsection
1.1.1, " Notes for Environment Setup When Executing OS Installation by Disk
Duplication" and "For General Virtual Environment" in Subsection 1.2.1, "About System
Configuration" in SigmaSystemCenter Notes and Trouble Shooting Reference Guide.
Item
OS Clear
Installation
*1
NFS Server
Execution File
Port
Proto
Direc
Connecting
Port
Execution File
Name
No.
col
tion
Target
No.
Name
111
TCP
<
Managed machine
Auto
matic
111
UDP
<
Managed machine
Auto
matic
1048
*1
TCP
<
Managed machine
Auto
matic
1048
*1
UDP
<
Managed machine
Auto
matic
2049
TCP
<
Managed machine
Auto
matic
2049
UDP
<
Managed machine
Auto
matic
This port number may be changed dynamically. If a communication fails, confirm the port number
used by the mountd (NFS mount daemon) service using the "rpcinfo -p" command and open the
port. If this does not resolve the situation, disable the Windows Firewall settings.
Appendix A Network Ports and Protocols
NEC ESMPRO Manager
Item
Execution File
Port
Protoc
Direc
Connecting
Port
Execution File
Name
No.
ol
tion
Target
No.
Name
Server
configuration/
Server
Monitoring
(SNMP)
\Program
Files\NEC\SMM
\ESMBASE\bin\
nvbase.exe
Auto
matic
UDP
>
<
NEC ESMPRO
Agent
161
Alive Monitoring
(Ping)
¥Program
Files¥NEC¥SM
M¥NVBASE¥bin
¥nvbase.exe
ICMP
>
Managed machine
Manager Report
(SNMP)
\Program
Files\NEC\SMM
\ESMBASE\bin\
nvbase.exe *5
162
UDP
<
NEC ESMPRO
Agent
Autom
atic
Manager Report
(TCP/IP
In-Band)
\Program
Files\NEC\SMM
\ESMBASE\bin\
amvsckr.exe
31134
*1
TCP
<
>
NEC ESMPRO
Agent
Autom
atic
Remote Wake
Up
¥Program
Files¥NEC¥SM
M¥NVBASE¥bin
¥RWUSTART.e
xe
Auto
matic
UDP
>
Network card
10101
Communication
between
managers
¥Program
Files¥NEC¥SM
M¥NVBASE¥bin
¥nvbase.exe
Auto
matic
TCP
>
NEC ESMPRO
Manager
8806
*2
\Program
Files\NEC\SMM
\NVBASE\bin\nv
base.exe
\Program
Files\NEC\SMM
\ESMBASE\bin\
nvbase.exe
8806
*2
TCP
<
NEC ESMPRO
Manager
Autom
atic
¥Program
Files¥NEC¥SM
M¥NVBASE¥bin
¥nvbase.exe
ESM Alert
Service
\Program
Files\NEC\SMM
\NVBASE\bin\es
masvnt.exe
8807*
*4
TCP
<
Alert Viewer
Autom
atic
\Program
Files\NEC\SMM
\NVBASE\bin\es
maview.exe
SNMP Trap
Transmission
¥Program
Files¥NEC¥SM
M¥NVBASE¥bin
¥esmtrprd.exe
Auto
matic
UDP
>
Third-party SNMP
management
console
162
Server
configuration /
Status
monitoring
(SNMP)
¥Program
Files¥NEC¥SM
M¥NVBASE¥bin
¥nvbase.exe
Auto
matic
UDP
>
EM card
161
Manager Report
(SNMP)
\Program
Files\NEC\SMM
\ESMBASE\bin\
nvbase.exe
*5
162
UDP
<
EM card
Auto
matic
Ack
Transmission
for Manager
Report
¥Program
Files¥NEC¥SM
M¥NVBASE¥bin
¥esmasvnt.exe
Auto
matic
UDP
>
EM card
5002
*3
*1
This value can be changed by either of the following procedures:
▪ From Windows GUI, click [Tools] - [Report Settings] on AlertViewer to open Alert Manager, click
[Setting] - [Base Setting] - [Receive] tab, then click Configure button.
▪ From Web GUI, click [TCP/IP Report Settings] on the AlertViewer.
*2
The value can be changed only from NEC ESMPRO Manager's Windows GUI.
To change the setting, click [Options] - [Customize] - [My Manager] on the Operation Window of
Windows GUI.
In addition, if Inter-Manager Communication is being used, the Neighbor Manager setting must be
changed. (Inter-Manager Communication is the function only implemented by Windows GUI.)
To change the setting, click [Options] - [Customize] - [Remote Manager].
*3
You can change the port number from the setting on the EM card.
*4
You can change the port number from [Tools] - [Port Settings] of AlertViewer.
Adding a Firewall exception is unnecessary.
*5
If the Use SNMP Trap Service is set for the SNMP trap reception setting, use
"%windir%\system32\snmptrap.exe."
The SNMP trap reception setting can be checked by either of the following procedures:
▪ From Web GUI, click Alert Receive Setting and check the [SNMP Trap Setting] on the
AlertViewer.
▪ From Windows GUI, click [Options] - [Customize] - [My Manager].
Appendix A Network Ports and Protocols
System Monitor - Performance Monitoring
Services
Item
Monitored machines
Execution
File
Port
Execution
No.
Name
Monitored machine
137
(system)
<
Monitored machine
137
TCP
>
Monitored machine
139
(system)
Auto
matic
TCP
>
Monitored machine
445
(system)
Performance
Data Collection
(Linux / KVM) *1
Auto
matic
TCP
>
Monitored machine
23
Performance
Data Collection
(Linux / KVM) *2
Auto
matic
TCP
>
Monitored machine
22
Performance
Data Collection
(ESX / ESXi,
Xen)
Auto
matic
TCP
>
Monitored machine
443
Name
Performance
Data Collection
(Windows)
(system)
Port
Prot
Direct
No.
ocol
ion
137
UDP
>
137
UDP
Auto
matic
Connecting Target
*1
Used when collecting performance data through the Telnet.
*2
Used when collecting performance data through the SSH.
Item
Management Console machine
Execution
File
Name
Connection
between a
Management
server and a
Management
Console
machine
File
\Program
Files\NEC\Syste
mMonitorPerform
ance\bin\rm_pfm
service.exe
Port
Prot
Direct
No.
ocol
ion
Auto
matic
TCP
>
26200
TCP
<
Connecting Target
Port
Execution
File
No.
Name
Management
Console machine
26202
\Program
Files\NEC\Syste
mMonitorPerform
ance\bin\RM_PF
MCONSOLE.exe
Management
Console machine
Auto
matic
Adding ICMP Echo Reply to the Exception List
of Windows Server 2008 Firewall
Windows Server 2008 does not receive ICMP Echo Reply by default. Windows Server
2008 Firewall blocks the connection.
To use Ping monitoring of alive monitoring function on Windows Server 2008, perform
the following procedure to add ICMP Echo Reply to the Firewall exception list.
1.
Click Start, and click Administrative Tools to open Windows Firewall with
Advanced Security.
Appendix A Network Ports and Protocols
2.
Select Inbound Rules in the left pane, click New Rule… in the right pain.
3.
Select Custom, and click Next.
4.
Enter %ProgramFiles%\NEC\PVM\bin\PVMServiceProc.exe, and click Next.
5.
Select ICMPv4 in Protocol type, and click Next.
Appendix A Network Ports and Protocols
6.
Click Next.
7.
Click Next.
8.
Click Next.
9.
Enter an arbitrary name in the Name box, and click Finish.
Appendix A Network Ports and Protocols
10. Confirm that the setting is added to the Inbound Rules.
Appendix B Transferring
the
Configuration Database
Although the configuration database is created on a management server when
SystemProvisioning is installed, SQL Server 2008 R2 configured on a remote server on
the network also can be used. The following case is an example of creating SQL Server
2008 R2 Express Instance (Instance name: SSCCMDB) on a server that is not a
management server with the name, "SERVER1", and using the SQL instance as the
configuration database, which is described according to different authentication modes.
Transferring the configuration database from the management server to another server,
however, decreases performance of SystemProvisioning because SystemProvisioning
must frequently access to the remote configuration database.
Therefore, this
recommended.
procedure
(transferring
the
configuration
database)
is
not
Note: You cannot setup the database of System Monitor - Performance Monitoring
Services on a server which is not a management server.
Using Windows Authentication Login
Perform the following procedures to transfer the configuration database when using the
Windows authentication login.
Note: Windows Authentication Login is valid only if SERVER1 joins the domain. If
SERVER1 joins the workgroup, use SQL Authentication Login.
1.
Backing up SystemProvisioning
Back up SystemProvisioning.
For the procedure, see Subsection 10.2.1, "Backing up SystemProvisioning" in
SigmaSystemCenter Configuration Guide.
Note: Set the name of the backup file as "backup.dat".
2.
Creating Instance
Setup the SQL Server 2008 R2 Express on the SERVER1.
1.
Download the setup program of SQL Server 2008 R2 Express from the
following site.
http://www.microsoft.com/download/en/details.aspx?id=26729
Appendix B Transferring the Configuration Database
2.
Run the downloaded SQLEXPR.EXE and proceed with the setup according to
the instructions on the screen.
3.
The Instance Configuration dialog box appears. Select Named instance,
and enter SSCCMDB in the text box.
4.
Server Configuration dialog box appears. Select NT
AUTHORITY\NETWORK SERVICE for the account name of SQL Server
Database Engine service.
5.
Database Engine Configuration dialog box appears. Select Windows
authentication mode.
After this, follow the instructions that appear on the screen to complete the
setup.
3.
Validating the network connection
Because SQL Server 2008 R2 Express permits only the local client connection by
default, you need to enable the network connection.
In addition, SQL Server Browser must be started and Firewall exceptions must be
created.
Reference: Refer to the following site for more details.
http://support.microsoft.com/kb/914277/en-us
4.
Creating a database
Run the following command on a command prompt window. Always use pvminf
as the database name used as the configuration database.
Appendix B Transferring the Configuration Database
E.g.1)
> sqlcmd -E -S (local)\SSCCMDB -Q "create database pvminf"
E.g.2)
> sqlcmd -E -S (local)\SSCCMDB
1> create database pvminf
2> go
5.
Restarting the service
Click the Start menu, and click Control Panel. From Control Panel, double-click
Administrative Tools. From Administrative Tools, and double-click Services to
start the Services Snap-in on the SERVER1.
Right-click the following service and click Restart.
Displayed Name: SQL Server (SSCCMDB)
Service Name: MSSQL$SSCCMDB
6.
Transferring the database to the SERVER1
Restore the file backed up in the procedure 1.
Put the backup file on the local disk of SERVER1 in advance. In the following
example, the name of the backup file is set as C:\temp\backup.dat.
E.g.1)
> sqlcmd -E -S (local)\SSCCMDB -Q "restore database
pvminf from disk = 'C:\temp\backup.dat' with replace"
E.g.2)
> sqlcmd -E -S (local)\SSCCMDB
1> restore database pvminf from disk =
‘C:\temp\backup.dat’ with replace
2> go
7.
Creating SQL Server login
Run the following command on a command prompt window of SERVER1. Always
use pvminf as the database name used as the configuration database.
> sqlcmd –E –S (local)\SSCCMDB
1> CREATE LOGIN [Login Name] FROM WINDOWS WITH
DEFAULT_DATABASE=[pvminf]
2> go
1> EXEC master..sp_addsrvrolemember @loginame = N'Login
Name', @rolename = N'sysadmin'
2> go
1> exit
Note: Replace the following data with the Login Name part:
Domain Name\the computer name of the management server$.
E.g.) An input example for the case of domain
Domain name: Domain
The computer name of the management server: SSC_Management_Server
> sqlcmd –E –S (local)\SSCCMDB
1> CREATE LOGIN [Domain\SSC_Management_Server$] FROM
WINDOWS WITH DEFAULT_DATABASE=[pvminf]
2> go
1> EXEC master..sp_addsrvrolemember @loginame =
N'Domain\SSC_Management_Server$', @rolename =
N'sysadmin'
2> go
1> exit
8.
Environment settings
Configure the environment settings and restart the PVMService.
1.
Start SystemProvisioning Installation Folder\bin\PvmConfig.exe on the
management server.
2.
The Environment Setting dialog box appears.
Appendix B Transferring the Configuration Database
3.
Enter values in the Host name and Instance name boxes, and select Use
Windows authentication login. Click Save.
4.
Click the Start menu, and click Control Panel. From Control Panel,
double-click Administrative Tools. From Administrative Tools, and
double-click Services to start the Services Snap-in.
5.
Right-click PVMService and click Restart.
Transferring the configuration database using Windows authentication login is now
complete.
Using SQL Authentication Login
Perform the following procedures to transfer the configuration database using the SQL
authentication login.
1.
Backing up SystemProvisioning
Back up SystemProvisioning.
For the procedure, see Subsection 10.2.1, "Backing up SystemProvisioning" in
SigmaSystemCenter Configuration Guide.
Note: Set the name of the backup file as "backup.dat".
2.
Creating Instance
Setup the SQL Server 2008 R2 Express on the SERVER1.
1.
Download the setup program of SQL Server 2008 R2 Express from the
following site.
http://www.microsoft.com/download/en/details.aspx?id=26729
2.
Run the downloaded SQLEXPR.EXE and proceed with the setup according to
the instructions on the screen.
3.
The Instance Configuration dialog box appears. Select Named instance,
and enter SSCCMDB in the text box.
Appendix B Transferring the Configuration Database
4.
Server Configuration dialog box appears. Select NT
AUTHORITY\NETWORK SERVICE for the account name of SQL Server
Database Engine service.
5.
Database Engine Configuration dialog box appears. Select Mixed Mode
(SQL Server authentication and Windows authentication). Enter the sa
logon password in the Enter password box and the Confirm password box.
Note: The administrator determines the password.
After this, follow the instructions that appear on the screen to complete the
setup.
3.
Validating the network connection
As SQL Server 2008 R2 Express permits only the local client connection by default,
you need to enable the network connection.
In addition, SQL Server Browser must be started and Firewall exceptions must be
created.
Reference: Refer to the following site for more details.
http://support.microsoft.com/kb/914277/en-us
4.
Creating a database
Run the following command on the Command Prompt window. Always use pvminf
as the database name used as the configuration database.
E.g.1)
> sqlcmd -E -S (local)\SSCCMDB -Q "create database pvminf"
E.g.2)
> sqlcmd -E -S (local)\SSCCMDB
1> create database pvminf
2> go
5.
Restarting the service
Click the Start menu, and click Control Panel. From Control Panel, double-click
Administrative Tools. From Administrative Tools, and double-click Services to
start the Services Snap-in on the SERVER1.
Right-click the following service and click Restart.
Displayed Name: SQL Server (SSCCMDB)
Service Name: MSSQL$SSCCMDB
6.
Transferring the database to the SERVER1
Restore the file backed up in the procedure 1.
Put the backup file on the local disk on the SERVER1 in advance. In the following
example, the name of the backup file is set as C:\temp\backup.dat.
E.g.1)
> sqlcmd -E -S (local)\SSCCMDB -Q "restore database pvminf
from disk = 'C:\temp\backup.dat' with replace"
Appendix B Transferring the Configuration Database
E.g.2)
> sqlcmd -E -S (local)\SSCCMDB
1> restore database pvminf from disk =
‘C:\temp\backup.dat’ with replace
2> go
7.
Environment settings
Configure the environment settings and restart the PVMService.
1.
Start SystemProvisioning Installation Folder\bin\PvmConfig.exe on the
management server.
2.
The Environment Setting dialog box appears.
3.
Enter values in the Host name and Instance name boxes, and select Use
SQL authentication login. Enter sa in the Account box, and enter the sa
password entered in Procedure 2 in the Password and Confirm password
boxes. And then, click Save.
4.
Click the Start menu, and click Control Panel. From Control Panel,
double-click Administrative Tools. From Administrative Tools, and
double-click Services to start the Services Snap-in.
5.
Right-click PVMService and click Restart.
Transferring the configuration database using SQL authentication login is now
complete.
Appendix C How to Estimate Database
Usage
SystemProvisioning, System Monitor - Performance Monitoring Services and
DeploymentManager use the database in SigmaSystemCenter.
Instructions on how to estimate the database usage are provided below.
SystemProvisioning
Estimates of disk capacities are described below according to the machine types.
Physical machines
About 4.1 KB is used for management of a blade chassis and a blade server.
Use the following information as a guide of individual calculation.
Blade Chassis
0.8 KB / unit
Blade Server
3.3 KB / unit
E.g.1) When using blade servers
When building 20 blade chassis containing 5 blade servers in each, necessary
disk capacity is calculated to about 346 KB according to the following formula.
Necessary disk capacity 346 KB = 20 (the number of blade chassis) * 0.8 KB
+ 100 (the number of blade servers) * 3.3 KB
About 4.1 KB is used for management of a single server.
E.g.2) When using single servers
When building 5 single servers, necessary disk capacity is calculated to about 20.5
KB according to the following formula.
Necessary disk capacity 20.5 KB = 5 (the number of blade servers) * 4.1 KB.
However, if the numbers of NIC and memories to connect to the machine increase,
necessary disk capacity also increases.
Appendix C How to Estimate Database Usage
Virtual machines
vCenter Server or ESX must be built to manage virtual machines.
About 9.0 KB is used for management of a virtual machine.
Use the following information as a guide of individual calculation.
vCenter Server
0.5 KB / unit
DataCenter
0.6 KB / unit
ESX
4.0 KB / unit
virtual machine
3.3 KB / unit
template
0.6 KB / unit
E.g.1)
When building vCenter Server * 1, DataCenter * 5, ESX * 50, a virtual machine *
1500, and a template* 300, necessary disk capacity is calculated to about 5.4 MB
according to the following formula.
Necessary disk capacity 5333.5 KB = 1 (the number of vCenter Server) * 0.5 KB
+5 (the number of DataCenter) * 0.6 KB
+ 50 (the number of ESX) * 4.0 KB
+1500 (the number of virtual machines) * 3.3 KB
+300 (the number of templates) * 0.6 KB.
If the numbers of NIC and memories to connect to the machine increase,
necessary disk capacity also increases.
Logical settings
Logical settings include server groups, host definitions and IP address definitions.
Use the following information as a guide of individual calculation.
Server Group
1.5 KB / unit
Host Definition
0.7 KB / unit
IP address
0.4 KB / unit
E.g.1)
When creating a server group with 10 host definitions that are configured 1 IP
address for each, necessary disk capacity is calculated to about 12.5 KB.
E.g.2)
When creating 50 server groups with 500 host definitions of DHCP operations for
each, necessary disk capacity is calculated to about 17.5 MB.
Operations log
Operations logs are recorded in the SystemProvisioning database.
An operations log is composed of two kinds of information: logs and events which
are the source of the logs.
Usually, multiple logs are registered for one event.
Events can be recorded up to one third of the maximum amount of log records.
Use the following information as a guide of capacity calculation.
•
0.6 KB is used for one record of operations log.
•
2.8 / 3 KB is used for one event.
The size of operations log (KB) = The number of operations log records * (0.6 + 2.8 / 3) KB
E.g.)
When recording 100,000 records of operations log, necessary disk capacity is
about 153 MB. (100,000 is the maximum number of operations logs which can be
recorded.)
The size of operations log (about 153 MB) =
100,000 * (0.6 + 2.8 / 3) KB = 60,000 + 93,333 KB
Appendix C How to Estimate Database Usage
System Monitor - Performance Monitoring
Services
System Monitor - Performance Monitoring Services collects performance data and
accumulates them in the database. Depending on operation forms, the database might
exceed the maximum capacity of SQL Server. For example, the maximum capacity of
SQL Server 2008 R2 Express is 10 GB.
There are two ways to avoid the above case:
1.
Upgrade SQL Server 2008 R2 Express to SQL Server 2008.
2.
Control the amount of performance data which are stored in the database from the
System Monitor - Performance Monitoring Services setting.
System Monitor - Performance Monitoring Services classifies performance data into
database tables according to periods of the performance data.
Under the following conditions, an estimate can be made as the table below.
•
1 machine to be monitored
•
1 items of performance information
•
Data collection period is 1 minute
•
Data storage period is the default value
1 minutes collection data : 3 (days) * 60 KB = 180 KB
5 minutes collection data : 7 (days) * 30 KB = 210 KB
15 minutes collection data : 30 (days) * 7 KB = 210 KB
1 hour collection data : 3* 30 (days) *2 KB= 180 KB
1 day collection data : 5 * 365 (days) * 0.1 KB = 182.5 KB
The size of total amount = (180 + 210 + 210 + 180 + 182.5) KB
= 962.5 KB ≒ 1 MB
* Performance data that exceeds the data retention period will be deleted regularly.
Necessary database capacity for the performance data can be configured by adjusting
the number of monitoring performance information items, data storage period, and data
collection period.
DeploymentManager
SQL Server 2008 R2 SP1 Express requires about 711 MB disk spaces.
DPM Server installation requires 256 MB databace spaces.
A rough estimate of database capacity necessary for future increases can be made
according to the following formula.
Necessary disk capacity = The number of registered computers * 10 KB
+ The number of registered packages * 3 KB
+ The number of registered computers * 0.15 KB * The number of registered packages
E.g.)
When the number of registered computers is 40,000 and the number of registered
packages is 100, necessary disk capacity is about 1.0 GB.
Appendix D Types of Action Sequence
The following table shows action sequences.
NO.
Action Sequence Names
Corresponding
Functions
machine
Physical
Virtual
Machine
Machine
configuration change
1
ChangeServerGroup
Change Machine Usage
(Physical Machine)
Changes a machine running in the specified
group to another usage (move to another
group).
A
N
2
CreateMachineToGroup
Activating Machine / Create and
Assign Machine (Virtual Machine)
Creates a virtual machine and activates the
virtual machine in the specified group.
N
A
3
DeleteManagedVirtualMachine
Deletes an entity of the virtual machine
standing by as a management target.
N
A
4
DeleteVirtualMachine
Delete VM
Makes a virtual machine running in the
group stand by in the shared pool and
deletes an entity of the virtual machine.
N
A
5
DistributeSoftwareToMachine
Distributes software to a machine running in
the group.
A
A
6
DistributeSoftwareToMachinesInGro
up
Distributes software to all machines running
in the group.
A
A
7
DistributeSoftwareToMachinesInGro
upWithScenario
Distributes the specified software to all
machines running in the group.
A
A
8
DistributeSoftwareToMachineWithS
cenario
Distributes the specified software to a
machine.
A
A
9
FailoverVMServer
Moves the virtual machine(s) on the virtual
machine server that generated an error to a
different virtual machine server in the group.
N
A
10
LoadBalanceVMServer
Moves the virtual machine(s) on the virtual
machine server with a high load to a different
virtual machine server in the group and
alleviates the high load.
N
A
11
MoveFromGroupToPool
Deleting Machine / Release
Resource (Physical Machine)
Deleting Machine / Scale In
(Physical Machine)
Deleting Machine / Release
Resource (Virtual Machine)
Deleting Machine / Scale In (Virtual
Machine)
Deletes and shuts down a machine running
in the group and makes the machine stand
by in a group pool.
A virtual machine server whose settings for a
virtual machine and storage are not enabled
is not shut down.
The deleted machine is removed from the
monitoring target of NEC ESMPRO Manager
(*1).
A
A
12
MoveFromManagedToPool
Shuts down and adds a machine in the
shared pool to the pool of the group.
A virtual machine server whose settings for a
virtual machine and storage are not enabled
is not shut down.
A
A
Appendix D Types of Action Sequence
NO.
Action Sequence Names
Corresponding
Functions
machine
Physical
Virtual
Machine
Machine
configuration change
13
MoveFromPoolToGroup
Activating Machine / Allocate
Machine (Physical Machine)
Activating Machine / Scale Out
(Physical Machine)
Activating Machine / Allocate
Machine (Virtual Machine)
Activating Machine / Scale Out
(Virtual Machine)
Activates a machine in the pool of the group
to run in the group. Distributes software,
customizes the machine (*2), and registers
to NEC ESMPRO Manager monitoring target
(*1). If automatic registration to DPM is
configured, the machine is registered to
DPM (*3).
A
A
14
MoveFromPoolToManaged
Deletes a machine standing by from the pool
of the group and makes the machine stand
by in the shared pool.
A
A
15
MoveMachine
Move Virtual Machine (Virtual
Machine)
Moves a virtual machine to the other virtual
machine server.
N
A
16
MoveMasterMachineToGroup
Activating Machine / Register
Master Machine (Physical Machine)
Activating Machine / Register
Master Machine (Virtual Machine)
Activates a machine standing by in the
shared pool and group pool as a master
machine. Distribution software is not
distributed.
In addition, register to NEC ESMPRO
Manager monitoring target (*1). If automatic
registration to DPM is configured, the
machine is registered to DPM (*3).
A
A
17
RebootMachine
Power Operation to Machine /
Restart
Reboots a machine.
A
A
18
ShutdownMachine
Power Operation to Machine /
Shutdown
Shuts down a running machine.
A
A
19
StartupMachine
Power Operation to Machine / Start
Starts a stopped machine.
A
A
20
SuspendMachine
Power Operation to Machine /
Suspend
Suspends an active machine.
A
A
21
TakeOverMachine
Replace Machine (Physical
Machine)
Replaces a machine running in the group
with a pool machine. The new machine
succeeds the information used by the old
machine.
The replaced machine is always made to
stand by in a group pool.)
A
N
22
PowerOnMachine
Power Operation to machine /
Power ON
Powers on a stopped machine.
A *4
N
23
PowerOffMachine
Power Operation to machine /
Power OFF
Powers off a running machine.
A *4
N
24
ResetMachine
Power Operation to machine / Reset
Resets a running machine at hardware level.
A *4
N
NO.
Action Sequence Names
Corresponding
Functions
machine
Physical
Virtual
Machine
Machine
configuration change
25
PowerCycleMachine
Power Operation to machine /
Power Cycle
Powers off and then Power on a running
machine.
A *4
N
26
AcpiShutdownMachine
Power Operation to machine / ACPI
Shutdown
Executes ACPI shutdown on a running
machine.
A *4,5
N
27
DumpMachine
Dump Machine
Sends dump demand to a machine.
A *4,5
N
28
LedTurnOnMachine
Sends LED on demand to a running
machine.
A *4
N
29
LedTurnOffMachine
Sends LED off demand to a running
machine.
A *4
N
30
ApplyOptimizedPlacementRule
Applies the Optimized Placement Rule.
N
A
31
CreateImage
Creates an image.
N
A
32
CreateTemplate
Creates a template.
N
A
33
InvestigateAndPowerOff
Diagnoses a machine.
A
A
34
InvestigateMachineAndSetFaulted
Diagnoses the specified type machine.
A
A
35
InvestigateMachineAndSetReady
Executes total recover diagnosis and sets
ready status.
A
A
36
ModifyRunningMachine
Modifies a running machine.
A
A
37
PowerSaveVMserver
Executes power save of a VM server.
A
N
38
PredictiveShutdownVMServer
Stops a VM server (Predictive).
A
N
39
PredictiveStartupVMServer
Starts up a spare VM server.
A
N
40
ReconstructVirtualMachine
Reconstructs a virtual machine.
N
A
41
ScaleIn
Executes ScaleIn.
A
A
42
ScaleOut
Executes ScaleOut.
A
A
43
ShutdownAtScaleIn
Shuts down a machine according to the
group setting.
A
A
44
StartupAtScaleOut
Starts up a machine according to the group
setting.
A
A
45
SuspendAtScaleIn
Suspends a machine according to the group
setting.
N
A
*1
This operation is executed only when the target is a physical machine.
*2
If the target is a virtual machine, customizing the machine is executed. If the target is a physical
machine, it depends on the type of distribution software.
*3
This operation is executed only when the target is a virtual machine.
*4
Out-of-Band Management must be enabled.
*5
OS on a target machine must be configured appropriately.
A: action sequence applicable
N: action sequence not applicable
Appendix E Revision History
Second Edition (January 2012) Revised adding descriptions about enhancements
in Update 1.
Added description regarding the vSphere 5.0 supports.
Chapter 1
1.2.5. Events the VMware (vCenter Server) Compatible Function Can Detect
1.2.6. Events the VMware (ESXi) Compatible Function Can Detect
Added description regarding the newly featured resource pool monitoring
Chapter 1
1.2. Events SigmaSystemCenter Can Detect
1.2.7. Events the Optimized Placement Can Detect
1.6.4. Settings of a Standard Policy (VM Server), Standard Policy (VM Server
Predictive), Standard Policy (VM Server Power save)
1.6.5. Standard Policy (VM Server ESXi)
1.6.6. Settings of a Standard Policy (VM Server Hyper-V), a Standard Policy
(VM Server Hyper-V Predictive), And a Standard Policy (VM Server Hyper-V
Power Save)
Chapter 2
2.3.1. Logs of SystemProvisioning
Added or modified description regarding the enablement of SMTP Authentication
Chapter 1
1.7.1. Notification/ E-mail, Event Log
First Edition (September 2011): New
Appendix F
License Information
This product includes certain open source software.
Details of individual licenses are provided on the SigmaSystemCenter DVD
<SigmaSystemCenter Installation DVD>\doc\OSS directory.
Please contact us in order to obtain the source code of software that is distributed under the LGPL.
▪ PXE Software Copyright (C) 1997 - 2000 Intel Corporation.
▪ This product contains JRE (Java Runtime Environment) which is distributed by Oracle Corporation
without charge. Use this product after accepting the license agreement. For details of copyright and
ownership rights, refer to the following license files:
<folder where JRE is installed>\LICENSE
▪ Some icons used in this program are based on Silk Icons released by Mark James under a Creative
Commons Attribution 2.5 License. Visit http://www.famfamfam.com/lab/icons/silk/ for more details.
▪ This product includes software developed by Routrek Networks, Inc.
▪ Copyright 2005 - 2010 NetApp, Inc. All rights reserved.