1
Author: GeoWise User Support
Released: 04/09/2013
Version: 6.7.1
TM
InstantAtlas Desktop User Guide
visualise | communicate | ENGAGE
InstantAtlas User Guide
g the InstantAtlas Area Profile Template User Guide
Table of Contents
© GeoWise Ltd. 2013
A.
INTRODUCTION ................................................................................................................................... 1
B.
THE INSTANTATLAS DESKTOP PUBLISHER .......................................................................................... 2
C.
THE INSTANTATLAS DESIGNER ......................................................................................................... 40
D.
THE INSTANTATLAS STYLE EDITOR .................................................................................................. 81
E.
THE INSTANTATLAS EXCEL DATA M ANAGER .................................................................................... 92
F.
THE INSTANTATLAS BATCH PUBLISHER .......................................................................................... 116
G.
GOOGLE M APS IN INSTANTATLAS REPORTS ................................................................................... 133
H.
MULTIPLE GEOGRAPHY REPORTS................................................................................................... 140
I.
THE INSTANTATLAS AREA PROFILE TEMPLATE ............................................................................... 146
J.
THE INSTANTATLAS BUBBLE PLOT TEMPLATE ................................................................................ 154
K.
THE INSTANTATLAS ELECTION TEMPLATE ...................................................................................... 164
L.
THE INSTANTATLAS HTML PROFILE TEMPLATE.............................................................................. 169
M.
THE INSTANTATLAS ARCGIS ONLINE TEMPLATES .......................................................................... 178
N.
INSTANTATLAS SUPPORT ............................................................................................................... 190
visualise | communicate | ENGAGE
Introduction
g the InstantAtlas Area Profile Template User Guide
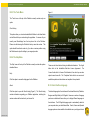
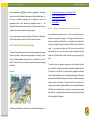
A. INTRODUCTION
InstantAtlas™ is award-winning software for publishing eye-catching,
stand-alone, dynamic web reports that make the regional and local
patterns in your data easy to see.
You can create interactive atlases,
dashboards, profiles, or key indicator reports that allow information
professionals, analysts, policy advisors and management executives to
view and explore patterns, monitor key indicators, present trends and
support decision-making. For more information about InstantAtlas dynamic
reports, please visit www.instantatlas.com.
Please read the InstantAtlas Getting Started Guide prior to reading this
document. You can find this in the ‘documentation’ folder created during
the installation of your InstantAtlas software. The default location for this is
the following:
C:\Program Files\GeoWise\InstantAtlas\documentation
© GeoWise
GeoWise Ltd.
Ltd. 2013
2011
©
Page 1
visualise | communicate | ENGAGE
The InstantAtlas Desktop Publisher
g the InstantAtlas Area Profile Template User Guide
B. THE INSTANTATLAS DESKTOP PUBLISHER
B.1.
About this Section .................................................................................................................... 4
B.2.
Publisher Fundamentals .......................................................................................................... 4
B.2.1.
Starting the Publisher ....................................................................................................... 4
B.2.2.
The File Menu .................................................................................................................. 4
B.2.3.
The Tools Menu ............................................................................................................... 5
B.2.4.
The Help Menu ................................................................................................................ 5
B.2.5.
User Interface Language ................................................................................................. 5
B.3.
Publishing a Report .................................................................................................................. 6
B.3.1.
Choose a Template.......................................................................................................... 6
B.3.2.
Choose Your Base Geography ........................................................................................ 6
B.3.2.1.
Selecting a Layer ..................................................................................................... 6
B.3.2.2.
Layer Properties of Base Geography Layers ......................................................... 10
B.3.2.3.
Geo-Preview and Data Preview ............................................................................. 14
B.3.3.
B.3.3.1.
Create a Demo Data File ....................................................................................... 15
B.3.3.2.
Upload a Data XML File ......................................................................................... 15
B.3.3.3.
Create a Data File from a Digital Map File ............................................................. 16
B.3.4.
Choose Your Contextual Geographies .......................................................................... 22
B.3.4.1.
Digital Map Files as Contextual Layers ................................................................. 22
B.3.4.2.
Layer Properties of Contextual Geography Layers................................................ 23
B.3.4.3.
GeoRSS Feeds as Contextual Layers ................................................................... 26
B.3.5.
© GeoWise
GeoWise Ltd.
Ltd. 2013
2011
©
Choose Your Data ......................................................................................................... 14
Choose Your Background Images ................................................................................. 27
Page 2
visualise | communicate | ENGAGE
B.3.5.1.
The InstantAtlas Desktop Publisher
Adding Images from a Background Image Collection ........................................... 27
g the InstantAtlas Area Profile Template User Guide
Adding Images from a WMS Connection ............................................................... 30
B.3.5.3.
Adding Images from a ArcGIS Server Map Service .............................................. 35
B.3.5.4.
Adding Images from Google Maps ........................................................................ 35
B.3.6.
Choose Settings For Your Dynamic Report ................................................................... 35
B.3.7.
Unpacking and Starting Your Report ............................................................................. 37
B.4.
Publisher Configuration File ................................................................................................... 38
B.4.1.
Changing the Interface Language of the IA Tools ......................................................... 38
B.4.2.
Disabling the WYSIWYG Interface of the Designer ....................................................... 39
B.5.
© GeoWise
GeoWise Ltd.
Ltd. 2013
2011
©
B.3.5.2.
Publisher Error Logs .............................................................................................................. 39
Page 3
visualise | communicate | ENGAGE
The InstantAtlas Desktop Publisher
B.1. About this Section
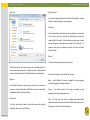
B.2.2. The File Menu
The InstantAtlas Publisher is a tool for creating InstantAtlas stand-alone,
The ‘File’ menu at the top of the Publisher currently contains the options
dynamic reports. Once installed on your computer, it allows you to create
described below.
g the InstantAtlas Area Profile Template User Guide
a report with the template and the geographies of your choice.
The
Publisher is a wizard style application. Each screen has a ‘Next’ and a
Open Project
‘Back’ button to allow you to step both forwards and backwards through the
Click this option to open an InstantAtlas project file. A project file contains
Publisher. The Publisher remembers the selections that you make on a
information about your publishing session (e.g. the locations of the files you
particular screen to save you time when you next publish a report.
have uploaded and any settings you have typed in). It can be saved at any
point during the publishing process (see below) and then opened during a
B.2. Publisher Fundamentals
future publishing session.
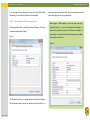
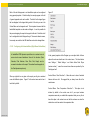
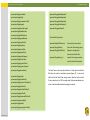
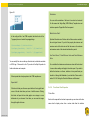
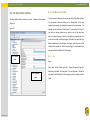
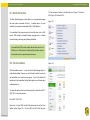
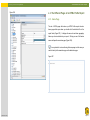
B.2.1. Starting the Publisher
Save Project
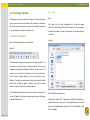
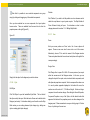
You can start the Publisher by clicking ‘InstantAtlas Desktop Edition’,
Click this option to save an InstantAtlas project file. You can save a project
‘InstantAtlas Publisher’ in the Windows Start menu or by clicking the
file at any point during the publishing process. Normally you would do this
‘InstantAtlas Publisher’ icon on your desktop (Figure 1).
at the end of the process when you have made all the changes you wish to
save in the project.
Figure 1
Open ArcGIS Online Application
Please refer to section ‘M.2.7. Opening an Existing Web Application’ for
specific information on this option. For general information on ArcGIS
Online and InstantAtlas please read section ‘M. The InstantAtlas ArcGIS
If you chose not to create shortcuts during installation of the software,
Online Templates’.
browse to the ‘InstantAtlasPublisher.exe’ file located in the ‘InstantAtlas’
folder created during the installation of your InstantAtlas software and
double click it.
The default location of the file is C:\Program
Files\GeoWise\InstantAtlas.
© GeoWise
GeoWise Ltd.
Ltd. 2013
2011
©
Exit
Click this option to exit the Publisher.
Page 4
visualise | communicate | ENGAGE
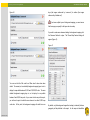
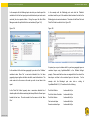
B.2.3. The Tools Menu
The InstantAtlas Desktop Publisher
Figure 2
g the InstantAtlas Area Profile Template User Guide
The ‘Tools’ menu at the top of the Publisher currently contains only one
option.
Clear History
This option allows you to restore InstantAtlas Publisher to its default state
and will take effect upon re-launching the application. It removes all your
recently used files/settings from the drop down lists in the Publisher.
Please note that clearing the Publisher’s history cannot be undone. This
option should therefore be used only if you have a serious problem using
the Publisher and only after talking to your support provider.
B.2.4. The Help Menu
The ‘Help’ menu at the top of the Publisher currently contains the options
described below.
Help
There are also three buttons linking to additional information. The ‘Legal’
button links to the InstantAtlas End-User Licence Agreement.
The
‘Licence’ button links to ‘Licence File Information’, from which you can also
upload a new licence file. The ‘Templates’ button links to an overview of
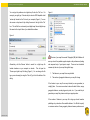
Click this option to access the help pages for the Publisher.
available templates and also allows new templates to be uploaded.
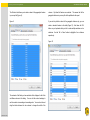
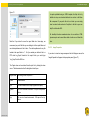
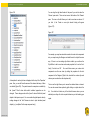
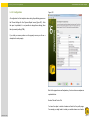
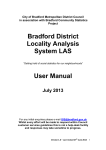
About
B.2.5. User Interface Language
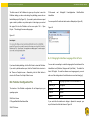
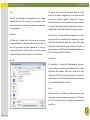
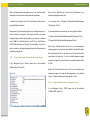
Click this option to open the ‘About’ dialog (Figure 2). The ‘About’ dialog
The default language for the interfaces of the InstantAtlas tools (Publisher,
contains information regarding your Publisher application, including the
Designer and Style Editor) is UK English. However, a number of language
version number and the location of your licence file.
packs are available and these allow you to display different languages in
the interfaces. The US English language pack is automatically added to
your computer when you install InstantAtlas. French, German and Spanish
language packs are also available for installation on a pack-by-pack basis.
© GeoWise
GeoWise Ltd.
Ltd. 2013
2011
©
Page 5
visualise | communicate | ENGAGE
The InstantAtlas Desktop Publisher
You can choose which packs are installed by choosing an Advanced Install
g the InstantAtlas Area Profile Template User Guide
Most of the InstantAtlas templates exist in Flash and HTML
when you install InstantAtlas. You can add or remove packs at any point
by modifying your InstantAtlas installation. To do this, access the list of
Editions.
Generally the information given in this guide will apply
installed programs via the Control Panel, select InstantAtlas and click
irrespective of the selected template. Wherever there are differences
Change.
between Flash and the HTML templates, the information about the
HTML templates will be provided in green shaded boxes such as
You can control the user interface language using the Publisher
configuration file (see section ‘B.4. Publisher Configuration File’).
this.
If no
setting exists in this file, the software will detect the regional setting of your
operating system. If the language pack matching your regional setting is
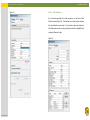
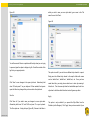
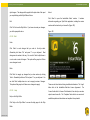
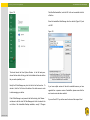
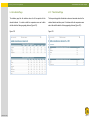
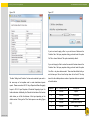
Select a template from the drop down list.
A screenshot and short
not installed, the software will default to UK English. You can change the
description of the template will be displayed.
If the template supports
regional setting of your operating system using the Control Panel.
different languages, a ‘Publish in’ menu is available for selecting the
language you with to publish the report in. Click the ‘Next’ button.
B.3. Publishing a Report
B.3.2. Choose Your Base Geography
The Publisher leads you though the steps required to create a dynamic
report. The following sections provide information concerning each screen.
Each screen has a ‘Help’ button that you can click if you wish to access the
relevant Help page.
You can access the options on each screen by
clicking them using your mouse. The ‘Tab’ button on your keyboard can be
used to cycle through available options on a screen.
B.3.1. Choose a Template
B.3.2.1. Selecting a Layer
This step of the publishing process involves choosing a digital map file for
the base geography for your report.
A digital map file is simply a
representation of geographic features in digital format (as opposed to a
paper map for example).
Base geography is defined as the set of
geographic features that you wish to produce a thematic map for. For
example, if you have crime statistics for community districts in New York
The first step in the publishing process involves choosing a template.
and you wish to make a thematic map of these, the base geography for
Every InstantAtlas dynamic report is based on a template. A template
your InstantAtlas report will be New York community districts.
dictates the core appearance and functionality for a report.
There is the option to publish a report with multiple base geographies. If
you would like more information on this please refer to section ‘H. Multiple
Geography Reports’.
© GeoWise
GeoWise Ltd.
Ltd. 2013
2011
©
Page 6
visualise | communicate | ENGAGE
Digital map files come in a number of different formats, three of which are
g the InstantAtlas Area Profile Template User Guide
supported by the Publisher:
The InstantAtlas Desktop Publisher
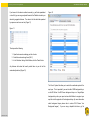
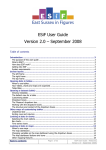
1. Polygon (e.g. the boundaries of New York boroughs)
2. Lines (e.g. the Canadian rail network)
3. Points (e.g. cities in Scotland)
1. ESRI shapefile
2. MapInfo interchange file
The Publisher supports the upload of digital map files of all three geometry
3. MapInfo Table Structure file
types listed above. The geometry type of the digital map file you choose
for your base geography dictates how the map(s) in your published report
ESRI shapefiles have a .shp file extension (e.g. districts.shp). MapInfo
will look.
interchange (also referred to as MID/MIF) files have a .mif file extension
(districts.mif).
MapInfo table structure files have a .tab extension
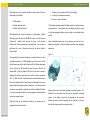
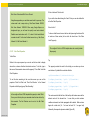
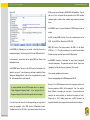
Figure 3 illustrates how the map of your dynamic report will look if you
(districts.tab). All are accompanied by supporting files. You must have a
publish using polygon, line and point digital map files as base geography
digital map file in one of these three formats to be able to publish a
respectively.
dynamic report.
Figure 3
The supporting files required will depend on which file format you have
your digital map data in. For ESRI shapefiles you will also need a .dbf file
with the same name as the .shp file (districts.dbf) For MapInfo interchange
files you will need a .MID file with the same file name as the .MIF file
(districts.MID). Finally for MapInfo TAB files, you will need a number of
additional files with the same filename but with the following extensions:
.DAT, .ID, .MAP and .IND. These files need to be located within the same
folder as the digital map files. Please note that all digital map files may be
supplied with other supporting files not listed here – the extensions listed
are the only ones explicitly required for use with the InstantAtlas Publisher.
If you do not have digital map files for your geographies of interest, please
contact your support provider.
Digital map files can be classified according to the geometry of the
geographic features they describe:
© GeoWise
GeoWise Ltd.
Ltd. 2013
2011
©
Digital map files can have different geographic coordinate systems. The
Publisher will accept digital map files with any geographic coordinate
system.
If you publish a report and the geography in the map looks
distorted you need to check the projection of your map files. If you need
help with this, please contact your support provider.
Page 7
visualise | communicate | ENGAGE
The InstantAtlas Desktop Publisher
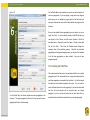
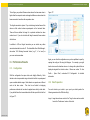
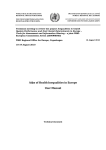
You can type the pathname to a digital map file into the ‘File’ box. For
Figure 5
g the InstantAtlas Area Profile Template User Guide
example, you might type ‘C:\sectors.shp’ to select an ESRI shapefile called
‘sectors.shp’ located on the C: drive of your computer (Figure 4). You can
also access a drop down list by clicking the arrow to the right of the ‘File’
box. This will list the most recently used digital map files and digital map
files saved in the ‘maps’ folder of your InstantAtlas software.
Figure 4
If the size of your map file exceeds 1 Megabyte (MB) the Publisher will
warn you due to the possible negative impact on the performance (loading
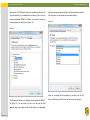
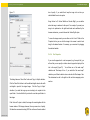
Alternatively, click the ‘Browse’ button to search for a digital map file
and response time) of your dynamic report. There are two interrelated
located elsewhere on your computer or network.
reasons why the size of your map file might be large:
This will open the
‘Choose your digital map file’ dialog (Figure 5). You can change the file
type you are browsing for using the ‘Files of Type’ list at the bottom of the
dialog.
1. The features in your map file are very detailed
2. The number of geographic features in your map file is large
If the features in your map file are very detailed you can generalise (or
simplify) them. You can remove nodes to reduce the detail of lines, merge
geographic features, convert polygons to points, etc. If you need help to
generalise your map files, please contact your support provider.
If the number of features in your map file is large you should consider
publishing only a selection of the available features. It is difficult to specify
a maximum number of base geography features because performance is
© GeoWise
GeoWise Ltd.
Ltd. 2013
2011
©
Page 8
visualise | communicate | ENGAGE
The InstantAtlas Desktop Publisher
ultimately a combination of many factors (such as the number of indicators
g the InstantAtlas Area Profile Template User Guide
included in the XML data files, the speed of an Internet connection the
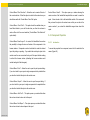
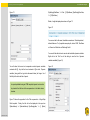
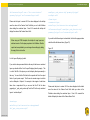
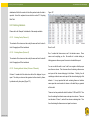
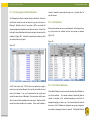
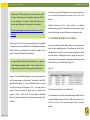
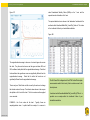
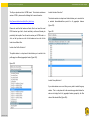
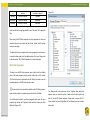
that the names of fields in your map file can be anything. The name of the
field is not important – it is the contents that are important.
report is viewed over, the performance of the computer used to view the
report, etc.). The guideline upper limit is 10,000 features but the only way
Figure 6
to be sure whether the report will perform acceptably is to test this with
your own data/Internet connection/computer/etc.
A digital map file not only stores the geometry of geographic features but
also the attributes of each feature. These attributes are held in one or
more fields, or columns, within the map file. To be used in InstantAtlas,
your ESRI shapefile or MapInfo interchange or TAB file must have a field
that contains codes identifying the geographic features.
It should also
have another field that contains the names of the geographic features if
these are different from the codes.
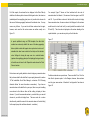
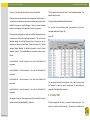
For example, if you have a digital map file with the boundaries of post code
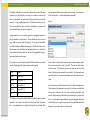
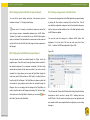
In the ‘Feature code field’ drop down list select the field containing codes.
sectors in Edinburgh (UK) it might contain two fields like this:
Every feature must have a code in this field. The code for each feature
must be unique. The Publisher will warn you (when you click the ‘Next’
CODE
NAME
button) if the field you have selected is not suitable. The field chosen must
EH111
Sector EH11 1
contain the codes of any features that will be used in the data file for your
EH112
Sector EH11 2
EH113
Sector EH11 3
In the ‘Feature name field’ drop down list select the field containing names.
EH114
Sector EH11 4
These names will be displayed in your report if you choose to publish with
etc.
etc.
report.
dummy data. However, if you do not have a suitable name field in your
map file, simply select the same field as that selected in the ‘Feature code
© GeoWise
GeoWise Ltd.
Ltd. 2013
2011
©
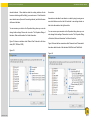
The Publisher will list all the available fields in the digital map file you have
field’. You will be able to specify different names for geographic features in
uploaded in the ‘Feature code field’ and ‘Feature name field’ drop down
the data file(s) for your report (see section ‘E. The InstantAtlas Excel Data
lists. In the example shown in Figure 6 the map file has six fields. Note
Manager’ for more information on entering names).
Page 9
visualise | communicate | ENGAGE
If you are happy with your selections, you can now click the ‘Next’ button.
g the InstantAtlas Area Profile Template User Guide
Alternatively, you can click the Properties or Preview buttons.
The InstantAtlas Desktop Publisher
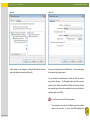
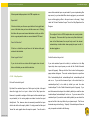
can also edit any other properties listed. Hold your mouse pointer over the
name of the property to see a longer description.
B.3.2.2. Layer Properties of Base Geography Layers
When using an HTML template you will see many more layer
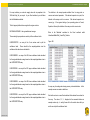
Click the properties button to view the properties for the layer. The ‘Layer
properties (Figure 8). If you wish to change theses settings, it is
Properties’ dialog will open (Figure 7).
advised that you adjust them here in the Publisher even though it is
also possible to change them after the publishing process by editing
Figure 7
the map.js file in a text editor.
Figure 8
The ‘Settings’ tab allows you to change the name of the layer for display in
the final dynamic report as well as the feature code and name fields. You
© GeoWise
GeoWise Ltd.
Ltd. 2013
2011
©
Page 10
visualise | communicate | ENGAGE
The ‘Selection’ tab allows you to select a subset of the geographic features
g the InstantAtlas Area Profile Template User Guide
The InstantAtlas Desktop Publisher
columns. By default all features are selected. This means that all the
in your map file (Figure 9).
geographic features in your map file will be published in the report.
Figure 9
If you wish to publish a subset of the geographic features only, you can
select or deselect features in the table (Figure 10). Hold down the ‘Ctrl’
button on your keyboard while you click to make multiple selections or deselections. Use the ‘All’ or ‘None’ buttons to highlight all or no features
respectively.
Figure 10
The contents of the fields you have selected will be displayed in the Code
and Name columns in this dialog. You can click the column headings to
sort the contents in ascending or descending order. You can also click and
drag the divider between the two columns to change the width of the
© GeoWise
GeoWise Ltd.
Ltd. 2013
2011
©
Page 11
visualise | communicate | ENGAGE
If you have a list of codes in another document (e.g. an Excel spreadsheet
The InstantAtlas Desktop Publisher
Figure 12
g the InstantAtlas Area Profile Template User Guide
or a text file) you can copy and paste these into the Publisher to select your
subset of geographic features. The codes in the list should be separated
by a space or each on a new line (Figure 11).
Figure 11
The steps are the following:
1. Open the document containing your list of codes
2. Select the codes and copy them (Ctrl-C)
3. In the ‘Selection’ dialog of the Publisher, click the ‘Paste’ button
Any features with codes that exactly match those in your list will be
automatically selected (Figure 12).
The ‘Coord. System’ tab allows you to select the coordinate system of the
map layer. This is important if you want to add a WMS background layer,
an ArcGIS Online / ArcGIS Server background layer or a Google Maps
background layer into your report and use the Publisher to re-project your
map files into the projection of the background layer (for more information
about background layers please refer to section ‘B.3.5 Choose Your
Background Images’).
© GeoWise
GeoWise Ltd.
Ltd. 2013
2011
©
If you are using a shapefile that has a .prj file
Page 12
visualise | communicate | ENGAGE
associated to it, the Publisher will pick up the coordinate system out of the
g the InstantAtlas Area Profile Template User Guide
.prj file automatically. If your shapefile does not have a .prj file or if you are
The InstantAtlas Desktop Publisher
features are being displayed incorrectly in the dynamic report you publish.
If this is the case, you can choose a more suitable encoding.
working with MapInfo MID/MIF or TAB files, you will need to specify the
coordinate system your map data is in (Figure 13).
Figure 14
Figure 13
When you are happy with the properties for your layer, click the ‘OK’
The ‘Encoding’ tab allows you to change the encoding setting for a DBF IV
file (Figure 14).
button. Alternatively, click the ‘Cancel’ button to cancel any changes.
You only need to do this if you are using an ESRI
shapefile (.shp) as your digital map file and the names of your geographic
© GeoWise
GeoWise Ltd.
Ltd. 2013
2011
©
Page 13
visualise | communicate | ENGAGE
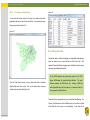
B.3.2.3.
Geo-Preview and Data Preview
The InstantAtlas Desktop Publisher
Figure 16
g the InstantAtlas Area Profile Template User Guide
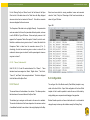
You can click the ‘Preview’ option for the layer if you wish to preview the
geographic features you have chosen to publish. A new window will open
showing your selection (Figure 15).
Figure 15
B.3.3. Choose Your Data
The indicator data, or statistics, displayed in an InstantAtlas Flash dynamic
report are stored in one or more data files in XML format (.xml). XML
stands for Extensible Markup Language and is a flexible format for storing,
structuring and publishing information.
For the HTML templates the indicator data needs to be in JSON
format. JSON stands for JavaScript Object Notation.
The usual
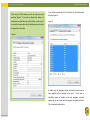
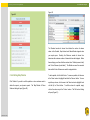
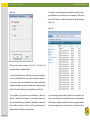
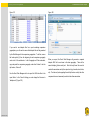
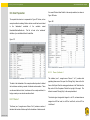
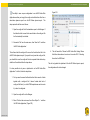
Click the ‘Data Preview’ option to see a simple table with all available
filename extension for JSON files is .json.
attribute fields and their content. This can be helpful when choosing
within InstantAtlas have the file extension .js to ensure that the files
suitable code and name fields (Figure 16).
are recognised by all Web Servers.
However, JSON files
These data files are generated using your InstantAtlas Data Manager. The
‘Choose Your Data’ screen of the Publisher gives you the option to upload
a data XML file for the report you are publishing.
© GeoWise
GeoWise Ltd.
Ltd. 2013
2011
©
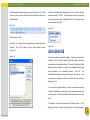
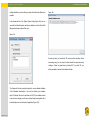
If you have not yet
Page 14
visualise | communicate | ENGAGE
The InstantAtlas Desktop Publisher
created a data file, the Publisher can create demonstration data files for
g the InstantAtlas Area Profile Template User Guide
pathname to your data file into the box (e.g. ‘C:\Documents and
Alternatively, click the ‘Browse’
your report. Alternatively, you may use information stored in your digital
Settings\username\ Desktop\data.xml’).
map file to create a data file (Figure 17).
button to browse for a data file. This file will typically be called ‘data.xml’
as this is the default name given by the InstantAtlas Data Manager
Figure 17
(Figure 18).
Figure 18
The ‘data.xml’ file may have supporting theme XML data files (please refer
to section ‘E. The InstantAtlas Excel Data Manager’, sub-section
‘E.7. Exporting Data Files’ if you are not clear on the reason for this). If this
is the case, the supporting files must be located in the same folder as the
‘data.xml’ file you upload. If they are not located in the same folder, the
Publisher will not be able to publish your report correctly.
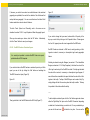
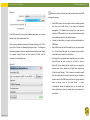
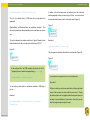
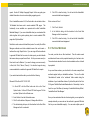
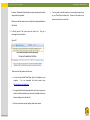
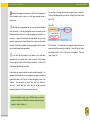
If the XML file you have uploaded is not valid, you will see a warning like
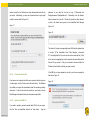
B.3.3.1.
Create a Demo Data File
that show in Figure 19.
If you have not yet created a data file for your report and wish to create one
Figure 19
at a later stage, click the ‘Create a demo file’ radio button. The Publisher
will publish your report with demonstration data files containing arbitrary
data values. A data file can later be created from your Excel or Access
Data Manager and exported directly into the dynamic report folder.
B.3.3.2.
Upload a Data XML File
If you wish to upload a previously created data XML file for your report,
click the “Use an InstantAtlas data.xml file” radio button.
© GeoWise
GeoWise Ltd.
Ltd. 2013
2011
©
Type the
Page 15
visualise | communicate | ENGAGE
The InstantAtlas Desktop Publisher
The most likely reason is that you have created the XML data file using an
g the InstantAtlas Area Profile Template User Guide
incorrectly formatted Excel workbook. You should check the workbook you
used to generate the file and refer to section ‘E. The InstantAtlas Excel
Data Manager’ for the rules on entering data. The error message in the
Please note that this functionality currently doesn’t allow you to define
filters or metadata links for geographic features. If you would like to use
either or both of these functionalities in your data file you should use the
Excel or Access Data Managers.
dialog should give an indication of where the problem lies. For example,
the error message in Figure 19 states that the content of element ‘FilterList’
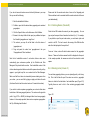
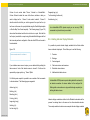
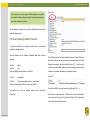
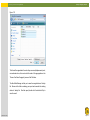
Available data fields (or columns), taken from your digital map file can be
is not complete so you should check the formatting of any filter columns
found in the left hand pane, while your data model is shown on the right.
you have added in your workbook.
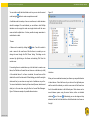
The Data Model and Its Elements
It is currently not possible to upload a data,js file for use with the
By default all available data fields are added as indicators to one single
HTML templates. You can, however, upload a data file in XML
theme called ‘My Theme’ with the names of the data fields used as
format which will be transformed into a data.js file during the
indicator names (Figure 20). This is called the ‘default data model’.
publishing process.
Figure 20
B.3.3.3.
Create a Data File from a Digital Map File
If you wish to use the attribute data stored in your digital map file, click the
corresponding radio button. Note that you cannot use this option if the
report you are publishing has two or more base geographies.
Before you read on, please ensure that you have an understanding of the
general use and purposed of themes, indicators, dates, associates and
metadata within an InstantAtlas data file.
Section ‘E. The InstantAtlas
Excel Data Manager’ provides detailed information about these topics.
If you have not yet defined a data model for your shape file, selecting the
‘Create data file from digital map data’ radio button will automatically
launch the ‘Organise Data’ window (Figure 22), which you can use to
create and manage your data model.
© GeoWise
GeoWise Ltd.
Ltd. 2013
2011
©
Page 16
visualise | communicate | ENGAGE
The InstantAtlas Desktop Publisher
You can either modify the default data model or you can clear the current
Figure 21
g the InstantAtlas Area Profile Template User Guide
model using the
button to create a complete new model.
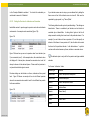
A valid data model is made up of one or more themes, to which indicators
should be assigned. For each indicator you can define a date. Multiple
indicators can be merged to create one single indicator with the same
name and with multiple dates. It is also possible to assign associates to
each indicator or date.
Themes
A theme can be created by clicking the
button. You will be asked to
enter a name for the new theme. After the theme is created you can
change its name through the ‘Edit Theme’ dialog. This dialog can be
accessed by right-clicking on the theme and selecting ‘Edit’ from the
context menu.
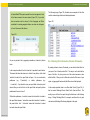
If an existing theme is selected when you click the button to create a new
theme, the Publisher will create this new theme as a sub-theme (or child)
of the selected theme. If no theme is selected, the new theme will be
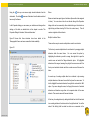
Indicators
added to the root of the data model. When building your data file using the
When you have created and renamed your themes you may add indicators
data model tool you can have as many levels of subthemes as you like.
to these themes. Select the theme of your choice in the right hand pane
You are not restricted to a hierarchy of three levels (themes, indicators and
and then select the indicator you wish to move across to this theme from
dates) as is the case when using the Excel or Access Data Managers.
the list of available indicators in the left hand pane. Data columns can be
Figure 21 shows an example of a possible theme structure.
moved between panes using the arrow buttons, either as individual
selections
or all at once
. Alternatively you can also drag and drop
indicators from the list of data fields from the left hand side into a theme on
the right.
© GeoWise
GeoWise Ltd.
Ltd. 2013
2011
©
Page 17
visualise | communicate | ENGAGE
Using the
button you can remove single selected indicators from the
The InstantAtlas Desktop Publisher
Dates
g the InstantAtlas Area Profile Template User Guide
data model. The button
removes all indicators from the data model and
leaves only the themes.
Dates are treated as special types of indicators (those with a date assigned
to them). You can enter a date for an indicator through the Properties
In the Properties dialog you can rename your indicators and change other
dialog which can be accessed by either double-clicking on the indicator or
settings; all of which are detailed later in this chapter in section ‘The
right-clicking and then selecting ‘Edit’ from the context menu). This will
Properties Dialog of Indicators, Dates and Associates’.
create a single date for the indicator.
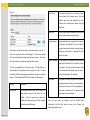
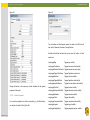
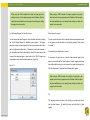
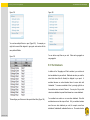
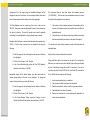
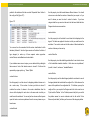
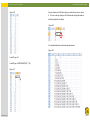
Figure 22 shows that three indicators have been added to the
Multiple Indicator Dates
‘Demographics’ theme and were renamed for better readability.
There are three ways to create a multiple time series for an indicator:
Figure 22
The first way to create multiple dates for an indicator is by merging multiple
indicators within the same theme.
You can access this option by
highlighting the indicators you wish to merge, then right-click to open the
context menu and select the ‘Merge Indicators’ option.
All highlighted
indicators will be merged, meaning they will get the same name and ID as
the top most selected indicator and their current names will become the
dates.
A second way of creating multiple dates for an indicator is by renaming
multiple indicators at the same time so that they have the same name. To
do this, highlight the relevant indicators, then right-click and select the ‘Edit’
option. If you now change the name, it will apply this name to all selected
indicators and therefore merge them to be separate dates of the same
indicator. Their current names will become the dates.
A third way of creating dates is by adding data fields from the left hand side
to an existing indicator in the data model on the right hand side. You will be
asked if the field(s) shall be added as dates or as associates to the
© GeoWise
GeoWise Ltd.
Ltd. 2013
2011
©
Page 18
visualise | communicate | ENGAGE
selected indicator. When added as dates the existing indicator will also
The InstantAtlas Desktop Publisher
Associates
g the InstantAtlas Area Profile Template User Guide
become a date along with the field(s) you moved across. All will share the
same indicator name (the one of the existing indicator) and the field names
will become the dates.
Associates can be added to an indicator or a date by simply moving one or
more data fields across from the left hand side to an existing indicator or
date in the data model on the right hand side.
You can rename your dates in the Properties dialog where you can also
change further settings. Please refer to section ‘The Properties Dialog of
Indicators, Dates and Associates’ for further information.
You can rename your associates in the Properties dialog where you can
also change further settings. Please refer to section ‘The Properties Dialog
of Indicators, Dates and Associates’ for further information.
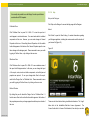
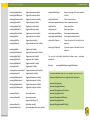
Figure 23 shows an indicator called ‘Natural Gas Production’ with three
dates (2007, 2008 and 2009)
Figure 24 shows that two associates called ‘Numerator’ and ‘Denominator’
have been added to each of the indicators ‘Birth Rate’ and ‘Death Rate’.
Figure 23
Figure 24
© GeoWise
GeoWise Ltd.
Ltd. 2013
2011
©
Page 19
visualise | communicate | ENGAGE
The Context Menu of Data Model Elements
g the InstantAtlas Area Profile Template User Guide
The InstantAtlas Desktop Publisher
expand/collapse indicators to view or hide associates defined for the
indicator(s).
There are a number of options available in the context menu which
appears when you right-click on any of the elements of the data model
The option ‘Sort’ only applies to indicators and allows you to sort any
(Figure 25).
highlighted indicators alphabetically.
Figure 25
Using the ‘Merge Indicators’ option you can define the highlighted
indicators to be different dates of the same indicator. They will each have
the same indicator name and their current names will be used as the dates.
This option is detailed in section ‘Multiple Indicator Dates‘.
To remove an element of the data model, select the ‘Remove’ option. If
you remove a theme that contains indicators or an indicator with associates
the containing elements (‘child elements’) will also be deleted.
The Properties Dialog of Indicators, Dates and Associates
The Properties dialog of indicators, dates and associates allows you to
modify their settings, such as the Name, Date Data Type and Metadata
For themes, the ‘Edit’ option opens the ‘Edit Theme’ dialog which allows
URL (Figure 26).
you to edit the theme name. For all other data model elements the ‘Edit’
associate) some settings may be disabled. The fields ‘Source’ and ‘Parent’
option opens the ‘Properties’ dialog. Please refer to section ‘The Properties
cannot be edited and are for reference only. ‘Source’ shows the name of
Dialog of Indicators, Dates and Associates’ for further information.
the original data field used. ‘Parent’ shows the indicator name that an
Depending on the element type (indicator date or
associate belongs to.
With the ‘Move Up’ and ‘Move Down’ options you can change the order of
elements within the current hierarchy level of the current data model
branch. This can also be done manually by dragging and dropping an
indicator into position (only within the data model on the right-hand side).
Using the ‘Expand’ and ‘Collapse’ options you can expand/collapse themes
to view or hide the indicator belonging to them. You can also
© GeoWise
GeoWise Ltd.
Ltd. 2013
2011
©
Page 20
visualise | communicate | ENGAGE
The InstantAtlas Desktop Publisher
Figure 26
Figure 27
g the InstantAtlas Area Profile Template User Guide
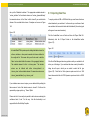
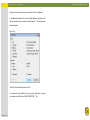
You can add Metadata settings for each indicator, date or associate on the
When you have completed setting the Properties and Metadata click ‘OK’.
‘Metadata’ tab. The precision metadata property is already added to the list
as it is treated differently in the data file than all other metadata properties.
If you do not want to specify a precision for your data here, simply leave
the value cell blank. You can add further rows by clicking on the
or delete rows by using the
button
button. If you do not know the metadata
properties that can be used and what kind of values are expected for each
please refer to section ‘E.6. The Metadata Worksheet’.
Figure 27 shows several metadata properties defined for the indicator
Saving the Data Model and Returning to the IA Publisher
When you are happy with the data model you have created you may wish
to save it for future use. This can be done by clicking the
icon, which
allows you to save your InstantAtlas data model as an XML file in a
location of your choice. If you wish to load a previously created model, use
the load
button to bring up a dialog from which you can choose the
data model you wish to load.
‘Infant Mortality’.
© GeoWise
GeoWise Ltd.
Ltd. 2013
2011
©
Page 21
visualise | communicate | ENGAGE
Once you have created your data model and wish to return to the Publisher
The InstantAtlas Desktop Publisher
Figure 28
g the InstantAtlas Area Profile Template User Guide
Wizard, please click ‘OK’. Your data model will be checked to ensure it is
valid before returning to the Publisher wizard screen.
Now click the ‘Next’ button or alternatively, click the ‘Back’ button to return
to the ‘Choose Your Base Geography’ screen.
B.3.4. Choose Your Contextual Geographies
This step of the publishing process involves choosing contextual
geographies if these are required. Contextual geographies are displayed
in dynamic reports to provide context to the map(s). They are not used for
thematic mapping as this role is reserved for the base geography. You
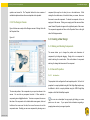
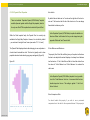
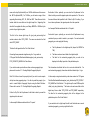
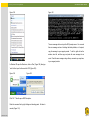
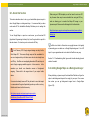
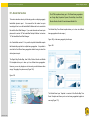
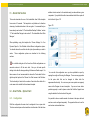
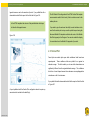
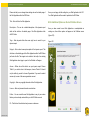
You can upload digital map files of polygon, line or point geometry type. In
may choose multiple contextual geographies for your dynamic report if you
Figure 28, a polygon type digital map file was uploaded as the contextual
wish.
geography.
There are two types of contextual layers. You can either upload a digital
map file into the Publisher or you can use a GeoRSS connection to feed
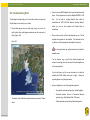
Figure 29 shows an example of a point digital map file
uploaded as a contextual geography.
Figure 29
the geographic features on-the-fly into your report (requires internet
connection).
B.3.4.1. Digital Map Files as Contextual Layers
As with the base geography, digital map files should be uploaded in either
ESRI shapefile (.shp), MapInfo interchange file (.mif) or MapInfo table
structure (.tab) format.
For example, you might wish to show district boundaries as an overlay to a
base geography consisting of post code sectors. In Figure 28, the district
boundaries have been set to be red and thicker than the sector boundaries
(light grey).
© GeoWise
GeoWise Ltd.
Ltd. 2013
2011
©
Page 22
visualise | communicate | ENGAGE
It is possible to show labels for contextual features – this process is
The InstantAtlas Desktop Publisher
Figure 31
g the InstantAtlas Area Profile Template User Guide
described in section ‘C. The InstantAtlas Designer’ in sub-section
‘C.4.3.6. Map Properties’.
When using an HTML template you can show labels for contextual
layers by ticking the ‘Display Labels?’ setting in the layer properties
in the Publisher.
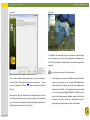
Click the ‘Add’ button and select ‘Digital Map File’ to add a digital map file
for your contextual geography (Figure 30).
Figure 30
The ‘Preview’ and ‘Data Preview’ buttons work in the same was as
described in section ‘B.3.2.3. Geo-Preview and Data Preview’
The 1 MB rule that was described in section ‘B.3.2. Choose Your Base
Geography’ also applies to contextual geography map files. Furthermore,
the digital map files uploaded as contextual geographies should have the
A new ‘Digital map file’ box appears (Figure 31). Type the pathname to a
same geographic coordinate system as the digital map file uploaded as the
digital map file into the ‘File’ box or click the arrow to the right to access a
base geography. If this is not the case, your contextual geographies may
list of recently used map files. Alternatively, click the ‘Browse’ button to
not appear in the published report. If the coordinate systems of your digital
browse for a map file on your computer or network. In the ‘Feature code
map file differ significantly, the Publisher will produce a warning after
field’ drop down list select the field containing codes. Currently, contextual
clicking the ‘Publish button’ at the end of the Publisher
layers are for context only and no data are matched to them so the codes
you select are not critical (they could be the same as the names for
example). They must be unique however and different from any codes
You can edit the layer properties by clicking on the ‘Properties’ button. In
used in the base geography or other contextual geographies.
the ‘Settings’ tab, you can change the layer name as it appears in the
In the ‘Feature name field’ drop down list select the field containing names.
This should not contain any nulls.
© GeoWise
GeoWise Ltd.
Ltd. 2013
2011
©
B.3.4.2. Layer Properties of Contextual Geography Layers
report as well as the feature code and name fields. You can also edit any
other properties listed (Figure 32).
Page 23
visualise | communicate | ENGAGE
Figure 32
The InstantAtlas Desktop Publisher
Figure 33
g the InstantAtlas Area Profile Template User Guide
Valid icon formats are JPG and PNG.
If you would like to have a
transparent background, you need to create a PNG file since the JPG
format does not support transparency.
Some of the most common symbols in the different colours can be found in
Fill opacity defines whether the centre of a layer has opaqueness or not,
the installation folder of your InstantAtlas software, in a subfolder called
where 0 means complete transparent and 1 means complete opaqueness.
‘icons’. The default location for this is:
By default, contextual layers are set to 0. For point layers in particular, you
C:\Program Files\GeoWise\InstantAtlas\icons\.
may want a value higher than 0 in order to see filled points instead of
circles or ‘hoops’.
For line or polygon contextual layers the Icon File property should be left
blank.
If your contextual layer is a point layer you might also wish to upload an
icon file which will be displayed in the map for each of the points. This icon
replaces the default circle symbol (Figure 33).
© GeoWise
GeoWise Ltd.
Ltd. 2013
2011
©
Page 24
visualise | communicate | ENGAGE
The InstantAtlas Desktop Publisher
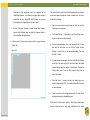
If you edit the properties and click the ‘Selection’ tab, the following dialog
g the InstantAtlas
Area Profile
Template
User Guideyou
When using
an HTML
template
properties (Figure 8).
will see many more layer
will open (Figure 35).
If you wish to change these settings it is
advised that you adjust them here in the Publisher, even though it is
Figure 35
also possible to change them after the publishing process by editing
the map.js file in a text editor.
Figure 34
By default, only the geographic features that overlap a box around the
base geography will be published in the report.
As the maps in
InstantAtlas reports are centred on the base geography, contextual
features that do not overlap the base geography are typically irrelevant.
This is therefore the default option.
© GeoWise
GeoWise Ltd.
Ltd. 2013
2011
©
Page 25
visualise | communicate | ENGAGE
If, however, you wish to have control over which features in the contextual
The InstantAtlas Desktop Publisher
Figure 37
g the InstantAtlas Area Profile Template User Guide
geography are published, then un-tick the checkbox ‘Use all features that
overlap the base geography’. You can now either leave the default of all
features selected or select a subset of features.
The tabs ‘Coord. System’ and ‘Encoding’ work in the same was as
described in section ‘B.3.2.2. Layer Properties of Base Geography Layers’.
When you have made your choices, click the ‘OK’ button. Alternatively,
click the ‘Cancel’ button to cancel your changes.
If you wish to change the layer name, border width or fill opacity of the
layer you can do this by clicking on the ‘Properties’ button. Please ignore
the ‘Icon File’ property since this is not supported for GeoRSS feeds.
B.3.4.3. GeoRSS Feeds as Contextual Layers
GeoRSS Feeds are structured in XML format, usually providing a <title>
tag and a <content>, <summary> or <description> tag for each geographic
It is currently not possible to include GeoRSS Feeds into reports
feature.
published with an HTML template.
If labels get activated using the Designer (see section C. The InstantAtlas
If you wish to include a GeoRSS feed as a contextual layer into your Flash
report you can do this by clicking the ‘Add’ button and selecting the
‘GeoRSS Connection’ option (Figure 36).
Designer, subsection C.4.3.6. Map Properties) it will show the value of the
<title> tag for each entry of the GeoRSS as a label. If tooltips get activated
the value of the <content>, <summary> or <description> tag will appear. If
none of these three is available, the report will show the value of the <title>
Figure 36
tag also in the tooltip. Tooltips of GeoRSS layers can be made “sticky” by
simply clicking with the left mouse key when the tooltip is visible. That way
it is possible to follow links within the tooltip.
-----To add multiple contextual layers click the ‘Add’ button again and choose
Then type the link to the GeoRSS feed into the URL field (Figure 37).
either the ‘Digital Map File’ option or the ‘GeoRSS Connection’ depending
on what kind of contextual layer you wish to add. For any contextual layer,
you can click the red cross
© GeoWise
GeoWise Ltd.
Ltd. 2013
2011
©
to delete it at any time. You can use the
Page 26
visualise | communicate | ENGAGE
green up/down arrows
The InstantAtlas Desktop Publisher
to re-order your geographies. The vertical
g the InstantAtlas Area Profile Template User Guide
1. A collection of images on a local or network drive
order you see in the Publisher will be preserved in the published report. In
2. A Web Map Service (WMS)
the report, a contextual geography will be displayed on top of the
3. A ArcGIS Server map service
geographies below it and beneath the geographies above it.
4. Google Maps
We
recommend that any point contextual layers you add are moved above any
polygon or line contextual layers for display purposes.
Once you have made your selections, click the ‘Next’ button. Alternatively,
click the ‘Back’ button to return to the ‘Choose Your Data’ screen.
B.3.5.1.
Adding Images from a Background Image Collection
Any geo-referenced images saved on a local or network drive can be
displayed as background mapping. We strongly recommend that each
image is no larger than 1 MB in file size. It is important to keep the file size
B.3.5. Choose Your Background Images
down as the larger the images, the longer it will take for them to load into a
report.
If your images are larger than 1MB, you can process them to
This step of the publishing process involves choosing background images
reduce their file size or you can split one image into separate tiles (the
if these are required. Background images appear in the map(s) of your
report will only load the tiles it needs to fill and map at any given point in
report to provide additional context and can be switched on and off.
time).
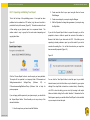
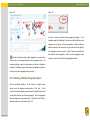
Figure 38 shows the map in a dynamic report with background mapping
switched on.
To include a layer of background mapping, you must upload an index file
into the Publisher. Each layer must have a separate InstantAtlas index file.
Figure 38
This index file is an XML file (.xml) that specifies geographic coordinates
for each image included in the layer of background mapping. Without this
information, InstantAtlas reports would be unable to position background
images correctly in the map(s). A sample index file can be found in the
‘images’ folder created during the installation of your InstantAtlas software.
This folder is a convenient place to store all of your background images
and index files. It is important that an index file is stored in the same folder
as the images that it references.
The background images for a report can come from the following sources:
© GeoWise
GeoWise Ltd.
Ltd. 2013
2011
©
Page 27
visualise | communicate | ENGAGE
You canArea
findProfile
a guide
to creating
images
g the InstantAtlas
Template
User Guide
The InstantAtlas Desktop Publisher
or index files for background
The ‘Min extent’ and ‘Max extent’ boxes define the range of map widths at
mapping in the InstantAtlas online support resources under ‘Tips and
which this background mapping layer will display in your report. The units
Tricks’: http://www.instantatlas.com/supportdownloads.xhtml
are map units and therefore depend on the geographic coordinate system
of your map files. For example, if the coordinate system is British National
Click the “Add” button to upload an index file and click the ‘Background
Grid the units will be metres. The smaller the ‘Min extent’ value, the further
Image Collection’ option. You can type the pathname to the index file into
you have to zoom into the map before this background mapping layer
the ‘Index file’ box (e.g. ‘C:\images\250k.xml). You can also access a drop
disappears. The greater the ‘Max extent’ value, the further you have to
down list of the most recently used index files by clicking the arrow to the
zoom out of the map before this background mapping layer disappears.
right of the ‘Index file’ box. Alternatively, click the ‘Browse’ button to search
for an index file located elsewhere on your computer or network
(Figure 39).
The layer shown in Figure 39 will never switch on if the map is displaying
an area that is more than 100,000,000 map units wide. If the area shown
in the map is less than 100,000,000 map units wide, this background
Figure 39
mapping layer will display, no matter how far you zoom into the map.
You might decide to add a second background mapping layer by clicking
the “Add” button and browsing for a new index file called ‘detailed.xml’
(Figure 40). Imagine that the images referenced by ‘detailed.xml’ are more
detailed than those referenced by ‘coarse.xml’.
The publisher needs to know the file extension of any images that are
used. We currently support JPEG and PNG image formats for use as
background mapping, so please specify your image format here. If your
images are not in either of these formats you will have to convert them.
© GeoWise
GeoWise Ltd.
Ltd. 2013
2011
©
Page 28
visualise | communicate | ENGAGE
Figure 40
g the InstantAtlas Area Profile Template User Guide
The InstantAtlas Desktop Publisher
layer (the images referenced by ‘course.xml’) to another (the images
referenced by ‘detailed.xml’).
If you have multiple layers of background mapping, you must ensure
that the ranges you specify for the layers do not overlap.
If you wish to make more advanced settings for background mapping, click
the ‘Advanced’ button for a layer. The ‘Choose Map Features’ dialog will
appear (Figure 41).
Figure 41
You can see that the ‘Min extent’ and ‘Max extent’ values have been
edited. The coarser (or less detailed) background mapping layer is set to
display for map widths between 50,000 and 100,000,000 units. The more
detailed background mapping layer is set to display for map widths
between 0 and 50,000 map units. As you zoom into the map in this report,
you will reach a point at which the area shown is less than 50,000 map
units wide. At this point, the background mapping will switch from one
By default, only the background images that overlap (or intersect) the base
geography will be published in the report. As the maps in InstantAtlas
© GeoWise
GeoWise Ltd.
Ltd. 2013
2011
©
Page 29
visualise | communicate | ENGAGE
The InstantAtlas Desktop Publisher
reports are centred on the base geography, images that do not overlap the
g the InstantAtlas Area Profile Template User Guide
base geography are typically irrelevant.
Figure 42
This is therefore the default
option.
If, however, you wish to publish all images referenced by the index file
irrespective of whether they overlap the base geography or not then click
If you have chosen to include a large number of background mapping
images in your report, you might decide to click the ‘No’ radio button. The
the ‘Use all features’ radio button. If you wish to select a particular subset
images will not be copied to the output folder and after publication you will
of images to publish in the report, click the ‘Use features highlighted in the
have to configure your report to look for images in a different folder. This is
table below’ radio button and make your selection.
for file management reasons: if you have a large number of background
images, it is not ideal to replicate these in the output folder of every report
When you have made your choice, click the ‘OK’ button. Alternatively, click
you publish. It is more efficient to store the images in one folder and
the ‘Cancel’ button to cancel your selections.
configure each of your reports to read the images from this folder. To
configure a report to read images from a different folder you must use the
InstantAtlas reports only currently support JPG and PNG as formats
for background mapping. File extensions listed in index files are irrelevant
InstantAtlas Designer – please consult section ‘C. The InstantAtlas
Designer’, sub-section ‘C.4.3.6. Map Properties’ for more details.
and are not used by the Publisher – it is important only that the name of the
file (excluding the extension) in the index file matches the name of the JPG
or PNG image it relates to.
At the foot of the screen you are asked whether you wish to copy
background images to the output folder of your report. The output folder is
the folder in which the Publisher saves the published report. By default,
B.3.5.2. Adding Images from a WMS Connection
The Web Map Server Connection allows you to build in background layers
that come directly from a WMS (Web Map Service) compliant mapping
server.
You can find out more about the WMS specification at
http://www.opengeospatial.org.
InstantAtlas reports look for background images in their output folder. For
Although there is no definitive list of available WMS resources, there are a
this reason you will typically leave the ‘Yes’ radio button selected
number of resources on the Web including:
(Figure 42). Note that Publisher will only be able to copy images to the
output folder if it can find these in the same folder as the index file(s) you
http://www.skylab-mobilesystems.com/en/wms_serverlist.html
have uploaded.
http://www.geographynetwork.com/explorer/explorer.jsp?goTo=search&ke
yword=wms&type=001
© GeoWise
GeoWise Ltd.
Ltd. 2013
2011
©
Page 30
visualise | communicate | ENGAGE
To add a new WMS layer to your dynamic report click on the “Add” button
g the InstantAtlas Area Profile Template User Guide
The InstantAtlas Desktop Publisher
It is possible to specify further WMS options, such as multiple layers,
at the bottom of the screen and select “Web Map Service (WMS)
image formats and transparency by clicking the ‘Advanced’ button. This
Connection”.
will launch the Web Map Server Settings dialog box as shown in Figure 44.
Enter the URL address for a WMS service in the Server address box e.g.
Figure 44
http://ias.instantatlas.com/IASP-J/ws/wms?
When you hit the refresh button a list of available map layers should
appear in the box below (see Figure 43 below):
Figure 43
The available list of map layers can be found in the left hand side box, and
Pick the relevant layer from the drop down box: e.g. OS miniscale.
layer groups can be expanded and collapsed. To add layers, navigate
through the groupings
Finally you should pick a co-ordinate system for the map to come back in.
Two of the most commonly used co-ordinate systems will be EPSG: 4326
to add and click the
to a map layer
. Select the layer(s) you wish
button to move it to your selected layers list as
shown in Figure 45.
for decimal degrees of latitude and longitude and EPSG: 27700 for UK
national grid.
Layers can be removed individually using the
layers can also be changed using the
© GeoWise
GeoWise Ltd.
Ltd. 2013
2011
©
button. The ordering of
buttons.
Page 31
visualise | communicate | ENGAGE
Figure 45
The InstantAtlas Desktop Publisher
Figure 46
g the InstantAtlas Area Profile Template User Guide
Further settings can be changed by clicking the Settings tab which will
Here you can change the name of the WMS Layer. This name will appear
open up the dialog box shown below (Figure 46).
in the legend of your dynamic report.
You can choose the coordinate system in which the WMS will send the
image data to the report. The ‘Re-project digital map data?’ property is
ticked by default, which means that the Publisher will re-project all base
and contextual layers that you have uploaded for your report to match the
coordinate system of the WMS.
It is vital that you consider the following points:
1. This re-projection only works if the Publisher knows the coordinate
system of your map files.
© GeoWise
GeoWise Ltd.
Ltd. 2013
2011
©
If you are using ESRI shapefiles that
Page 32
visualise | communicate | ENGAGE
The InstantAtlas Desktop Publisher
include a .prj file, the Publisher can pick up the coordinate system
g the InstantAtlas Area Profile Template User Guide
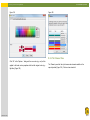
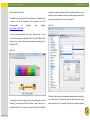
information out of this file. If your shapefile does not have a .prj file
available palettes (Figure 47). Once you have selected a colour, click ‘OK’
to return to the previous dialog screen.
or if you are working with MapInfo MID/MIF or TAB files, you will
need to select the appropriate coordinate system from the Layer
Properties in the ‘Coord System’ tab.
Figure 47
Alternatively you can re-
project these map layers before using them in InstantAtlas.
2. The re-projection will only work if your map file(s) are in one of the
following supported coordinate systems:
a. Un-projected coordinate systems (e.g. latitude/longitude)
b. Coordinate systems that use a Transverse Mercator projection
(e.g. British National Grid, UTM zones)
c.
Global coordinate systems using a Mercator projection.
d. Lambert Conformal Conic projection
If your map layers are already in the same projection as the WMS you
should untick this property.
The image format drop-down returns a list of all available image formats
supported by the Web Map Server you are connecting too. Please note
that while a large variety of formats may be supported by the WMS server,
InstantAtlas will currently only support JPEG (.jpg), PNG (.png) and GIF
(.gif) formats, so it is important that one of these formats is chosen.
It is also possible to specify the background colour of the image you
request. Imagine choosing a layer that specifies land cover. Rather than
leaving the background (areas of no data) white by default, you may wish
to request this in blue to represent areas of water. Select the colour you
wish to use by clicking the Choose button and selecting a colour from the
© GeoWise
GeoWise Ltd.
Ltd. 2013
2011
©
Finally, there is a checkbox option to request the image with a transparent
background. This option is dependent upon the WMS server supporting
the provision of transparent background images. If not, this request will be
ignored by the server.
If transparency is supported, take care to also
select an image format that supports transparency from the image format
drop down list. Formats that support transparency are .png and .gif.
Figure 48 shows a typical request. The transparent background check box
is ticked, and we have chosen an appropriate image format that will handle
this transparency if the server supports it. If transparency isn’t supported,
the image will revert to having a blue background colour.
Page 33
visualise | communicate | ENGAGE
Figure 48
g the InstantAtlas Area Profile Template User Guide
The InstantAtlas Desktop Publisher
There are a number of issues you should consider when using WMS
background mapping:
Many WMS servers will only support certain coordinate systems
and these must match those of your base and contextual
geographies.
match the WMS projection if you have provided information about
If the WMS you want to use requires additional parameters, you can enter
these into the ‘Custom parameters’ field.
the coordinate system(s) of your digital map layers.
When you have finished choosing your advanced settings, click ‘OK’ to
return to the ‘Choose Your Background Images’ screen. The dialog may
The Publisher can re-project your map layers to
Currently in InstantAtlas you cannot control scale thresholds for
WMS layers.
Many WMS servers will limit the scales that you can request data
have been updated to reflect any additional layers that have been chosen.
for. So even though the layer may not appear in your map this
For example, Figure 49 shows we have chosen ‘OS 250k’ and ‘OS
may be because you need to zoom in further.
miniscale’ as our two map layers.
If the checkbox in the legend turns orange when you try to switch
the WMS layer on, and no check or tick mark in the box
Figure 49
(Figure 50), please ensure that the location you are viewing the
dynamic report from is added to your Flash Player trusted sites
(Global Security Settings). This is because an external request
has to be made from the location from which you are viewing the
dynamic report to the WMS server and this will in many instances
cause a security issue for the Flash Player.
In many
circumstances, having the dynamic report on an external web
server (rather than a local or network drive), will overcome the
need for this.
© GeoWise
GeoWise Ltd.
Ltd. 2013
2011
©
Page 34
visualise | communicate | ENGAGE
Figure 50
The InstantAtlas Desktop Publisher
As an example of incorporating ArcGIS Online maps you can click the
g the InstantAtlas Area Profile Template User Guide
ArcGIS Server option and paste the URL below into the box:
http://server.arcgisonline.com/ArcGIS/rest/services/World_Street_Map/Map
Server?
The way the Publisher handles ArcGIS Server map services is very similar
to WMS connections. Please refer to the previous section to get further
information on this. You will, however, not be able to choose a different
If you are not able to see the WMS background once the report is
saved on a web server but it is working with a local copy of the
background colour for your ArcGIS Server map service.
B.3.5.4. Adding Images from Google Maps
report, it may be that your WMS does not provide a cross-domain
policy file. This file is required if you are using Flash Player version
There is a dedicated section in this user guide available explaining how to
11.4 or higher.
create an InstantAtlas report with a Google Maps background.
Please read this article for further information:
http://www.instantatlas.com/downloads/EN_Flash_Reports_Updat
Please
refer to section ‘G. Google Maps in InstantAtlas Reports’.
e_Sept_2012.pdf
When you have finished choosing your background image settings, click
the ‘Next’ button.
Flash Player Security will not be an issue when using an HTML
Alternatively, click the ‘Back’ button to return to the
‘Choose Your Contextual Geographies’ screen.
template as they do not need the Flash Player to run.
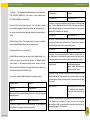
B.3.6. Choose Settings For Your Dynamic Report
B.3.5.3. Adding Images from a ArcGIS Server Map Service
This step of the publishing process involves specifying editable settings for
The ArcGIS Server option allows you to incorporate background mapping
your dynamic report.
The properties available will depend upon the
from a service in ArcGIS Server such as ArcGIS Online. ArcGIS Online
template you chose for your report.
provides ready-to-use map services with coverage for many countries.
depend upon the language you chose to publish your report in. You can
You can find more information about ArcGIS Online here:
click and drag the divider between the ‘Property’ and ‘Value’ column
The language they appear in will
headings to change the width of the columns.
http://www.esri.com/software/arcgis/arcgis-online-map-and-
An example of the
‘Standard’ settings can be seen in Figure 51.
geoservices/map-services.html
© GeoWise
GeoWise Ltd.
Ltd. 2013
2011
©
Page 35
visualise | communicate | ENGAGE
The InstantAtlas Desktop Publisher
Figure 51
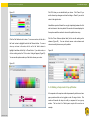
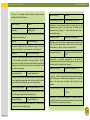
Colour Profile
g the InstantAtlas Area Profile Template User Guide
The colour profile allows you to choose a default
colour scheme for the dynamic report. Once the
dynamic report has been published the colour
scheme can be changed even further using the
Style Editor.
Report Title
The title of your report as viewable in the title screen
of your browser when the report is opened.
Report Keywords
During publishing, these keywords will be saved as
a meta tag in the atlas.hml file. They are helpful if
you want your report to be found by search engines.
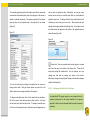
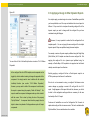
Some values are free text and some can be selected from a pick list. To
Ideally you would provide 3-4 keywords about the
edit a value, simply click in the cell containing it. For text values, double
topic of your report.
click in the cell, delete the existing value and type a new one. Then press
Report Description
the ‘Enter’ button on your keyboard to register the new value.
During publishing, this description will be saved as a
meta tag in the atlas.hml file. It is helpful if you want
You do not necessarily have to edit every value. The table below is a
your report to be found by search engines. Ideally
cross-template list of properties with a description for each.
you would provide a description about the topic of
We have
excluded the HTML template properties as these are covered in a separate
your report with approx. 155 characters.
section (‘L. The InstantAtlas HTML Profile Template’) for that template.
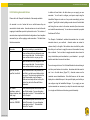
Map Margin
Property
The greater the value, the greater the amount of
empty space that surrounds your base geography in
Description
the map(s) of your report. If the base geography for
Configuration
The configuration option allows you to choose the
your report is a point map file, it is typical to add a
default design and layout from those that are
map margin for improved display.
available.
Once the dynamic report has been
published the design and layout can be changed
Once you have made your selections, click the ‘Publish’ button.
even further using the Designer.
Alternatively, click the ‘Back’ button to return to the ‘Choose Your
Background Images’ screen.
© GeoWise
GeoWise Ltd.
Ltd. 2013
2011
©
Page 36
visualise | communicate | ENGAGE
The InstantAtlas Desktop Publisher
2. Create new data files for your report using the Excel or Access
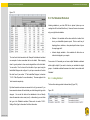
B.3.7. Unpacking and Starting Your Report
g the InstantAtlas Area Profile Template User Guide
Data Manager
This is the final step of the publishing process.
Your report has been
published and is contained in a ZIP archive (.zip), the name for which is
provided at the top of the screen (Figure 52). This archive contains the set
of files making up your dynamic report in a compressed format.
3. Create a new design for your report using the Designer
4. Edit the Stylesheet to change the appearance of your report using
the Style Editor
The
archive makes it easy to group the files and makes transporting and
If you click the ‘Unpack Report’ button to unpack the report, you will be
copying them faster.
prompted to choose a folder to unpack the contents of the archive to.
Browse to the folder of your choice and click ‘OK’. If the folder you are
Figure 52
unpacking to already contains a report you will be asked if you wish to
overwrite the existing files. You will be informed when your report has
been successfully unpacked (Figure 53).
Figure 53
Click the ‘Preview Report’ button to view the report you have published.
The report will be unpacked to a temporary folder C:\Documents and
You can click the ‘View Report’ button to start the report in your default
Settings\username\Local
or
Internet browser (note that this button may be blocked by your system
C:\Users\username\AppData\Local\Temp (Windows Vista or later) for
settings if the output folder is located on a network drive). Alternatively,
preview purposes.
click ‘OK’ to close the dialog you can view it by browsing to the output
Settings\Temp
(Windows
XP)
folder and double clicking the file called ‘atlas.html’. Remember that for
If you are happy with the preview of your dynamic report, you should click
the ‘Unpack Report’ button. This will enable you to carry out any of the
Flash dynamic reports you need the Adobe Flash Player 9 or later installed
on your computer to view the report.
actions listed below:
1. View the report once you have closed the Publisher
© GeoWise
GeoWise Ltd.
Ltd. 2013
2011
©
Page 37
visualise | communicate | ENGAGE
The final screen of the Publisher also gives you the option to save the
g the InstantAtlas Area Profile Template User Guide
Publisher settings you have made during the publishing process into an
The InstantAtlas Desktop Publisher
C:\Documents
and
Settings\All
Users\Application
Data\GeoWise\
InstantAtlas
InstantAtlas project file (Figure 54). If you need to produce the same report
again or wish to publish a very similar report at a later stage you can load
this project file into the Publisher via the menu option ‘File’ – ‘Open
Project...’.This will apply the same settings again.
You can open this file with a text editor such as Notepad (see Figure 55).
Figure 55
Figure 54
B.4.1. Changing the Interface Language of the IA Tools
If you have finished publishing, click the ‘Exit’ button to close the Publisher.
You can add a new setting to control the language for the interfaces of the
If you wish to publish another report, click the ‘Restart’ button to return to
InstantAtlas tools (Publisher, Designer and Style Editor). The default for
the ‘Choose a Template’ screen. Alternatively, click the ‘Back’ button to
this is UK English. To make the software use a language pack, you must
return to the ‘Choose Your Output Folder’ screen.
add one of the settings show in the table below on a new line below [gui]:
B.4. Publisher Configuration File
Setting
Language you wish to run the software in…
locale=en_US
US English
The location of the Publisher configuration file will depend upon your
locale=de
German
operating system.
locale=es
Spanish
locale=fr
French
With Vista it is here:
C:\ProgramData\GeoWise\InstantAtlas
If you would like the interfaces to display in Spanish for example, your
iap.ini file should look like that shown in Figure 56.
With XP it is here:
© GeoWise
GeoWise Ltd.
Ltd. 2013
2011
©
Page 38
visualise | communicate | ENGAGE
Figure 56
g the InstantAtlas Area Profile Template User Guide
The InstantAtlas Desktop Publisher
B.5. Publisher Error Logs
When an error occurs in the Publisher, a log file (.log) is created in the
following places, depending on your operating system:
Basic log files:
Windows Vista and Windows 7:
Save the iap.ini file and start the Publisher. Assuming you have installed
C:\Users\username\AppData\Local\GeoWise\InstantAtlas\ia{x}.log
the correct language pack, the interface text will now be in the language
that matches your locale setting.
Windows XP:
C: \Documents and Settings\username\Local Settings\Application Data\
B.4.2. Disabling the WYSIWYG Interface of the Designer
GeoWise\InstantAtlas\ia{x}.log
When opening the config.xml file of a Flash report that was published using
Advanced log files:
a template in version 6.5.0 onwards, the Designer will open by default with
the WYSIWYG (‘What-You-See-Is-What-You-Get’) interface. If you would
like to disable this interface, you can do this by adding the following on a
new line below [gui] into the iap.ini file: designer.wysiwygEdit=false
Your iap.ini file should look like that shown in Figure 57.
Figure 57
Windows Vista and Windows 7:
C:\Users\username\AppData\Local\Temp\ia_stderr.log
Windows XP:
C:\Documents and Settings\username\Local Settings\Temp\ia_stderr.log
Where username is your username and {x} is a numeral. There may be
multiple log files in these folders. Check the date and time of creation to
identify the one you require. You can open a log file using any text editor
(e.g. Notepad). When contacting the support team for troubleshooting,
please include these error messages as they can help your support
provider resolve problems quickly.
© GeoWise
GeoWise Ltd.
Ltd. 2013
2011
©
Page 39
visualise | communicate | ENGAGE
The InstantAtlas Designer
g the InstantAtlas Area Profile Template User Guide
C. THE INSTANTATLAS DESIGNER
C.1.
About this Section .................................................................................................................. 42
C.2.
Starting the Designer ............................................................................................................. 42
C.3.
The Designer Window............................................................................................................ 43
C.3.1.
C.3.1.1.
File ......................................................................................................................... 43
C.3.1.2.
Edit ......................................................................................................................... 45
C.3.1.3.
Select ..................................................................................................................... 45
C.3.1.4.
Insert ...................................................................................................................... 45
C.3.1.5.
Layout .................................................................................................................... 46
C.3.1.6.
Style ....................................................................................................................... 47
C.3.1.7.
View ....................................................................................................................... 47
C.3.1.8.
Help ........................................................................................................................ 48
C.3.2.
C.4.
The Designer Canvas .................................................................................................... 49
Creating a New Design .......................................................................................................... 49
C.4.1.
Moving and Resizing Components ................................................................................ 49
C.4.2.
General Properties ......................................................................................................... 49
C.4.2.1.
Introduction ............................................................................................................ 49
C.4.2.2.
Configuring the Visible Text in the Report ............................................................. 50
C.4.2.3.
Configuring the Contextual Menu (Right Mouse Button Menu) ............................. 51
C.4.3.
© GeoWise
GeoWise Ltd.
Ltd. 2013
2011
©
Menus and Toolbars ...................................................................................................... 43
Component Properties ................................................................................................... 52
C.4.3.1.
Introduction ............................................................................................................ 52
C.4.3.2.
Button Properties ................................................................................................... 53
Page 40
visualise | communicate | ENGAGE
C.4.3.3.
The InstantAtlas Designer
Image Properties .................................................................................................... 56
g the InstantAtlas Area Profile Template User Guide
Text Properties ....................................................................................................... 57
C.4.3.5.
Table Properties ..................................................................................................... 60
C.4.3.6.
Map Properties ....................................................................................................... 62
C.4.3.7.
Bar Chart Properties .............................................................................................. 67
C.4.3.8.
Time Series Chart Properties................................................................................. 68
C.4.3.9.
Advanced Pie Chart Properties ............................................................................. 70
C.4.3.10.
Pyramid Chart Properties ....................................................................................... 71
C.4.3.11.
Dot Plot Properties ................................................................................................. 72
C.4.3.12.
Statistics Box Properties ........................................................................................ 73
C.4.3.13.
Google Search Properties ...................................................................................... 75
C.4.3.14.
Feature Card Properties ........................................................................................ 76
C.4.4.
Editing Map Palettes ...................................................................................................... 77
C.4.5.
Making a Component a Pop-up Window ....................................................................... 78
C.5.
© GeoWise
GeoWise Ltd.
Ltd. 2013
2011
©
C.4.3.4.
Applying a Design to Other Dynamic Reports ....................................................................... 80
Page 41
visualise | communicate | ENGAGE
The InstantAtlas Designer
C.1. About this Section
g the InstantAtlas Area Profile Template User Guide
Also be aware of the type of computer monitor screen that the majority
of your end-users will be using.
The InstantAtlas Designer is a tool for changing the design of an
InstantAtlas dynamic report. You change the design of a report for the
following reasons:
In particular, the minimum screen
resolution of the monitor used by your audience is very important. Many
web designers currently ensure their interfaces are readable at a minimum
screen resolution of 1024 x 768 pixels. In many cases modern PC screens
1. To change the visibility, layout, text, colours and configuration of
existing report components (maps, tables, charts, buttons, etc)
2. To insert components that we have made invisible by default (e.g.
the advanced pie chart) or insert your own buttons, text or images.
support much higher screen resolutions. If you are developing a report for
relatively widespread usage (particularly if it is exposed to an external
citizen audience) then we would recommend you set your monitor screen
to 1024 x 768 pixels and then open InstantAtlas Designer to create your
layout. This will ensure that the report is well laid out for the maximum
The Designer allows you to design a report that you have already
number of end-users. Alternatively, create your report then change your
published. The design for an InstantAtlas report is saved in a configuration
screen resolution to 1024 x 768 to check that your report design is
file called ‘config.xml’.
acceptable.
Every report has a ‘config.xml’ file. This is located in the output folder for
C.2. Starting the Designer
the report (along with the other files making up the report) and is in XML
format.
XML stands for Extensible Markup Language and is a flexible
The Designer can be started in one of several ways. Start the Designer by
format for storing, structuring and publishing information. It is important to
clicking ‘InstantAtlas Desktop Edition’, ‘InstantAtlas Designer’ in the
realise that the config.xml file is specific to a given version of a given
Windows Start menu or by clicking the ‘InstantAtlas Designer’ icon on your
InstantAtlas template (see section ‘C.5. Applying a Design to Other
desktop. If you chose not to create shortcuts during installation of the
Dynamic Reports‘ for more information).
software, browse to the ‘InstantAtlasDesigner.exe’ file (by default this will
have been installed in C:\Program Files\GeoWise\InstantAtlas) and double
When designing your report you should make sure that you tailor the
design to your audience.
This includes keeping in mind the level of
click it. The Designer will open with a blank canvas and you will then be
able to open the configuration file of your report.
expertise of your target group together with possible visual impairments of
the end-users.
Alternatively you can browse to the output folder of a published report,
right-click on the configuration file (called config.xml) and choose the ‘Edit
with InstantAtlas Designer’ option.
© GeoWise
GeoWise Ltd.
Ltd. 2013
2011
©
Page 42
visualise | communicate | ENGAGE
The InstantAtlas Designer
C.3.1.1. File
C.3. The Designer Window
g the InstantAtlas Area Profile Template User Guide
The Designer has menus, a toolbar and a canvas. The menus and toolbar
Open
give you access to the various functions, such as opening a configuration
Click ‘Open’ and the ‘Open configuration file...’ dialog will appear
file, and the canvas allows you to view the various template components
(Figure 59). Alternatively hold down ‘Ctrl’ and press ‘O’ on your keyboard.
(e.g. map, data table, bar chart, bar chart title, etc.).
Choose the file (called ‘config.xml’) for the report you wish to change and
click ‘Open’.
C.3.1. Menus and Toolbars
Figure 59
Figure 58 shows the Designer menus and toolbar.
Figure 58
The menus and toolbar give you easy access to the Designer options. You
can access a menu by clicking on it or holding down the ‘Alt’ key on your
keyboard and pressing the underlined character in the menu name. For
example, you can hold down ‘Alt’ and press ‘F’ to access the File menu.
Note that these keyboard shortcuts exist for many functions in the
Designer. If you hold your mouse pointer over an option in any of the drop
down menus, a tooltip will appear.
Similarly, if you hold your mouse
pointer over an icon in the toolbar, a tooltip will appear.
The “Refresh Internet Explorer preview panel”, which can be found on the
Open ArcGIS Online Application
far right of Figure 58 will refresh the dynamic report image in the Design
View and Published View.
Please refer to section ‘M.3.1. Opening an ArcGIS Online Application’ for
specific information on this option. For general information on ArcGIS
Online and InstantAtlas please read section ‘M. The InstantAtlas ArcGIS
Online Templates’.
© GeoWise
GeoWise Ltd.
Ltd. 2013
2011
©
Page 43
visualise | communicate | ENGAGE
The InstantAtlas Designer
Save
This option is useful if you wish to save different designs for a report.
g the InstantAtlas Area Profile Template User Guide
Simply save the different configuration files to the report’s folder with
Click ‘Save’ to save changes to the configuration file you are changing.
Alternatively hold down ‘Ctrl’ and press ‘S’ on your keyboard.
When
names such as ‘config1.xml’, ‘config2.xml’, ‘config3.xml’, etc. Once you
have saved these files, you simply choose which one is active by renaming
restarted, the dynamic report will reflect any changes that you have made
it ‘config.xml’. This is because by default an InstantAtlas report looks for a
to its configuration file.
configuration file in its folder called ‘config.xml’ and will ignore any others.
Save As/To…
Click ‘Save As/To…’ and then ‘ArcGIS Online Application’ if you wish to
Click ‘Save As/To…’ and then ‘Save As’ if you wish to save your changes
save the currently open configuration file and stylesheet to an existing
to a new configuration file. Alternatively hold down ‘Ctrl’ and ‘Shift’ and
press ‘S’ on your keyboard, the ‘Save configuration file as...’ dialog will
open (Figure 60). Browse to the folder in which you wish to save your new
configuration file, type a name in the ‘File Name’ box and click ‘Save’.
Figure 60
ArcGIS Online Web Application. Please refer to section ‘M.3.4. Saving
changes back to ArcGIS Online’ for specific information on this option. For
general information on ArcGIS Online and InstantAtlas please read section
‘M. The InstantAtlas ArcGIS Online Templates’.
Save Styles To…
Click ‘Save Styles To…’ and then ‘ArcGIS Online Application’ if you wish to
save the currently open stylesheet (not the configuration file) to an existing
ArcGIS Online Web Application. Please refer to section ‘M.3.4. Saving
changes back to ArcGIS Online’ for specific information on this option. For
general information on ArcGIS Online and InstantAtlas please read section
‘M. The InstantAtlas ArcGIS Online Templates’.
Revert
Click ‘Revert’ and then ‘To Template’ if you wish to return to the original
design, thereby reversing any changes you have made. Click ‘Revert’ and
then ‘To File’ if you wish to return to the design as it was when you last
clicked ‘Save’.
© GeoWise
GeoWise Ltd.
Ltd. 2013
2011
©
Page 44
visualise | communicate | ENGAGE
The InstantAtlas Designer
Apply
Delete
g the InstantAtlas Area Profile Template User Guide
This option is only available if you opened the Designer from the Publisher.
All of the components (e.g. charts, chart titles, buttons, etc) can be deleted.
Click ‘Apply’ when you have made all of your design changes.
To delete a component, click on it to select it in the interface and then click
The
changes will be applied to the configuration file of the report you are
‘Delete’.
publishing and the Designer will close.
component will disappear.
Recent Files
General Properties
Click ‘Recent File’ to access a list of recently opened files.
Click ‘General Properties’ to access the general properties for the dynamic
report.
Close
Click ‘Close’ to close the Designer. If you have not saved your changes,
you will be prompted to do so.
C.3.1.2. Edit
Undo
Alternatively you can press ‘Delete’ on your keyboard.
The
Alternatively hold down ‘Ctrl’ and ‘Shift’ and press ‘P’ on your
keyboard. This will show the general properties in the pane located on the
right side of your designer window.
See the section below for more
instructions on changing properties.
C.3.1.3. Select
The ‘Select’ menu allows you to easily select components in your report.
This is useful if you want to change properties of a component that is
Click ‘Undo’ to undo changes that you make to your design. Alternatively
hidden behind another component e.g. the data explorer that might be
hold down ‘Ctrl’ and press ‘Z’ on your keyboard. Most changes can be
hidden behind the map.
undone in this way. You can click ‘Undo’ multiple times in a row to undo a
series of changes. This option will be greyed out if there are no changes to
undo.
Button
Redo
Click ‘Button’ to insert a new button that will be displayed in your report and
Click ‘Redo’ to reapply any changes that you have undone by clicking
can be made to link to a resource of your choice (e.g. a webpage or a PDF
‘Undo’. Alternatively hold down ‘Ctrl’ and press ‘Y’ on your keyboard. You
document saved on your computer). You can also use the new button to
can click ‘Redo’ multiple times in a row to reapply a series of changes.
toggle components or call ActionScript / JavaScript commands. Click on
This option will be greyed out if there are no changes to reapply.
© GeoWise
GeoWise Ltd.
Ltd. 2013
2011
©
C.3.1.4. Insert
the new button in the canvas to select it and drag it to the desired location.
Page 45
visualise | communicate | ENGAGE
The InstantAtlas Designer
If necessary, you can resize it by dragging the selection handles. Refer to
Figure 61
g the InstantAtlas Area Profile Template User Guide
the section ‘C.4.3.2. Button Properties’ for instructions on changing the
properties for your new button.
Image
Click ‘Image’ to insert any static image of your choice into your report. This
might be the logo of your organisation or a corporate banner for example.
JPEG, PNG, GIF and SWF image formats are all supported.
We
recommend where possible inserting an image in SWF format to ensure
the highest visual quality of the inserted graphics. Click on the new image
in the canvas to select it and drag it to the desired location. If necessary,
you can resize it by dragging the selection handles. For instructions on
how to make changes to the properties of your new image please refer to
the section ‘C.4.3.3. Image Properties’.
Text
Click ‘Text’ to insert any text of your choice into your report. Click on the
new text in the canvas to select it and drag it to the desired location. For
instructions on how to make changes to the properties of your new text
please refer to section ‘C.4.3.3. Image Properties’.
Deleted components and components that are hidden by default
C.3.1.5. Layout
You have the option of inserting previously deleted components and
The ‘Layout’ options allow you to rapidly align multiple objects. You must
various components that are not shown by default in your InstantAtlas
first select multiple components to align – you can do this by holding down
reports. Click on the ‘Insert’ menu (Figure 61).
the ‘Shift’ button on your keyboard while clicking components in the
canvas.
© GeoWise
GeoWise Ltd.
Ltd. 2013
2011
©
Page 46
visualise | communicate | ENGAGE
Note that
is possible
to move
g the InstantAtlas
AreaitProfile
Template User
Guide
The InstantAtlas Designer
selected components as a group
simply by clicking and dragging any of the selected components.
Once you have selected two or more components, the layout options
become active.
These are available from the menu but also from the
properties pane on the right (Figure 62).
Palettes
Click ‘Palettes’ if you wish to edit the palettes or colour schemes used to
shade the map features in your dynamic reports. The ‘Map Palettes &
Colour Schemes’ dialog will open.
For instructions on how to make
changes please refer to section ‘C.4.4. Editing Map Palettes’.
C.3.1.7. View
Figure 62
Zoom
Hold your mouse pointer over ‘Zoom’ and a list of zoom options will
appear. Choose a new zoom level to zoom into or out of the canvas.
Alternatively, choose ‘Fit’ to make the canvas fit the Designer window.
There are keyboard shortcuts for each zoom level (shown to the right of the
zoom percentage).
Design View
Click ‘Design View’ or press Ctrl + Shift + D to see a preview of your report
Simply click the option for the alignment you wish to achieve.
within the canvas area of the Designer window. In this view, you can
change the layout of the report, resize, insert and delete components, and
C.3.1.6.
Style
edit styles and properties as required. Select a component then hover over
it to see its position properties displayed in the bottom left corner; the
Edit Styles
Click ‘Edit Styles’ to open the InstantAtlas Style Editor. This tool lists all
the styles used by the report. Note that most of these can be edited via the
Designer (see below). It is therefore unlikely you will need to use the Style
Editor unless you are making advanced style changes (e.g. adding new
styles or making global style changes).
© GeoWise
GeoWise Ltd.
Ltd. 2013
2011
©
numbers are in the order of X, Y, Width and Height. Select and drag a
component to see the values change. After editing the General Properties,
Component Properties or any of the Styles, click the refresh button that
appears at the bottom of the properties pane to view those changes in the
designer panel. Please remember to save your edits by going to File then
Save, or by clicking on the save icon.
Page 47
visualise | communicate | ENGAGE
The InstantAtlas Designer
C.3.1.8. Help
g the InstantAtlas
Area not
Profile
TemplatetoUser
It is currently
possible
useGuide
the Design
View for reports that are
created with an HTML template.
Help on the Designer
Click ‘Help on the Designer’ to access the help pages for the Designer.
Published View
About
Click ‘Published View’ or press Ctrl + Shift + P to view the report as it
would appear in an internet browser. You cannot make edits to individual
Click ‘About’ to open the ‘About’ dialog. It contains information regarding
components in this view. However, you can make changes to General
your Designer application, including the version number and the location of
Properties in this view. After editing General Properties, click the refresh
your licence file (Figure 63).
button that appears at the bottom of the General Properties panel to view
those changes in the designer panel. Please remember to save your edits
Figure 63
by going to File then Save, or by clicking on the save icon.
Wireframe View
Click ‘Wireframe View’ or press Ctrl + Shift + W to see a wireframe view of
the report in the Designer window. In this view, you can change the layout
of the report, resize, insert and delete components, and edit styles and
properties as required. To see your changes take effect in the report,
switch to the ‘Design View’ or ‘Published View’. Please remember to save
your edits by going to File then Save, or by clicking on the save icon.
Refresh Preview
By clicking this you will refresh the ‘Design View’ or ‘Published View’. It
has the same effect as the refresh button which appears at the bottom of
the properties pane when you change properties which require a refresh of
There are also three buttons linking to additional information. The ‘Legal’
the view.
button links to the InstantAtlas End-User Licence Agreement.
The
‘Licence’ button links to ‘Licence File Information’, from which you can also
© GeoWise
GeoWise Ltd.
Ltd. 2013
2011
©
Page 48
visualise | communicate | ENGAGE
upload a new licence file. The ‘Templates’ button links to an overview of
g the InstantAtlas Area Profile Template User Guide
available templates and also allows new templates to be uploaded.
The InstantAtlas Designer
component (but away from its sides) to see a four-sided arrow. While
viewing the four-sided arrow, click and hold down your mouse, then move
the mouse to move the component. To deselect a component, click on an
C.3.2. The Designer Canvas
Figure 64 shows an example of the Designer canvas in ‘Design View’ with
the Properties Pane.
Figure 64
empty part of the canvas. Clicking on an empty part of the canvas will also
cause General Properties to appear in the right-hand panel of the screen.
The components properties will show in the Properties Pane on the right
side of the Designer window.
C.4. Creating a New Design
C.4.1. Moving and Resizing Components
The canvas allows you to change the position and dimensions of
components by clicking and dragging. Simply click on a component to
select it and drag it to a new location. Click on the border of a component
and drag it to change the dimensions of the component.
C.4.2. General Properties
C.4.2.1. Introduction
The properties in the configuration file are template specific. So the list of
properties for a report published using the Flash Single Map template may
be different to that for a report published using the HTML Single Map
The size and position of the components in your report are shown in the
canvas.
template or the Flash Double Map template.
You can click any component to select it. When selected, a
component gains a highlighted border. To resize a component, hover over
the sides of the component until a double-sided arrow appears, click and
hold down the mouse over the side, then move the mouse to see the
You can view a description for any property by holding you mouse
pointer over its name.
If you require further information regarding a
property please contact your support provider.
component resize. Similarly you can move components by hovering over a
© GeoWise
GeoWise Ltd.
Ltd. 2013
2011
©
Page 49
visualise | communicate | ENGAGE
To access the general properties for the report, ensure that no components
g the InstantAtlas Area Profile Template User Guide
The InstantAtlas Designer
can use these to change the value. Alternatively, you can type a new
are selected in the interface (simply click on an empty part of the canvas to
number into the cell but you must then press ‘Enter’ on your keyboard to
deselect a selected component). The general properties of the dynamic
register the new value. To change a free text value, double click in the cell
report will show in the properties pane in the right side of the window
containing the value and type a new value.
(Figure 65).
changes will not appear instantly in the Design View. You will need to click
Most property and style
the refresh button that appears at the bottom of the properties pane to
Figure 65
refresh the view (Figure 66).
Figure 66
Please note: There are properties which would require a complete
new load of the report to be visible in the Design View. These will not
show when clicking the refresh button.
You can, however, save your
changes and view them by opening your report in the browser.
Alternatively, closing and reopening the Designer will make these changes
You can click and drag the dividing line between the two columns to
change column width.
Hold your mouse pointer over each cell in the
visible in the Design View.
C.4.2.2. Configuring the Visible Text in the Report
‘Name’ column to view a longer description of the property.
© GeoWise
GeoWise Ltd.
Ltd. 2013
2011
©
To change a value that can be True or False, simply click the checkbox in
In InstantAtlas HTML dynamic reports you can change the text for
the ‘Value’ column. Some values are chosen from a pick list – click in the
exporting, sharing and for the Legend classifiers in the general
cell and select your value from the pick list. To change a numerical value,
properties. Other text can be changed within the specific component
click in the cell containing the value. Up/down arrows will appear and you
properties.
Page 50
visualise | communicate | ENGAGE
Much of the text that appears in an InstantAtlas report can be configured
The InstantAtlas Designer
Figure 67
g the InstantAtlas Area Profile Template User Guide
using general properties. All static tooltips, for example, appear in the list
of general properties and can be edited. The labels for the legend types
that are displayed in the legend dialog and all of the text you see in the
Context Menu can be changed as well. This is important to ensure that the
InstantAtlas templates can be made multilingual – it must be possible for
the person designing the report to change all visible text. Note that not all
text is configurable via the Designer though. Theme and indicator names,
for example, are read from the XML data files and must be changed there.
C.4.2.3. Configuring the Contextual Menu (Right Mouse Button Menu)
In InstantAtlas HTML dynamic reports there is no context menu to
ensure touch screen friendliness. Some of the functions (Clear
Selection, Filter Selection, Clear Filter, Print, Export) can be
accessed via toolbars in the report. This section therefore applies to
the Flash dynamic reports only.
In the general properties of the Designer you can adjust which of these
options the end-user should see in the context menu. The three bottom
ones ‘Settings...’, ‘Global Settings...’ and ‘About Adobe Flash Player
[version number]...’ cannot be removed since these are provided by the
Flash player itself.
When you right-click on any place in the report you will get a contextual
Context Menu: Clear Selection? – Allows the user to clear all selected
menu with different options. Figure 67 is the context menu and is how it
features with one click.
looks like by default.
context menu.
We suggest that you always leave this in the
Context Menu: Clear Comparison Selection? – This option is not
included by default in the context menu but if your report contains
comparison areas and you enabled the comparison table you may like to
have this option in the context menu so that the end-user can clear the
selection he or she has made in the comparison table.
© GeoWise
GeoWise Ltd.
Ltd. 2013
2011
©
Page 51
visualise | communicate | ENGAGE
Context Menu: Filter Selection? – Allows the user to create a filter out of
g the InstantAtlas Area Profile Template User Guide
The InstantAtlas Designer
Context Menu: About? – This option opens up a window showing the
the current selection. When this option is included in the context menu you
version number of the InstantAtlas template that was used to create the
should also enable the ‘Context Menu: Clear Filter’ option.
report. It also includes a link to the InstantAtlas website. We recommend
that you leave this option in the context menu so that you can refer to the
Context Menu: Clear Filter? – This option should be enabled when you
have filters defined in your xml file and when you allow the end-user to
version number if you contact the InstantAtlas support team about this
report.
create a filter out of the current selection (‘Context Menu: Filter Selection?’
option ticked)
C.4.3. Component Properties
Context Menu: Reset Layout? – In version 6 of InstantAtlas the user has
C.4.3.1. Introduction
the possibility to change the size and location of the components in the
browser window. Components can also be deleted to create the desired
To access the properties for a component, ensure that it is selected in the
layout for printing or exporting. If you enable the reset layout option in the
canvas (Figure 68).
context menu the user can restore the layout of the report without needing
to refresh the browser window (refreshing the browser window would
include loading all of the data again).
Context Menu: Print? – Allows the user to open the print preview dialog.
If you do not wish for your report or single components to be printable then
you should not include this option in the context menu.
Context Menu: Export? – Allows the user to open the export dialog. If
you do not wish for your report or single components to be exportable then
you should not include this option in the context menu.
Context Menu: Add Text? – This option opens up a window that allows
the end-user to insert custom text in the report.
Context Menu: Add Shape? – This option opens up a window that allows
the end-user to insert custom shapes in the report.
© GeoWise
GeoWise Ltd.
Ltd. 2013
2011
©
Page 52
visualise | communicate | ENGAGE
Figure 68
The InstantAtlas Designer
Figure 69
g the InstantAtlas Area Profile Template User Guide
For most buttons in Flash dynamic reports, the value in the URL box will
start ‘script’, followed by the name of a script function.
Available ActionScript functions that can be used for buttons in Flash
reports are:
script:toggleMap
Toggles map visibility
script:toggleTimeSeries
Toggles time series chart visibility
script:toggleDiscreteTimeSeries Toggles discrete time series chart
Toggles flipped time series chart
script:toggleBarChart
Toggles bar chart visibility
script:toggleFlippedBarChart
Toggles flipped bar chart visibility
script:toggleboxAndWhisker
Toggles box and whisker chart visibility
Change the values in the same way as that described for the general
script:togglePieChart
Toggles pie chart visibility
properties of the report.
script:toggleAdvancedPieChart
Toggles advanced pie chart visibility
script:toggleMetadata
Toggles metadata visibility
script:toggleTable
Toggles table visibility
If you view the properties for a button component (e.g. the Data button),
script:toggleComparisonTable
Toggles comparison table visibility
you will get a tab called ‘Links’ (Figure 69).
script:toggleLegend
Toggles legend visibility
script:toggleGeogExplorer
Toggles geography explorer visibility
C.4.3.2.
© GeoWise
GeoWise Ltd.
Ltd. 2013
2011
©
script:toggleFlippedTimeSeries
Button Properties
Page 53
visualise | communicate | ENGAGE
script:toggleDataExplorer
The InstantAtlas Designer
Toggles data explorer visibility
script:openNotesPage2
g the InstantAtlas Area Profile Template User Guide
Opens notes page of the active indicator
script:toggleFilterExplorer
Toggles filter explorer visibility
in Map 2
script:toggleTimeAnimation
Toggles time animation visibility
script:clearSelection
script:toggleScatterPlot
Toggles scatter plot visibility
script:clearComparisonSelection Clears comparison selection
script:toggleSpineChart
Toggles spine chart visibility
script:clearFilter
Clears current filter
script:toggleBubblePlot
Toggles bubble plot visibility
script:resetlayout
Resets report layout
script:togglePyramidChart
Toggles pyramid chart visibility
script:toggleLegendWindow
Opens legend settings window
script:toggleStats
Toggles statistics box visibility
script:toggleLegendWindow2
Opens legend settings window 2
script:toggleDotPlot
Toggles dot plot visibility
script:copyToClipboard
Copies the content of the table into the
script:toggleSearch
Toggles Google search box visibility
script:toggleMap2
Toggles map 2 visibility
script:toggleTimeSeries2
Toggles time series chart 2 visibility
script:toggleBarChart2
Toggles bar chart 2 visibility
You can also call multiple ActionScript functions using a semicolon
script:togglePieChart2
Toggles pie chart 2 visibility
delimited list.
script:toggleMetadata2
Toggles metadata 2 visibility
script:toggleTable2
Toggles table 2 visibility
script:toggleComparisonTable2
Toggles comparison table 2 visibility
script:toggleLegend2
Toggles legend 2 visibility
In reports published using an HTML template you can use the
script:toggleDataExplorer2
Toggles data explorer 2 visibility
following JavaScript functions to toggle the report components:
script:toggleDataExplorer3
Toggles data explorer 3 visibility
script:toggleDataExplorer4
Toggles data explorer 4 visibility
javascript:iaToggle(map)
script:toggleFilterExplorer2
Toggles filter explorer 2 visibility
javascript:iaToggle(timeSeries)
Clears current selection
clipboard
script:copyToClipboard2
Copies the content of the table 2 into the
clipboard
Example:
script:toggleDataExplorer;toggleFilterExplorer
javascript:iaToggle(discreteTimeSeries)
© GeoWise
GeoWise Ltd.
Ltd. 2013
2011
©
script:openPrintWin
Opens print window
javascript:iaToggle(barChart)
script:openExportWin
Opens export window
javascript:iaToggle(boxAndWhisker)
(requires Flash Player 10)
javascript:iaToggle(pieChart)
script:openAboutWin
Opens about window
javascript:iaToggle(advancedPieChart)
script:openNotesPage
Opens notes page of the active indicator
Page 54
visualise | communicate | ENGAGE
g the InstantAtlas
Area Profile Template User Guide
javascript:iaToggle(metadata)
The InstantAtlas Designer
javascript:iaToggle(dataExplorer2)
javascript:iaToggle(table)
javascript:iaToggle(dataExplorer3)
javascript:iaToggle(comparisonTable)
javascript:iaToggle(dataExplorer4)
javascript:iaToggle(legend)
javascript:iaToggle(filterExplorer2)
javascript:iaToggle(featureLegend)
javascript:iaToggle(statsbox2)
javascript:iaToggle(dataExplorer)
javascript:iaToggle(filterExplorer)
javascript:iaToggle(geogExplorer)
javascript:iaToggle(scatterPlot)
javascript:iaToggle(statsbox)
javascript:iaToggle(menuBar)
Other JavaScript functions:
javascript:iaOpenPrintPreview()
Opens print preview window
javascript:iaToggleShare()
Opens the Share dialog pop-up
javascript:iaToggleProfileTree()
Expands or collapses the
javascript:iaToggle(spineChart)
javascript:iaToggle(profileLegend)
javascript:iaToggle(timeControl)
themes in the Area Profile
javascript:iaTogglePopup(…)
opens a file in a pop-up window,
enter file path into the brackets
javascript:iaToggle(pyramidChart)
javascript:iaToggle(pyramidLegend)
javascript:iaToggle(featureCard)
The ‘Help’ button is the only default button in a Flash report for which the
URL does not contain a JavaScript command (Figure 70). If you wish to
javascript:iaToggle(map2)
edit the link for the ‘Help’ button, simply replace ‘./help.htm’ with a new link.
javascript:iaToggle(timeSeries2)
So your new entry in the ‘URL’ box might read ‘http://www.instantatlas.com’
javascript:iaToggle(discreteTimeSeries2)
to link to the InstantAtlas website homepage for example.
javascript:iaToggle(barChart2)
javascript:iaToggle(boxAndWhisker2)
javascript:iaToggle(pieChart2)
javascript:iaToggle(advancedPieChart2)
javascript:iaToggle(metadata2)
javascript:iaToggle(table2)
javascript:iaToggle(comparisonTable2)
javascript:iaToggle(legend2)
javascript:iaToggle(featureLegend2)
© GeoWise
GeoWise Ltd.
Ltd. 2013
2011
©
Page 55
visualise | communicate | ENGAGE
The InstantAtlas Designer
Figure 70
g the InstantAtlas Area Profile Template User Guide
In reports published using an HTML template, the Help link is by
default not set up as a standard button but as an item in the Menu
Bar component. If you prefer this to be a button you can simply
insert a custom button and enter ‘./help.htm’ or the link to your own
help file in the button URL.
All JavaScript functions mentioned above for use within a HTML
dynamic report can be used either within a button or as a Menu Bar
Note that if you intend to move the report folder at a later stage, we
item.
recommend you put all the files you are linking to into the report folder and
use relative pathnames to link to them. The relative pathname for any file
located in the report folder is ‘./’. So if you wanted your button to link to a
PDF called my_file.pdf located in the report folder, you would type
‘./my_file.pdf’ into the URL box.
C.4.3.3. Image Properties
If you select or insert an image component into the Designer canvas, the
‘Image Properties’ will appear in the properties pane (Figure 71).
The Target value can be selected from the pick list by clicking the down
arrow. This determines how the file being linked to will open.
© GeoWise
GeoWise Ltd.
Ltd. 2013
2011
©
Target Value
File being linked to opens in…
_blank
A new window
_self
The same window as the report (replaces the report)
_parent
For use in a framed environment. Will open in the parent
frame
_top
For use in a framed environment. Will open in the top
frame
Page 56
visualise | communicate | ENGAGE
The InstantAtlas Designer
Figure 71
loss of quality. If you would like to keep the image in its set size you
g the InstantAtlas Area Profile Template User Guide
should disable the auto-size option.
Using ‘Anchor Left’, ‘Anchor Middle’ and ‘Anchor Right’, you can define
where the image is anchored in the report. For example, if you want your
image to be positioned on the right hand border and unaffected by the
browser window size, you would choose the ‘Anchor Right’ option.
To move the image around you can either use the X and Y fields in the
‘Properties’ tab or you can click the image in the canvas to select it and
drag it to the desired location. If necessary, you can resize it by dragging
the selection handles.
C.4.3.4. Text Properties
If you view the properties for a text component (e.g. the report title), you
will see that you can specify a rotation value in degrees for display of the
text in the report (Figure 72).
You will also see a ‘Use word wrap?’
checkbox and ‘Word wrap at’ box. If you select the ‘Use word wrap?’
checkbox you will then be able to enter a value into the ‘Word wrap at’ box.
This dialog features a ‘Reset Size’ button and ‘Copy to Output’ checkbox.
Click the ‘Reset Size’ button to set the width and height values to the width
and height in pixels of the original image.
This determines how far to the right text will run before wrapping onto a
new line.
Click the ‘Copy to Output’
checkbox if you wish the image you are inserting to be copied into the
report folder. You should do this if you intend to move the report folder at a
later stage.
If the ‘Auto-size?’ option is ticked, the image will rescale together with the
browser window. With images, however, this may cause a loss of quality.
We therefore recommend inserting SWF files as these will rescale without
© GeoWise
GeoWise Ltd.
Ltd. 2013
2011
©
Page 57
visualise | communicate | ENGAGE
Figure 72
g the InstantAtlas Area Profile Template User Guide
The InstantAtlas Designer
${notEmpty(filterName, '>> Filter: ')} ${filterName} ${notEmpty(filterValue,
'>> ')} ${filterValue}.
Rather, it might be displayed as shown in Figure 73.
Figure 73
You can see that in this case, themeName resolves as ‘Social deprivation’,
indicatorName as ‘% of population unemployed’, date as ‘2005’, filterName
as ‘Zones’ and filterValue as ‘Edinburgh South’.
You can edit the static text and can also add and delete dynamic variables.
Right click in the ‘Text’ box of the dialog to view the list of dynamic
variables available (Figure 74).
You will notice that some text components contain dynamic variables
Figure 74
enclosed with ${}. Any text that is not enclosed in ${} is static. Dynamic
variables (along with the logic tests discussed below) do bring a lot of
flexibility to the look and feel of reports.
In reports published using an HTML template, dynamic text can also
be placed in the title bars of the components or in the table column
headers.
Figure 72 shows the properties for the Title component in a Single Map
Flash template. Clearly, the title will not be displayed in the report as
${themeName} >> ${indicatorName} ${notEmpty(date, '>> ')} ${date}
© GeoWise
GeoWise Ltd.
Ltd. 2013
2011
©
Page 58
visualise | communicate | ENGAGE
The InstantAtlas Designer
Hold your mouse pointer over each of the variable names to view a
g the InstantAtlas Area Profile Template User Guide
description. Click on a variable to insert it into the ‘Text’ box.
For the Title component in a Single Map template there are also some logic
tests involved. The first logic test is:
empty - ${empty(variable, textIfEmpty)}
notEmpty - ${notEmpty(variable, textIfNotEmpty)}
equals - ${equals(variable, ‘test text’, textIfEqual)}
notEquals - ${notEquals(variable, ‘test text’, textIfNotEqual)}
If you click the ‘Styles’ tab for a text component, the name of any pre-
${notEmpty(date, '>> ')}
defined style class controlling the appearance of the text will be listed in the
‘Style Class’ box (Figure 75).
In plain English this translates as the following:
“If, and only if, the value for date is not null and is not an empty bit of text,
then write out the following text…”
So, the rule for this type of dynamic text entry is:
${test(condition, textIfConditionIsTrue)}
Another example involving the same logic test is the Scatter Plot
component text:
“${notEmpty(scatterplotCorrelation, 'Correlation coefficient (r) = ' +
scatterplotCorrelation + '
>> r-squared = ' + scatterplotRSquare + ',
Regression
=
Equation:
y
'
+
scatterplotGradient
+
'x
+
'
+
scatterplotIntercept)}”
Note that the textIfConditionIsTrue part is “raw” (i.e. it’s the JavaScript code
that will be evaluated if the condition is true). So, in this case, you need to
parcel up the dynamic variables scatterplotCorrelation, scatterplotRSquare,
scatterplotGradient and scatterplotIntercept using the + operator and put
static text in quotes.
The available logic tests are:
© GeoWise
GeoWise Ltd.
Ltd. 2013
2011
©
Page 59
visualise | communicate | ENGAGE
Figure 75
The InstantAtlas Designer
C.4.3.5. Table Properties
g the InstantAtlas Area Profile Template User Guide
If you view the properties for a table component, you will see a ‘Data
Columns’ section (Figure 76). This enables you to add or remove columns
from the data table in your report. You can add a column by clicking the
‘Add’ button and remove a column by clicking it in the list to highlight it and
clicking the ‘Remove’ button.
Figure 76
© GeoWise
GeoWise Ltd.
Ltd. 2013
2011
©
Page 60
visualise | communicate | ENGAGE
The InstantAtlas Designer
For Flash reports, the columns that are displayed in the Data Table by
g the InstantAtlas Area Profile Template User Guide
For example, Figure 77 shows an Excel workbook with two sets of
default are the three symbol columns with the legend colour, the notes icon
associate values for Indicator 1, the names of which are given in cells D5
(metadata) and the magnifying glass (zoom to) as well as the columns for
and E5. If you add these columns to the data table in order to display
the name of the base geography feature and the indicator value. You may
these associate values, the name values in the Designer for the columns
remove any of these. If you want to add these columns back in again,
would have to be ‘count’ and ‘rank’ (i.e. exactly match the contents of cells
however, make sure that the column names are written exactly as in
D5 and E5). The alias value is displayed as the column heading in the
Figure 76.
report data table – you can enter any text you like for the alias.
Figure 77
In reports published using an HTML template, the data table
contains two columns by default: the name of the base geography
feature (which includes the legend colour symbol and notes icon if
metadata links have been included in the data) and the indicator
value. Settings for having the map zoom to a selected feature
(replaces the magnifying glass) and for displaying the legend colour
in the table can be found in the ‘Properties’ section above the ‘Data
Columns’ section.
Extra columns are typically added in order to display any associate values
that you have added to the data files for your report (please refer to section
‘E. The InstantAtlas Excel Data Manager’, sub-section ‘E.5.2. Entering
Associate Values’ for more information on associates). If you have no
Confidence intervals are a special case. These are called ‘ll’ and ‘ul’ in the
data files for dynamic reports. In the Designer, however, these columns
must be given name values of 'lowerLimit' and 'upperLimit' as shown in
Figure 76.
associate values in the data files for your report, there is no point in adding
new columns to the table as there will be nothing to display in these
columns. If you do have associate values in your data files, you can add
columns to your table to display them.
The name value for a column
should exactly match the name for the associate values in the data file(s)
for the report (except for confidence intervals – see below).
© GeoWise
GeoWise Ltd.
Ltd. 2013
2011
©
Page 61
visualise | communicate | ENGAGE
The InstantAtlas Designer
ensure that contextual layers are pre-loaded if you are implementing filter
g the InstantAtlas
Area Profile
Template
User Guide
Other important
table
properties
in the
HTML templates are:
Exportable?
map zooms (i.e. you have linked filter values to polygons in your contextual
layers so that applying a filter in the report zooms in the map). Simply
check the ‘Pre-load Contextual Layers?’ box in the Map Properties in the
If this box is ticked you will see an export button in the top right hand
Designer.
corner of the table when you hover with the mouse over it. Clicking
this button will open a new browser tab/window in which you will be
able to copy and paste the data in a comma delimited CSV format.
Zoom On Selection?
The config.xml file of an HTML template does not currently include
this property. This means that if you have set up filters that should
zoom to the filtered areas, the map will only zoom if the relevant
contextual layer is either visible when opening the report or after it
If this box is ticked the map will zoom to the feature which gets
has been toggled on.
selected in the data table
Show Legend Colour?
Visible Contextual Layers List
If you do not wish to see circles with the legend colour of each
If you wish contextual layers to be visible (i.e. switched on in the Map
feature in the table you can untick this checkbox.
Layers box) when a report opens you must edit the ‘Visible Contextual
Layers List’ property. When you click the ‘Value’ column for this property a
popup window will appear. The vector contextual layers in a report have
C.4.3.6.
Map Properties
IDs of contextualLayer1.swf, contextualLayer2.swf, contextualLayer3.swf
and so on.
Pre-load Contextual Layers?
© GeoWise
GeoWise Ltd.
Ltd. 2013
2011
©
If you wish the lowermost layer in the vertical stack (i.e.
contextualLayer1.swf) to be visible by default you enter the value
By default, the contextual layers in a Flash report only load at the point
‘contextualLayer1’ for the ‘Visible Contextual Layers List’ property. If you
where the toggle box for a layer is clicked in the Map Layers box.
want the lowermost two layers to be visible by default you enter the value
However, it is possible to configure a Flash report so that contextual layers
‘contextualLayer1,contextualLayer2’ and so on. If you are unsure of the
are pre-loaded (i.e. the vector graphics are loaded in when the report
contextual layer ‘id’ you wish to make visible by default you can refer to the
initially loads. This, however, does not necessarily mean that the layers
map.swf.xml file in the output folder of your dynamic report. This file can
will also be visible in the map by default. It simply means that the report
be viewed using a text editor (e.g. Textpad). Contextual layers will have an
‘knows’ the vector graphic when the report is opened. You will need to
entry in map.swf.xml similar to the following:
Page 62
visualise | communicate | ENGAGE
<contextual-layer
The InstantAtlas Designer
Base Layer Data
g the InstantAtlas Area Profile Template User Guide
xmlns="http://swf.instantatlas.com/supplement"
id="contextualLayer1" name = "Post code districts"
If you want the map to show the values of an associate column instead of
geometry="polygon" src="contextualLayer1.swf">
the indicator value by default you can define this in the property called
‘Base Layer Data’. Make sure that the name you type in here is identical to
the associate column name in the data.xml file.
When using an HTML template the visibility of map layers is set in
the layer properties in the Publisher. After the report has been
published you can change these settings by editing the map.js file in
When using an HTML template you can change the data which is
a text editor.
loaded into the map and legend in the General Properties. This
setting is called ‘Data’.
Show Background Mapping
Map Copyright
You can also make background mapping layers visible by default by ticking
the box of the ‘Show Background Mapping’ property.
If you use Map data which requires a copyright reference, please do not
forget to write this in the ‘Map Copyright’ property.
When using an HTML template background layers are switched on
List of Layers Displaying Tips
by default. After the report has been published you can change this
by editing the map.js file in a text editor.
If you wish to show a tooltip for your contextual layers displaying e.g. the
name of the geographic feature, you can do this by editing the ‘List of
Background Folder
Layers Displaying Tips’ property. When you click the ‘Value’ column for
this property a popup window will appear. This property needs to contain
If you are using a background image collection as your background layer
the IDs of all contextual layers for which you would like to enable tips. You
and you want to keep the background images saved in a different location
can find the IDs listed in the map.swf.xml file in the output folder of your
than your report files, you can define the path to the folder which includes
dynamic report. This file can be viewed using a text editor (e.g. Textpad).
the background images in the property ‘Background Folder’.
Contextual layers will have an entry in map.swf.xml similar to the following:
<contextual-layer
xmlns="http://swf.instantatlas.com/supplement"
© GeoWise
GeoWise Ltd.
Ltd. 2013
2011
©
Page 63
visualise | communicate | ENGAGE
id="contextualLayer1" name = "Post code districts"
g the InstantAtlas Area Profile Template User Guide
geometry="polygon" src="contextualLayer1.swf">
The InstantAtlas Designer
name="post_code_sectors.shp" geometry="polygon"
src="map1.swf">
</base-layer>
Please note that prior to version 6.5.0 the values displayed in the tooltips
<contextual-layer
were the values of the Feature Code Field that you set in the Publisher
xmlns="http://swf.instantatlas.com/supplement"
when adding the contextual layer. From 6.5.0 onwards the tooltips will
id="contextualLayer1" name="post_code_districts.shp"
display the values of the Feature Name Field.
geometry="polygon" src="contextualLayer1.swf">
When using an HTML template, the tooltips for map layers are
switched on and off in the layer properties in the Publisher. After the
report has been published you can change these settings by editing
If you wish both of these layers to show labels, the list in the popup window
should look like that shown below (Figure 78).
Figure 78
the map.js file in a text editor.
List of Layers Displaying Labels
If you wish to show permanent labels in the map for the base or contextual
layers you should edit the ‘List of Layers Displaying Labels’ property. This
is a list of the IDs of the layers you wish to display labels permanently in
the map. You can find the IDs listed in the map.swf.xml file in the output
folder of your dynamic report. This file can be viewed using a text editor
such as Notepad or Textpad. For example, in the snippet of code below
taken from a map.swf.xml file you can see that the ID for the base
Please note that prior to version 6.5.0 the values displayed in the labels
geography is ‘_post_code_sectors.shp1’ and the ID for the only contextual
were the values of the Feature Code Field which you chose in the
layer is ‘contextualLayer1’.
Publisher when adding the contextual layer.
From 6.5.0 onwards the
labels will display the values of the Feature Name Field.
<base-layer
xmlns="http://swf.instantatlas.com/supplement"
id="_post_code_sectors.shp1"
© GeoWise
GeoWise Ltd.
Ltd. 2013
2011
©
Page 64
visualise | communicate | ENGAGE
g the InstantAtlas
Area Profile
Template
User Guidethe
When using
an HTML
template,
The InstantAtlas Designer
labels for map layers are
When using an HTML template, the display ranges for map layer
switched on and off in the layer properties in the Publisher. After the
labels are set in the layer properties in the Publisher. After the report
report has been published you can change these settings by editing
has been published you can change these settings by editing the
the map.js file in a text editor.
map.js file in a text editor.
List of Display Ranges For Labelled Layers
Show Layers In Legend
You can control the extent ranges for which the labels will show by editing
If you do not wish to see the list of contextual layers and background layers
the ‘List of Display Ranges For Labelled Layers’ property. The ranges
in the legend, you can hide them by un-ticking the property ‘Show Layers
should be entered as percentages of the full map extent and should be in
In Legend’.
the format [upper limit]-[lower limit]. Following on from the last example, if
you wanted the base layer to show labels in the 50-0% extent range of the
map and the contextual layer to show labels in the 100-50% range your
popup window would look like that shown below (Figure 79).
Figure 79
Contextual Layers Displayed In Legend
If you want to only show one or a subset of the contextual layers in the
legend, you should keep the ‘Show Layers In Legend’ property ticked and
then define which layer(s) you wish to see in the legend by entering their
ID(s) into the property ‘Contextual Layers Displayed In Legend’.
When using an HTML template, the visibility of map layers in the
legend is set in the layer properties in the Publisher. After the report
has been published you can change these settings by editing the
map.js file in a text editor.
Tip
This property contains the code for the tooltip you see when you hover
over the map features.
By default this code looks like this for Flash
reports:
© GeoWise
GeoWise Ltd.
Ltd. 2013
2011
©
Page 65
visualise | communicate | ENGAGE
The InstantAtlas Designer
<p>${featureName}: ${indicatorValue}</p>
In addition to the default area name and indicator value, this code adds
g the InstantAtlas Area Profile Template User Guide
another paragraph (starting on a new line) with ‘Count: ’ as a static text and
The <p>...</p> indicates that it is HTML code (the <p>-tag stands for a
the associate with the name ‘count’ as a dynamic value (Figure 81).
paragraph)
Figure 81
${featureName} and ${indicatorValue} are substitution variables.
Their
values are dynamic and change depending on the map feature you mouse
over.
The colon in between the variables is static text. Figure 80 shows how the
Example 2:
default tooltip looks for the post code sector with the name ‘EH14 7’.
<p>${featureName}: ${count}</p>
Figure 80
This will replace the indicator value with the count associate (Figure 82).
Figure 82
In the config.xml file of an HTML template, the default code of the
Tip property does not include the paragraph tags (<p>...</p>):
${featureName}: ${indicatorValue}
Other important map properties in the HTML templates are:
Exportable?
You can add any other static text, substitution variables or HTML tags if
you like.
If this box is ticked you will see an export button in the top right hand
corner of the map when you hover with the mouse over it. Clicking
Example 1:
this button will open the map graphic (without background layers) as
an image in a new tab/window of your browser. From there you can
<p>${featureName}: ${indicatorValue}</p><p>Count:
save the image through the right-click menu.
${count}</p>
© GeoWise
GeoWise Ltd.
Ltd. 2013
2011
©
Page 66
visualise | communicate | ENGAGE
The InstantAtlas Designer
X-Axis Label and Y-Axis Label
g the InstantAtlas
Area
Profile Template
User
Guide Allowed
Max Zoom
Allowed
and Min
Zoom
If you wish to show labels along the X and Y-Axis you can also define this
Using these properties you can define zoom limits for your map. The
in the Bar Chart Properties.
values need to be in map units, e.g. Max Zoom Allowed: 500000,
Min Zoom Allowed: 10000000. When using Google Maps as a
Show Limits?
background layer, you will need to specify zoom levels instead.
Possible zoom level values are 0 – 21, where 0 is the level furthest
To show or hide the error bars on the bar chart (assuming the data.xml file
zoomed out and 21 is the level furthest zoomed in, e.g. Max Zoom
is inclusive of these values) tick or untick the check box of the ‘Show
Allowed: 15, Min Zoom Allowed: 5.
Limits?’ property.
The config.xml file of an HTML template does not currently include
C.4.3.7.
Bar Chart Properties
this property.
Y-Axis Data
Tip
Similar to the map component you can also set the bar chart to display
values from a column other than the indicator column. To do this, type in
This property contains the code for the tooltip you see when you hover
the name of the associate column into the property ‘Y-Axis Data’ in the Bar
over the bars. By default this code looks like this:
Chart Properties.
<p>${featureName}: ${indicatorValue}</p>
To sort the bars according to the new data source you can set the
${notEmpty(lowerLimit, '<p>LL: ')}${lowerLimit}
properties ‘Chart Sort Data’ and ‘Chart Sort Direction’ in the General
${notEmpty(lowerLimit, '</p>')}
Properties in the Property group ‘Data Formatting’.
${notEmpty(upperLimit, '<p>UL: ')}${upperLimit}
${notEmpty(upperLimit, '</p>')}
In the config.xml file an HTML template this property is called ‘Data’.
Once you set this to pick up an associate value the bars will sort by
this associate. The Sort Direction can be set in the Bar Chart
Properties.
This code means that the first line of the tooltip is the feature name and the
indicator value of the hovered bar.
In case that your data contains
confidence intervals, two further paragraphs will be added. Both new lines
begin with a static text (‘LL: ’ for lower limit and ‘UL: ‘ for upper limit)
followed by the respective dynamic variable (Figure 83).
© GeoWise
GeoWise Ltd.
Ltd. 2013
2011
©
Page 67
visualise | communicate | ENGAGE
The InstantAtlas Designer
Figure 83
g the InstantAtlas Area Profile Template User Guide
Orientation
You can set the orientation of the bars to be vertical or horizontal.
For this reason the Single Map (HTML Edition) Template does not
include a separate ‘Flipped Bar Chart’ component.
Match Axis to Data?
In the config.xml file of an HTML template, the default code of the
Tip property does not include the paragraph tags:
By default the data axis of the bar chart will show values rounded to
the next logical interval. If you tick this property the minimum and
${featureName}: ${indicatorValue}
maximum value of the data axis will be the same as the minimum
${notEmpty(lowerLimit, '<br/>LL: ')}${lowerLimit}
and maximum value of the selected indicator/time period.
${notEmpty(upperLimit, '<br/>UL: ')}${upperLimit}
Use Fixed Values?, Fixed Minimum Value and Fixed Maximum
Value
You can modify this code or add any other static text, substitution variables
or HTML tags. Please refer to the ‘Tip’ section of the Map Properties for
You can define fixed minimum and maximum values for the bar chart
further information and examples.
- however these settings will apply to the whole report. If you wish to
define fixed values on a theme, indicator or time period basis you
Other important bar chart properties in the HTML templates are:
should do it through the Metadata of your data files. Please refer to
section ’E.6.2.4 Setting the Chart Axis Minimum and Maximum’.
Exportable?
If this box is ticked you will see an export button in the top right hand
C.4.3.8.
Time Series Chart Properties
corner of the bar chart when you hover it with the mouse. Clicking
this button will open the bar chart graphic as an image in a new
tab/window of your browser. From there you can save the image
through the right-click menu.
© GeoWise
GeoWise Ltd.
Ltd. 2013
2011
©
Y-Axis Data
Similar to the map and the bar chart components you can also set the time
series chart to display values from a column other than the indicator
Page 68
visualise | communicate | ENGAGE
The InstantAtlas Designer
column. To do this type in the name of the associate column into the
g the InstantAtlas Area Profile Template User Guide
property ‘Y-Axis Data’ of the Time Series Chart Properties.
Other important time series chart properties in the HTML template
are:
In the config.xml file of an HTML template this property is called
Exportable?
‘Data’.
If this box is ticked you will see an export button in the top right hand
corner of the bar chart when you hover it with the mouse. Clicking
X-Axis Label and Y-Axis Label
If you wish to show labels along the X and Y-Axis you can also define this
in the Time Series Chart Properties.
Max No Series
By default the Time Series Chart will show not more than ten time series
trend lines at the same time. You can adjust this maximum number in the
‘Max No Series’ property. Please be aware, however, that allowing a large
number of time series lines to show simultaneously in the Time Series
this button will open the time series chart graphic as an image in a
new tab/window of your browser. From there you can save the
image through the right-click menu.
Orientation
You can set the orientation of the time series chart to be vertical or
horizontal. For this reason the Single Map (HTML Edition) Template
does not include a separate ‘Flipped Time Series Chart’ component.
Match Axis to Data?
Chart could have a negative effect on the performance of your dynamic
report.
By default the data axis of the time series chart will show values
rounded to the next logical interval. If you tick this property the
The config.xml file of an HTML template does not currently include
this property. You can limit the number of selectable features for all
components in the General Properties.
minimum and maximum value of the data axis will be the same as
the minimum and maximum value of the selected indicator/time
period.
Use Fixed Values?, Fixed Minimum Value and Fixed Maximum
Value
You can define fixed minimum and maximum values for the time
series chart - however these settings will apply to the whole report. If
© GeoWise
GeoWise Ltd.
Ltd. 2013
2011
©
Page 69
visualise | communicate | ENGAGE
The InstantAtlas Designer
The properties that require explanation are described below.
g the InstantAtlas
Profile Template
User Guide
you wish Area
to define
fixed values
on a
theme, indicator or time period
basis you should do it through the Metadata of your data files.
Data Source
Please refer to section ’E.6.2.4 Setting the Chart Axis Minimum and
This can be either ‘indicator’ or ‘associate’. If ‘indicator’ is selected, the pie
Maximum’.
chart(s) will show data for all the indicators in the active theme. So if you
view an indicator called ‘Male Population’ in your report and this belongs to
C.4.3.9. Advanced Pie Chart Properties
a theme called ‘Demographics’ then the pie chart will display a slice for
The Advanced Pie Chart is not visible by default – you must first insert this
using the ‘Insert’ menu (see section ‘C.3.1.4. Insert’).
Once you have
inserted it, you can select it to display the properties (Figure 84).
Figure 84
each of the indicators in the ‘Demographics’ theme.
If ‘associate’ is selected, the pie chart(s) will show data for the associates
of the active indicator. So if you view an indicator called ‘Male Population’
in your report then the pie chart will display a slice for each of the
associates of this indicator.
List Of Associates To Ignore
When the ‘Data Source’ property is set to ‘associate’, by default all
associate columns of the selected indicator will be part of the Advance Pie
Chart. However, the categories for the Advanced Pie Chart should always
add up to a logical total. If you would like to include additional associates
into your report which do not belong to the logical total but which you might
wish to display in the data table, you can add them to the ‘List of
Associates To Ignore’. These associates will then not be included into the
Advanced Pie Chart.
There is a dedicated guide about the Advanced Pie Chart available.
Please contact your support provider for further information.
© GeoWise
GeoWise Ltd.
Ltd. 2013
2011
©
Page 70
visualise | communicate | ENGAGE
C.4.3.10. Pyramid Chart Properties
The InstantAtlas Designer
Axis Labels
g the InstantAtlas Area Profile Template User Guide
By default the axis labels are ‘m’ for male on the right side of the chart xThere is a dedicated Population Pyramid (HTML Edition) Template
available (licenced together with the Single Map template) which is
axis and ‘f’ for female on the left side of the chart x-axis. You can change
these labels to whatever you like.
the only one of the HTML templates that includes the Pyramid Chart.
In the Population Pyramid (HTML Edition) template the default axis
Within the Flash template family the Pyramid Chart is currently only
labels are ‘Males’ and Females’ but they can be changed using the
available in the Single Map Template. However, it is not visible by default
properties ‘Male Label’ and ‘Female Label’.
– you must insert it using the ‘Insert’ menu (see section ‘C.3.1.4. Insert’).
The Pyramid Chart displays indicator data belonging to one map feature in
a back-to-back horizontal bar chart. This chart is typically used to show
population structure broken down by age groups and gender (Figure 85).
Figure 85
X-Axis Minimum and Maximum
The property ‘Use X-Axis Min and Max’ gives you the option to either have
the chart x-axis adjust to the values it displays or to always force it between
two fixed values. If ‘Use X-Axis Min and Max’ is ticked the chart will use
the values of ‘X-Axis Minimum’ and ‘X-Axis Maximum’ to constrain the
chart x-axis.
In the Population Pyramid (HTML Edition) template it is only possible
to set the ‘Fixed Maximum Value’ as it is assumed that the bars
should always start at zero. This setting is applied if ‘ Use Fixed
Values’ is ticked.
Show Comparison Data
You should enable this property if you wish to see a permanent
comparison line in the chart for all comparison features. If this property is
© GeoWise
GeoWise Ltd.
Ltd. 2013
2011
©
Page 71
visualise | communicate | ENGAGE
disabled, the user will still be able to toggle the comparison lines on by
g the InstantAtlas Area Profile Template User Guide
selecting the comparison features from the Comparison Table.
The InstantAtlas Designer
dot representing the minimum indicator value is always displayed to the
very left of the chart. The dot for the maximum indicator value is displayed
to the very right of the chart. The dots are superimposed over a grey
In the Population Pyramid (HTML Edition) template this setting is
called ‘Always show Comparison Data’.
shaded box with whiskers (Figure 86). The meaning of the vertical box
borders and the length of the whiskers depends on the ‘Chart Type’
settings you choose in the config.xml file.
Figure 86
In the Population Pyramid (HTML Edition) template it is possible to
show data from up to 3 associate columns as lines in the chart. For
each you can define the ‘Value’ (which is the data source and should
contain the name of the associate column), the ‘Colour’ of the line
Chart Type ‘distribution’
and the ‘Label’ which appears in the Pyramid Legend.
The default ‘Chart Type’ setting is ‘distribution’.
Using this option, the
vertical box borders and whiskers mean the following:
There is a dedicated guide about the Pyramid Chart available. Please
contact your support provider for further information.
C.4.3.11. Dot Plot Properties
The HTML templates do not currently include the Dot Plot
component.
Left whisker:
-1 standard deviation
Left border of the box:
-0.5 standard deviation
Vertical line in the box:
The mean of the indicator values
Right border of the box:
+0.5 standard deviation
Right whisker:
+1 standard deviation
The text for the tool tip which appears when hovering over the grey shaded
box is by default ‘min | -1sd | -0.5sd | mean | 0.5sd | 1sd | max’ but you can
The Dot Plot is currently only available in the Single Map (Flash Edition)
Template. However, it is not visible by default – you must insert it using
the ‘Insert’ menu (see section ‘C.3.1.4. Insert’).
The Dot Plot shows the spread of the indicator data around the mean or
median. Each dot represents the indicator value of one map feature. The
© GeoWise
GeoWise Ltd.
Ltd. 2013
2011
©
change this using the property ‘Tip’ in the config.xml file.
Chart Type ‘interquartile’
When using the chart type ‘interquartile’, the grey shaded box represents
the interquartile range. The vertical box borders and whiskers mean the
following:
Page 72
visualise | communicate | ENGAGE
Left whisker:
The InstantAtlas Designer
5th Percentile
Figure 87
g the InstantAtlas Area Profile Template User Guide
Left border of the box:
The lower quartile
Vertical line in the box:
The median of the indicator values
Right border of the box:
The upper quartile
Right whisker:
95th Percentile
The tool tip text will not change automatically when you change the ‘Chart
Type’ property. So once you have chosen the ‘interquartile’ option you
might want to change the ‘Tip’ property to something like this ‘min | Q95 |
LQ | median | UQ | Q95 | max’.
The default statistics are the following:
C.4.3.12. Statistics Box Properties
The Statistic Box is currently only available in the Single Map (Flash
Edition) Template. However, it is not visible by default – you must insert it
using the ‘Insert’ menu (see section ‘C.3.1.4. Insert’).
Variable
sum
mean
Description
The sum of the indicator
values
The arithmetic mean of the
indicator values
Formula
x
x
x
n
All released HTML templates include the Statistics Box component.
The Statistic Box shows several statistical figures calculated automatically
from the indicator values of all feature in the report (Figure 87).
If a filter is applied the statistics will be calculated on-the-fly for just the
filtered features. This works for a filter applied through the Filter Explorer
and for geographic filters which can be applied by selecting a subset of the
map features, right-clicking to open the context menu and select the ‘Filter
Selection’ option.
© GeoWise
GeoWise Ltd.
Ltd. 2013
2011
©
Page 73
visualise | communicate | ENGAGE
Variable
median
Description
The numeric value separating
the higher half of the indicator
values from the lower half.
g the InstantAtlas Area Profile Template User Guide
The InstantAtlas Designer
Formula
If x1 < x2 < x3 then:
m x2
If x1 < x2 < x3 < x4 then:
m
The smallest indicator value
-
max
The largest indicator value
-
lower quartile
The 25th percentile. If the
rank r is not integer, the
‘Linear Interpolation Between
Closest Ranks’ method is
used.
The 75th percentile. If the
rank r is not integer, the
‘Linear Interpolation Between
Closest Ranks’ method is
used.
The difference between the
upper and lower quartiles
A measure of the average
distance between each of a set
of data points and their mean
value; equal to the sum of the
squares of the deviation from
the mean value.
The square root of the
variance in the units of variable
upper quartile
interquartile
range
variance
standard
deviation
© GeoWise
GeoWise Ltd.
Ltd. 2013
2011
©
Variable
range
x 2 x3
2
min
Q1 xr
r
The Statistics Box in the HTML templates also includes:
Description
The difference between the
minimum and maximum
values
Formula
xmax xmin
The property ‘Text’ of the Statistic Component in the config.xml file allows
with
1
(n 1)
4
you to amend the displayed statistical figures. By default the value of this
property is:
<p>
Q3 xr with
3
r (n 1)
4
sum: ${sum} <br/>
mean: ${mean} <br/>
median: ${median} <br/>
min: ${minValue} <br/>
IQR Q3 Q1
2
( x x) 2
n 1
max: ${maxValue} <br/>
lower quartile: ${lowerQuartile} <br/>
upper quartile: ${upperQuartile} <br/>
interquartile range: ${interquartileRange} <br/>
variance: ${variance} <br/>
standard deviation: ${standardDeviation}
( x x) 2
</p>
n 1
Page 74
visualise | communicate | ENGAGE
g the InstantAtlas
Area
ProfileofTemplate
Userproperty
Guide
The default
value
the ‘Text’
The InstantAtlas Designer
in an HTML report is:
C.4.3.13. Google Search Properties
sum: ${sum} <br/>
The HTML templates do not include the Google Search as a
mean: ${mean} <br/>
separate component. A Search Tool can be enabled in the Map
median: ${median} <br/><br/>
component which works either using the Google Maps search
min: ${minValue} <br/>
engine if you use Google Maps as a background layer or with the
max: ${maxValue} <br/>
ArcGIS Online geocoding functionality if your map data is in the
range: ${range} <br/><br/>
projection ‘Web Mercator (Auxiliary Sphere)’.
lower quartile: ${lowerQuartile} <br/>
upper quartile: ${upperQuartile} <br/>
interquartile range: ${interquartileRange}
The Google Search component is available in all Flash dynamic report
<br/><br/>
templates. However, it is not visible by default – you must insert it using
variance: ${variance} <br/>
the ‘Insert’ menu (see section ‘C.3.1.4. Insert’).
standard deviation: ${standardDeviation}
The Google Search allows the end-user to search the map in an
InstantAtlas report if it contains Google background mapping. Simply type
This text is HTML code that groups all statistical values into one paragraph
<p>...</p>. The substitution variables, which hold the actual values,
start with a dollar symbol and are enclosed in curly brackets like this:
${...}. You can amend this text as you wish, for example by adding
further static text or basic HTML commands (e.g. <b>...</b> would let
into the text field a post code, street name or any other location. If the
Google Search is able to find results within the spatial bounding box of the
base layer (i.e. the geographic area of the report), it will display them in a
drop down list underneath the text field (Figure 88).
Figure 88
the text between appear bold).
© GeoWise
GeoWise Ltd.
Ltd. 2013
2011
©
Page 75
visualise | communicate | ENGAGE
The InstantAtlas Designer
Selecting an item out of the drop down list will centre the map on this
g the InstantAtlas Area Profile Template User Guide
If you wish that the Google Search text field contains already some
location and a red marker will appear. Please note that this marker might
descriptive text when the report loads, you can define this text in the
be hidden behind the base layer or contextual layers. You can toggle map
‘Search Default Text’ property.
layers on and off by using the checkboxes in the Legend.
search term here...’
The results of the Google Search might improve significantly if the
C.4.3.14. Feature Card Properties
This could for example be ‘Type your
administrator adds an ‘Appended Search Text’ into the configuration
properties in the Designer. This will ensure results are more relevant to the
local area.
The HTML templates Single Map, Population Pyramid, Election
Results, Scatter Plot and Advanced Bubble Plot include a
For example in a map with Edinburgh post code sectors, the Google
Search will not be able to find the ‘Botanic Garden’ by default. This is
because Google only returns a certain number of results it finds worldwide
for the specified search term. These results are then filtered to only show
those which lie inside the bounding box of the base layer. However, in the
list returned by Google to the report, the Botanic Garden in Edinburgh is
not included because there are too many results for Botanic Garden (all
component called Feature Card. It shows an overview of the data for
the selected feature(s) (Figure 89). It is highly customisable as its
content is defined in HTML Format in the file called ‘snippet.htm’.
InstantAtlas customers can find further information and examples on
how the Feature Card component can be used in the IA Online
Library (you will be asked to sign in to your ‘My InstantAtlas’
account):
around the world). To ensure greater accuracy in the search results, the
administrator is advised to choose an ‘Appended Search Text’ which is
http://www.instantatlas.com/customers/support/library/desktop/tech-
always added to the search term which the end-user enters into the text
articles/html/feature-card
field.
We would recommend choosing as the ‘Appended Search Text’ a word or
phrase which describes the area of you base geography.
Using the
Edinburgh post code sectors as an example, the word ‘Edinburgh’ would
be suitable as this would ensure only results relevant to ‘Edinburgh’ are
returned. If you have a map for the United Kingdom, then ‘UK’ would be a
suitable ‘Appended Search Text’.
© GeoWise
GeoWise Ltd.
Ltd. 2013
2011
©
Page 76
visualise | communicate | ENGAGE
The InstantAtlas Designer
Figure 90
g the InstantAtlas
Figure 89Area Profile Template User Guide
The ‘Standard number of classes’ box defines the number of classes
shown in the Quantile, Equal Interval and Natural Breaks legends when
your report opens.
Similarly, the ‘Maximum number of classes’ box
determines the maximum number of classes that can be displayed. Below
these settings you will see that there are two tabs: ‘Palettes (numeric data)’
and ‘Colour Schemes (textual data)’. The Palettes are used for numerical
data and the Colour Schemes are used for categorical data.
C.4.4. Editing Map Palettes
To add a palette, click the ‘Add’ button. To remove a palette, click its name
in the ‘Name’ column to highlight it and click the ‘Remove’ button. To move
Click ‘Palettes’ if you wish to edit the palettes or colour schemes used to
a palette up or down, click its name in the ‘Name’ column to highlight it and
shade the maps in your dynamic reports. The ‘Map Palettes & Colour
click the ‘Up’ or ‘Down’ button. To edit the colours for a palette, simply
Schemes’ dialog will open (Figure 90).
click on the colour array in the ‘Colours’ column. The ‘Edit colours’ dialog
will open (Figure 91).
© GeoWise
GeoWise Ltd.
Ltd. 2013
2011
©
Page 77
visualise | communicate | ENGAGE
Figure 91
g the InstantAtlas Area Profile Template User Guide
The InstantAtlas Designer
Click ‘OK’ when you are satisfied with your choice. Click ‘Cancel’ if you
wish to discard you changes and close the dialog or ‘Reset’ if you wish to
return to the original colour.
InstantAtlas reports will shade the map by interpolating between the first
and last colours in the active palette if the number of classes displayed in
the report exceeds the number of colours in the palette colour array.
Click the ‘Add’ button to add a colour. To remove a colour, click its cell in
the ‘Index’ column to highlight it and click the ‘Remove’ button. To move a
colour up or down in the order, click its cell in the ‘Index’ column to
highlight it and then click the ‘Up’ or ‘Down’ button. If you add a colour, or
Click the ‘Colour Schemes (textual data)’ tab to view the existing colour
schemes (Figure 93).
You can add and remove colour schemes and
colours in exactly the same way as for palettes.
Figure 93
click an existing colour, the ‘Pick a colour’ dialog will appear (Figure 92).
You can use the options under any of the tabs to choose your colour.
Figure 92
C.4.5. Making a Component a Pop-up Window
All components in the report can either be permanently visible or work as a
pop-up window which can be toggled on and off using a button.
This
section will describe the steps to modify a component to be a pop-up
window.
The bar chart of a Flash dynamic report will be used as an
example.
© GeoWise
GeoWise Ltd.
Ltd. 2013
2011
©
Page 78
visualise | communicate | ENGAGE
Click to select the bar chart component in the canvas and the ‘Bar Chart
g the InstantAtlas Area Profile Template User Guide
The InstantAtlas Designer
You should then insert a new button into your report.
Select ‘Insert’,
Properties’ will be displayed in the right hand panel. As with every other
‘Button’ from the menu bar, give the button a label and tooltip of your
component in Flash dynamic reports, the bar chart has the two properties:
choice and select the ‘Links’ tab in the Properties Pane.
Type
‘script:toggleBarChart’ into the URL field (Figure 95).
PopUp Window Visible?
PopUp Window?
Figure 95
Tick the ‘PopUp Window?’ checkbox to make the bar chart a pop-up. Use
the ’PopUp Window Visible?’ property to define whether the component
should be visible or hidden when opening the report (Figure 94).
Figure 94
You can find out which script you need to use by hovering over the ‘PopUp
Window Visible?’ or ‘PopUp Window?’ properties. The tooltips that appear
include the ActionScript function (Figure 96).
© GeoWise
GeoWise Ltd.
Ltd. 2013
2011
©
Page 79
visualise | communicate | ENGAGE
The InstantAtlas Designer
Figure 96
C.5. Applying a Design to Other Dynamic Reports
g the InstantAtlas Area Profile Template User Guide
It is simple to apply a custom design to a series of InstantAtlas reports that
you have published, even if the map and indicator data in each report is
different. All you need to do is replace the existing config.xml file of the
dynamic report you want to change with the config.xml file you have
customised using the Designer.
However, it is very important to realise that the configuration file is
template-specific. You can only apply the same config.xml file to multiple
dynamic reports if they were published using the same template.
For example, a series of dynamic reports published using the Single Map
(Flash Edition) v6.5.0 template can share the same config.xml file. But
You can find a full list of ActionScript functions in section ‘C.4.3.2. Button
applying this config.xml file to a dynamic report published using, for
example, a Double Map v6.5.0 template is not supported and will almost
Properties’.
certainly cause the report to malfunction.
In the config.xml file of an HTML template, each component can be
Similarly, applying a config.xml file from a Flash dynamic report to an
toggled by a button without needing to change the properties of the
HTML dynamic report will cause it to malfunction.
component. You simply need to insert a button with the relevant
Properties’).
We also do not recommend re-using a config.xml file between minor
However, you may want to define if the component is visible when
version changes e.g. applying a version 6.4.0 config.xml file to a 6.5.0
the report is opened using the property ‘Visible At Startup?’. You
report. It might appear as if the report still works fine, however, you will not
may also want the component to disappear when you click outside it
be able to find configuration settings which are necessary for the new
with the mouse. This is done by ticking the box of the property
functionality of the 6.5.0 report.
JavaScript function (see
section ‘C.4.3.2. Button
‘PopUp Window?’. A component which has this property ticked is
styled to show a drop shadow. Both properties are part of all report
components.
Customers of InstantAtlas can use the Configuration File Converter to
update older config.xml files to a newer version. This tool is available within
’My InstantAtlas’, the user restricted area of our website.
.
© GeoWise
GeoWise Ltd.
Ltd. 2013
2011
©
Page 80
visualise | communicate | ENGAGE
The InstantAtlas Style Editor
g the InstantAtlas Area Profile Template User Guide
D. THE INSTANTATLAS STYLE EDITOR
D.1.
About this Section .................................................................................................................. 82
D.2.
Starting the Style Editor ......................................................................................................... 82
D.3.
The Style Editor Interface ...................................................................................................... 83
D.3.1.
D.3.1.1.
File ......................................................................................................................... 83
D.3.1.2.
Edit ......................................................................................................................... 85
D.3.1.3.
Help ........................................................................................................................ 85
D.3.1.4.
Find and Replace ................................................................................................... 86
D.3.2.
The ‘Classes’ Pane ........................................................................................................ 87
D.3.3.
The ‘Properties’ Pane .................................................................................................... 89
D.4.
© GeoWise
GeoWise Ltd.
Ltd. 2013
2011
©
The Menus and Toolbar ................................................................................................. 83
Applying a Style to Other Dynamic Reports .......................................................................... 91
Page 81
visualise | communicate | ENGAGE
The InstantAtlas Style Editor
D.1. About this Section
D.2. Starting the Style Editor
The InstantAtlas Style Editor is a tool for changing the styles for an
The Style Editor can be used as a stand-alone application to edit the style
InstantAtlas dynamic report.
The styles controls the way the various
sheet for a report that has already been published. To open the Style
components in a report (map, data table, charts, etc.) look in terms of their
Editor as a stand-alone application click ‘InstantAtlas Desktop Edition’,
background and border colours, borders widths and text fonts. The styles
‘InstantAtlas Style Editor’ in the Windows Start menu or click the
for a report are stored in a Cascading Style Sheet (.css) called
‘InstantAtlas Style Editor’ icon on your desktop. If you chose not to create
‘default.css’. This is located with the other files that make up a dynamic
shortcuts
report.
‘InstantAtlasStyleEditor.exe’ file (by default this will have been installed in
g the InstantAtlas Area Profile Template User Guide
during
installation
of
the
software,
browse
‘C:\Program Files\GeoWise\InstantAtlas’) and double click it.
It is possible to change styles using the InstantAtlas Designer and we
would normally recommend you make your style changes using the
to
the
The Style
Editor will open but the interface will remain empty until you open a report
style sheet.
Designer. This is because the Designer will show you the styles that are
used by each component. This makes it easier to know which style you
You can also right-click on the default.css file for a dynamic report you
should edit to achieve the desired effect.
have published and choose the ‘Edit with InstantAtlas Style Editor’ option
to start the Style Editor.
However, you will need to opt for the Style Editor if you wish to do any of
the following:
© GeoWise
GeoWise Ltd.
Ltd. 2013
2011
©
View the full list of styles in default.css
Add or delete CSS classes
Carry out global style changes
Page 82
visualise | communicate | ENGAGE
The InstantAtlas Style Editor
D.3. The Style Editor Interface
D.3.1. The Menus and Toolbar
The Style Editor interface consists of menus, a toolbar and two panes
The menus and toolbar give you easy access to the Style Editor options.
(Figure 97).
You can access a menu by clicking on it or holding down ‘Alt’ on your
g the InstantAtlas Area Profile Template User Guide
keyboard and pressing the underlined character in the menu name. For
example, you can hold down ‘Alt’ and press ‘F’ to access the ‘File’ menu. If
Figure 97
you hold your mouse pointer over an option in any of the drop down
menus, a tooltip will appear. Similarly, if you hold your mouse pointer over
an icon in the toolbar, a tooltip will appear. Note that if you open the Style
Editor independently of the Designer, the ‘Apply’ option (first icon in the
toolbar) will be greyed out – this is normal as ‘Apply’ is only relevant if you
have opened the Style Editor from the Designer.
The ‘Classes’
D.3.1.1. File
pane
Open
Click ‘Open’ and the ‘Open styles file...’ dialog will appear (Figure 98).
Alternatively hold down ‘Ctrl’ and press ‘O’ on your keyboard. Choose the
The ‘Properties’
pane
© GeoWise
GeoWise Ltd.
Ltd. 2013
2011
©
style sheet (called ‘default.css’) for the report you wish to change and click
‘Open’.
Page 83
visualise | communicate | ENGAGE
Figure 98
g the InstantAtlas Area Profile Template User Guide
The InstantAtlas Style Editor
which you wish to save your new style sheet, type a name in the ‘File
name’ box and click ‘Save’.
Figure 99
You will be warned if there is a problem with the style sheet you are trying
to open and given the option to display a log file. E-mail the contents of the
log file to your support provider.
This option is useful if you wish to save different style sheets for a report.
Save
Simply save the different style sheets to the report’s folder with names
such as ‘default1.css’, ‘default2.css’, ‘default3.css’, etc. Once you have
Click ‘Save’ to save changes to the open style sheet. Alternatively hold
saved these files, you simply choose which one is active by renaming it
down ‘Ctrl’ and press ‘S’ on your keyboard. When restarted, the dynamic
‘default.css’. This is because by default an InstantAtlas report looks for a
report will reflect any changes that you have made to the style sheet.
style sheet in its folder called ‘default.css’ and will ignore any others.
Save As
Apply
Click ‘Save As’ if you wish to save your changes to a new style sheet.
This option is only available if you opened the Style Editor from the
Alternatively hold down ‘Ctrl’ and ‘Shift’ and press ‘S’ on your keyboard.
Publisher (via the Designer). Click ‘Apply’ when you have made all of your
The ‘Save styles as...’ dialog will open (Figure 99). Browse to the folder in
© GeoWise
GeoWise Ltd.
Ltd. 2013
2011
©
Page 84
visualise | communicate | ENGAGE
The InstantAtlas Style Editor
style changes. The changes will be applied to the style sheet of the report
About
g the InstantAtlas Area Profile Template User Guide
you are publishing and the Style Editor will close.
Click ‘About’ to open the InstantAtlas ‘About’ window.
Exit
It contains
information regarding your Style Editor application, including the version
number and the location of your licence file (Figure 100).
Click ‘Exit’ to close the Style Editor. If you have not saved your changes,
you will be prompted to do so.
Figure 100
D.3.1.2. Edit
Undo
Click ‘Undo’ to undo changes that you make to the style sheet.
Alternatively hold down ‘Ctrl’ and press ‘Z’ on your keyboard.
Most
changes can be undone in this way. You can click ‘Undo’ multiple times in
a row to undo a series of changes. This option will be greyed out if there
are no changes to undo.
Redo
Click ‘Redo’ to reapply any changes that you have undone by clicking
‘Undo’. Alternatively hold down ‘Ctrl’ and press ‘Y’ on your keyboard. You
can click ‘Redo’ multiple times in a row to reapply a series of changes.
This option will be greyed out if there are no changes to reapply.
There are also three buttons linking to additional information. The ‘Legal’
button links to the InstantAtlas End-User Licence Agreement.
D.3.1.3.
Help
The
‘Licence’ button links to ‘Licence File Information’, from which you can also
upload a new licence file. The ‘Templates’ button links to an overview of
Help on the Style Editor
available templates and also allows new templates to be uploaded.
Click ‘Help on the Style Editor’ to access the help pages for the Style
Editor.
© GeoWise
GeoWise Ltd.
Ltd. 2013
2011
©
Page 85
visualise | communicate | ENGAGE
D.3.1.4.
Find and Replace
The InstantAtlas Style Editor
Figure 103
g the InstantAtlas Area Profile Template User Guide
Global Property Change tool
Click ‘Find and Replace unique values within this style sheet’ tool to access
the property find and replace dialog. This button is found on the right end
of the main toolbar found at the top of the Style Editor (Figure 101).
Figure 101
Within the ‘Choose Property...’ dialog, select the property which you would
like to globally replace and click OK (Figure 102).
Figure 102
For example if the current light blue border colour property was to be
changed to red, click the ‘New’ light blue box which will open the ‘Pick a
colour...’ dialog. You can use any of the available tabs (Swatches, HSV,
HSL, RGB, CMYK or W3C Colours) to pick a colour. Recent colours used
will be displayed on the right (Figure 104).
If for example ‘borderColor’ is chosen, this will produce the dialog in
Figure 103. Click the colour box within the ‘New’ column. This will open a
dialog where you can change the border colour globally throughout the
style sheet.
© GeoWise
GeoWise Ltd.
Ltd. 2013
2011
©
Page 86
visualise | communicate | ENGAGE
Figure 104
The InstantAtlas Style Editor
Figure 105
g the InstantAtlas Area Profile Template User Guide
D.3.2. The ‘Classes’ Pane
Click ‘OK’ in the ‘Replace...’ dialog and the new colour (e.g. red) will be
© GeoWise
GeoWise Ltd.
Ltd. 2013
2011
©
applied to all border colour properties which had the original colour (e.g.
The ‘Classes’ pane lists the style classes and elements available in the
light blue) (Figure 105).
open style sheet (Figure 106). Click on a class to select it.
Page 87
visualise | communicate | ENGAGE
Figure 106
g the InstantAtlas Area Profile Template User Guide
The InstantAtlas Style Editor
You can drag the right hand border of the pane if you wish to make the
‘Classes’ pane wider. There are two icons at the bottom of the ‘Classes’
pane. The icon on the left allows you to add a new class or element. If
you click it, the ‘Create a new style selector’ dialog will appear
(Figure 107).
Figure 107
For example, you may have inserted a number of custom text components
into your report using the Designer and wish them to be styled the same
way. If there is not an existing style that is suitable, you could use the
Style Editor to add a new class and create properties for it such as ‘fontfamily’, ‘font-size’ and ‘fill’.
You would then ensure your custom text
components use the new class by editing the properties for the text
component in the Designer (‘Styles’ tab, de-select the custom style and
A description for each style class is displayed at the top of the ‘Properties’
choose your new class from the drop down list).
pane. Also, you can tell from the names of the classes that many of them
The icon on the right allows you to remove the selected class or element.
are related (Figure 106). The panel classes for example are controlled by
You can also access these options by right clicking on a style class in the
the “parent” ‘Panel’ class within which individual properties can be
list.
changed. These changes made to the “parent” class will affect all panel
absolutely sure they will not be required otherwise you risk breaking your
objects in the dynamic report. You can override the global parent class by
report.
You should not delete any of the default classes unless you are
making changes to the “child” classes in order to style individual panel
objects (e.g. ‘.mapPanel’ for the map component only).
© GeoWise
GeoWise Ltd.
Ltd. 2013
2011
©
Page 88
visualise | communicate | ENGAGE
D.3.3. The ‘Properties’ Pane
The InstantAtlas Style Editor
Figure 109
g the InstantAtlas Area Profile Template User Guide
The ‘Properties’ pane displays the properties for the style class highlighted
in the ‘Classes’ pane, the name of which is displayed at the very top of the
pane (Figure 108).
Figure 108
Type your new description and click the ‘OK’ button complete the change.
Properties and their values are listed below. You edit an existing value
simply by clicking the cell containing the value. There are three icons in
the bottom right corner of the ‘Properties’ pane. The leftmost icon is used
to add a new property. Click it to open the ‘Add style property’ dialog
(Figure 110).
Figure 110
Just below the name of the selected class you can see a description for
that class. Below the description is a button that enables you to edit the
description.
Click the button to open the ‘Edit Description’ dialog
(Figure 109).
© GeoWise
GeoWise Ltd.
Ltd. 2013
2011
©
Page 89
visualise | communicate | ENGAGE
The InstantAtlas Style Editor
Click a property and click ‘OK’.
by default you can add another font family using the add button or you can
g the InstantAtlas Area Profile Template User Guide
change a currently available font family by double clicking the font family
The middle icon is used to delete the selected property. The rightmost icon
name and selecting the font of your choice (Figure 112).
is used to link to the description of this property in the W3C
Recommendation
for
Scaleable
Vector
Graphics
Figure 112
(http://www.w3.org/TR/SVG/).
If you click a colour property the ‘Pick a colour...’ dialog will open. You can
use any of the available tabs (Swatches, HSV, HSL, RGB, CMYK or W3C
Colours) to pick a colour. Recent colours used will be displayed on the
right (Figure 111).
Figure 111
The order of these fonts can be changed by selecting one and clicking the
To change the font for text, simply click in the box containing the value for
up or down buttons. The order is the order in which the end-user will be
font-family. This will open the ‘Edit Font Families...’ dialog. Choose a Font
able to view the fonts. For example, if the end-user is viewing a dynamic
Family then click OK. If you wish to use a font family that is not available
© GeoWise
GeoWise Ltd.
Ltd. 2013
2011
©
Page 90
visualise | communicate | ENGAGE
The InstantAtlas Style Editor
report and they do not have Arial or Verdana available on their computer
g the InstantAtlas Area Profile Template User Guide
then the text will show in the font Sans Serif (Figure 112).
When changing the value for font-size you can use the up/down arrows
that appear or you can type in a new number and press the ‘Enter’ button
on your keyboard.
D.4. Applying a Style to Other Dynamic Reports
It is simple to apply a custom style to a series of InstantAtlas reports that
you have published, even if the map and indicator data in each report is
different. All you need to do is replace the existing default.css file of the
dynamic report you want to change with the default.css file you have
customised using the Style Editor.
The style sheet is not specific to an individual template in the way that
the configuration file (config.xml) is. However, it is specific to the template
version and edition (Flash or HTML). For example, you can apply the
same default.css file to Flash dynamic reports published using the Single
Map, Double Map, Double Map Time Series and Area Profile v6.6.0
templates as long as they are all Flash reports. Applying a default.css file
from a Single Map (HTML Edition) report would break any of these reports.
© GeoWise
GeoWise Ltd.
Ltd. 2013
2011
©
Page 91
visualise | communicate | ENGAGE
The InstantAtlas Excel Data Manager
g the InstantAtlas Area Profile Template User Guide
E. THE INSTANTATLAS EXCEL DATA MANAGER
E.1.
About this Section .................................................................................................................. 94
E.2.
The Excel Add-in.................................................................................................................... 94
E.3.
The Excel Workbook .............................................................................................................. 97
E.4.
The Geography and Filters Worksheet .................................................................................. 98
E.4.1.
Entering Codes (Column A) ........................................................................................... 98
E.4.2.
Entering Names (Column B) .......................................................................................... 99
E.4.3.
Entering Links (Column C) ............................................................................................. 99
E.4.4.
Entering Filter Information (Columns D Onwards) ....................................................... 100
E.5.
The Datasheets .................................................................................................................... 101
E.5.1.
E.5.1.1.
Entering Codes (Column A) ................................................................................. 102
E.5.1.2.
Entering Names (Column B) ................................................................................ 102
E.5.1.3.
Entering Indicator Values (Columns C Onwards) ................................................ 102
E.5.2.
E.6.
© GeoWise
GeoWise Ltd.
Ltd. 2013
2011
©
Entering Indicators ....................................................................................................... 102
Entering Associate Values ........................................................................................... 106
The Metadata Worksheet .................................................................................................... 107
E.6.1.
Adding Metatext ........................................................................................................... 107
E.6.2.
Adding Indicator Display Metadata .............................................................................. 108
E.6.2.1.
Setting the Precision for Indicators and Associates............................................. 109
E.6.2.2.
Setting a Data Type for Associates ..................................................................... 110
E.6.2.3.
Setting Custom Legends ...................................................................................... 110
E.6.2.4.
Setting the Chart Axis Minimum and Maximum ................................................... 112
E.6.2.5.
Setting Data Table Column Aliases ..................................................................... 112
Page 92
visualise | communicate | ENGAGE
E.6.2.6.
The InstantAtlas Excel Data Manager
Defining Additional Data Table Columns ............................................................. 112
g the InstantAtlas Area Profile Template User Guide
E.7.
© GeoWise
GeoWise Ltd.
Ltd. 2013
2011
©
Exporting Data Files............................................................................................................. 113
Page 93
visualise | communicate | ENGAGE
The InstantAtlas Excel Data Manager
‘File’ tab and select ‘Options’ in the left hand menu (Figure 114 for Excel
E.1. About this Section
g the InstantAtlas Area Profile Template User Guide
2010; Figure 115 for Excel 2013).
The Excel Data Manager is an Excel add-in (i.e. a supplemental program
that adds custom commands to Excel).
It enables data in an Excel
Figure 113
workbook to be exported as InstantAtlas XML or JSON data files.
For InstantAtlas Flash dynamic reports, the data files need to be in XML
format.
XML stands for Extensible Markup Language and is a flexible
format for storing, structuring and publishing information.
For InstantAtlas HTML dynamic reports the data files need to be in
JSON format. JSON stands for JavaScript Object Notation which is
a text-based format for representing data structures.
E.2. The Excel Add-in
Figure 114
With InstantAtlas version 5 or later, the Excel Data Manager add-in is
automatically installed. However, you will still need to enable it in order for
the InstantAtlas menu and toolbar to appear. If you have followed the
instructions in the InstantAtlas Getting Started guide, you will already have
enabled the add-in.
To enable the add-in follow the instructions below for either Excel 2007 /
2010 / 2013 or for earlier versions.
Excel 2007 / 2010 / 2013
Open Excel. In Excel 2007 click the Office button and click on the ‘Excel
Options’ button (Figure 113). For Excel 2010 and 2013 click the green
© GeoWise
GeoWise Ltd.
Ltd. 2013
2011
©
Page 94
visualise | communicate | ENGAGE
The InstantAtlas Excel Data Manager
Files\GeoWise\InstantAtlas’, and click OK. It will now be available in the list
Figure 115
g the InstantAtlas Area Profile Template User Guide
of Add-Ins.
Select the InstantAtlas Data Manager from the checklist (Figure 116) and
click ‘OK’.
Figure 116
This should launch the Excel Options Window.
In the left hand pane,
choose Add-ins which will bring up the list of installed add-ins and whether
they are active (enabled) or not.
Initially the IA Data Manager may be in the list but it will not be active. To
activate it, click the ‘Go’ button at the bottom of the add-in screen in order
to start managing your add-ins.
If the IA Data Manager is not present in the Add-Ins dialog, click ‘Browse...’
and browse to the file called ‘IA Data Manager.xla’ which is located in the
If you have multiple versions of the add-in available because you have
upgraded from a previous version of InstantAtlas, please ensure that the
most recent version has been enabled.
If you use Excel 2013 you will now need to close and then reopen Excel.
root folder of the InstantAtlas Desktop installation, usually ‘C:\Program
© GeoWise
GeoWise Ltd.
Ltd. 2013
2011
©
Page 95
visualise | communicate | ENGAGE
The add-ins tab should now display two new buttons (Figure 117). There
g the InstantAtlas Area Profile Template User Guide
The InstantAtlas Excel Data Manager
Select the InstantAtlas Data Manager from the list so that the checkbox
is also a menu item called Instant Atlas from which these functions can
becomes checked. Click ‘OK’. The dialog will close and you will see that
also be selected.
Excel has a new menu called ‘InstantAtlas’ (Figure 119) and a new toolbar
with two buttons (Figure 120).
Figure 117
Figure 119
Older versions of Excel
Open Excel. If no blank workbook automatically opens then open a new
workbook.
Click ‘Tools’, ‘Add-Ins’ and the ‘Add-Ins’ dialog will open
Figure 120
(Figure 118).
Figure 118
The add-in should be automatically installed. If however you cannot find
the add-in in the list click the ‘Browse’ button and browse to the add-in
provided with your InstantAtlas software. This is an XLA file called ‘IA Data
Manager {version number}.xla’ located in the ‘InstantAtlas’ folder created
during installation of your InstantAtlas software.
Click ‘OK’.
The
InstantAtlas Data Manager will appear among your list of add-ins. If you
are prompted to copy the add-in file to your ‘Add-Ins’ folder we recommend
that you say ‘Yes’.
You can click and drag the toolbar to a dock in a new location above the
worksheet. Alternatively you can drag it over the worksheet to display it as
a floating toolbar. The menu and toolbar will be visible each time you start
Excel.
This section of the user guide documents the ‘IA Export’ button. The ‘IA
Merge Files’ button is used to create data files for multiple geography
© GeoWise
GeoWise Ltd.
Ltd. 2013
2011
©
Page 96
visualise | communicate | ENGAGE
The InstantAtlas Excel Data Manager
reports. Section ‘H. Multiple Geography Reports’ of this user guide gives
g the InstantAtlas Area Profile Template User Guide
detailed information on how to create multiple geography reports.
menu and toolbar have disappeared.
Prior to InstantAtlas version 6.6.0, the Excel add-in also included a button
‘IA Metadata’ which was used to create metadata HTML pages.
5. Click ‘OK’ to close the dialog. You will see that the ‘InstantAtlas’
Older versions of Excel
This
functionality is now available as a separate add-in called ‘InstantAtlas
Metadata Manager’. If you are an InstantAtlas client you can download this
add-in together with a guide explaining how to create metadata HTML
pages from ‘My InstantAtlas’.
1. Click ‘Tools’, ‘Add-Ins’
2. In the ‘Add-Ins’ dialog, click the checkbox for the Excel Data
Manager so that it is unselected
3. Click ‘OK’ to close the dialog. You will see that the ‘InstantAtlas’
menu and toolbar have disappeared.
Note that in earlier versions of InstantAtlas (version 3 or earlier) Excel Data
Manager workbooks each had embedded macros that would create a
E.3. The Excel Workbook
toolbar with a single ‘Export’ button. If you are using old Excel workbooks
to generate XML data files for version 4 or later reports, you should disable
You enter your data into an Excel workbook. This will contain several
their macros when you open them in Excel. For this your macro security in
worksheets and these must be populated according to a few basic rules.
Excel must be set to Medium. If you need to change your macro security
The sections below describe the role of each worksheet and how it should
in Excel, click ‘Tools’, ‘Macros’, ‘Security’. You should no longer be using
be populated.
macros embedded in a workbook to generate XML data files for reports.
If you want to deactivate the add-in you should do the following:
As you read these sections, you should refer to the main example Excel
workbook supplied with your InstantAtlas software. This is a file called
‘IAworkbook.xls’ located in the ‘workbooks’ folder created during the
Microsoft Office Excel 2007 / 2010 / 2013
1. In Excel 2007 click the Office button and click on the ‘Excel
Options’ button. For Excel 2010 and 2013 click the green ‘File’ tab
and select ‘Options’ in the left hand menu.
installation of your InstantAtlas software. By default the path to this file is
C:\Program Files\GeoWise\InstantAtlas\workbooks. Alternatively it can be
found from your Start Menu by browsing to ‘InstantAtlas Desktop Edition’,
‘InstantAtlas Excel Data Manager’.
2. Select ‘Add-ins’ from the left hand side menu.
Once you have understood the rules for entering data, you can replace the
3. Click Go at the bottom of this pane, to Manage Excel Add-ins
example data with your own and use the workbook to generate XML data
4. The add-ins dialog will open, click the checkbox for the Excel Data
files for your own InstantAtlas report(s). You can make multiple copies of
Manager so that it is unselected
© GeoWise
GeoWise Ltd.
Ltd. 2013
2011
©
Page 97
visualise | communicate | ENGAGE
this workbook simply by copying and pasting it or by opening it and saving
The InstantAtlas Excel Data Manager
4. Filter information (columns D onwards) - optional
g the InstantAtlas Area Profile Template User Guide
with a different name.
The ‘Geography and Filters’ worksheet is permanently active. It should not
E.4. The Geography and Filters Worksheet
be renamed.
This worksheet lists the geographic features you have data for and any
E.4.1. Entering Codes (Column A)
links and filters you care to define. All of the geographic features in the
base geography of your report must appear in this worksheet. Remember
that the base geography is the set of geographic features that you wish to
produce a thematic map for. For example, if you have crime statistics for
defined in cell A1. Digital map files can be one of the following geometry
types: polygon, line or point.
community districts in New York and you wish to make a thematic map of
For example, if you publish a report with the boundaries of New York
these, the base geography for your report will be New York community
community districts (i.e. polygons) as your base geography, cell A1 should
districts.
contain ‘polygon’. If you publish a report with the Canadian rail network
For each base geography feature you can optionally supply filter
information. In InstantAtlas reports, a filter menu allows you to apply filters
to the data displayed.
You have the option to include comparison geographies in this worksheet.
Comparison geographies are displayed in a separate table in an
InstantAtlas report.
For example, if your base geography is New York
community districts, your comparison geographies might be New York City
and the USA.
This would enable you to compare data for individual
community districts to the city and national averages.
For each geographic feature you enter the following:
1. A unique code (column A)
2. A name (column B)
3. A link to an external file (column C) - optional
© GeoWise
GeoWise Ltd.
Ltd. 2013
2011
©
The type of the digital map file used as the base geography for a report is
(i.e. lines) as the base geography, cell A1 should contain ‘line’. If you
publish a report with Scottish cities (i.e. points) as your base geography,
cell A1 should contain ‘point’.
From row 3 down, column A should contain codes for the geographic
features in a report. It is essential that you populate column A with the
correct codes. These must be exactly the same codes used to identify
features in the digital map files published in your report. If you type in
arbitrary codes that do not exist in your digital map files, your dynamic
report will not be able to match data values to geographic features.
Because the codes in your Excel workbook must be the same as those in
your map files, the same rules apply:
1. Codes must be unique (i.e. no code is repeated)
2. Codes must not include spaces
3. Every geographic feature must have a code
Page 98
visualise | communicate | ENGAGE
If you do not know what codes are used to identify features in your map
g the InstantAtlas Area Profile Template User Guide
files you can do the following:
The InstantAtlas Excel Data Manager
Please note that the number and order of areas in the Geography and
Filters worksheet must be consistent with the number and order of those in
your iadatasheet(s).
1. Start the InstantAtlas Publisher
2. Publish a report with the desired base geography and contextual
E.4.2. Entering Names (Column B)
geographies
3. Click the ‘Unpack’ button on the final screen of the Publisher
Check that cell B2 contains the name of your base geography. You can
4. Browse to the output folder for the report you published and open
type any text here apart from a forward or back slash (/ or \). For example,
the file called ‘geographies.csv’ using Excel
5. The codes in your map file will be listed in the first column of
‘geographies.csv’.
if you publish a report for post code sectors, you could enter ‘post code
sectors’ in cell B2. This text is used in the naming of the XML data files
and will not be displayed in the report itself.
6. Copy and paste the codes from ‘geographies.csv’ into your
‘Geographies and Filters’ worksheet
From row 3 down, column B should contain names for the geographic
features. These are the feature names that will be displayed in the report.
Note that in InstantAtlas version 5 and earlier, feature codes were
In the example provided, the names are similar to the codes but include
automatically given underscore prefixes by the Publisher and Data
spaces.
Managers if they started with a number. From InstantAtlas version 6 this
rule has been dropped and feature codes will be preserved exactly as they
appear in your digital map files or as entered into the Data Managers.
Make sure that Excel does not automatically remove leading zeros from
your codes – you can avoid this by typing a single quote before the code
(this forces Excel to treat the code as text even if it consists of numbers).
If you wish to include comparison geographies you must enter their codes
below those of the base geography features. The codes must be given the
prefix # (e.g. #TA1 or #00AB) to distinguish them from base geography
E.4.3. Entering Links (Column C)
For each base geography feature, you can optionally specify a link to any
file. This is the file that will open if the notes icon next to a geographic
feature is clicked in the data table of an InstantAtlas report (Figure 121).
Typically these are used to link to files containing geography-related
metadata.
Figure 121
features. In the example provided, there are two comparison geographies:
the City of Edinburgh and Scotland.
© GeoWise
GeoWise Ltd.
Ltd. 2013
2011
©
Page 99
visualise | communicate | ENGAGE
The InstantAtlas Excel Data Manager
The following image (Figure 123) illustrates some examples of links that
g the InstantAtlas
Area Profile
Template
Userreports
Guide
In InstantAtlas
HTML
dynamic
the notes icon appears in front
could be entered using absolute and relative pathnames.
of the feature names in the same column (Figure 122). If your data
does not contain a link in column 3 of the Geography and Filters
Figure 123
worksheet for a certain geographic feature, no notes icon will appear
in front of the name of this feature.
Figure 122
So you can provide a link to geography metadata on a feature by feature
E.4.4. Entering Filter Information (Columns D Onwards)
basis.
By making entries in columns D onwards, you are able to define filters for
In the example workbook, the link ‘notes.htm’ is provided for each feature.
your report. Row 1 should contain ‘filter’. The entry in row 2 should be the
This means that when the notes icon is clicked for any feature, a file called
name of the filter. Any text you enter in a filter column becomes a value
‘notes.htm’ located in the report folder will open. You can use absolute
within that filter. When you click a filter value under the Filter menu of your
pathnames
report, only geographic features with that filter value will be displayed.
(e.g.
‘C:\notes.htm’)
or
relative
pathnames
(e.g.
‘../../notes.htm’). If you intend to move your report folder it is best to put all
external files you wish to link to into the report folder and specify relative
In the example provided, there is one filter called ‘Zones’ (Figure 124). It
pathnames to them in column C.
has five values: Edinburgh Centre, North, South, East and West. This
would give you a filter in the report looking like that shown in the following
With relative pathnames, ‘./notes.htm’ means that ‘notes.htm’ is located in
image. Clicking ‘Edinburgh West’, for example, would result in only post
the report folder whereas ‘../notes.htm’ means that ‘notes.htm’ is located in
code sectors in Edinburgh West being displayed in the report.
the parent folder. And ‘../../notes.htm’ means that ‘notes.htm’ is located
two levels above the report folder.
© GeoWise
GeoWise Ltd.
Ltd. 2013
2011
©
Page 100
visualise | communicate | ENGAGE
Figure 124
The InstantAtlas Excel Data Manager
Figure 126
g the InstantAtlas Area Profile Template User Guide
You can have multiple filters in a report (Figure 125). For example you
might add a second filter designed to group post code sectors with the
same political affiliation.
Figure 125
You can add as many filters as you wish. Filters can be geographic or
non-geographic.
E.5. The Datasheets
In addition to the ‘Geography and Filters’ worksheet, you must have at
least one datasheet in your workbook. Datasheets are where you enter the
actual data values that will ultimately be displayed in your report.
A
worksheet becomes an active datasheet when its name starts with
‘iadatasheet’. To rename a worksheet in Excel, you simply right click on
the worksheet name and select ‘Rename’. You can put all of your data
values in one datasheet or spread them between two or more datasheets.
This would give you a filter menu in the report with two filters (Figure 126).
Your workbook can contain one or more active datasheets.
Note that
worksheet names must be unique in Excel. So if your workbook contains
more than one active datasheet you could, for example, name them
iadatasheet1, iadatasheet2, iadatasheet3 and so on. The number of active
© GeoWise
GeoWise Ltd.
Ltd. 2013
2011
©
Page 101
visualise | communicate | ENGAGE
datasheets will affect the number of data files produced when the data is
The InstantAtlas Excel Data Manager
Figure 127
g the InstantAtlas Area Profile Template User Guide
exported - this will be explained in more detail in section ‘E.7. Exporting
Data Files’.
E.5.1. Entering Indicators
Please refer to the ‘Example 1 iadatasheet’ of the example workbook.
E.5.1.1.
Entering Codes (Column A)
The contents of this column must be exactly the same as that of column A
in the ‘Geography and Filters’ worksheet.
Rows 1 and 2
E.5.1.2.
Row 1 contains the theme names, row 2 the indicator names.
Entering Names (Column B)
names can be anything you like.
The contents of this column must be exactly the same as that of column B
in the ‘Geography and Filters’ worksheet.
These
Be careful not to include leading or
trailing spaces as these may result in errors in an InstantAtlas report.
You can see that the cells in rows 1 and 2 are merged so that they span
E.5.1.3. Entering Indicator Values (Columns C Onwards)
more than one column. This is because the cell containing a theme name
Columns C onwards hold the data values that will be displayed in your
must span all the columns belonging to that theme.
Similarly, the cell
report. The data you enter must be organised on three levels: by theme,
containing an indicator name must span all the columns belonging to that
by indicator and by time period (Figure 127).
indicator. It is very important that cells containing theme and indicator
names span the correct number of columns or the data files you generate
will be invalid.
There are two time periods with data for Indicator 1: 2004 and 2005. Thus
the cell containing the indicator name must span two columns. There are
two indicators in Theme 1, each with two columns containing data. Thus
the cell containing the theme name must span four columns.
© GeoWise
GeoWise Ltd.
Ltd. 2013
2011
©
Page 102
visualise | communicate | ENGAGE
In an Excel worksheet, one cell can be made to span a number of columns
The InstantAtlas Excel Data Manager
Figure 128
g the InstantAtlas Area Profile Template User Guide
by merging. You can merge cells in a spreadsheet by doing the following:
1. Select the cells you want to merge by clicking and dragging so that
they are highlighted
2. Right-click your selection
3. Choose Format Cells… from the context menu.
4. Click the Alignment tab
5. Tick the box labelled Merge cells
6. Click OK
Row 3
Row 3 is used to provide links to files of your choice. These are the files
that will open when the notes icon for an indicator or time period (lowest
hierarchy level) is clicked in the data explorer of a report (Figure 128). This
is usually used to link to indicator-related metadata. You can specify a
different link for each indicator or time period.
In the example workbook, ‘notes.htm’ has been entered for every indicator.
This means that when the notes button is clicked, a file called ‘notes.htm’
located in the report folder will open. You can type in any links you like
(Figure 129). The pathnames you enter can be absolute or relative. The
following image shows examples of some alternative links that you might
enter.
Figure 129
© GeoWise
GeoWise Ltd.
Ltd. 2013
2011
©
Page 103
visualise | communicate | ENGAGE
The InstantAtlas Excel Data Manager
Row 4
Data values
g the InstantAtlas Area Profile Template User Guide
Row 4 is used to specify the type of indicator. This can be ‘numeric’ or
Starting in cell C6 you should enter your data values. As indicated above,
‘categoric’. You only need to specify the indicator type in the first column
you should generally enter numbers for ‘numeric’ type indicators and text
for each indicator.
values for ‘categoric’ type indicators. However, it is possible to enter text
values for ‘numeric’ type indicators – this can be useful if, for example, you
Indicator Type
numeric
categoric
need to suppress a value due to a case of small numbers. In the following
Use when…
...the data values for
your indicator are
numerical.
...the data values for your
indicator are textual rather
than numerical.
image (Figure 130) you can see that <5 has been entered as a data value
Sorting in Data
Table
numerical
alphabetical
values used for ‘numeric’ type indicators might be ‘-’ or ‘N/A’ for example.
Alignment in
Data Table
right aligned
left aligned
Figure 130
Examples
The percentage of
population in the 1518 age group or
average household
income
Political affiliation
(Republican, Democrat, etc)
or land classification (Urban,
Rural, etc)
for three geographic features. This is a text value and will be treated as
such – these areas will be classified separately by the legend. Other text
For the InstantAtlas version 6 reports it is possible to specify a precision
value in the metadata for numeric indicators.
For ‘categoric’ indicator
types, this precision value is ignored.
Row 5
Row 5 contains the time period names. These names can be anything you
like. Time periods for an indicator should be entered in columns from left
to right in ascending chronological order. If you only have a single time
period for each indicator, you should leave the cells in row 5 blank. You
© GeoWise
GeoWise Ltd.
Ltd. 2013
2011
©
will then just see two levels (Theme >> Indicator) instead of three (Theme
You do not have to enter a data value for every geographic feature – if you
>> Indicator >> Time Period) in the data explorer of your report.
leave a cell blank then “No Data” (or some other text you set in the
Page 104
visualise | communicate | ENGAGE
The InstantAtlas Excel Data Manager
configuration file of the report using the InstantAtlas Designer) will be
g the InstantAtlas Area Profile Template User Guide
We recommend that you avoid data values with excessive precision
displayed in the report for this area. In the example workbook, data values
(7.34167683947). There are two main considerations when you choose
have not been entered for three features in the base geography.
the number of decimal places for an indicator:
The Data Manager must not contain any Excel error codes such as
1. The number of decimal places necessary for interpretation by the
‘#DIV/0!’. These error codes may be present if values in the worksheet are
end-user of the dynamic report (long numbers are more difficult to
the result of a formula. The result of formulas can be used to generate
visualise/interpret)
data though it is considered safer to copy and paste these as ‘values’.
2. The performance of the dynamic report (long numbers mean larger
data files and potentially a reduction in the speed of the report)
Numbers should not have a comma as the thousand place separator (e.g.
12,000). If they do have a comma, you can change this by doing the
You should round values with an excessive number of decimal places as
following:
described above.
1. Select the range of cells containing the data values so that they
Adding further themes/indicators/time periods
are highlighted
2. Click the ‘Format’ menu, ‘Cells’, ‘Number’
Simply add further data in the columns to the right of the existing data.
3. In the ‘Format Number’ dialog, ensure the ‘Use 1000 Separator’
Make sure you enter the names, links, indicator type and time period labels
in rows 1-5 and that you merge cells in rows 1-2 as required. If you run out
checkbox is not checked. Click ‘OK’.
of columns (the limit in Excel 97-2003 is 255, from Excel 2007 onwards the
InstantAtlas reports will by default display your data values with the
decimal places setting for the cells in your workbook.
limit is 16,384 columns), simply do the following:
To change the
number of decimal places you can do the following:
1. Insert a new worksheet into your workbook
2. Copy columns A and B from the previous worksheet
1. Select the range of cells containing the data values so that they
are highlighted
2. Click the ‘Format’ menu, ‘Cells’, ‘Number’
3. In the ‘Format Number’ dialog, ensure the ‘Category’ is set to
3. Paste the contents into columns A and B of your new worksheet
4. Start adding data in columns C onwards
5. Rename the worksheet to a name starting with ‘iadatasheet’ to
make it an active datasheet
‘Number’ and then edit the number of decimal places. Click ‘OK’.
© GeoWise
GeoWise Ltd.
Ltd. 2013
2011
©
Page 105
visualise | communicate | ENGAGE
E.5.2. Entering Associate Values
g the InstantAtlas Area Profile Template User Guide
Please refer to the ‘Example 2 iadatasheet’ of the example workbook.
The InstantAtlas Excel Data Manager
In addition to those listed in the table above you can supply your own
associates.
You will need to configure your dynamic report using the
InstantAtlas Designer to make use of any custom associate(s) you have
supplied. Typically this is done by adding an extra column to the data table
An associate is a set of values that are so called because they are
associated to indicator values. Associate values are not used in thematic
mapping in InstantAtlas reports but perform other roles. The inclusion of
and linking this new column to the custom associate (the column name
must match the associate name). You can also use associates to populate
the Advanced Pie Chart.
associate values is optional but the default configuration of some templates
assumes that you will be supplying certain associates. The table below
The ‘Example 2 iadatasheet’ worksheet demonstrates how to include
lists these associates.
associate values in your workbook.
Associate values are entered in
columns directly to the right of the indicator values to which they relate.
Associate
Reason for including in your data file(s)
Note that you do not have to supply the same set of associates for every
ll
Lower confidence limits are displayed as error
bars in a report bar chart. You can calculate
these confidence limits in any way you like.
date or indicator. You do not have to supply associate value columns for
every indicator/time period combination in your datasheet – you might
decide to enter these for some but not others.
ul
highField, lowField,
openField, closeField
Upper confidence limits are displayed as error
bars in a report bar chart. You can calculate
these confidence limits in any way you like.
These associates need to be provided if you
would like to use the box-and-whisker chart in
your report. This chart can be included in the
Single Map template using the Designer.
Please see an example on how to set up the
data for this chart in the ‘Box and Whisker
iadatasheet'.
You must merge cells in row 3 to tell InstantAtlas which columns belong to
each time period instance of an indicator. Associates should be named in
row 5 as in the table above (Figure 131).
consistent across dates/indicators.
Associate names must be
Note that these are not the names
displayed in an InstantAtlas report - the report will display an alias that you
can configure using the InstantAtlas Designer. If you supply your own
custom associates we recommend you keep the associate name simple
© GeoWise
GeoWise Ltd.
Ltd. 2013
2011
©
diff, number,
significance, national,
regional, baseline, state,
trend, target
These associates perform various roles in the
Area Profile template. For more information
please refer to section ‘I. The InstantAtlas Area
Profile Template’.
xValue, yValue,
sizeValue, FUNNELX
These associates perform various roles in the
Bubble Plot template. For more information
please refer to section ‘J. The InstantAtlas
Bubble Plot Template’.
(i.e. a single word that does not include any special characters).
Page 106
visualise | communicate | ENGAGE
The InstantAtlas Excel Data Manager
Figure 131
g the InstantAtlas Area Profile Template User Guide
E.6. The Metadata Worksheet
Including metadata in your data XML files is optional (unless you are
creating data file for InstantAtlas Server). However, there are two reasons
why you might include metadata:
Metatext – this metadata will be shown within the ‘metatext’ text
box in your InstantAtlas dynamic reports. This is a useful way of
displaying theme, indicator, or time period specific notes or tips on
the report page itself.
The ‘count’ and ‘state’ associates in the ‘Example 2 iadatasheet’ worksheet
are examples of custom associates that can be added. When mapping
rates it is good practice to show counts alongside them in the data table.
You can add a ‘Count’ column to the data table of your report using the
InstantAtlas Designer and configure it to pick up an associate in the data
file called ‘count’ (see section ‘C. The InstantAtlas Designer’, sub-section
‘C.4.3.5. Table Properties’ for more information). The same applies to the
Indicator display metadata – this metadata will define how an
indicator is displayed in your reports.
From version 6.4.0 onwards you can have multiple Metadata worksheets
which might be helpful if you want to structure your metadata into logical
groups. A metadata worksheet becomes active when its name starts with
‘Metadata’.
E.6.1. Adding Metatext
‘state’ associate respectively.
The format for entering metatext is shown below (Figure 132).
By default associate columns are assumed to be of type numeric. If you
have associate columns with textual data you should change the type to be
Figure 132
categoric. You can do this either in the iadatasheet in the cell directly
above the associate column name (row 4) or alternatively you can define
the type in the ‘Metadata’ worksheet. Please refer to section ‘E.6.2.2.
Setting a Data Type for Associates’ for further information.
© GeoWise
GeoWise Ltd.
Ltd. 2013
2011
©
Page 107
visualise | communicate | ENGAGE
Column A must contain either ’Theme’, ‘Indicator’ or ‘IndicatorDate’.
g the InstantAtlas Area Profile Template User Guide
The InstantAtlas Excel Data Manager
Paragraph tag (<p>)
Column B should contain the name of the theme, indicator or date you
Text format tag (<textformat>)
want to display text for. Column C must contain ‘metatext’. Column D
Underline tag (<u>)
should contain the text that you wish to appear in the report text box (or
text boxes in the case of a report published using the Double Map template
or Double Map Time Series template). The following image (Figure 133)
In an InstantAtlas HTML dynamic report you can use any HTML
commands to style and format your metatext.
shows how this metatext would look in a text box in a report. Note that the
text box(es) are added to a report using the InstantAtlas Designer and that
their size and position is configurable. Note also that HTML can be used to
E.6.2. Adding Indicator Display Metadata
format metatext.
It is possible to provide indicator display metadata that will allow define
Figure 133
how an indicator is displayed. This will allow you to set the following:
1. Precision
2. Data type
3. Custom legends
If your indicator names are not unique, you can address this by adding the
4. Chart axis minimum and maximum
theme name in front of the indicator name in column B. Both must be
5. Data table column aliases
separated by a pipe symbol, e.g. ‘Theme 1|Male’.
6. Additional data table columns
For Flash dynamic reports it is possible to use a subset of html commands
to format metatext. The following tags are supported:
In InstantAtlas HTML dynamic reports, adding data table columns for
an indicator overwrites all columns defined in the config.xml file.
Anchor tag (<a>)
Defining table column aliases is only possible through completely re-
Bold tag (<b>)
defining the table columns.
Break tag (<br>)
Font tag (<font>)
Image tag (<img>)
Italic tag (<i>)
Indicator display metadata are defined in the ‘Metadata’ worksheet and the
process for entering these is the same as for other metadata elements.
The example workbook contains some example indicator display metadata
List item tag (<li>)
© GeoWise
GeoWise Ltd.
Ltd. 2013
2011
©
Page 108
visualise | communicate | ENGAGE
in the ‘Example Metadata’ worksheet.
The InstantAtlas Excel Data Manager
To activate this worksheet you
g the InstantAtlas Area Profile Template User Guide
would need to rename it to ‘Metadata’.
If your indicator names are not unique, you can address this by adding the
theme name in front of the indicator name in column B. Both must be
separated by a pipe symbol, e.g. ‘Theme 1|Male’.
E.6.2.1. Setting the Precision for Indicators and Associates
The following tables show the syntax of possible settings. The settings are
InstantAtlas version 6 reports support a precision value for each indicator
and associate. An example can be seen below (Figure 134):
Figure 134
hierarchical: a Theme is overridden by an Indicator, and an Indicator is
overridden by an IndicatorDate.
A setting that is higher in the list will
always overwrite a setting from lower down for the particular element. For
example if you set a theme to have a precision of 2, and also specify an
indicator of this theme to have precision of 0, then the latter will overwrite
the former for this particular indicator. In the tables below a * symbol is
used as a wild-card and means any theme, indicator or associate column.
Figure 134 shows how you can set a precision value for an indicator (row
2) or an associate (row 3). In the example above, the main indicator value
will display with 1 decimal place, whereas the associate value ‘count’ will
The wild-card option is only valid for the precision and type metadata
elements.
always be shown with two decimal places. Please note that precision is
only used where the data type is numeric.
Precision settings can be defined on a theme, indicator and time period
level.
Figure 135 shows an example of how to set different precision
values for an associate column called ‘count’ for two different time periods
for the same indicator.
Figure 135
© GeoWise
GeoWise Ltd.
Ltd. 2013
2011
©
For themes / indicators / dates:
ElementType
Element
IndicatorDate
Theme Name|Indicator Name|Date
IndicatorDate
Indicator Name|Date
Indicator
Theme Name|Indicator Name
Indicator
Indicator Name
Indicator
Theme Name|*
Indicator
*
Theme
Theme Name
Theme
*
Page 109
visualise | communicate | ENGAGE
For associates:
The InstantAtlas Excel Data Manager
sorted (numerically or categorically). The type for associates can be set on
g the InstantAtlas Area Profile Template User Guide
ElementType
Element
theme, indicator and time period level.
IndicatorDate
Theme Name|Indicator Name|Associate Name|Date
Figure 136
IndicatorDate
Indicator Name|Associate Name|Date
Indicator
Theme Name|Indicator Name|Associate Name
Indicator
Indicator Name|Associate Name
Indicator
Theme Name|Indicator Name|*
Indicator
Indicator Name|*
Indicator
Theme Name|*|Associate Name
Indicator
* |Associate Name
For the data type of associates, the same syntax rules apply as for
Theme
Theme Name|Associate Name
precision settings (please refer to the table ‘For associates’ in the previous
Theme
*|Associate Name
Theme
Theme Name
Theme
*
If your indicator names are not unique, you can address this by adding the
theme name in front of the indicator name in column B. Both must be
separated by a pipe symbol, e.g. ‘Theme 1|Male’.
section.
E.6.2.3. Setting Custom Legends
It is also possible to set custom classifications for individual themes,
indicators or time periods. You can also set custom colours and labels for
E.6.2.2. Setting a Data Type for Associates
The main indicator value data type is controlled in the iadatasheet and can
be either numeric or categoric (see section ‘E.5.1.3. Entering Indicator
Values (Columns C Onwards)’, sub-section ‘Row 4’). Where a data type is
not supplied for an associate, the type will default to numeric. Should you
© GeoWise
GeoWise Ltd.
Ltd. 2013
2011
©
the display of the custom classification within a dynamic report.
Furthermore you can define that a theme, indicator or time period appears
with a specific legend classifier or legend palette by default.
Custom classifications are defined in the ‘Metadata’ worksheet in the Excel
Data Manager. The following image (Figure 137) shows a screenshot of
wish to change the default setting for each associate, you can do this either
the ‘Metadata’ worksheet in an instance of the Excel Data Manager. A
in the iadatasheet in the cell directly above the associate column (row 4) or
custom classification is set up for ‘Indicator 1’ which is a numeric indicator
alternatively you can supply metadata (Figure 136). The data type controls
and for ‘Indicator 4’ which contains categoric values. The default legend
how a particular data value is presented (such as alignment) and how it is
classifier for ‘Indicator 2’ is set to Equal Interval and the default legend
Page 110
visualise | communicate | ENGAGE
palette for this indicator will be the one called ‘Sequential Green Yellow’ in
g the InstantAtlas Area Profile Template User Guide
the config.xml file (Figure 137).
The InstantAtlas Excel Data Manager
Use this property to set the breaks between different classes. You should
set one more value than the number of classes that you require i.e. if you
want 5 classes you need to enter 6 values for breaks.
Figure 137
If you have
categoric data then you must use the exact text label used within the data.
Categoric breaks are case sensitive.
customLabels
Use this property to set the labels for each class that is displayed in the
legend. The labels are applied in the order in which you enter them in the
worksheet. You need to make sure that the number of labels matches the
You can see from the screenshot that the custom classification for both
indicators (‘Indicator 1’ which is of type numeric and ‘Indicator 4’ which is of
type categoric) is made up of three separate custom properties:
number of classes you have set up.
customClassifier
customColours; customBreaks and customLabels.
Use this property to set the default legend classifier for an indicator to one
If your indicator names are not unique, you can address this by adding the
of the InstantAtlas standard classifiers. Valid values are ‘equalInterval’,
theme name in front of the indicator name in column B. Both must be
‘quantile’, ‘natural’, ‘continuous’, ‘standardDeviation’.
separated by a pipe symbol, e.g. ‘Theme 1|Male’.
customPalette
customColours
Use this property to set the default legend palette for an indicator to one of
Use this property to set the colours for displaying individual classes or to
the legend palettes that are defined the config.xml file. Valid values are the
set a colour ramp.
If the number of colours you define in column D
names of the palettes in the configuration file. To find these, open up the
matches the number of classes in the custom classification then the
config.xml file or your report in the Designer and click in the menu bar on
colours will be displayed for each class in the same order in which you
‘Styles’ and the ‘Palettes’. In the ‘Palettes (numeric data)’ tab you can find
enter them in the worksheet. You can set just two colours and the dynamic
the palettes names for numeric indicators and the tab called ‘Colour
report will create a colour ramp between them for as many classes as you
Schemes (textual data)’ will show you the names of the categoric palettes.
have chosen.
customBreaks
© GeoWise
GeoWise Ltd.
Ltd. 2013
2011
©
Page 111
visualise | communicate | ENGAGE
The InstantAtlas Excel Data Manager
E.6.2.4. Setting the Chart Axis Minimum and Maximum
g the InstantAtlas Area Profile Template User Guide
column aliases that will be displayed in the data table. By default, the
By default the bar chart and time series chart adjust their minimum and
maximum depending on the data the chart shows.
For each individual theme, indicator or time period, you can define the
This might not be
suitable e.g. when using a time animation. To set the chart minimum and
maximum to a fixed value for each theme or indicator you can use the
metadata elements ‘minChartValue’ and ‘maxChartValue’ (Figure 138).
Figure 138
report will display the global alias settings defined in the data table
properties in the config.xml file. If you wish the column headers to be
different for different themes/indicators/time periods, you can overwrite the
global settings from the config.xml file. To do this, define the columns
headings by using the metadata element ‘alias_indicator’ for the indicator
column heading and ‘alias_{associateName}’ for associate column
headings. Figure 139 shows an example for both cases.
Figure 139
Please note that these two properties are depended on each other
which means you can only use them together. Just setting the
‘maxChartValue’ without having the ‘minChartValue’ defined will not have
If your indicator names are not unique, you can address this by adding the
any effect.
theme name in front of the indicator name in column B. Both must be
separated by a pipe symbol, e.g. ‘Theme 1|Male’.
If your indicator names are not unique, you can address this by adding the
theme name in front of the indicator name in column B. Both must be
Please note that it is currently not possible to change the aliases of
separated by a pipe symbol, e.g. ‘Theme 1|Male’.
columns containing the confidence limits ‘ul’ and ‘ll’. Also this functionality
is not supported for the Double Map Template
E.6.2.5. Setting Data Table Column Aliases
E.6.2.6. Defining Additional Data Table Columns
Defining table column aliases on a theme, indicator or time period
basis in HTML reports is only possible through completely redefining the table columns, see ‘E.6.2.6. Defining Additional Data
Table Columns’.
It is also possible to define on a theme, indicator or time period basis
additional data table columns. You should define all columns which will be
displayed for all themes, indicators and time periods globally in the data
table properties in the config.xml file.
Additional columns, which are
specific for one or more of the themes/indicators/time periods, can then be
© GeoWise
GeoWise Ltd.
Ltd. 2013
2011
©
Page 112
visualise | communicate | ENGAGE
The InstantAtlas Excel Data Manager
set up in the ‘Metadata’ worksheet. The appropriate metadata element is
g the InstantAtlas Area Profile Template User Guide
E.7. Exporting Data Files
’column_indicator’ for the indicator column and ‘column_{associateName}’
for associate columns. In the ‘Value’ cells of column D you can define the
To export your data to XML or JSON data files, you must have at least one
aliases of the new data table columns. Examples can be seen in Figure
active datasheet in your workbook. In other words, you must have at least
140.
one worksheet with a name that starts with ‘iadatasheet’ (this can be typed
with upper or lower case characters).
Figure 140
Click the ‘InstantAtlas’ menu in Excel and then click ‘Export Data File’.
Alternatively click the ‘IA Export’ button in the InstantAtlas toolbar
(Figure 141).
Figure 141
In InstantAtlas HTML dynamic reports, adding data table columns for
a theme, indicator or time period overwrites all columns defined in
the config.xml file. This means that you will also need to add the
‘Name’ column which holds the names of the geography features.
If the Excel Data Manager detects any problems with your workbook it will
The metadata element for this is ‘column_name’. The indicator
inform you at this stage. If your workbook has been correctly formatted, a
column
dialog box will open in which you are asked to select the file type
can
be
defined
with
either
‘column_indicator’
or
‘column_value’ as the metadata element. For associate columns use
(Figure 142).
‘column_{associateName}’ e.g. ‘column_count’.
format whereas data files for HTML dynamic reports need to be in JSON
Data files for Flash dynamic reports need to be in XML
format.
If your indicator names are not unique, you can address this by adding the
theme name in front of the indicator name in column B. Both must be
separated by a pipe symbol, e.g. ‘Theme 1|Male’.
Please note that it is currently not possible to add columns containing the
confidence limits ‘ul’ and ‘ll’ in this way.
Also this functionality is not
supported for the Double Map Template
© GeoWise
GeoWise Ltd.
Ltd. 2013
2011
©
Page 113
visualise | communicate | ENGAGE
The InstantAtlas Excel Data Manager
Figure 142
For example, if you have eighteen themes worth of data located in two or
g the InstantAtlas Area Profile Template User Guide
more datasheets in your workbook and you are exporting to XML format,
the set of XML data files created will be as shown in the following image
(Figure 143).
Figure 143
When you have made your selection, click on ‘OK’.
You will now be
prompted to browse to a destination folder.
If you are creating data files for a report that you have not yet published or
for use with InstantAtlas Server, you can save the data file anywhere in
your file system. If you are creating data files for a dynamic report that has
already been published, you should choose the folder containing the report
and click ‘Save’ (this will overwrite any existing ‘data.xml’ / ’data.js’ file).
If your workbook only contains one active datasheet, by default one
If you are displaying a large number of indicators or time periods in your
‘data.xml’ / ‘data.js’ file will be created. If your workbook contains more
report, we recommend that you enter this data in two or more datasheets.
than one active datasheet (e.g. Iadatasheet1, Iadatasheet2, Iadatasheet3)
This becomes increasingly important as the number of geographic features
then by default a ‘data.xml’ / ’data.js’ file will be created along with a
in the base geography of your report increases. By storing the data in
separate data file for each theme in your workbook.
© GeoWise
GeoWise Ltd.
Ltd. 2013
2011
©
Page 114
visualise | communicate | ENGAGE
multiple data files you ensure that your report will load data as efficiently as
The InstantAtlas Excel Data Manager
Figure 145
g the InstantAtlas Area Profile Template User Guide
possible.
In the ‘Advanced’ tab of the ‘Output Options’ dialog (Figure 144) you can
overwrite the default behaviour and choose whether or not the Excel Data
Manager shall produce theme files or not.
Figure 144
If errors are found, you should click ‘OK’ and correct the mistakes. If there
are warnings only, you can choose to either cancel the export process by
clicking on ‘Cancel’ or ignore them by clicking ‘OK’. If you click ‘OK’, you
will be prompted to browse to the destination folder.
The ‘Advanced’ tab also provides the option for a more detailed validation
of the ‘Metadata’ worksheet(s). If you wish to validate your metadata,
select ‘IA Desktop’ from the list and then click ‘OK’. If the validation results
in any errors or warning you will see a window listing them together with a
brief description and a cell reference if applicable (Figure 145).
© GeoWise
GeoWise Ltd.
Ltd. 2013
2011
©
Page 115
visualise | communicate | ENGAGE
The InstantAtlas Batch Publisher
g the InstantAtlas Area Profile Template User Guide
F.THE INSTANTATLAS BATCH PUBLISHER
© GeoWise
GeoWise Ltd.
Ltd. 2013
2011
©
F.1.
About this Section ................................................................................................................ 117
F.2.
Setting up the Excel Workbook ............................................................................................ 117
F.2.1.
The Geography and Filters Worksheet ........................................................................ 118
F.2.2.
The Datasheets ............................................................................................................ 118
F.2.3.
The Publisher Worksheet............................................................................................. 118
F.2.3.1.
Using a Raster Image Collection as a Background Layer ................................... 125
F.2.3.2.
Using a Web Map Service as a Background Layer ............................................. 125
F.2.3.3.
Using an ArcGIS Server/ArcGIS Online connection as a Background Layer ...... 127
F.2.3.4.
Using Google Maps as a Background Layer ....................................................... 127
F.3.
Individual Settings for each Report ...................................................................................... 128
F.4.
The Publishing Process ....................................................................................................... 129
F.5.
Creating Multiple Geography Reports ................................................................................. 129
F.6.
How to Debug the Batch Publisher ...................................................................................... 131
Page 116
visualise | communicate | ENGAGE
The InstantAtlas Batch Publisher
F.1. About this Section
F.2. Setting up the Excel Workbook
The Batch Publisher is a command-line interface version of the normal
It is important that you use the workbook called IAworkbook_Batch.xls
Publisher. It is useful when you need to publish large number (say 10 or
supplied with your InstantAtlas software. It is located in the ‘workbooks’
more) of dynamic reports displaying data for different sets of geographic
folder created during the installation of your InstantAtlas software.
features. It makes the publishing of multiple reports easier because you do
default the path to this file is C:\Program Files\GeoWise\InstantAtlas\
not have to click through the screens of the normal Publisher making
workbooks. It is important to use a copy of IAworkbook_Batch.xls because
selections. The Batch Publisher can be controlled using either the Excel or
it contains several worksheets called ‘Publisher-xxx’ that have functions in
Access Data Managers but just the instructions for using the Excel Data
column B. These functions can be seen by clicking on a cell in this column
Manager are given here.
and looking at the ‘name box’ in the top left corner of Excel. This will
g the InstantAtlas Area Profile Template User Guide
By
contain a function name instead of the cell address, i.e. ‘ConfigFile’ instead
The process for using the Batch Publisher is the following:
a. You enter your indicator data for ALL of the geographic features
into a single Excel workbook
b. You define a “split” column that splits the geographic features into
different dynamic reports
c.
You include a Publisher worksheet that provides the commands for
running the Batch Publisher
d. You click the ‘IA Export’ button in your Data Manager. This will
generate the data XML files and will also trigger the Batch
Publisher to run.
These steps are explained in further detail in the following sections.
of ‘B7’. These functions are required for the Batch Publisher to work. Note
that it is not possible to use your clipboard to copy and paste the contents
of the functions of one of the Publisher worksheets to another workbook. If
you need to copy the whole Publisher worksheet inclusive the functions,
you should do this by right-clicking the name of the worksheet at the
bottom and select ‘Move or Copy...’.
The example that is used below is for post code sectors in Edinburgh.
Imagine that you have the data for these and you wish to split the post
code sectors into five separate dynamic reports representing different parts
of Edinburgh: Centre, North, South, East and West. You do not wish to
manually click through the normal Publisher wizard five times to publish the
five individual reports – instead you wish to use the Batch Publisher.
Note: Before using this guide you should read sections ‘B. The InstantAtlas
Desktop Publisher’ and ‘E. The InstantAtlas Excel Data Manager’.
© GeoWise
GeoWise Ltd.
Ltd. 2013
2011
©
Page 117
visualise | communicate | ENGAGE
F.2.1. The Geography and Filters Worksheet
g the InstantAtlas Area Profile Template User Guide
The InstantAtlas Batch Publisher
columns E onwards if required and the entry in row 1 would be ‘filter’ for
any filter columns.
The ‘Geography and Filters’ worksheet should be edited first. Columns A
and B should contain the code and name of every post code sector in
F.2.2. The Datasheets
Edinburgh. Optionally, column C can contain a URL to an external file
containing supporting information for each post code sector. Column D will
be the split column that defines which report each post code sector will be
published in (Figure 146). Columns E onwards should contain any filters
you wish to include in your report.
Enter your data values into one or more datasheets. In this example, there
is just one theme, two indicators and two time periods per indicator
(Figure 147).
Figure 147
Figure 146
Cell D1 must contain ‘split’. Cell D2 can be used optionally to supply a
name for your split column although - this is just for your benefit as it is not
used by the software.
From row 3 downwards the split column must
contain the name of a part of Edinburgh. Post code sectors with the same
value in column D will be published in the same report. Note that no filter
columns have been included in this example. These could be added in
F.2.3. The Publisher Worksheet
For the Batch Publisher to work you need a worksheet called ‘Publisher’ in
your Excel workbook.
The example workbook IAworkbook_Batch.xls
contains 4 examples of this worksheet depending on what kind of
background mapping you wish to use. The functions behind the cells are
the same in all four ‘Publisher-xxx’ worksheets and you can change one
into another by changing the values in column B. The different Publisher
© GeoWise
GeoWise Ltd.
Ltd. 2013
2011
©
Page 118
visualise | communicate | ENGAGE
worksheets are simply included as examples to make it easier for you to
g the InstantAtlas Area Profile Template User Guide
set up your own Publisher worksheet.
The InstantAtlas Batch Publisher
published reports, you should set this property to ‘Yes’. The data files will
be saved into subfolders of the destination folder if these subfolders have
the same name as the split values.
To make one of the Publisher worksheets active you need to rename it to
be called ‘Publisher’.
Publisher Folder: the full pathname for the folder in which the commandline interface publisher executable (iapcmd.exe) is located.
The values you put into column B of the Publisher worksheet control the
Batch Publisher. Each setting is described below. Not all of them are
In all example Publisher worksheets this is:
mandatory. Note that the default settings make use of the shape files
‘C:\Program Files\GeoWise\InstantAtlas’.
supplied with the InstantAtlas software.
Publisher Executable: the name of the command line version of the
The settings of row 2 to row 18 are identically in all four example Publisher
Publisher. This should always be ‘iapcmd.exe’
worksheets (Figure 148).
Area Selection: This should be set to ‘Data’ if you wish the reports to only
Figure 148
include the base geography features which are part of the respective split
value. If you wish to display a map for all the areas of the base geography
map file (not just for those that will show data in your report) use ‘Base’.
Project File: If you have all setting for your batch reports already saved in
an InstantAtlas Publisher project file you can enter the full path to this file
here. The settings from the project file will override all other settings of the
Publisher worksheet with exception of the data file (or demo data) which
got selected in the Publisher when creating the project file. The data will
be the data from within your Excel workbook.
Publish: this can either be set to ‘Yes’ or ‘No’ according to whether you
wish to use the Batch Publisher or not.
Update Files Only: this should be left blank if you wish to Publish a new
Template: the full pathname for the template you wish to use.
The
templates are archives (zip) located in the ‘templates’ folder which was
created as part of your InstantAtlas installation. The location of this folder
depends upon your operating system.
set of reports. If you only want to update the data files in a set of already
© GeoWise
GeoWise Ltd.
Ltd. 2013
2011
©
Page 119
visualise | communicate | ENGAGE
For Windows XP the folder can be found in the following location:
The InstantAtlas Batch Publisher
Base File: This setting is made up of:
g the InstantAtlas Area Profile Template User Guide
C:\Documents and Settings\All Users\Application data\GeoWise\Instant
Atlas\templates
1.
the full pathname for the digital map file (ESRI shape file, MapInfo
MID/MIF, MapInfo TAB file) containing the base geography for the
For Windows Vista and Windows 7 the default folder is located at:
C:\ProgramData\GeoWise\InstantAtlas\templates
series of reports you wish to publish,
2.
the feature code field in your base geography digital map file (note
that this field is case sensitive and that the codes of your digital
In all example Publisher worksheets we have used the following (default
map file must be exactly the same as those in column A of the
windows Vista) location:
‘C:\ProgramData\GeoWise\InstantAtlas\templates\InstantAtlasSingleFlash6
Geography and Filters worksheet),
3.
.5.2.zip’
An example location of a version 6 single map template on Windows XP
would therefore be:
‘C:\Documents and Settings\All Users\Application data\GeoWise\Instant
Atlas\templates\InstantAtlasSingleFlash6.5.2.zip’
Config File: optionally you can enter the full pathname for a custom
configuration file (config.xml) that you wish to be used for the published
reports. If you do not enter a pathname, the template default configuration
file will be used.
In all example Publisher worksheets this is ‘C:\config.xml’.
the feature name field in your base geography digital map file (note
that this field is case sensitive) and
4.
optional - the label for the base geography that will be displayed in
the legend of your published reports. If you do not specify a label,
the layer will be shown in the legend with its original map file
name.
These parameters must be delimited by a ‘+’ sign.
In all example Publisher worksheets the selected digital map file is an ESRI
shape file called ‘post_code_sectors.shp’ that contains post code sector
boundaries for Edinburgh. This file is saved onto your computer during the
installation
of
InstantAtlas.
The
default
location
is
C:\Program
Files\GeoWise\InstantAtlas\maps
Stylesheet: optionally you can enter the full pathname for a custom style
sheet (default.css) that you wish to be used for the published reports. If
you do not enter a pathname, the template default style sheet will be used.
ESRI shape files have a .shp file extension (e.g. districts.shp). MapInfo
interchange (also referred to as MID/MIF) files have a .mif file extension
(districts.mif).
In all example Publisher worksheets this is ‘C:\default.css’.
MapInfo Table files (TAB files) have a .tab extension
(districts.tab). All are accompanied by supporting files. You must have a
digital map file in one of these formats to be able to publish a dynamic
report (a .shp .mif or .tab file). You will also need a .dbf file with the same
© GeoWise
GeoWise Ltd.
Ltd. 2013
2011
©
Page 120
visualise | communicate | ENGAGE
name as the .shp file (districts.dbf) or a .MID file with the same file name as
g the InstantAtlas Area Profile Template User Guide
The InstantAtlas Batch Publisher
Destination Folder: optionally you can enter the full pathname for the
the .MIF file (districts.MID). For TAB files, you will need a range of other
folder to which you want the zipped reports to be unpacked to. This can be
supporting files including .DAT, .ID, .MAP and .IND. These files need to be
the same folder as that specified for the ‘Folder for Zip File’ setting. If you
located within the same folder as the digital map files. Supporting files
do not enter a pathname, the zipped reports will not be unpacked.
should all be supplied with either your Shape, MID/MIF or TAB files by the
provider of your digital map data.
The field in the chosen digital map file (post_code_sectors.shp) that
In all example Publisher worksheets this is ‘C:\reports’.
Contextual Layers: optionally you can enter the full pathnames to any
contains codes is called ‘PCS_CODE’. The names are stored in the field
contextual layers you wish to include in your reports. For each contextual
called ‘PCS_NAME’.
geography you must supply the following:
The label for the legend shall be ‘Post Code Sectors’.
a. The full pathname for the digital map file (shape file, MID/MIF or
TAB)
Connecting these parameters together using the ‘+’ sign results in:
b. The feature code and name fields in the digital map file
C:\Program Files\GeoWise\InstantAtlas\maps\post_code_sectors.shp+
c.
PCS_CODE+PCS_NAME+Post Code Sectors
The label for the contextual geography that you wish to be
displayed in the Map Layers list of the published reports
If you wish to create reports with more than one base geography layer,
This information should take the form of a semi-colon delimited list. For
please refer to section ‘F.5. Creating Multiple Geography Reports’.
each contextual geography, information should be delimited by a ‘+’ sign.
Data File Folders: Leave this property blank if you wish to create reports
In this example a single contextual layer has been entered as ‘C:\Program
with just one base geography layer. You will only need this property if you
Files\GeoWise\InstantAtlas\maps\post_code_districts.shp+PCD_CODE+P
want to create Multiple Geography Reports using the Batch Publisher.
CD_NAME+Post Code Districts’. The digital map file is an ESRI shape file
Please refer to section ‘F.5. Creating Multiple Geography Reports’.
called ‘post_code_districts.shp’. The feature code and name fields in this
digital map file are called ‘PCD_CODE’ and ‘PCD_NAME’ respectively.
Folder for Zip File: the full pathname for the folder in which you want the
zipped reports to be saved.
In all example Publisher worksheets this is ‘C:\reports’.
The label for the contextual geography that will be displayed in the
published reports is ‘Post Code Districts’.
If you wanted to add a digital map file with Local Authorities as a second
contextual geography, your entry might look like this:
© GeoWise
GeoWise Ltd.
Ltd. 2013
2011
©
Page 121
visualise | communicate | ENGAGE
‘C:\Program
The InstantAtlas Batch Publisher
Files\GeoWise\InstantAtlas\maps\post_code_districts.shp+
g the InstantAtlas Area Profile Template User Guide
Editable Setting
Example
layerBorderWidth
layerBorderWidth=1;1.5;2
PCD_CODE+PCD_NAME+Post code districts; C:\local_authorities.shp+
LA_CODE+LA_NAME+Local Authorities’
Contextual Clip: this field should be set to ‘True’ if you wish to include
only contextual geography features that overlap the base geography. If
you wish to include all contextual geography features you should set this to
‘False’.
Description: A semi-colon delimited list of pixel values for the digital map
layers. The first value defines the border width of the base layer followed
by the border width settings for the contextual layers in the same order as
defined in the ‘Contextual Layer’ property.
layerFillOpacity
Editable Settings Token: This character should be used as a delimiter
between multiple Editable Settings (see next property below).
Description: A semi-colon delimited list of opacity values for the contextual
map layers in the same order as defined in the ‘Contextual Layer’ property.
0 means totally transparent and 1 means totally opaque.
In the example the token is a pipe symbol (‘|’)
layerIconPath
Editable Settings: optionally you can enter a list of editable settings. As a
delimiter you need to use the character defined in the ‘Editable Settings
Description: A semi-colon delimited list of paths to icon files which the
map shall display for contextual point layers instead of the default circle.
To be set in the same order as defined in the ‘Contextual Layer’ property.
Token’ property. In the example workbook the map margin is set to be
reportKeywords
20%, the report title is ‘My Report’, the border width of the base layer is 1px
the contextual layer has a border width of 2px.
This is a list of available editable settings for Flash dynamic reports:
Editable Setting
Example
mapMargin
mapMargin=20%
Description: Sets the distance between the border of the map component
and the base layer.*
reportTitle
reportTitle=My Report
Description: Changes the title of the atlas.html page. The title is displayed
in the title bar of your browser and in the browser tab.
layerIconPath=C:\icon.png
reportKeywords=population
changes, health indicators, crime
incidences, election results
Description: During publishing, these keywords will be saved as a meta
tag in the atlas.hml file. They are helpful if you want your report to be found
by search engines. Ideally you would provide 3-4 keywords about the topic
of your report.
reportDescription
© GeoWise
GeoWise Ltd.
Ltd. 2013
2011
©
layerFillOpacity=0.7;0;1
reportDescription=This is my report
with indicators about population,
health, crime and elections for my
city.
Description: During publishing, this description will be saved as a meta tag
in the atlas.hml file. It is helpful if you want your report to be found by
search engines. Ideally you would provide a description about the topic of
your report with approx. 155 characters.
Page 122
visualise | communicate | ENGAGE
The InstantAtlas Batch Publisher
g the InstantAtlas
Template User
Guide
This is aArea
listProfile
of available
editable
settings for dynamic reports
Editable Setting
Example
contextualLayerFillOpacity
contextualLayerFillOpacity=0;1
published with an HTML template:
Editable Setting
Example
mapMargin
mapMargin=20%
Description: Sets the distance between the border of the map
component and the base layer.*
reportTitle
reportTitle=My Report
Description: Changes the title of the atlas.html page. The title is
displayed in the title bar of your browser and in the browser tab.
layerVisible
layerVisible=true;false;true
Description: A semi-colon delimited list of ‘true’ or ‘false’ values to
set if the map layers are visible in the map by default. The first
value defines the visibility of the base layer followed by the visibility
settings for the contextual layers in the same order as defined in the
‘Contextual Layer’ property.
baseLayerSymbolSize
baseLayerSymbolSize=18
Description: Sets the size of the legend symbols for the base layer.
Does not apply when proportional points or lines are used. Max and
min sizes for proportional symbols can be set in the Designer.
contextualLayerSymbolSize
contextualLayerSymbolSize=12;15
Description: A semi-colon delimited list of pixel values to set the
size of the legend symbols for the contextual layers.
baseLayerFillOpacity
baseLayerFillOpacity=0.7
Description: Sets the opacity for the base layer. 0 means totally
transparent and 1 means totally opaque.
© GeoWise
GeoWise Ltd.
Ltd. 2013
2011
©
Description: A semi-colon delimited list of opacity values for the
contextual map layers in the same order as defined in the
‘Contextual Layer’ property. 0 means totally transparent and 1
means totally opaque.
baseLayerFillColor
baseLayerFillColor=#cccccc
Description: Sets the fill colour in hexadecimal format for the base
layer. This colour appears when a feature is not part of the legend
classification, e.g. when it is not part of an applied filter.
contextualLayerFillColor
contextualLayerFillColor=#ffcc00;#0
000ff
Description: A semi-colon delimited list of fill colours in
hexadecimal format for the contextual map layers in the same order
as defined in the ‘Contextual Layer’ property.
layerBorderThickness
layerBorderThickness=1;1.5;2
Description: A semi-colon delimited list of pixel values for the digital
map layers. The first value defines the border thickness of the base
layer followed by the border thickness settings for the contextual
layers in the same order as defined in the ‘Contextual Layer’
property.
contextualLayerBorderColor
contextualLayerBorderColor=#ffcc00
;#0000ff
Description: A semi-colon delimited list of border colours in
hexadecimal format for the contextual map layers in the same order
as defined in the ‘Contextual Layer’ property.
Page 123
visualise | communicate | ENGAGE
The InstantAtlas Batch Publisher
g the InstantAtlas Area Profile Template User Guide
Editable Setting
Example
Editable Setting
Example
baseLayerBorderColor
baseLayerBorderColor=#000000
baseLayerShowDataTips
baseLayerShowDataTips=true
Description: Sets the border colour in hexadecimal format for the
base layer.
Description: Sets if the base layer features should show data tips
when hovered with the mouse.
layerShowLabels
contextualLayerShowDataTips
layerShowLabels=false;false;true
Description: A semi-colon delimited list of ‘true’ or ‘false’ values to
set if labels should show in the map for the map layer features. The
first value defines the visibility of feature labels for the base layer
followed by the visibility of feature labels for the contextual layers in
the same order as defined in the ‘Contextual Layer’ property.
Description: A semi-colon delimited list of ‘true’ or ‘false’ values to
set if the contextual layer features should show data tips when
hovered with the mouse. To be set in the same order as defined in
the ‘Contextual Layer’ property.
baseLayerShowInLayerList
layerMinLabelExtent
contextualLayerShowDataTips=
true;false
layerMinLabelExtent=0;0;10000
baseLayerShowInLayerList=tru
e
Description: A semi-colon delimited list of minimum label extents in
map units for the map layers. The first value defines the minimum
label extents for the base layer followed by the minimum label
extents for the contextual layers in the same order as defined in the
‘Contextual Layer’ property. For layers which are not supposed to
show labels (layerShowLabels=false), the layerMinLabelExtent
value can be left blank.
Description: Sets if the base layer should appear in the legend.
layerMaxLabelExtent
contextualLayerIconPath
layerMaxLabelExtent=1000000;10
00000;500000
Description: A semi-colon delimited list of maximum label extents in
map units for the map layers. The first value defines the maximum
label extents for the base layer followed by the maximum label
extents for the contextual layers in the same order as defined in the
‘Contextual Layer’ property. For layers which are not supposed to
show labels (layerShowLabels=false), the layerMaxLabelExtent
value can be left blank.
contextualLayerShowInLayerList
contextualLayerShowInLayerLis
t=false;true
Description: A semi-colon delimited list of ‘true’ or ‘false’ values to
set if the contextual layers should appear in the legend. To be set in
the same order as defined in the ‘Contextual Layer’ property.
contextualLayerIconPath=C:\ico
n.png
Description: A semi-colon delimited list of paths to icon files which
the map shall display for contextual point layers instead of the
default circle. To be set in the same order as defined in the
‘Contextual Layer’ property.
* Possible values for map margins are: none, 1%, 2%, 5%, 10%, 20%,
30%, 40%, 50%, 60%, 70%, 80%, 90% and 100%. If you use Google
© GeoWise
GeoWise Ltd.
Ltd. 2013
2011
©
Page 124
visualise | communicate | ENGAGE
Maps as a background layer we suggest you use ‘none’ since the map will
g the InstantAtlas Area Profile Template User Guide
The InstantAtlas Batch Publisher
Raster Layers: Optionally you can enter the full pathnames to any
adjust itself to one of the zoom levels provided by Google maps.
background mapping index files (xml).
The values for the settings in row 19 to 32 are different in each of the four
In the example this is ‘C:\Program Files\GeoWise\InstantAtlas\images
example Publisher worksheets.
\UK_Miniscale_XYZ.xml’.
Background Type: Please specify here the type of background layer you
If you wanted to add a second index file, your entry might look like this:
wish to include into your reports. Valid values are ‘Raster’ (for a raster
background image collection locally saved on your computer or a shared
drive), ‘WMS’ (for a Web Map Service), ‘ArcGIS’ (for an ArcGIS Server/
ArcGIS Online connection) and ‘Google’ (for Google Maps). If you do not
want to include any background mapping, please leave this property and
all following settings blank.
F.2.3.1. Using a Raster Image Collection as a Background Layer
‘C:\Program Files\GeoWise\InstantAtlas\images\UK_Miniscale_XYZ.xml;
C:\Program Files\GeoWise\InstantAtlas\images\os250k.xml’
Raster Copy: This field should be set to ‘True’ if you wish background
mapping images to be copied to the output folders of the published reports.
Note that images files will only be copied over if they are located in the
same folder as the index files. If you do not wish background mapping
images to be copied to the output folders of your published reports, set this
If your Background Type is ‘Raster’, please refer to the worksheet
to ‘False’.
‘Publisher-Raster’ (Figure 149)
Raster Clip: This field should be set to ‘True’ if you wish to display only
Figure 149
background images that overlap the base geography in your published
reports. To display all background images, set this to ‘False’.
F.2.3.2. Using a Web Map Service as a Background Layer
If your Background Type is ‘WMS’, please refer to the worksheet
‘Publisher-WMS’ (Figure 150)
© GeoWise
GeoWise Ltd.
Ltd. 2013
2011
©
Page 125
visualise | communicate | ENGAGE
Figure 150
g the InstantAtlas Area Profile Template User Guide
The InstantAtlas Batch Publisher
WMS you want to use followed by ‘&REQUEST=GetCapabilities’. This will
offer you a file in xml format with the properties of the WMS including
coordinate system, version number, available image formats and available
layers.
ArcGIS/WMS Layers: A comma delimited list of WMS layers you want to
include.
ArcGIS Coordsys/WMS ScsCode: This is the coordinate system of the
WMS. For the WMS from Demis this is ‘EPSG:4326’
WMS OGC Version: The version number of the WMS. For the Demis
ArcGIS/WMS Url: Optionally you can include a Web Map Service as a
background mapping. Therefore type the URL for the WMS into this field.
In the example a connection to the free global WMS from Demis in the
Netherlands is used.
ArcGIS/WMS Name: The name of the WMS layer as it will appear in the
legend of your report. To see this name you will need to disable the ‘Single
WMS this is ‘1.1.1’. This field is mandatory if you want to have the Batch
Publisher re-project your map layers into the WMS projection.
ArcGIS/WMS Parameters: Parameters for image format, background
colour and transparency. The parameter names are ‘format’, ‘bgcolor’ and
‘transparent’ and they must have an ampersand (‘&’) as a prefix.
In the example workbook we have chosen:
Background Mapping Button?’ option in the map properties of the config
file. In the example this is ‘www2.demis.nl’.
‘&format=image/png&bgcolor=0xffffff&transparent=FALSE’
Reproject: For a WMS background to work, all map layers need to be in
In reports published with an HTML template there is no property
‘Single Background Mapping Button?’ in the config.xml file. All
background layers will show with their specific name in the legend.
the same projection as WMS. Set this property to ‘True’ if you wish the
Batch Publisher to re-project your map layers.
If your map layers are
already in the correct projection you should set this property to ‘False’.
Please refer to ‘B.3.5.2 Adding Images from a WMS Connection’ for
If you don’t know the values for the following settings you might want to
important information on the re-projection functionality and its limitations.
request the properties of the WMS with the GetCapabilities request.
Therefore type into the URL field of your internet browser the url of the
© GeoWise
GeoWise Ltd.
Ltd. 2013
2011
©
Page 126
visualise | communicate | ENGAGE
Since the demo map files for Edinburgh post code sectors and districts are
The InstantAtlas Batch Publisher
F.2.3.4. Using Google Maps as a Background Layer
g the InstantAtlas Area Profile Template User Guide
not in the Demis WMS projection, this property is set to ‘True’ in the
If your Background Type is ‘Google’, please refer to the worksheet
example.
‘Publisher-Google’ (Figure 152)
F.2.3.3. Using an ArcGIS Server/ArcGIS Online connection as a
Background Layer
Figure 152
If your Background Type is ‘ArcGIS’, please refer to the worksheet
‘Publisher-ArcGIS’ (Figure 151)
Figure 151
Google Map Type: This is where you can set the default Google Map type
that loads with the report.
Settings include ‘normal’ (for street map),
‘satellite’, ‘hybrid’ or ‘physical’ (for terrain).
The end-user can switch
between these map types via a drop-down list in the map component.
The properties ArcGIS/WMS Url, ArcGIS/WMS Name, ArcGIS/WMS
In the example the hybrid map type is chosen.
Layers, ArcGIS Coordsys/WMS ScsCode, ArcGIS/WMS Parameters and
Reproject should be used respectively as explained for the WMS
Google API Key: To use Google Maps in a Flash dynamic report on a web
background layer.
server, you will need an API Key from Google which is specific to the web
domain.
The example shows the settings for the ArcGIS World Street Map
Please refer to ‘G. Google Maps in InstantAtlas Reports’ for
further information.
connection in the coordinate system Web Mercator Auxiliary Sphere
(102100). This connection contains a single layer which is called ‘0’.
© GeoWise
GeoWise Ltd.
Ltd. 2013
2011
©
Page 127
visualise | communicate | ENGAGE
The InstantAtlas Batch Publisher
Since the demo map files for Edinburgh post code sectors and districts are
g the InstantAtlas
Area an
Profile
Template
User Guide
When using
HTML
template
you
will not need to enter an API
key. However there may be some benefits from using an API key
not in the Google Maps projection, this property is set to ‘True’ in the
example.
such as allowing you to monitor the Maps API usage in your
dynamic report. Please see the following link for further details:
Additional Parameters: This is a place holder for any additional
parameters that you might want to include into your batch reports. Please
https://developers.google.com/maps/documentation/javascript/tutori
leave this blank unless you are told otherwise by your support provider.
al#api_key
F.3. Individual Settings for each Report
Google Layer Name: The name of the Google Maps layer as it will appear
in the legend of your report, provided that the ‘Single Background Mapping
Button?’ option in the map properties of the config file is disabled. In this
example it is called ‘My Google Maps Layer Name’.
It is possible to define individual editable settings for each report created
during the batch publishing process. These settings are defined in the
metadata sheet. For example, if you were creating multiple reports on the
post code sectors of Edinburgh and wished to change the report title of
each individual report to be specific to the generated report then you would
In reports published with an HTML template there is no property
add the following to your metadata sheet (Figure 153)
‘Single Background Mapping Button?’ in the config.xml file. All
background layers will show with their specific name in the legend.
Figure 153
Reproject: For a Google Maps background to work, all map layers need to
be in the same projection as Google Maps. This projection is called Web
Mercator Auxiliary Sphere. If you wish the Batch Publisher to re-project
your map layers for you set this property to ‘True’. If your map layers are
already in the same projection as Google Maps, you should set this
property to ‘False’.
Please refer to ‘G. Google Maps in InstantAtlas
Reports’ for important information on the re-projection functionality and its
limitations.
This will then set each report to have a different title.
It is also possible to use any of the other editable settings defined in the list
of available editable settings for Flash and HTML dynamic reports. If you
wish to find out how to use these then please contact your support
provider.
© GeoWise
GeoWise Ltd.
Ltd. 2013
2011
©
Page 128
visualise | communicate | ENGAGE
F.4. The Publishing Process
g the InstantAtlas Area Profile Template User Guide
The InstantAtlas Batch Publisher
understand how to create such reports with the Desktop Publisher before
reading further.
Once you have edited the above settings and ensured that you have
activated one of the Publisher worksheets by renaming it to ‘Publisher’,
Imagine you wish to create reports with Edinburgh post code districts as
click the ‘InstantAtlas’ menu in Excel and then click ‘Export Data File’.
your first base geography layer, the centroids of the Edinburgh post code
Alternatively click the ‘IA Export’ button in the InstantAtlas toolbar.
sectors as your second base geography layer and a final base geography
layer of the boundaries of the Edinburgh post code sectors. Then you wish
Choose the file type and any output folder and click ‘Save’. Data files will
to create one report for each of the five different parts of Edinburgh:
be created in this folder.
Centre, North, South, East and West.
Multiple instances of the Batch Publisher will open and close automatically
You will need one workbook for each base layer, all of which need to have
as publishing progresses. ZIP Archives (.zip) containing published reports
same split values in the ‘Geographies and Filters’ worksheet. Only the
will be saved in the folder specified for the ‘Folder for Zip File’ setting. The
Excel workbook of the last layer needs a ‘Publisher’ worksheet.
dynamic reports will be unpacked to the folder specified for the ‘Destination
Folder’ setting. Depending on the number of reports you are publishing
and the number of geographic features in each report this process may
take minutes or hours.
For the example with the Edinburgh post code data you will need three
workbooks one with the data for the post code districts, one with the data
for the centroids of the post code sectors and one with the data of the post
code sector boundaries. All of them need to have a ‘split’ column in the
In this example five ZIP archives would be created in a folder called
‘Geographies and Filters’ worksheet with one of the values ‘Edinburgh
‘reports’ on the computer’s C: drive. These would be unpacked to the
Centre’, ‘Edinburgh North’, ‘Edinburgh South’, ‘Edinburgh East’ and
same folder, automatically creating five subfolders with the names
‘Edinburgh West’ assigned to each of the geography features. Only the
corresponding to your split values (the parts of Edinburgh in this example).
last one – the workbook with the data for the post code sector boundaries –
Each subfolder would contain a dynamic report displaying post code
will need a ‘Publisher’ worksheet.
sectors for a part of Edinburgh.
F.5. Creating Multiple Geography Reports
The next step is to export the data of all workbooks using the ‘IA Export’
button of the Excel Data Manager with exception of the workbook for the
last base geography (the one with the Publisher worksheet). Save the
© GeoWise
GeoWise Ltd.
Ltd. 2013
2011
©
It is possible to use the Batch Publisher to create reports with multiple base
resulting split files into separate folders, one for each base layer.
geographies. Please read section ‘H. Multiple Geography Reports’ first to
naming of folders is irrelevant.
The
Page 129
visualise | communicate | ENGAGE
The InstantAtlas Batch Publisher
In the example with the Edinburgh post code data you should export the
g the InstantAtlas Area Profile Template User Guide
In the example with the Edinburgh post code data the ‘Publisher’
workbooks for the first two layers (post code districts and post code sector
worksheet would be part of the workbook which contains the data for the
centroids) into two separate folders.
Edinburgh pot code sector boundaries. The entries for the ‘Base Files’ and
During the export the Excel Data
Manager creates five split data files for each workbook (Figure 154).
‘Data File Folders’ would look like in Figure 155.
Figure 154
Figure 155
If required you may set a border width for your base geography layers or
© GeoWise
GeoWise Ltd.
Ltd. 2013
2011
©
In the workbook of the last base geography layer enter in the ‘Publisher’
contextual layers using ‘layerBorderWidth’ in the ‘Editable Settings’
worksheet under ‘Base File’ a semi-colon delimited list of all base
property. Please note that the values are assigned first in the order of the
geography layers together with their code field, name field and alias. The
base layers and then to the contextual layers in their order.
order needs to be the same as the order you wish to see them in the
example
report.
‘layerBorderWidth=1;2;1;3;2’ would result in the following:
In the ‘Data File Folders’ property enter a semi-colon delimited list of
Post Code Districts
border width of 1px
absolute paths to the folders containing the data split files of all base layers
Post Code Sector Centroids
border width of 2px
besides the last one. The order needs to be the same as for the ‘Base
Post Code Sectors
border width of 1px
Files’.
First contextual layer
border width of 3px
Second contextual layer
border width of 2px
with
the
Edinburgh
post
code
data
a
For the
setting
of
Page 130
visualise | communicate | ENGAGE
The InstantAtlas Batch Publisher
Figure 156
g the InstantAtlas
Areaway,
ProfileifTemplate
Guide
In the same
you areUser
using
an
HTML template you can define
layer specific editable settings for multiple base layers by providing a
semi-colon delimited list of values.
Once all settings are defined you can use the ‘IA Export’ button to start the
batch publishing process.
F.6. How to Debug the Batch Publisher
If the batch publisher is not executing correctly then it is worthwhile
entering the debugging mode.
Enter the following into the Publisher Worksheet (Note these are case
sensitive)
Click ‘IAExport’ and run the batch publisher like normal. This will fill the cell
B36 with a string of text that represents the command line that the Data
cell A35:
debug
Manager is sending to the batch publisher (Figure 157). You will want to
cell B35:
yes
run this in an external DOS window so any error messages can be viewed,
Then type ‘Debug’ into the name box of cell B35.
resolved or if necessary forwarded to your support provider.
cell A36:
commandline
Figure 157
cell B36:
Do not type anything in this cell, leave it blank.
Then type ‘CommandLine’ into the name box of cell B36.
Select this cell (B36), and copy the text to the clipboard (‘Ctrl’ + ’c’).
You should end up with an example looking like the one below
(Figure 156).
Now access a command prompt. In Windows Vista, click the Vista button
and in the search box type ‘cmd’ and hit Enter (Figure 158). Alternatively,
select cmd.exe from the results pane.
© GeoWise
GeoWise Ltd.
Ltd. 2013
2011
©
Page 131
visualise | communicate | ENGAGE
The InstantAtlas Batch Publisher
Figure 158
Figure 161
g the InstantAtlas Area Profile Template User Guide
The error message will now stay in the DOS prompt screen. You can read
this error message and use it to debug the batch publisher, or if required,
copy the message to your support provider. To do this, right click on the
window, select all, and then copy and paste the error message into an
e-mail. Send the error message, along with any comments you may have,
to your support provider.
In Windows XP open the Start menu, click on ‘Run’ (Figure 159) then type
‘cmd’ into the ‘open’ text box and click ‘OK’ (Figure 160).
Figure 159
Figure 160
Click ‘OK’. This will open a DOS Prompt box.
Paste the command line by right clicking and selecting paste. Hit enter to
execute (Figure 161).
© GeoWise
GeoWise Ltd.
Ltd. 2013
2011
©
Page 132
visualise | communicate | ENGAGE
Google Maps in InstantAtlas Reports
g the InstantAtlas Area Profile Template User Guide
G. GOOGLE MAPS IN INSTANTATLAS REPORTS
© GeoWise
GeoWise Ltd.
Ltd. 2013
2011
©
G.1.
About this Section ................................................................................................................ 134
G.2.
Adding Google Maps as a Background Layer ..................................................................... 134
G.3.
Known Issues When Using Google Maps ........................................................................... 136
G.4.
Troubleshooting Hints .......................................................................................................... 137
Page 133
visualise | communicate | ENGAGE
Google Maps in InstantAtlas Reports
G.1. About this Section
g the InstantAtlas Area Profile Template User Guide
When using an HTML template you will not need to enter an API
This section describes how to set up your InstantAtlas dynamic report to
show Google Maps as a background layer. It is assumed that you have
read section B. The InstantAtlas Desktop Publisher prior to reading this
section.
key. However there may be some benefits from using an API key
such as allowing you to monitor the Maps API usage in your
dynamic report. Please see the following link for further details:
https://developers.google.com/maps/documentation/javascript/tutori
To use Google Maps in a report on a web server, you will need an API
al#api_key
(Application Programming Interface) Key from Google which is specific to
the web domain. For local use you do not need an API key.
GeoWise is not able to offer advice on copyright issues or the legality
As of February 2012 Google stopped issuing new keys for the
Flash Maps API. This means Google maps will be unavailable for
of presenting your own data over a Google Maps background. Your API
key is for your organisation and is not related to GeoWise in any way.
use as a background layer for those users who do not already have
Section ‘G.4. Troubleshooting Hints’ gives useful trouble shooting tips and
an API key. GeoWise are investigating alternative APIs and hope to
solution if needed.
make Google mapping available again in a future version.
In the
meantime you should use alternative sources of background
mapping.
G.2. Adding Google Maps as a Background Layer
Please talk to the support team if you require further
advice.
When publishing a dynamic report the InstantAtlas Publisher will give the
option to add background layers to the map(s) of you report. One source
For users who already have an API key but want to move their report
from where you can get background images from is Google Maps
to a new website Google will potentially provide you with a new key.
(Figure 162).
Details can be found on this forum entry:
http://groups.google.com/group/google-maps-api-forflash/browse_thread/thread/80743abcb597fe80
© GeoWise
GeoWise Ltd.
Ltd. 2013
2011
©
Page 134
visualise | communicate | ENGAGE
Figure 162
Google Maps in InstantAtlas Reports
Figure 163
g the InstantAtlas Area Profile Template User Guide
The Publisher will automatically re-project all base and contextual layers
you have uploaded for your report into the geographic coordinate system
‘WGS 1984 Web Mercator (Auxiliary Sphere)’ to match the Google Maps
projection.
It is vital that you consider the following points:
Once you have added the Google Maps Layer, you will be prompted to
This re-projection only works if the Publisher knows the coordinate
enter an API Key. Please read the note in the previous section. For local
system of your map files. If you are using ESRI shapefiles that
use you do not need an API key, simply type any character into the API
include a .prj file, the Publisher can pick up the coordinate system
Key field.
information out of this file. If your shapefile does not have a .prj file
or if you are working with MapInfo MID/MIF or TAB files, you will
Select from the ‘Map Type’ drop down list the Google Maps layer you wish
need to select the appropriate coordinate system from the Layer
to see by default when you open your report or toggle on the background
Properties in the ‘Coord System’ tab.
layer. The end-user will be able to change the Google Maps layer they see
project these map layers before using them in InstantAtlas.
Alternatively you can re-
through a drop down list in the map (Figure 163).
© GeoWise
GeoWise Ltd.
Ltd. 2013
2011
©
Page 135
visualise | communicate | ENGAGE
Google Maps in InstantAtlas Reports
The re-projection will only work if your map file(s) are in one of the
g the InstantAtlas Area Profile Template User Guide
amount of Google Maps background shown around the Base
Geography, you can change the size of the Map component using
following supported coordinate systems:
o
Un-projected coordinate systems (e.g. latitude/longitude)
o
Coordinate systems that use a Transverse Mercator
projection (e.g. British National Grid, UTM zones)
o
Global coordinate systems using a Mercator projection.
o
Lambert Conformal Conic projection
the Designer.
2. Animated map zooms are not supported for the reason given
above
3. World maps will not work when Antarctica is included. In the Web
Mercator projection the north and south poles cannot be projected.
For this reason reports published with a world map where
If your map layers are already in the correct projection, click on the
Antarctica is included will malfunction when using Google Maps.
‘Advanced’ button and select the option ‘Do not re-project any layers’ in the
4. In Flash dynamic reports, exporting the full report or just the Map
drop down list (Figure 164).
component will not work when the report is located on a web
server. It works correctly from a local or share drive.
Figure 164
5. In Flash dynamic reports, printing the full report or just the Map
component with the ‘Rescale to fit page’ option will not work when
the report is located on a web server. It works correctly from a
local or share drive.
6. In Flash dynamic reports, printing the full report or just the Map
component with the ‘Resize to fit page’ option will cause the map
layer(s) to print with an offset to the Google maps background.
This becomes more apparent when the printer has to resize the
G.3. Known Issues When Using Google Maps
report, e.g. printing the report in portrait layout will produce a
bigger offset between the map layer(s) and Google Maps than
There are a number of issues you should consider when using Google
printing the report in landscape. When using the ‘Hybrid’ mode of
Google Maps, only the ‘Street Map’ elements (lines and labels for
Maps background mapping:
roads etc.) will be printed.
1. When your report loads, the map will be adjusted to one of 18
Google Maps zoom levels. This means that your base geography
may not fill the map area in the same way as it would if you were
not using Google Maps background mapping.
© GeoWise
GeoWise Ltd.
Ltd. 2013
2011
©
To adjust the
Page 136
visualise | communicate | ENGAGE
G.4. Troubleshooting Hints
g the InstantAtlas Area Profile Template User Guide
Google Maps in InstantAtlas Reports
that you are using ESRI shapefiles for all your base and contextual
layers. The re-projection will not work for MapInfo MID/MIF or TAB
The following hints might help you to find a solution, when you cannot get
files.
You will need to re-project MapInfo files outside of
Google Maps to work correctly in your report:
InstantAtlas into ‘WGS 1984 Web Mercator (Auxiliary Sphere)’
before you can use them together with Google Maps in
3. Google Maps appear but your other map layer(s) are not in the
InstantAtlas.
right location (they might appear somewhere near the west coast of
Africa) (Figure 165).
that you have a correct .prj file for each shapefile you use. This file
describes the projection of the shapefile. The information in the
Figure 165
.prj file has to match the projection the shapefile is actually in.
It is not enough to take any .prj file and rename it to match the
shapefile name!
You can however, copy a .prj file from another shapefile and
rename it accordingly when you are sure that both shapefiles are
in the same projection.
If you do not have a .prj file, one way to create one it to load the
shapefile into ESRI ArcMap and export it again.
During the
exporting process a .prj files gets created.
that your shapefile is in one of the supported projections:
o
Un-projected coordinate systems (e.g. latitude/longitude)
o
Coordinate systems that use a Transverse Mercator
projection (e.g. British National Grid, UTM zones)
The reason for this is that the re-projection was not successful. Please
check:
© GeoWise
GeoWise Ltd.
Ltd. 2013
2011
©
o
Global coordinate systems using a Mercator projection
Page 137
visualise | communicate | ENGAGE
Shapefiles in other projections cannot be re-projected by the
g the InstantAtlas Area Profile Template User Guide
Google Maps in InstantAtlas Reports
The reason for this is most likely a Flash Player Security issue that can
InstantAtlas Publisher. You will need to re-project them outside of
occur when viewing the report on a local or shared drive. To solve it
InstantAtlas first (e.g. using ESRI ArcGIS) before you can use
please do the following:
them together with Google Maps in a dynamic report.
that the ‘Re-project all layers to match Google Maps’ option is
Hold your mouse pointer over the report and right click until the
Flash plug-in menu appears.
selected in the Publisher when you click the ‘Advanced’ button of
the Google Maps background layer.
Click ‘Global Settings...’. Depending on your Flash Player version
one of the following two steps will apply:
4. In Flash reports: The map stays empty except for a grey rectangle
(Figure 166)
a) If a pop-up dialog appears, click on the ‘Advanced’ tab. You may
then need to scroll down a bit to find the ‘Trusted Location
Settings…’ button. Click on it to open another dialog. Then click
Figure 166
the ‘Add…’ button.
b) If a new browser window opens, click the ‘Global Security Settings
panel’ link in the menu on the left. After a brief delay, the Global
Security Settings panel will appear in the browser. Activate the
‘Always allow’ option. From the ‘Edit locations’ drop down list
select ‘Add location’.
Click ‘Add Folder…’, browse to the drive (or folder) where your
report is saved and click ‘OK’. The location will be added to the list
of trusted locations.
Close the browser or the dialog windows with the Flash Player
settings and restart your InstantAtlas report.
If this doesn’t solve the issue, open the Flash Player settings again
and check that the drive or folder really was added to the trusted
© GeoWise
GeoWise Ltd.
Ltd. 2013
2011
©
Page 138
visualise | communicate | ENGAGE
Google Maps in InstantAtlas Reports
locations. Sometimes these settings do not get saved properly and the
g the InstantAtlas Area Profile Template User Guide
steps need to be repeated.
You may need to add the location you are running the report from
to your Flash Player trusted sites. Please see the steps in the
previous section on how to do this.
Please note that this issue does not usually affect reports published on
the Internet.
5. In Flash reports: The report does not load at all.
You get a
message like shown below
Figure 167
There are a few likely reasons for this error:
You do not have Adobe Flash Player Version 9 or higher on your
computer.
You
can
download
the
latest
version
here:
http://get.adobe.com/flashplayer/
If a popup blocker bar has appeared at the top of your browser you
need to click this and allow active content (it is possible to edit your
browser settings to turn this bar off)
© GeoWise
GeoWise Ltd.
Ltd. 2013
2011
©
Ensure your browser security settings allow active content
Page 139
visualise | communicate | ENGAGE
Multiple Geography Reports
g the InstantAtlas Area Profile Template User Guide
H. MULTIPLE GEOGRAPHY REPORTS
© GeoWise
GeoWise Ltd.
Ltd. 2013
2011
©
H.1.
About this Section ................................................................................................................ 141
H.2.
Publishing a Multiple Geography Report ............................................................................. 142
H.3.
Creating the Data Files ........................................................................................................ 143
Page 140
visualise | communicate | ENGAGE
Multiple Geography Reports
H.1. About this Section
g the InstantAtlas Area Profile Template User Guide
This section describes how to publish and populate a multiple geography
InstantAtlas dynamic report.
It is assumed that the reader has prior
The HTML templates allowing up to 10 different base geographies
are: Single Map, Population Pyramid, Double Map, Area Profile,
Election Results, Scatter Plot and Advanced Bubble Plot.
knowledge of how to use the InstantAtlas Publisher and how to create data
files with the Excel Data Manager. If you need information on these topics
The Double Map Time Series template allows you to have two different
please refer to section ‘B. The InstantAtlas Desktop Publisher’ and section
base geographies in the two maps (
‘E. The InstantAtlas Excel Data Manager’.
Figure 169), or the same geography in both maps.
As of InstantAtlas version 6.1 it is possible to publish InstantAtlas reports
that thematically map data for multiple base geographies. It is possible to
Figure 169
view data for the different base geographies without having to reload the
whole dynamic report.
The Single Map, Double Map, Area Profile, Election Results and Bubble
Plot templates allow you to have up to ten different base geographies.
However, you can only display one at a time and you switch between them
using a ‘Geography’ drop down menu (Figure 168).
Figure 168
The Double Base Layer Template is a variant of the Double Map Time
Series Template and allows you to see two base geographies together in
one map (Figure 170).
© GeoWise
GeoWise Ltd.
Ltd. 2013
2011
©
Page 141
visualise | communicate | ENGAGE
Multiple Geography Reports
Figure 170
Figure 171
g the InstantAtlas Area Profile Template User Guide
A section to choose an additional base geography will appear. For all
templates except the Double Map Time Series and the Double Base Layer
templates you can add up to 10 base geographies. Make sure that you
add them vertically in the same order as you would like them to appear in
the ‘Geography’ menu of your report. Figure 172 shows an example with
three different base geographies.
Note that currently if showing multiple geographies in a report, these
Make sure that geographic feature
codes are unique across all of the base geographies included.
must overlap (i.e. have approximately the same geographic extent). For
example, publishing a report to show regions and districts in England is
acceptable. Publishing a report to show regions in England and regions in
France is not (as these geographies do not overlap).
H.2. Publishing a Multiple Geography Report
Start the InstantAtlas Publisher.
On the ‘Choose a Template’ screen
choose one of the templates mentioned above.
Click ‘Next’.
On the
‘Choose Your Base Geography’ screen browse to the digital map file which
you would like to see as your first base geography. This is the geography
that will be displayed on opening the report. Then click the ‘Add’ Button in
the bottom right corner of the screen (Figure 171).
© GeoWise
GeoWise Ltd.
Ltd. 2013
2011
©
Page 142
visualise | communicate | ENGAGE
Figure 172
g the InstantAtlas Area Profile Template User Guide
Multiple Geography Reports
For the Double Base Layer template you can also only add a maximum of
two base geographies. If you are wanting to map points over polygons
please ensure you are adding the polygon layer first and the point layer
second as otherwise the points will be hidden behind the polygons in the
final map.
Once you have added the base geography layers you want to use in your
report, click ‘Next’. If you have already created a data XML file then you
can upload it on the ‘Choose your data’ screen (creation of this file is
described below). Alternatively, select the option to ‘Create a demo data
file’ and click ‘Next’.
Then follow the Publisher wizard through the
remaining steps of the publishing process.
Note that any contextual
geographies and background mapping layers you choose will be available
for all the base geographies you have included – they are not base
geography specific.
H.3. Creating the Data Files
This section describes the process for generating data files for a multiple
geography report. We recommend that you manage the indicator data for
each base geography in a separate Excel workbook. You will then export
the data from each workbook separately and merge. You can have the
same or different data sets for each geography. If you have the same data
sets then the data selection will be preserved when you change
For the Double Map Time Series template two base geographies is the
maximum. The upper geography will show in the top map and the lower
geography, if you do not have the same data set then there will be a
mismatch between which data is selected when you change geography.
geography will show in the bottom map.
© GeoWise
GeoWise Ltd.
Ltd. 2013
2011
©
Page 143
visualise | communicate | ENGAGE
Note that
theProfile
geography
given
g the InstantAtlas
Area
Templatenames
User Guide
Multiple Geography Reports
in cell B2 of the Geography and
Filters worksheet must be unique, e.g. each base geography needs a
unique name.
The next step is to merge these files into a single data.xml / data.js file.
The Excel Data Manager add-in provides an ‘IA Merge Files’ button for this
(Figure 173).
Figure 173
If the areas in your geographies nest, you may wish include filters that
reflect this nesting. In this way, geographies lower in the hierarchy can be
filtered according to which area in a higher geography they nest within. For
example in a report with Edinburgh post code districts and post code
sectors it makes sense to include a Districts filter in the post code sectors
workbook. A filter that is available at multiple geographies will stay applied
Click this button. The ‘Select files to be appended’ dialog allows you to
as you switch between these geographies.
browse to the folder containing your data files. Select the files by clicking
and holding down the ‘Shift’ or ‘Ctrl’ keys on your keyboard. Then click
If you want the map palettes to vary based on the visible base
‘Open’ (Figure 174).
geography and its associated data, please see section ‘E.6.2.3. Setting
Custom Legends’ in the Excel Data Manager area above, or section 3.8.2
of the Access Data Manager User Guide.
In the normal way, export a data file from each workbook separately. It is
imperative that the data files for the geographies are named in a way that
matches their order on the ‘Choose Your Base Geography’ screen of the
Publisher.
We recommend you name them ‘data1.xml’, ‘data2.xml’,
‘data3.xml’,… where ‘data1.xml’ is the XML file for the uppermost
geography, ‘data2.xml’ is for the next one down and so on.
If you are publishing a report using an HTML template, you need to
export the data files into JSON format and chose respective naming
(‘data1.js’, ‘data2.js’, ‘data3.js’,…).
© GeoWise
GeoWise Ltd.
Ltd. 2013
2011
©
Page 144
visualise | communicate | ENGAGE
Multiple Geography Reports
Figure 174
g the InstantAtlas Area Profile Template User Guide
The files will be appended in the order they are named (alphanumeric) and,
as mentioned above, this must match the order of the geographies on the
‘Choose Your Base Geography’ screen of the Publisher.
The Excel Data Manager will ask you to save the merged data.xml / data.js
file. Browse to the folder containing your report and overwrite the existing
data.xml / data.js file. Start the report (double click the atlas.html file) to
view the result.
© GeoWise
GeoWise Ltd.
Ltd. 2013
2011
©
Page 145
visualise | communicate | ENGAGE
The InstantAtlas Area Profile Template
g the InstantAtlas Area Profile Template User Guide
I. THE INSTANTATLAS AREA PROFILE TEMPLATE
I.1.
About this Section ................................................................................................................ 147
I.2.
Area Profile – Spine Chart ................................................................................................... 147
I.2.1.
Configuration ................................................................................................................ 147
I.2.2.
Data Preparation .......................................................................................................... 149
I.3.
I.3.1.
Configuration ................................................................................................................ 150
I.3.2.
Data Preparation .......................................................................................................... 150
I.4.
Radar Chart ......................................................................................................................... 151
I.4.1.
Configuration ................................................................................................................ 151
I.4.2.
Data Preparation .......................................................................................................... 152
I.5.
© GeoWise
GeoWise Ltd.
Ltd. 2013
2011
©
Performance Results ........................................................................................................... 150
Making the Chart Read Dataplus XML Files ....................................................................... 152
Page 146
visualise | communicate | ENGAGE
The InstantAtlas Area Profile Template
whether indicator values for the selected area(s) are above/below a given
I.1. About this Section
g the InstantAtlas Area Profile Template User Guide
comparator. If you publish this with a demonstration data file the report will
This section describes the use of the InstantAtlas Area Profile template
look like that in Figure 175.
from version 6.3 onwards. This template is very flexible and is therefore
deserving of a dedicated section in this user guide. It is assumed that you
Figure 175
have already read section ‘B. The InstantAtlas Desktop Publisher’, section
‘C. The InstantAtlas Designer’ and section ‘E. The InstantAtlas Excel Data
Manager’.
When publishing using this template the ‘Choose Settings For Your
Dynamic Report’ of the Publisher offers different configuration options.
You should choose the one that suits the style of presentation you wish to
create.
These configuration options are described in the following
sections.
As a default setting two of the three Area Profile configurations use
associate columns to fill the main chart.
Also you will need specific
settings in the data file when populating a Performance Results report. For
these reasons it is not recommended to choose the ‘Create data file from
digital map data’ option in the ‘Choose Your Data’ screen in the Publisher.
This functionality is limited to the creation of basic data files which will in
most cases not be suitable for this advanced template.
You can alter this configuration once you have published a report by
opening the config.xml file using the Designer. There are many properties
for the spine chart that can be changed to further tailor the
appearance/functionality. You can move your mouse pointer over property
names in the Designer to see a description. If you are not sure what a
I.2. Area Profile – Spine Chart
particular property is used for please contact the GeoWise Support team
I.2.1. Configuration
It is possible to show a variable number of columns in the spine chart and
using the details in the final section of this guide.
each one can be configured separately. The properties that can be set for
With this configuration the main chart is configured to be a spine chart.
each column are described below:
This has a central spine and horizontal bars to either side of this that show
© GeoWise
GeoWise Ltd.
Ltd. 2013
2011
©
Page 147
visualise | communicate | ENGAGE
The InstantAtlas Area Profile Template
Alias – the heading displayed for the column.
g the InstantAtlas Area Profile Template User Guide
If you are publishing a report using an HTML template, you can also
Width – this will be the width of the column as a percentage of the whole
define the alignment of the symbol using ‘symbolAlign:{right, left,
chart.
centre}, for example:
Name – this will define the data source for the column. If the column
symbol(symbolValue:state,textValue:value,symbolAli
should display indicator values (i.e. thematically mapped values) the value
gn:right)
should be ‘value’. If the column should display associate values, the Name
should be the name of the associate exactly as in the XML data file(s) for
your dynamic report (e.g. ‘diff’ or ‘baseline’).
or
symbol(symbolValue:trend,symbolAlign:center)
If you wish to show symbols, stand alone, in a column you will need to
define the Name as ‘symbol(symbolValue:associate name)’ where
By default, the name of a selected map feature will be shown in the legend
associate name refers to the name exactly as in the XML data file(s) for
at the bottom of the spine chart. If you would prefer to see the feature
your dynamic report (e.g. ‘trend’ or ‘state’).
You can define the actual
name in a column in the spine chart you will need to add another row to the
symbols for the values in the properties section of the Spine Chart
Data Columns section in the Designer and type into the Name column
Properties.
‘name’.
If you wish to show symbols and text within the same column you will need
You may then want to disable the property called ‘Display
Selected Area Legend’.
to define the Name as:
In the HTML template, by default the name of a selected map
symbol(symbolValue:associate name,textValue:value)
Note that “associate name” refers to the name exactly as in the XML data
feature will be displayed in the separate selected features legend
component.
file(s) for your dynamic report (e.g. ‘trend’ or ‘state’). The “value” refers to
either the indicator value or if you would like it to show the symbol with the
Having multiple time periods for each indicator is optional. If you do have
text of an associate value you should change “value” to the associate
multiple time periods, we recommend you only show the most recent in the
name exactly as in the XML data file(s) for your dynamic report (e.g. ‘trend’
spine chart (to avoid ending up with too many rows in the chart). The spine
or ‘state’).
chart is by default set up to only show the latest dates of your data. If you
want to change this setting, you can do that by enabling the property called
© GeoWise
GeoWise Ltd.
Ltd. 2013
2011
©
Page 148
visualise | communicate | ENGAGE
‘Include Dates?’. You might then want to see the time periods displayed in
g the InstantAtlas Area Profile Template User Guide
the spine chart.
You can either change the column with the Name
The InstantAtlas Area Profile Template
The required data structure is shown in the worksheet called ‘iadatasheet’
and is shown in Figure 176.
‘indicatorName’ to ‘indicatorDateName’ to see both the indicator name and
the time periods together in one column. Alternatively you can include a
Figure 176
column with the Name ‘date’ to see only the time periods in a column of the
spine chart.
By default, the HTML version of the Area Profile template opens up
showing the indicators of the selected date. You can change this to
display either the most resent date of each indicator (irrespective of
the selected date) or all dates. The Spine Chart property for this is
called ‘Display Indicators For’. You can choose whether or not the
time periods should be displayed in brackets behind this indicator
names by using the property ‘Display Dates in Profile’.
Target data (in the Properties section of the Spine Chart Properties) – this
will generally be ‘target’. If you have an associate called ‘target’ in the XML
data file(s) for your dynamic report the associate values will be used to
draw vertical bars denoting the target an area should achieve.
By default, the horizontal bars in the spine chart are configured to use an
associate called ‘diff’. Although these values can represent anything you
like we recommend that they are the percentage difference between the
indicator value for the base geography area and the indicator value for the
comparator. The comparator can be anything you like but is typically a
I.2.2. Data Preparation
national or regional average - it must be the same for all base geography
areas.
An example of how you should prepare your data is provided in the Excel
workbook called IAworkbookAreaProfile_SpineChart.xls. This is located in
the ‘workbooks’ folder of your InstantAtlas software. The default location
for this is:
In the example above (fictional data), the ‘diff’ values for each indicator are
the percentage difference between the Edinburgh post code sectors values
and the Scotland value. In this case Scotland would be the comparator.
The percentage difference can be calculated in the following way:
C:\Program Files\GeoWise\InstantAtlas\workbooks.
100 * ((base area indicator value – comparator value) / comparator value)
© GeoWise
GeoWise Ltd.
Ltd. 2013
2011
©
Page 149
visualise | communicate | ENGAGE
The InstantAtlas Area Profile Template
This will give you positive difference values where the base area value is
Figure 177
g the InstantAtlas Area Profile Template User Guide
higher than the comparator value and negative difference values where the
base area value is lower than the comparator value.
The ‘target’ associate is optional. If you include target values these will be
shown as little vertical markers superimposed on the horizontal bars.
These will show whether the target for a particular indicator has been
reached or not. If you do not include the ‘target’ associate, these markers
will not show.
In addition to ‘diff’ and ‘target’ associates you can include any others
associates described in section ‘E. The InstantAtlas Excel Data Manager’,
sub-section ‘E.5.2. Entering Associate Values’ (e.g. ‘ll’, ‘ul’ or ‘count’) or
your own custom associates.
Again, you can alter this configuration once you have published a report by
I.3. Performance Results
opening the config.xml file using the Designer. For example, you might
decide to remove the baseline column or to change the symbols that are
I.3.1. Configuration
displayed alongside the indicator values.
Please see section ‘I.2. Area
Profile – Spine Chart’, sub-section ‘I.2.1. Configuration’ for detailed
With this configuration the spine chart works slightly differently.
Each
information.
indicator value is represented using a horizontal bar that is superimposed
upon reversible shaded ranges. Each indicator can operate on a different
scale in the bars column.
I.3.2. Data Preparation
This chart is well suited to displaying
performance indicators but can also be applied more widely to other data.
For each indicator you include in your report you should provide the
If you publish this with a demonstration data file the report will look like that
following associates in the XML data file(s):
in Figure 177.
target – target values shown as text in the ‘Target’ column and as vertical
bars in the ‘Performance’ column of the chart
© GeoWise
GeoWise Ltd.
Ltd. 2013
2011
©
Page 150
visualise | communicate | ENGAGE
baseline – baseline values shown as text in the ‘Baseline’ column of the
The InstantAtlas Area Profile Template
Figure 179
g the InstantAtlas Area Profile Template User Guide
chart
trend – values shown as symbols in the ‘Trend’ column of the chart
state – values shown as symbols in the ‘Value’ column of the chart
The required data structure is shown in the ‘iadatasheet’ worksheet of the
workbook called IAworkbookAreaProfile_Performance.xls. This is also in
the ‘workbooks’ folder of your InstantAtlas installation.
Use the ‘breaks’ element to specify break values for each indicator. These
must be separated by semicolons and will define the number and size of
Figure 178
the ranges shown in the chart. The break values can be different for each
indicator but the number of breaks must be the same. If you wish to flip the
ranges for a particular indicator, set the ‘breaksFlip’ element to be TRUE.
I.4. Radar Chart
I.4.1. Configuration
With this configuration, data is displayed in a radar chart that shows all
indicators for all themes. The scale is the same for all indicators, with low
values plotted near the centre of the radar and high values plotted near the
edge.
For any particular area, the indicator values are joined by a
continuous line. The shape created by this line allows you to visualise how
For the shaded ranges to display in the ‘Performance’ column you must
an area scores across a range of indicators and how this area compares to
define break values (that indicate where each range starts and stops).
others (Figure 180). By default, you can select up to five areas – these are
These must be provided in the ‘Metadata’ worksheet of your Excel
listed in a key below the radar chart.
workbook. Please refer to the ‘Metadata’ worksheet in the example Excel
workbook IAworkbookAreaProfile_Performance.xls (Figure 179).
© GeoWise
GeoWise Ltd.
Ltd. 2013
2011
©
Page 151
visualise | communicate | ENGAGE
g the InstantAtlas
AreaChart
Profile Template
User Guide
The Radar
configuration
is not
The InstantAtlas Area Profile Template
yet available as an HTML
Edition.
I.5. Making the Chart Read Dataplus XML Files
By default, all of the components in your report will read their data from a
data.xml file (or a data.xml file with supporting theme files). However, you
Figure 180
have the option of making the spine/performance/radar chart read data
from a separate set of XML data files – one for each base geography area.
The main advantage is to increase the performance (speed) of your report.
The report will not need to load all data XML files “up front”. The spine
chart data only gets loaded (one area at a time) when you select an area
following the initial load. The initial load of the report will therefore be
quicker. This performance gain is only likely to be apparent if there are
relatively large numbers of areas (e.g. >200) and/or indicators (e.g. >50).
Creating Dataplus data files is currently not possible with the HTML
Edition.
If you wish to implement this, you will need to configure the spine/
performance/radar chart in your report to read data from dataplus files.
As before, you can alter this configuration once you have published a
report by opening the config.xml file using the Designer. For example, you
might decide to vary the total number of selected areas labelled in the
radar chart or change the colours shown in the chart.
I.4.2. Data Preparation
Open the config.xml file for the report, open the properties for the chart and
ensure that the ‘Use Dataplus files?’ checkbox is ticked.
Then add a split column to the Geography and Filters worksheet of your
Excel workbook. The split value for each base geography feature must be
the code of the feature (Figure 181).
Preparation of data for this configuration requires only indicators and their
values. By default the radar chart does not display any associate values.
© GeoWise
GeoWise Ltd.
Ltd. 2013
2011
©
Page 152
visualise | communicate | ENGAGE
Figure 181
The InstantAtlas Area Profile Template
Figure 182
g the InstantAtlas Area Profile Template User Guide
If you want to use dataplus files for a report containing comparison
geographies, you will need to ensure that dataplus files will be generated
by the Data Manager for the comparison geographies. To do this, remove
the hash symbol (#) from the beginning of each comparison geography
codes in all of the worksheets. In the Geography and Filters worksheet,
copy and paste the comparison geography codes from Column A into the
split column, Column D.
When you export, the Excel Data Manager will generate a separate
dataplus XML file for each area in the base geography. These will be
named dataplus_{feature code}.xml. Note that only these files need to
contain the associates used by the spine chart (e.g. baseline, trend, state,
Use the Excel Data Manager add-in to export the XML data files to the
etc). The data.xml (and supporting theme files) that are used by the other
report folder. In the ‘Save As’ dialog you must change the file name to
components does not necessarily need to include these associates.
‘dataplus.xml’ (Figure 182).
© GeoWise
GeoWise Ltd.
Ltd. 2013
2011
©
Page 153
visualise | communicate | ENGAGE
The InstantAtlas Bubble Plot Template
g the InstantAtlas Area Profile Template User Guide
J. THE INSTANTATLAS BUBBLE PLOT TEMPLATE
© GeoWise
GeoWise Ltd.
Ltd. 2013
2011
©
J.1.
About this Section ................................................................................................................ 155
J.2.
Bubble Plot - Advanced ....................................................................................................... 156
J.3.
Bubble Plot - Simple ............................................................................................................ 157
J.4.
Scatter Plot .......................................................................................................................... 158
J.5.
Funnel Plot ........................................................................................................................... 159
Page 154
visualise | communicate | ENGAGE
J.1. About this Section
g the InstantAtlas Area Profile Template User Guide
The InstantAtlas Bubble Plot Template
The Bubble Plot Family within the HTML templates is comprised of
two templates: the Scatter Plot template and the Advanced Bubble
This section describes the use of the InstantAtlas Bubble Plot template.
This template is highly flexible and is therefore deserving of a dedicated
section in this user guide. It is assumed that you have already read section
‘B. The InstantAtlas Desktop Publisher’, section ‘C. The InstantAtlas
Designer’ and section ‘E. The InstantAtlas Excel Data Manager’.
When publishing using this template the ‘Choose Settings For Your
Dynamic Report’ of the Publisher offers different configuration options.
Plot template. The table below shows equivalent functionality
between the different Flash Bubble Plot configurations and the two
HTML templates in the Bubble Plot family:
Flash Bubble Plot
configuration
HTML template / configuration with
equivalent functionality
Bubble – Advanced
Advanced Bubble Plot template: IA6 Standard
configuration
Bubble – Simple
Scatter Plot template: IA6 Standard Bubble
Plot configuration
Scatter Plot
Scatter Plot template: IA6 Scatter Plot
configuration *
Funnel Plot
Scatter Plot template: IA6 Funnel Plot
configuration
You should choose the one that suits the style of presentation you wish to
create.
Bubble – Advanced: for plotting up to four indicators simultaneously
where the end-user can change each indicator independently.
Bubble – Simple: for plotting up to four indicators simultaneously where
the end-user can only change a single indicator and those shown in the
other dimensions are pre-defined by the administrator.
* The data sources for the axis are different between Flash and
HTML scatter plot reports – please see section ‘J.4 Scatter Plot’ for
Scatter Plot: for plotting two indicators simultaneously (standard bi-variate
detailed information.
scatter plot).
The
following
sections
describing
the
Flash
Bubble
Plot
Funnel Plot: for plotting two indicators simultaneously with superimposed
configurations also apply to the HTML equivalents unless specifically
confidence limits around a regional/national comparator.
stated in a green box like this one.
These are described in more detail in the follow sections.
© GeoWise
GeoWise Ltd.
Ltd. 2013
2011
©
Page 155
visualise | communicate | ENGAGE
J.2. Bubble Plot - Advanced
g the InstantAtlas Area Profile Template User Guide
The InstantAtlas Bubble Plot Template
There are four buttons for changing data: the indicator shown in the map
(this also controls the colour of bubbles in the chart), the indicator shown
There are two Bubble Plot configurations: Simple and Advanced. These
on the X axis, the indicator shown on the Y axis and the indicator that
have been named with end-users in mind. The Advanced configuration is
controls the size of the bubbles.
so-called because it requires end-users to select up to four separate
indicators for the chart (x axis, y axis, bubble size, bubble colour). These
indicators can be changed independently by the end-user and you should
therefore only choose this configuration if you wish to give them a high
level of freedom for data exploration.
When using this configuration you may want to define certain minimum and
maximum axes values for the bubble plot component. You can define
these settings on an indicator or theme basis in the ‘Metadata’ worksheet
of your Excel workbook (or in the table ‘tblMetadata’ if you are working with
the Access Data Manager). The settings are the same that you would use
If you publish this configuration with a demonstration data file the report will
to fix the bar chart and/or time series chart (‘minChartValue’ and
look like that in Figure 183.
‘maxChartValue’).
Please see section ‘E.6.2.4. Setting the Chart Axis
Minimum and Maximum’ for further information.
Figure 183
While this configuration is advanced from the end-user point of view, it is
very simple from the point of view of the person creating the report. This is
because this configuration does not require any associates to be provided
in the data file(s).
Note that if you only want end-users to be able to plot three indicators
simultaneously, you can remove the ‘Size’ button by editing the
configuration file (config.xml) of the report using the Designer.
© GeoWise
GeoWise Ltd.
Ltd. 2013
2011
©
Page 156
visualise | communicate | ENGAGE
The InstantAtlas Bubble Plot Template
Figure 184
g the InstantAtlas
Area Profile
Template
Guide
The Advanced
Bubble
PlotUser
(HTML
Edition) template contains two
configuration options: IA6 Synchronised Dates and IA6 Standard.
Within the IA6 Standard configuration the different Data Explorers
are completely independent from each other whereas in the IA6
Synchronised Dates configuration the time periods are synchronised
meaning all four variables will always show the same time period.
The dates are not included in the Data Explorers but can be
accessed
through
the
Time
Animation
component.
This
configuration is only sensible if all available indicators contain the
same dates.
J.3. Bubble Plot - Simple
The Simple configuration is so-called because end-users are only required
to select a single indicator, the indicator shown in the map. The position
There is only one ‘Data’ button for changing the indicator in the map – the
and size of bubbles shown in the chart are pre-defined by the administrator
bubbles will change position and size automatically.
and cannot be changed independently.
This gives the end-user less
freedom but makes the report easier to use.
While this configuration is simple from the end-user point of view, it is more
involved from the point of view of the person creating the report. This is
If you publish this configuration with a demonstration data file the report will
because for each indicator you must supply a minimum of two associates
look like that in Figure 184.
in the data file(s):
xValue – the X axis values for the bubbles
yValue – the Y axis values for the bubbles
You will also have to supply a third associate if you wish the bubbles to
have different sizes:
© GeoWise
GeoWise Ltd.
Ltd. 2013
2011
©
Page 157
visualise | communicate | ENGAGE
sizeValue – the values that will control the radius of the bubbles
g the InstantAtlas Area Profile Template User Guide
The InstantAtlas Bubble Plot Template
This is located in the ‘workbooks’ folder of your InstantAtlas software. The
default location for this is:
These associate names are defined in the configuration file of the report. It
is possible to use different associate names by editing the properties of the
C:\Program Files\GeoWise\InstantAtlas\workbooks.
Bubble Plot component using the Designer. However, as these associate
names are not displayed in the report this is usually not necessary.
You can see that each indicator date is accompanied by the three
associates listed above (Figure 185).
When using this configuration you may want to define certain minimum and
maximum axes values for the bubble plot component. This is done in the
Figure 185
Metadata settings of your Data Manager (Excel or Access) and can be
defined on an indicator or theme basis. Please see section ‘E.6.2. Adding
Indicator Display Metadata’ for detailed information on how to define
metadata settings.
The MetadataElement commands required are as
follows:
minChartValueX – sets the minimum X axis value of the Bubble Plot
component
maxChartValueX – sets the maximum X axis value of the Bubble Plot
component
minChartValueY – sets the minimum Y axis value of the Bubble Plot
component
You can specify the labels that will appear on the X and Y axes by using
the Designer to open the report’s configuration file and editing the
maxChartValueY – sets the maximum Y axis value of the Bubble Plot
properties of the Bubble Plot component.
component
J.4. Scatter Plot
An example of how you should prepare your data is provided in the Excel
workbook called IAworkbookBubblePlot_Simple.xls.
With this configuration the chart is a normal bi-variate scatter plot. The
points in the chart are all the same size. The colour can be linked to the
© GeoWise
GeoWise Ltd.
Ltd. 2013
2011
©
Page 158
visualise | communicate | ENGAGE
The InstantAtlas Bubble Plot Template
legend classes or can be the same for all points. If you publish this with a
g the InstantAtlas Area Profile Template User Guide
demonstration data file the report will look like that in Figure 186.
The IA6 Scatter Plot configuration of the HTML Scatter Plot template
uses associates called ‘xValue’ and ‘yValue’ as data sources for the
scatter plot axis.
In the HTML templates the colours of the points/bubbles will always
be linked to the legend classes.
If you wish to give the end-user the ability to select indicators to be
used for the scatter plot axis you need to publish a report using the
Figure 186
Advanced Bubble Plot template and delete the value of the ‘Bubble
Size Data’ property in the Designer. You can also enable the display
of a correlation line in the Bubble Plot properties if you wish.
J.5. Funnel Plot
Funnel plots are scatter plots upon which confidence limits have been
superimposed.
These confidence limits are plotted for a regional or
national average. The limits enable you to see which observations are
significantly different from the regional/national average. The confidence
limits form a funnel shape because these decrease as sample/population
sizes shown on the X axis increase.
If you publish this with a demonstration data file the report will look like that
in Figure 187.
A report published with the Scatter Plot configuration doesn’t require any
associates to be included in the data file(s).
© GeoWise
GeoWise Ltd.
Ltd. 2013
2011
©
Page 159
visualise | communicate | ENGAGE
The InstantAtlas Bubble Plot Template
Figure 187
show Standardised Mortality Ratios (SMRs) on the Y axis and the
g the InstantAtlas Area Profile Template User Guide
expected number of deaths on the X axis.
The required data structure is shown in the ‘iadatasheet’ worksheet of the
workbook called IAworkbookBubblePlot_FunnelPlot_Flash.xls. This is also
in the ‘workbooks’ folder of your InstantAtlas installation.
Figure 188
The regional/national average is shown as a horizontal green line across
the chart. The yellow and red curves are the upper and lower 95% and
99% confidence limits plotted for the regional/national average. Points that
lie above/below the upper/lower curves are significantly different from the
regional/national average.
Points that lie within the funnel are not
significantly different from the regional/national average.
There is only one ‘Data’ button and this is used by the end-user to change
The IA6 Funnel Plot configuration of the HTML Scatter Plot template
uses associates called ‘xValue’ and ‘yValue’ as data sources for the
funnel plot axis.
the indicator values in the map. The indicator values shown in the map are
also plotted on the Y axis of the chart. The X axis values must be supplied
A workbook called IAworkbookBubblePlot_FunnelPlot_HTML.xls is
as an associate:
provided as an example within the ‘workbooks’ folder of your
FUNNELX – the X axis values for the chart.
InstantAtlas installation.
Typically, these are
sample/population sizes. In public health for example, it is common to
© GeoWise
GeoWise Ltd.
Ltd. 2013
2011
©
Page 160
visualise | communicate | ENGAGE
For every indicator, you must also supply values for six properties in the
g the InstantAtlas Area Profile Template User Guide
The InstantAtlas Bubble Plot Template
The delimiter in the arrays depends whether Excel is using points or
XML data file(s) for your report. In your Excel workbook, you add these
commas as decimal separators. If the decimal separator is a point, the
into the Metadata worksheet.
delimiter in the arrays must be a comma. If the decimal separator is a
comma (e.g. if the regional setting of your operating system is French,
The first property defines the average for the region or nation:
NATIONALAVERAGE – the regional/national average
The remaining five properties are used to plot the confidence limits:
LIMITEXPECTED – an array of the X axis values used to plot the
confidence limits.
Spanish or German) the delimiter in the arrays must be a semi-colon.
Refer to the ‘Metadata’ worksheet in the Excel workbook called
IAworkbookBubblePlot_FunnelPlot_Flash.xls.
Figure 189
These should be the sample/population size the
confidence limits have been calculated for.
LIMITLOWER95 – an array of the 95% lower confidence limits calculated
for the regional/national average based on the sample/population sizes in
the LIMITEXPECTED array.
LIMITUPPER95 – an array of the 95% upper confidence limits calculated
for the regional/national average based on the sample/population sizes in
the LIMITEXPECTED array.
LIMITLOWER99 – an array of the 99% lower confidence limits calculated
for the regional/national average based on the sample/population sizes in
the LIMITEXPECTED array.
LIMITUPPER99 – an array of the 99% upper confidence limits calculated
for the regional/national average based on the sample/population sizes in
the LIMITEXPECTED array.
An easy way of creating and entering an array is described below. In this
example commas are used as delimiters.
Start with a column in a new Excel workbook that contains the numbers for
the array. The values 1, 2, 3… displayed in the screenshot below are
example values only. In reality, these will be the actual values that you
wish to use to plot the confidence limits.
© GeoWise
GeoWise Ltd.
Ltd. 2013
2011
©
Page 161
visualise | communicate | ENGAGE
Figure 190
g the InstantAtlas Area Profile Template User Guide
The InstantAtlas Bubble Plot Template
Copy the formula in cell B2 down until you reach the last value in column
A. You can do this by clicking in cell B2 and double clicking the handle to
the bottom right of the cell border.
Figure 192
Your worksheet should now similar to that shown below.
Figure 193
In cell B1 type =A1
In cell B2 type =CONCATENATE(B1,",",A2)
Figure 191
© GeoWise
GeoWise Ltd.
Ltd. 2013
2011
©
Page 162
visualise | communicate | ENGAGE
The InstantAtlas Bubble Plot Template
Copy the value in the bottommost cell in column B into your clipboard.
g the InstantAtlas Area Profile Template User Guide
In the Metadata worksheet of your Excel Data Manager, right click in cell
that will contain the array and choose ‘Paste Special...’. The dialog shown
below will appear.
Figure 194
Click the ‘Values’ radio button and click ‘OK’.
If you need the array delimiter to be a semi-colon rather than a comma
your formula in cell B2 will be =CONCATENATE(B1,";",A2)
© GeoWise
GeoWise Ltd.
Ltd. 2013
2011
©
Page 163
visualise | communicate | ENGAGE
The InstantAtlas Election Template
g the InstantAtlas Area Profile Template User Guide
K. THE INSTANTATLAS ELECTION TEMPLATE
K.1.
About this Section ................................................................................................................ 165
K.2.
The Election Results Template ............................................................................................ 165
K.3.
Data Preparation .................................................................................................................. 166
K.3.1.
K.3.1.1.
Theme 1, Indicator 1 ............................................................................................ 166
K.3.1.2.
Theme 1, Indicators 2-6 ....................................................................................... 167
K.3.2.
K.4.
© GeoWise
GeoWise Ltd.
Ltd. 2013
2011
©
Theme 1 ....................................................................................................................... 166
Theme 2 ....................................................................................................................... 167
Configuration ........................................................................................................................ 167
Page 164
visualise | communicate | ENGAGE
The InstantAtlas Election Template
Overall results are contained in the Comparison Table at the upper right of
K.1. About this Section
g the InstantAtlas Area Profile Template User Guide
the report, while each area and its winning party are listed in the Table at
This section describes how to set up and create reports using the
the bottom left. The Spine Chart on the right contains both electoral area
InstantAtlas Election Results template.
details and breakdowns of election data. End-users click on the map to
It is assumed that you have
already read section ‘B. The InstantAtlas Desktop Publisher’, section
populate the Spine Chart with data.
‘C. The InstantAtlas Designer’ and section ‘E. The InstantAtlas Excel Data
Manager’.
The default layout of an Election Results (HTML Edition) template
(Figure 196) is very similar to the Flash equivalent with the exception that
K.2. The Election Results Template
the Table with results by area can be toggled over the Map using a
button.
The Election Results template enables you to map interactively the results
of elections based on winning parties.
If you publish with the
Figure 196
demonstration data file, when the map is clicked, election data appears in
three areas, as shown in Figure 183 below.
Figure 195
© GeoWise
GeoWise Ltd.
Ltd. 2013
2011
©
Page 165
visualise | communicate | ENGAGE
The InstantAtlas Election Template
It is named ‘Electoral Area Details’ in the example workbook, as shown in
K.3. Data Preparation
g the InstantAtlas Area Profile Template User Guide
Figure 198 below.
The required data structure is represented in Figure 197 below, and an
example workbook containing fictitious election results has been included
in
the
‘iadatasheet’
worksheet
IAworkbookElectionResults.xls.
of
the
workbook
Figure 198
named
This file is found in the ‘workbooks’
subfolder of your installation folder of InstantAtlas.
Figure 197
K.3.1.1. Theme 1, Indicator 1
This indicator (row 2, merged across Column C to F) contains data
The data in the iadatasheet of the example workbook provided is divided
into two themes containing a number of indicators and associates. These
are discussed below in detail, in reference to the example workbook, to
help you create your own election results workbook.
K.3.1. Theme 1
This theme (row 1, merged across Column C to K) contains a number of
populating three areas of the report: the ‘Winning Party’ shown in the first
theme of the Spine Chart; the winning parties shown in the Table below the
Map; and all of the Comparison Table at the top-right of the report. This
indicator is named ‘Winning Party’ in the example workbook.
The indicator type is designated ‘categoric’ in cell C4, and associates are
assigned in cell D5 as ‘seats’, in cell E5 as ‘voteCount’, and in cell F5 as
‘votePercent’.
indicators that contain all data except for the breakdown of election results.
© GeoWise
GeoWise Ltd.
Ltd. 2013
2011
©
Page 166
visualise | communicate | ENGAGE
For the ‘Winning Party’ and ‘Name’ lines of the first theme of the Spine
g the InstantAtlas Area Profile Template User Guide
The InstantAtlas Election Template
Stars have been added to winning candidates’ names and associate
Chart and all of the data shown in the Table below the Map, displayed
values for ‘Votes’, ‘Party’ and ‘Percentage of Vote’ have been included, as
values are taken from text entered in Column C. Note that no associate
shown in Figure 199 below.
values are displayed for those two areas.
Figure 199
The Comparison Table data is set up slightly differently. Comparison data
codes are entered in Column A but preceded with hash symbols, as shown
in cells A80-A86 in Figure 198 above. Enter each party name as it will
appear in the Comparison Table of the report in Column B, next to its code.
Note that no indicator value is given in column C. Instead, the data for the
Comparison Table is taken from the associate columns (D to F).
Accordingly, the total won seats are given as values in column D, the
numbers of votes are given in column E, and the percentages of votes won
are given in column F.
K.3.1.2. Theme 1, Indicators 2-6
Cells G2, H2, I2, J2, and K2 contain indicators 2-6 of Theme 1. These
indicators have been assigned as ‘Name’, ‘Eligible Voters’, ‘Total Votes’,
‘Turnout %’, and ‘Seats’ in the example workbook. This data is displayed
in the first theme of the Spine Chart.
K.4. Configuration
K.3.2. Theme 2
The config.xml file of the Election results (Flash Edition) template is very
similar to the Area Profile – Spine Chart configuration of the Area Profile
The second theme is the breakdown of an election. This theme provides
template. In fact it would be possible to create the one out of the other by
the data shown in the second theme of the Spine Chart.
simply deleting some components and changing a few properties.
The indicator type is categoric and the value is the name of a candidate.
Election Results reports do not have a data button as it is not intended to
The number of indicators in this theme depends on the maximum number
change the map to show any other indicators except the Winning Party.
of candidates that stood for an election in the area(s) displayed in the Map.
© GeoWise
GeoWise Ltd.
Ltd. 2013
2011
©
Page 167
visualise | communicate | ENGAGE
The InstantAtlas Election Template
The Map, Table and Spine Chart have been configured to only allow the
g the InstantAtlas Area Profile Template User Guide
selection of one single area whereas none of the entries in the Comparison
Table can be selected
In the Election Results (HTML Edition), instead of showing small circles
with the party colours for each candidate in the Spine Chart, the
horizontal bars themselves are coloured according to the value of the
In the Spine Chart the horizontal bars show the values of the associate
‘party’ associate. The property for this is called ‘Use Data For Bar Colour’
‘percentage of vote’ using a range between 0 and 100.
and its value has to match exactly the name of the party associate. The
colours for the parties have to be defined using the Symbol properties of
The ‘Party’ column has been defined to show a small circle in the colour of
the Spine Chart.
the party together with the party name. The code in the ‘Name’ column is
by default:
If you do not wish to colour the bars differently according to the party of
the candidate, simply delete the value of the ‘Use Data For Bar Colour’
symbol(symbolValue:party,textValue:party)
property. The property ‘Bar Colour’ will then set the colour for all bars.
Please refer to section ‘I.2. Area Profile – Spine Chart’ for information on
In the ‘Data Columns’ section of the Spine Chart Properties the column
how to define these symbols in the Spine Chart.
labelled ‘Percentage of Vote’ (which is the column containing the
horizontal bars) has ‘election’ in the ‘Name’ column. Compared to the
column name ‘profile’ of the IA6 Area Profile – Spine Chart configuration
the name ‘election’ omits the scale labels in the column header.
Additionally to the above differences between the IA6 Area Profile - Spine
Chart configuration and the Election Results template there are some
Spine Chart properties not included in the Election template as they do
not apply considering the require data structure. Therefore it is not
possible to create an Election results configuration out of the IA6 Area
Profile – Spine Chart configuration like it is the case for the Flash
templates.
© GeoWise
GeoWise Ltd.
Ltd. 2013
2011
©
Page 168
visualise | communicate | ENGAGE
The InstantAtlas HTML Profile Template
g the InstantAtlas Area Profile Template User Guide
L.THE INSTANTATLAS HTML PROFILE TEMPLATE
L.1.
About this Section ................................................................................................................ 170
L.2.
Publishing an HTML Profile Report ..................................................................................... 170
L.2.1.
Data Preparation .......................................................................................................... 170
L.2.2.
Configuration ................................................................................................................ 171
L.2.3.
Editing Styles ............................................................................................................... 173
L.3.
© GeoWise
GeoWise Ltd.
Ltd. 2013
2011
©
The Different Pages of an HTML Profile Report .................................................................. 174
L.3.1.
Home Page .................................................................................................................. 174
L.3.2.
Area Index Page .......................................................................................................... 175
L.3.3.
Profile Page ................................................................................................................. 175
L.3.4.
Data Index Page .......................................................................................................... 176
L.3.5.
Theme Page ................................................................................................................ 176
L.3.6.
Indicator Page .............................................................................................................. 177
L.3.7.
Time Period Page ........................................................................................................ 177
Page 169
visualise | communicate | ENGAGE
The InstantAtlas HTML Profile Template
L.1. About this Section
Please note that the InstantAtlas Publisher will not create demo data
g the InstantAtlas Area Profile Template User Guide
for this template and the data cannot be changed after the publishing
This section describes the use of the InstantAtlas HTML Profile template.
process is finished. Also, the ‘Create data file from digital map data’ option
This template allows you to create a set of linked HTML pages that provide
in the ‘Choose Your Data’ screen in the Publisher cannot be used for this
a clear, accessible view of your data at different levels (theme, indicator,
template.
geography feature) without Flash content.
HTML Profile reports can display:
It is assumed that you have already read section ‘B. The InstantAtlas
Desktop Publisher’, section ‘D. The InstantAtlas Style Editor’ and section
1. Themes
‘E. The InstantAtlas Excel Data Manager’.
2. Indicators
3. Time Periods
L.2. Publishing an HTML Profile Report
4. Associates
5. Metatext
L.2.1. Data Preparation
6. Filters (as grouping options in the area index page)
Before you can publish an HTML Profile report you need to have your data
You must upload your data XML file into the ‘Choose Your Data’ screen of
in InstantAtlas XML format (i.e. the same format as used by the Flash
the Publisher (Figure 200).
templates).
You can use either the Excel or Access Data Manager of
InstantAtlas to structure and export your data in the same way as for the
other templates.
Figure 200
Please see section ‘E. The InstantAtlas Excel Data
Manager’ or the Access Data Manager user guide for further information.
There are no special associates required. For an example Excel workbook
suitable for use in the HTML Profile Template, please refer to the Excel
workbook in your Start Menu under ‘InstantAtlas Desktop Edition’.
For the report to display your data in tables, it is necessary that you
have the same table structure within one theme.
In other words all
indicators of the same theme need to have the same associates.
© GeoWise
GeoWise Ltd.
Ltd. 2013
2011
©
Page 170
visualise | communicate | ENGAGE
L.2.2. Configuration
The InstantAtlas HTML Profile Template
Figure 201
g the InstantAtlas Area Profile Template User Guide
All configuration for this template is done during the publishing process on
the ‘Choose Settings For Your Dynamic Report’ screen (Figure 201). After
the report is published, it is not possible to change these settings (other
than by manually editing HTML).
If you hold your mouse pointer over the property names you will see a
description for each property.
Most of the properties are self-explanatory - the less obvious examples are
explained below:
Header File and Footer File
You have the option to include a header and footer for the profile pages.
For example you might want to include your website banner as a header.
© GeoWise
GeoWise Ltd.
Ltd. 2013
2011
©
Page 171
visualise | communicate | ENGAGE
The file you upload must be in XHTML format. This is stricter and cleaner
The InstantAtlas HTML Profile Template
Include Indicator Selection?
g the InstantAtlas Area Profile Template User Guide
version of HTML – please see the following link for more information:
The indicator selector is a drop down list which allows you to view data for
http://www.w3schools.com/html/html_xhtml.asp.
a selected theme/indicator/time period for all geographic features
(Figure 203).
Please also note that the header and footer files do not need the usual
HTML structure tags <html>, <head> and<body> as those will already be
Figure 203
provided by the template. You will need to enclose your XHTML code in a
<div>, so that you have one <div> for the header and one <div> for the
footer in two different files.
Include Area Profile Selection?
The profile selector is a drop down list which allows you to switch to the
profile page to a different geographic feature (Figure 202).
Figure 202
Include Group Selection?
If your data contains one or more filters you may wish to include the group
selector. This is a drop down list in the area index page which allows the
end-user to display the list of geographic features grouped by the filter
values of the selected filter (Figure 204).
© GeoWise
GeoWise Ltd.
Ltd. 2013
2011
©
Page 172
visualise | communicate | ENGAGE
Figure 204
g the InstantAtlas Area Profile Template User Guide
The InstantAtlas HTML Profile Template
The Publisher will automatically transform your base layer(s) into
latitude/longitude so that Google can re-project it to ‘WGS 1984 Web
Mercator (Auxiliary Sphere)’ to match the Google Maps projection. This
transformation only works with ESRI shapefiles. If you are using MapInfo
Include Navigation Bar?
TAB files or MID/MIF files you will need to transform these map layers
outside of InstantAtlas. Your shapefiles must have a .prj file. If this file is
The navigation bar is displayed at the very top of all HTML pages showing
the location of the current page in the system of linked HTML pages
(Figure 205).
Figure 205
missing the Publisher will not be able to transform your map layers.
Supported coordinate systems are coordinate systems that use a
Transverse Mercator projection (e.g. British National Grid, UTM zones) and
global coordinate systems using a Mercator projection.
L.2.3. Editing Styles
Include Hyperlink To An Atlas?
If you have created a dynamic report as an alternative view to the HTML
Profile report you can include a hyperlink into the geographic feature profile
pages to open the dynamic report.
The styles for the profile pages are stored in a cascading style sheet called
default.css as for InstantAtlas Flash reports. You will find this file in the
output folder for the HTML Profile report. You can open this file using the
InstantAtlas Style Editor and change styles in the same way as for Flash
reports (Figure 206).
Include Map? and Google Maps Key
You can include a map into the HTML Profile pages showing the
geographic feature superimposed on a Google Maps background.
For Google Maps to work on a web server, you will need to provide an API
(Application Programming Interface) Key. Please read the note in section
G. Google Maps in InstantAtlas Reports. For use on a local drive you do
not need an API key - simply type any character into the API Key field.
© GeoWise
GeoWise Ltd.
Ltd. 2013
2011
©
Page 173
visualise | communicate | ENGAGE
Figure 206
g the InstantAtlas Area Profile Template User Guide
The InstantAtlas HTML Profile Template
L.3. The Different Pages of an HTML Profile Report
L.3.1. Home Page
The set of HTML pages that make up a HTML Profile report include a
home page which opens when you double click the atlas.html file in the
report folder (Figure 207). It displays the name of each base geography
feature you have included into your report. Clicking on one of the feature
names will open the area index page (Figure 208).
You may decide it is not worth using the home page in which case you
can link directly to the area index page or the data index page.
Figure 207
© GeoWise
GeoWise Ltd.
Ltd. 2013
2011
©
Page 174
visualise | communicate | ENGAGE
The InstantAtlas HTML Profile Template
L.3.2. Area Index Page
L.3.3. Profile Page
The area index page lists all geographic features for the selected base
The profile pages display all data for the selected geographic feature and
geography (Figure 208).
optionally comparison areas.
g the InstantAtlas Area Profile Template User Guide
They can also include a map with the
selected feature superimposed over a Google Maps background. If the
Figure 208
profile selector and the indicator selector are included, they will show on
these pages to allow the user to link to other pages in the report. Also, if a
hyperlink to a dynamic report is included, it will appear here (Figure 209).
Figure 209
If the group selector is included, the end-user will be able to select a filter
out of the drop down list to group the geographic features into the filter
values of the selected filter. Clicking on an area name opens the profile
page for this geographic feature.
© GeoWise
GeoWise Ltd.
Ltd. 2013
2011
©
Page 175
visualise | communicate | ENGAGE
The InstantAtlas HTML Profile Template
L.3.4. Data Index Page
L.3.5. Theme Page
The data index page cannot be accessed via a link from another page. It is
The theme page lists all indicator values for all time periods for the
created during the publishing process and displays all themes, indicators
selected theme. It includes a table for comparison areas and a table with
and time periods for a base geography (Figure 210).
the data for all base geography features (Figure 211).
The name of the file is similar to the name for the area index page but you
Figure 211
g the InstantAtlas Area Profile Template User Guide
need to replace the ‘areaindex’ in the file name with ‘dataindex’.
For example:
URL to area index page: .../report_Nottinghamshire_Wards_areaindex.html
URL to data index page: .../report_Nottinghamshire_Wards_dataindex.html
If you want to link from the home page to the data index page rather than
to the area index page you simply need to change the link by manually
editing the atlas.html page.
Figure 210
Clicking on the name of a theme, indicator or time period in the data index
page will open the relevant theme, indicator or time period page.
© GeoWise
GeoWise Ltd.
Ltd. 2013
2011
©
Page 176
visualise | communicate | ENGAGE
L.3.6. Indicator Page
L.3.7. Time Period Page
The indicator page lists the indicator values for all time periods for the
The time period page lists the indicator values and associate values for the
selected indicator. It includes a table for comparison areas and a table
selected indicator and time period. It includes a table for comparison areas
with the data for all base geography features (Figure 212).
and a table with the data for all base geography features (Figure 213).
Figure 212
Figure 213
g the InstantAtlas Area Profile Template User Guide
© GeoWise
GeoWise Ltd.
Ltd. 2013
2011
©
The InstantAtlas HTML Profile Template
Page 177
visualise | communicate | ENGAGE
The InstantAtlas ArcGIS Online Templates
g the InstantAtlas Area Profile Template User Guide
M. THE INSTANTATLAS ARCGIS ONLINE TEMPLATES
M.1.
About this Section ................................................................................................................ 179
M.2.
Publishing an ArcGIS Online Dynamic Report .................................................................... 179
M.2.1.
Selecting Items from ArcGIS Online ............................................................................ 179
M.2.2.
Layer Properties ........................................................................................................... 181
M.2.3.
Data Preparation .......................................................................................................... 183
M.2.4.
Finalising the Report .................................................................................................... 184
M.2.5.
The ‘Create Web Application’ Dialog ........................................................................... 185
M.2.6.
Additional Options on the last Publisher Screen ......................................................... 186
M.2.7.
Opening an Existing Web Application .......................................................................... 187
M.3.
© GeoWise
GeoWise Ltd.
Ltd. 2013
2011
©
Editing an ArcGIS Online Dynamic Report using the Designer and Style Editor ................ 187
M.3.1.
Opening an ArcGIS Online Application ........................................................................ 187
M.3.2.
Designing the ArcGIS Online Dynamic Report ............................................................ 188
M.3.3.
Styling the ArcGIS Online Dynamic Report ................................................................. 188
M.3.4.
Saving changes back to ArcGIS Online ....................................................................... 188
Page 178
visualise | communicate | ENGAGE
M.1. About this Section
g the InstantAtlas Area Profile Template User Guide
The InstantAtlas ArcGIS Online Templates
After choosing one of the ArcGIS Online templates and clicking ‘Next’ in
the Publisher, you will be asked to sign in to your ArcGIS Online account
This section describes the use of the InstantAtlas ArcGIS Online templates.
(Figure 214).
The ArcGIS Online templates are HTML Edition templates which allow you
Figure 214
to build dynamic reports based on ArcGIS Online content. The final report
automatically gets uploaded into your ArcGIS Online account and is then
hosted there as a Web Application where you can control who can access
it. Any changes made to the data sources will automatically and instantly
be visible in your ArcGIS Online dynamic report.
For more information about ArcGIS Online please refer to:
http://www.esri.com/software/arcgis/arcgisonline
It is assumed that you have already read section ‘B. The InstantAtlas
Desktop Publisher’, section ‘C. The InstantAtlas Designer’ and section
‘E. The InstantAtlas Excel Data Manager’.
M.2.1. Selecting Items from ArcGIS Online
For your map layers (base and contextual geographies as well as
background layers) you can choose ‘items’ from ArcGIS Online. It is not
M.2. Publishing an ArcGIS Online Dynamic Report
possible to use digital map files saved locally on your computer or on a
network drive when publishing a report with the ArcGIS Online templates.
You can choose an ArcGIS Online template from the drop down list in the
Also you cannot use map services from any other sources as background
Publisher. The currently available ArcGIS Online templates are:
layers except for those available within ArcGIS Online (and only those
supported by InstantAtlas).
1.
ArcGIS Online – Single Map (HTML Edition)
2.
ArcGIS Online – Double Map (HTML Edition)
When you add a new base geography, contextual geography or
3.
ArcGIS Online – Area Profile (HTML Edition)
background layer, the ‘Choose ArcGIS Online Data…’ dialog will appear
(Figure 215). This dialog works in a similar way to the file explorer on your
operating system.
© GeoWise
GeoWise Ltd.
Ltd. 2013
2011
©
Page 179
visualise | communicate | ENGAGE
Figure 215
The InstantAtlas ArcGIS Online Templates
My Organisation
g the InstantAtlas Area Profile Template User Guide
If you have an organisational account the folder ‘My Organisation’ contains
all items of users that belong to your organisation.
Favourites
The Favourites folder contains all items you have added to your favourites.
You can add an item to your favourites by right-clicking on the item and
selecting ‘Add to Favourites’. If the item shows a preview image, a yellow
star icon will appear on the image once you added it to the favourites. To
remove an item from your favourites, right-click on the item and select
‘Delete Favourite’.
Recent
The ‘Recent’ folder contains all recently used items.
The left hand side of the window displays a list of available folders. On
clicking a folder the main pane on the right hand side is then populated
with the contents of that folder. The different folders are described below.
At the top of the dialog you can filter the items by type:
My Items
Maps – lists Web Maps. This option is available for base geography,
In the ‘My Items’ folder you can access your own items. If your items are
contextual geography and background layers.
organised in custom folders within ArcGIS Online you will see those folder
Feature – lists Feature Services. This option is available for base
as subfolders within the ‘My Items’ directory.
geography and contextual geography layers.
Public Items
Data – lists CSV items. This option is available when adding further
The ‘Public Items’ folder contains all items that were made publically
attribute data to build the data model for the ArcGIS Online dynamic report.
Please refer to section ‘M.2.3. Data Preparation’.
available by other users of ArcGIS Online.
© GeoWise
GeoWise Ltd.
Ltd. 2013
2011
©
Page 180
visualise | communicate | ENGAGE
Apps – lists Web Mapping Applications. This option is available when
g the InstantAtlas Area Profile Template User Guide
opening an existing ArcGIS Online dynamic report through the ‘File’ menu
The InstantAtlas ArcGIS Online Templates
You can select an item by clicking on it so that it becomes highlighted and
then press the ‘Choose’ button.
of the Publisher. Please refer to section ‘M.2.7. Opening an Existing Web
Application’.
All – lists all items of the supported types.
The ‘Search’ and the ‘Sort’ functions can also be used to find the items you
wish to use.
Please note that it is not possible to add a Web Map that only contains
raster images at the ‘Choose Your Base Geography’ step of the Publisher.
Also, it is not possible to add a Feature Service that does not contain any
attribute data.
M.2.2. Layer Properties
The resulting items will be displayed in main pane of this dialog. If there are
more than 15 items in the list, the Publisher will show them on several
pages. The ‘Next>’ and ‘<Back’ buttons can be used to navigate between
The layer properties of each map layer can be opened by clicking on the
‘Properties’ button (Figure 216).
the pages.
A right-click on an item will cause a context menu to appear. The top option
‘Details’ opens a new browser window or tab with the details page of this
item. The second and third options in the context menu allow you do add
items to your favourites or to remove them from your favourites. Items
added to your favourites will appear in the ‘Favourites’ folder which can be
selected from the left-hand side pane. The fourth option of the context
menu allows you to filter the items further by the owner of the item that you
have clicked on.
When choosing your base layer you can either select a Feature Service
which would add a single base layer to the Publisher or you could choose a
Web Map which may include multiple layers. Depending on how the
selected Web Map is configured, these layers will automatically be added
to the Publisher as either base geographies, contextual geographies or – in
case of raster images - background layers.
© GeoWise
GeoWise Ltd.
Ltd. 2013
2011
©
Page 181
visualise | communicate | ENGAGE
Figure 216
The InstantAtlas ArcGIS Online Templates
Figure 217
g the InstantAtlas Area Profile Template User Guide
If you do not want to apply a filter i.e. you wish to see all features in the
‘Selection’ tab of the layer properties dialog you should select the option
‘No Filter – show all features’ This option is selected by default.
If you wish to apply a filter to reduce the amount of features shown in the
‘Selection’ tab of the layer properties dialog you should select the option
‘Use Filter – only show features when’. Then select the attribute field you
wish to base your filter on from the drop down list on the left. The drop
The tabs ‘Settings’ and ‘Selection’ for base and contextual layers work in
down list in the middle provides a number of operators which are explained
the same way as for templates used to create stand-alone dynamic
in the table below:
reports. Please see sections ‘B.3.2.2. Layer Properties of Base Geography
© GeoWise
GeoWise Ltd.
Ltd. 2013
2011
©
Layers’ or ‘B.3.4.2. Layer Properties of Contextual Geography Layers’ for
Operator
For … attribute fields
Description
further information. Additionally, the ‘Selection’ tab includes a filter function
=
numeric
‘equal to’
which allows you to filter the features of this layer depending on the
<>
numeric
‘not equal to’
attribute values. Clicking on the ‘Filter’ button opens a new dialog (Figure
>
numeric
‘greater than’
217).
>=
numeric
‘greater than or equal to’
<
numeric
‘less than’
Page 182
visualise | communicate | ENGAGE
The InstantAtlas ArcGIS Online Templates
<=
numeric
‘less than or equal to’
contains
numeric or textual
‘contains’
starts with
numeric or textual
‘starts with’
ends with
numeric or textual
‘ends with’
g the InstantAtlas Area Profile Template User Guide
Figure 218
In the text field on the right type the filter value. Then click ‘OK’ to apply the
filter.
When using ArcGIS Online templates the layer properties of base and
contextual layers do not contain the tabs ‘Coord. System’ and ‘Encoding’
as they do not apply.
The third tab of the layer properties of a base geography layer allows you
to create the data model out of the attribute data of this layer. Please refer
to the next section ‘M.2.3. Data Preparation’ for further information.
M.2.3. Data Preparation
The data for an ArcGIS Online dynamic report is built out of the attribute
data of the base geography layer(s) and/or further data in CSV format.
CSV files first need to be uploaded to ArcGIS Online to be able to use the
containing data in an ArcGIS Online dynamic report.
Please note that it is not possible to publish an ArcGIS Online dynamic
report with demo data or to upload a data.xml file into the Publisher.
© GeoWise
GeoWise Ltd.
Ltd. 2013
2011
©
This dialog works in the same way as the ‘Organise Data’ dialog that
appears when you select the option ‘Create a data file from digital map
To build the data model for your base geography layer, open the layer
data’ for non-ArcGIS Online templates. Please refer to section ‘B.3.3.3.
properties by clicking the ’Properties’ button and then choose the ‘Data
Create a Data File from a Digital Map File’ for information on how to build a
Model’ tab (Figure 218).
data model.
Page 183
visualise | communicate | ENGAGE
The InstantAtlas ArcGIS Online Templates
For ArcGIS Online templates you do have the option to add data from a
g the InstantAtlas Area Profile Template User Guide
CSV file into your data model. To add a CSV file, click the green
button
would like to use for the report. Please refer to section ‘I. The InstantAtlas
Area Profile Template’ for further information on the different configuration
on the bottom left corner of the ‘Data Model’ tab.
options and the required data structure for each of them.
You can now choose one of the CSV files on ArcGIS Online to add to your
You can also adjust the map margin on the ‘Advanced’ tab.
data. You will be asked to select a column from within the CSV file that
matches the values of the feature code field you chose for the base
geography layer. If such a column does not exist you will not be able to use
this CSV file in the data model for the selected layer.
Once you are happy with the settings click the ‘Publish’ button. The last
screen of the Publisher will now give you the option to create a new Web
Application on ArcGIS Online or to save (or update) an existing Web
Application (Figure 219). The latter option is only available if you:
The Publisher will validate that the selected column matches the codes of
the base geography layer. If it does, the columns of the CSV file will be
1.
the ‘File’ menu, or
added to the left hand side list of available data fields. They can now be
used in the same way as if the columns from the CSV file were attribute
fields of the base geography.
If the Publisher detects a partial match between the code field selected
from the CSV file and the feature code filed of the base geography layer it
will give a warning and inform you on how the non-matching features/rows
have opened an existing ArcGIS Online dynamic report through
2.
have created a new Web Application beforehand in the same
Publisher instance (i.e. pressed the ‘Restart’ button).
Both options will launch the ‘Create Web Applications’ dialog box when you
select them. Please refer to the next section M.2.5. The ‘Create Web
Application’ Dialog for further information.
will be handled in the final report.
M.2.4. Finalising the Report
After you have added all base geographies, contextual geographies and
background layers that you wish to use within your ArcGIS Online dynamic
report you can move on to the ‘Choose Settings For Your Dynamic Report’
step of the Publisher. Here you can choose one of the pre-defined colour
profiles or create your own one using the ‘Custom’ option in the drop down
list. If you are using the ArcGIS Online Area Profile (HTML Edition)
Template you will also have the option to choose which configuration you
© GeoWise
GeoWise Ltd.
Ltd. 2013
2011
©
Page 184
visualise | communicate | ENGAGE
Figure 219
g the InstantAtlas Area Profile Template User Guide
The InstantAtlas ArcGIS Online Templates
M.2.5. The ‘Create Web Application’ Dialog
The ‘Create Web Application’ dialog (Figure 220) opens when you click on
either ‘New Web Application on ArcGIS Online’ or ‘Save Web Application
on ArcGIS Online’ after your report has been published. If you have
selected the former option, some settings will be filled with default values. If
you have selected the latter option the settings will be filled with the current
values of this Web Application loaded from ArcGIS Online.
Figure 220
© GeoWise
GeoWise Ltd.
Ltd. 2013
2011
©
Page 185
visualise | communicate | ENGAGE
Please note that you can change these settings also on the details page of
g the InstantAtlas Area Profile Template User Guide
The InstantAtlas ArcGIS Online Templates
Once you are happy with the settings for your Web Application click ‘OK’.
the Web Application within ArcGIS Online.
Your Web Application will be created / updated on ArcGIS Online.
Title – Enter a title for the Web Application.
M.2.6. Additional Options on the last Publisher Screen
Description – This can be a detailed description of the dynamic report
Once you have created a new Web Application or saved/updated an
which will be visible on the details page of the Web Application within
existing one, three further options will appear on the Publisher screen
ArcGIS Online.
(Figure 221).
Tags – Enter keywords that other users might use to search for your
Figure 221
dynamic report.
Snippet – Enter a short summary description of the dynamic report. This
will show on the details page of the Web Application within ArcGIS Online
just below the title. The snippet is also visible in the tooltip of an existing
Web Application when trying to open it in the Publisher or Designer.
Access – Define who will be able to see your dynamic report. Choose
‘Public’ if you wish to share it with everyone, choose ’Private’ if it should
only be visible by yourself or choose ‘Organisation’ if you want to restrict
access only to users of the same organisation account.
Copyright – Enter any copyright information for the Web Application.
Licence – Enter any license information or restrictions.
Folder – You can create the new Web Application in any of your custom
folders you have already created within your ArcGIS Online account.
ID – This field can’t be edited and only serves as a reference.
© GeoWise
GeoWise Ltd.
Ltd. 2013
2011
©
Page 186
visualise | communicate | ENGAGE
The InstantAtlas ArcGIS Online Templates
View Report – This opens the ArcGIS Online dynamic report a new
g the InstantAtlas Area Profile Template User Guide
browser window or tab.
Once you have chosen a Web Application, the Publisher will download all
layer definitions and settings of the dynamic report into the Publisher. You
then have the ability to change these settings if you wish.
Open Web Application – This opens the details page of the Web
Application. This page enables you to edit the settings of the Web
After your report has been published you can then choose if you want to
Application, set who has access and to open the dynamic report.
create a new Web Application or if you want to update the one that you
opened in the Publisher. Please select ‘New Web Application on ArcGIS
Copy Report URL – This copies the report URL into your clipboard which
Online’ or ‘Save Web Application on ArcGIS Online’ respectively.
enables you to then easily paste this into an email or use it in an internet
browser which is not your default browser.
M.3. Editing an ArcGIS Online Dynamic Report
using the Designer and Style Editor
M.2.7. Opening an Existing Web Application
There are two reasons why you may want to open an existing ArcGIS
The only way to edit the config.xml and default.css files of an ArcGIS
Online Web Application:
Online dynamic report is by opening the ArcGIS Online Web Application in
the InstantAtlas Designer.
1. if you wish to change any settings an existing ArcGIS Online
dynamic report that need to be done in the Publisher e.g. the layer
M.3.1. Opening an ArcGIS Online Application
settings or the data model, or
To open an ArcGIS Online Application you will need to first start the
2. if you wish to create a new ArcGIS Online dynamic report based
on the settings of an existing ArcGIS Online dynamic report.
Designer, then select ‘File’ and then ‘Open ArcGIS Online Application’.
Alternatively you can click on the second icon from the left in the Designer
toolbar. If you haven’t yet signed in to your ArcGIS Online account in this
To open an existing ArcGIS Online Web Application in the Publisher click
on ‘File’ and then ‘Open ArcGIS Online Application’. This will launch the
‘Choose ArcGIS Online Application’ dialog which works in the same way as
the
‘Choose
ArcGIS
Online
Data’
dialog
‘M.2.1. Selecting Items from ArcGIS Online’.
© GeoWise
GeoWise Ltd.
Ltd. 2013
2011
©
described
in
section
Designer session you will be asked to do so. The Designer will then launch
the ‘Choose ArcGIS Online Application’ dialog which works in the same
way as the ‘Choose ArcGIS Online Data’ dialog described in section
‘M.2.1. Selecting Items from ArcGIS Online’.
Page 187
visualise | communicate | ENGAGE
The InstantAtlas ArcGIS Online Templates
M.3.2. Designing the ArcGIS Online Dynamic Report
M.3.4. Saving changes back to ArcGIS Online
You can edit the layout, settings and styles of the dynamic report as
You can save the changes back to the Web Application you opened simply
described in section ’C.4. Creating a New Design’.
by clicking the ‘Save’ button or selecting ‘File’ and then ‘Save’. This will
g the InstantAtlas Area Profile Template User Guide
save both the configuration changes as well as the stylesheet changes so
Please note: It is currently not possible to upload any custom files
such as logos, banners, downloadable datasets etc.to ArcGIS Online.
that the config.xml and the default.css files of the Web Application within
ArcGIS Online are updated.
Therefore if you wish to use custom files in your ArcGIS Online dynamic
report you will need to first upload them to a web server and then enter the
web link to the file into the URL field of the image or button component in
the Designer.
You can also save the changes to a different ArcGIS Online Web
Application. To do this select ‘File from the main menu, then ‘Save
As/To…’ and then ‘ArcGIS Online Application’ (Figure 222).
Figure 222
M.3.3. Styling the ArcGIS Online Dynamic Report
All style classes should be available through the ‘Styles’ tab of the
properties pane. This will list only those style classes that are relevant to
the selected component. If no component is selected it will list all style
classes that are relevant for the report as a whole. If you wish to see the
complete list of style classes you can open the Style Editor through the
main menu (select ‘Style’ and then on ‘Edit Styles’) or toolbar (third icon
from the right) of the Designer. The Style Editor also allows a global find
and replace of style properties which cannot be achieved through the
Designer. Once you are happy with the changes in the Style Editor you
need to save them back to the Designer by selecting ‘File’ and then ‘Apply’
in the main menu of the Style Editor. Alternative you can use the
the toolbar. Then close the Style Editor.
icon in
This will launch the ‘Choose ArcGIS Online Data’ dialog. Please find further
information on how to use this in section ‘M.2.1. Selecting Items from
ArcGIS Online’. You will need to ensure that you pick an Application that
was created with the same template that the configuration you are editing
belongs to.
© GeoWise
GeoWise Ltd.
Ltd. 2013
2011
©
Page 188
visualise | communicate | ENGAGE
The ability
save
an open
g the InstantAtlas
Area to
Profile
Template
User configuration
Guide
The InstantAtlas ArcGIS Online Templates
to an ArcGIS Online Web
Figure 223
Application enables you to apply the config.xml and default.css files from a
stand-alone dynamic report to an ArcGIS Online dynamic report.
The
steps required to do this are as follows:
1. Open the config.xml file of the standalone report in the Designer. If
the default.css file is saved in the same folder as the config.xml file
it will automatically be included.
2. Now select ‘File from the main menu, then ‘Save As/To’ and then
‘ArcGIS Online Application’.
This will save both the config.xml file as well as the default.css file to the
4. This will launch the ‘Choose ArcGIS Online Data’ dialog. Please
ArcGIS Online dynamic report. If you prefer to only save the config.xml file,
find further information on how to use it in section ‘M.2.1. Selecting
you should first move the config.xml file into a separate folder without any
default.css file and then follow the steps above.
It is also possible to only save a stylesheet to an ArcGIS Online Web
Items from ArcGIS Online’.
This will only update the stylesheet of the ArcGIS Online dynamic report;
the configuration will not be changed.
Application. To do this, follow the steps below:
1. First you need to ensure that the default.css file is saved in a folder
together with a config.xml file. It doesn’t matter what kind of
config.xml file this is (i.e. which HTML template was used to create
it) or how it is configured.
2. Open the config.xml file in the Designer.
3. Select ‘File from the main menu, then ‘Save Styles To…’ and then
‘ArcGIS Online Application’ (Figure 223).
© GeoWise
GeoWise Ltd.
Ltd. 2013
2011
©
Page 189
visualise | communicate | ENGAGE
InstantAtlas Support
g the InstantAtlas Area Profile Template User Guide
N. INSTANTATLAS SUPPORT
You can find IA support resources at www.instantatlas.com/support.xhtml.
InstantAtlas customers can login to their ‘My InstantAtlas’ account at
www.instantatlas.com/mia and download a wide range of support
resources and access a searchable knowledgebase. If these resources do
not provide a solution, please contact your support provider.
© GeoWise
GeoWise Ltd.
Ltd. 2013
2011
©
Page 190