1
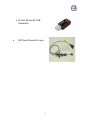
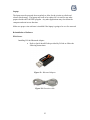
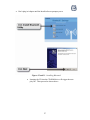
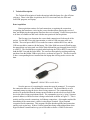
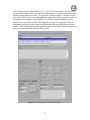
Operators Manual Expert Anesthesiology Monitoring System Team 2: Timothy Morin Nathan White Kane Killelea Sponsored by: Joseph H. McIsaac and John D. Enderle March 23, 2007 Client Contact: Dr. John D. Enderle Joseph McIsaac Editor-in-Chief, EMB Magazine Biomedical Engineering Book Series Editor for Morgan and Claypool Publishers Program Director & Professor for Biomedical Engineering University of Connecticut Bronwell Building, Room 217C 260 Glenbrook Road Storrs, Connecticut 06269-2247 (860) 486-5521 [email protected] Chief, Trauma Anesthesia Hartford Hospital Suite JB300, Department of Anesthesiology 80 Seymour St. Hartford, CT 06102 (860)-545-2117 [email protected] Important Safety Instructions When operated properly, the Anesthesia vital signs monitor can provide a safe, easy, and convenient way to provide an anesthetist with real time data from a room while they are not there. Prior to operating this device, it is important to carefully read this manual in order to eliminate any chance of injury to the patient, anesthetist, or others in the area. The following precautions should be heeded before and while using the device: Avoid dropping and rough handling Keep away from liquids Keep in a low humidity environment Keep small parts and electrical components away from children Keep device away from extreme heat Keep device away from extreme cold Make sure to turn power off when not in use Do not cut sensor components, as this can result in improper operation Clean and disinfect the cables after every use (Do not sterilize – cable damage may occur.) 1 Parts and Accessories All included hardware and necessary equipment for the successful operation of the Anesthesia monitoring device: • MacBook Pro • Belkin USB to serial device • BIS Vista EEG Sensor 2 • BIS Vista Monitor • LCD and Circuit • PDA with Windows Operating system 3 • D-Link Bluetooth USB transmitter • BIS Semi Reusable Sensor 4 Features The anesthesia vital signs monitor has the ability to supply the anesthetist with the following information and technology: • Real time data retrieved and saved to a file for later examination • Display vital signs on an LCD screen located outside of the operating room • Allow for PDA transmission for vital signs on the go • Retrieves and displays necessary data. • Allows for mobility and of the anesthetist • Collects data for later use • Easily read front panels and displays 5 Table of Contents 4 1. Introduction 1.1 General overview of the device 1.2 Operating Instructions 1.2.1 BIS Monitor and LabVIEW program 1.2.2 LCD Display 1.2.3 Pda 2. Maintenance 2.1 Charging the PDA 2.2 Cleaning the lcd screens 2.3 Overall Maintenance: 2.4 LabVIEW Programs 2.5 Lcd 2.6 Pda 2.7 Laptop 2.8 Reinstallation of Software 2.8.1 Pda server 2.8.2 Installing USB/Serial Adapter (BELKIN) 3. Technical Descriptions 3.1 Data acquisition 3.2 Pda 3.3 Microcontroller 3.4 Max232/serial 3.5 Lcd display 3.6 Complete integration 3.7 Electrical specifications Troubleshooting 6 ` 9-19 9-11 12-19 12-15 16-17 18-19 20-36 20-21 22-23 23 24 24 24 25 25-36 25-34 35-36 37-59 37-43 43-49 49-50 50-51 51-53 54-58 59 60 Figures Page Figure 1: Anesthesia Vital Signs Monitoring System Figure 2: BIS Vista attached to a patient and to the laptop Figure 3: Power on the BIS Aspect Monitor Figure 4: How the transducer is to be worn Figure 5: The display shown by the BIS Vista for electrode placement Figure 6: Sensor noise signal display for the BIS Figure 7: Power on Macbook Pro laptop Figure 8: On and continuous buttons in LabVIEW Figure 9: Serial connection Figure 10: Powering the LCD Figure 11: How to turn the power on, on the power supply to the LCD screen Figure 12: Start up screen Figure 13: Cingular 8525 Cell phone/PDA Figures 14: Charger initialization Figure 15: Plug in charger Figure 16: Plug in other end of charger to PDA Figure 17: Spraying procedure Figure 18: Wiping procedure Figure 19: Bluetooth Adapter Figure 20: Extension cable Figure 21: D-Link Driver CD Figures 22 and 23: Installing Bluetooth Figures 24, 25, and 26: Installation of Bluetooth. Wait while the program installs Bluetooth Utility Setup Figure 27: Bluetooth Manager Figure 28: Click “OK” Figure 29: Wait Figure 30: Status Figures 31 and 32: Click “Finish”, then click “Yes” Figure 33: Bluetooth Manager Figure 34: Creating a Bluetooth connection Figure 35: Click “Next” Figure 36: Select your device’s name and click “Next”. The software will take a few moments to establish the connection. Figure 37: Click “Next” Figure 38: Initialize port Figure 39: Click “Next” to continue install Figure 40: Read directions and click “Next” to continue with installation Figure 41: Select “Yes, I want to restart my computer now”, then click “Finish” Figure 42: Belkin USB to serial device Figure 43: Command prompt screen with command inserted Figure 44: HyperTerminal test 10 11 12 13 13 14 15 15 16 16 17 17 18 20 21 21 22 22 25 25 26 27 28 7 29 29 29 30 31 31 32 32 33 33 34 35 35 36 37 38 38 Figures Page Figure 45: Front panel of the Packet Sniffer.vi Figure 46: Block diagram for the Packet Sniffer.vi Figure 47: Block diagram for parsing BIS Vista data Figure 48: Front panel for parsing BIS Vista data Figure 49: Front panel of BIS Vista data streaming program Figure 50: Block diagram to retrieve and parse BIS Vista broadcast Figure 51: Block diagram for simulated data Figure 52: Cingular 8525 Figure 53: ActiveSync user Interface Figure 54: This diagram shows how the device will eventually work with the networks already present at Hartford Hospital Figure 55: D-Link USB Bluetooth Adapter Figure 56: Bluetooth Manager Figure 57: Initialize COM port Figure 58: PDA VI – Virtual Serial port Figure 59: Server VI Figure 60: Microprocessor pin diagram Figure 61: Pin diagram and associated circuitry of MAX232A Figure 62: DB9 pin diagram Figure 63: LCD pin assignments Figure 64: Contrast circuit Figure 65: Contrast potentiometer Figure 66: 1 The LCD protoboard, 2 LCD, 3 PDA, and 4 the laptop with the front panel displayed Figure 67: BIS Monitor transferring data to the laptop using USB to Serial Converter Figure 68: The front panel for the final program with both the PDA and the BIS monitor LabVIEW programs combined Figure 69: Simulated BIS information being parsed and sent to the PDA Bluetooth program Figure 70: PDA displaying real time data, where the peaks represent the level of consciousness of the patient 39 40 41 41 42 43 43 44 45 46 46 47 47 48 49 49 50 51 52 52 53 54 55 56 57 58 Table Table 1: Electrical specifications Table 2: Troubleshooting 59 60 8 1 Introduction 1.1 General overview of the device The objective of the Anesthesia Vital Signs Monitor is to create a program that not only acts as a visual aid for the anesthetist but allows for the doctor to move from room to room and still have access to the viable information needed to make decisions and be able to return to the room they are most needed. This device will display the date, time, alarms, if the high or low limit alarms are active, silent alarms, suppression ratio, filters, total power, impedance, spectral edge frequency, EMB (level of consciousness of the patient), SQI (Signal strength), and a visual graph of the information with real time, time stamping. This data will be displayed on the laptop, then transmitted to a LCD (liquid crystal display) in another location, and have Bluetooth or TCP/IP connection to a PDA (personal data assistant), which will display just the EMB signal. The data retrieved can then be saved and put onto a server to then be recalled upon during and future surgeries. The following section will encompass and display the over all product and all parts and discuss simple operation. This will give the anesthetist names and descriptions of each part of the whole. CAUTION: Before using this product to read a patients EEG (encephalograph), be sure to read all of the instructions thoroughly. Make sure to check the equipment to make sure that it is running correctly before applying the transducer to a patient. 9 Anesthesia Vital Signs Monitoring System Figure 1: Anesthesia Vital Signs Monitoring System As shown in Figure 1, most of the parts run independently and are synchronized wirelessly. The laptop sends data to both the LCD through a network and the PDA through Bluetooth. 10 Figure 2: BIS Vista attached to a patient and to the laptop Figure 2 shows the data being transferred from the BIS Aspect monitor to the laptop with real time data upkeep. This data is being retrieved by the operator as the tests are being run. As seen in this photograph, the data from the BIS Aspect monitor correlates over to the laptop. 11 1.2 Operating Instructions BIS Monitor and LabVIEW program 1. Power on the BIS monitor. 2. Next the transducer must be plugged into the cable attached to the DSC input as shown in Figure 3. Figure 3: Power on the BIS Aspect Monitor 12 3. To start using the anesthesia monitoring system, affix the sensors to the subject’s head as shown in figure 4. Figure 4: How the transducer is to be worn The sensors should be pressed firmly onto the forehead until the BIS Aspect monitor says that each of the sensors has a SQI of less then ten. Figure 5 shows the BIS monitor’s instructions for applying the electrodes. Figure 5: The display shown by the BIS Vista for electrode placement 13 The BIS displays each sensor on the turn on screen and displays which ones are within an adequate range of SQI to have a low enough value of noise as displayed in Figure 6. If this is not working the oil on the patient’s head may need to be wiped clean before application of the sensors. Figure 6: Sensor noise signal display for the BIS 14 4. Power on the Macbook Pro Figure 7: Power on Macbook Pro laptop 5. Once the Macbook Pro turns on, the LabVIEW executable file then will just need to be pressed and the program will run. 6. Next press the on button and the continuous arrow on the top of the LabVIEW program. As shown in Figure 8. Figure 8: On and continuous buttons in LabVIEW 15 LCD Display 1. Ensure that all connection have been made between the power supply and the circuit. 2. Make sure that the serial cable is connected as shown in Figure 9. Figure 9: Serial connection 3. Supply power to the circuit. The connections are shown in Figure 10. The operator plugs the positive cable to the positive output and the negative to the ground. Figure 10: Powering the LCD 16 4. Turn on power supply. As shown in figure 11, the power supply can be turned on by just pressing the on button to the l position. Figure 11: How to turn the power on, on the power supply to the LCD screen 5. Make sure that the image shown in figure 12 is displayed on the LCD screen upon the initial supply of power. If not, see the troubleshooting section. Figure 12: Start up screen 17 • PDA Figure 13: Cingular 8525 Cell phone/PDA 1. Turn on the Cingular 8525 device, found at location 1 in Figure 13. 2. Remove the screen pointer from location 3. 3. With the screen pointer, click on “Start Æ” and then click “Settings”. Refer to Figure 30 location 2. This will open a new window with three tabs at the bottom of the screen. 4. Next click on “Connections”, which is the farthest tab to the right, within this tab there are a number of different methods of communication. For this application only Bluetooth will be used. • Double-click on Bluetooth icon o Mode Tab Turn on Bluetooth Make device visible by other devices o Devices Tab 18 Click on “Add New Device” • This should discover your Bluetooth adapter for your laptop computer. • Input “EAMD server” into Display Name • Check off “Serial Port” and “Wireless Stereo” • Save settings o COM Ports Create a new outgoing port • Select “EAMD server” • Select a free COM Port which can be used for this device. o Authentication Tab Check: Authentication (Passkey) required At this point the data should be streaming from the BIS Aspect monitor to the laptop and the LabVIEW program should be displaying all the data. The data should also be transmitted to the LCD screen and displaying the appropriate information. Lastly the information should be transmitting to the PDA and streaming real time data. If any of this is not working properly: 1. Look through the troubleshooting section 5, or technical description for the advanced operator. 2. Call the engineering team for technical support. 19 2 Maintenance The maintenance for the anesthesia vital signs monitor is minimal unless alterations are being made to the over all design of the program. For fast reference the maintenance section was split up into LabVIEW programs, LCD, PDA and laptop. Charging the PDA 1. Fold out prongs of charger as shown in Figure 14. 2. Figure 14: Charger initialization 20 3. Plug in charger as shown in Figure 15. Figure 15: Plug in charger 4. Plug in other end of charger to the PDA as shown in Figure 16. Figure 16: Plug in other end of charger to PDA 21 Cleaning the LCD screens 1. Spray a small amount of glass cleaner or other LCD safe cleaning product on the screen as shown in Figure 17. Figure 17: Spraying procedure 2. Gently wipe screen with a soft cloth as shown in Figure 18. Figure 18: Wiping procedure 22 These methods can also be used to clean the screen of the PDA. Start at number 1 under the “Cleaning the LCD section” and substitute the PDA for the LCD display. Overall Maintenance: Do not expose any part of this device to static electricity. The electrical components of all parts of the device could be damage by direct shock. Cleaning: Turn all components off before cleaning. • With a soft cloth wipe down the LCD screens of all devices. This procedure is outlined in the “Cleaning the LCD screens” section. • Keep all electrical leads free from corrosion and debris • Keep the circuits and parts dust free Do not bend or damage the pins for the male end of the serial connector. If damage occurs to the pins, replace the serial to USB converter. Do not expose any parts of this device to water or weather of any kind. If the device is damaged by exposure to water, please return the entire unit and do not try to turn it on or injury may occur. Extreme heat and cold should be avoided Make sure to turn off all parts of the anesthesia monitor while not in use for a longer lasting life time. If any damage occurs to the device please test it using artificial vital signs, DO NOT CONNECT THE TRANSDUCER TO A PATIENT until the device is tested and everything checks out. 23 LabVIEW Programs The maintenance for the LabVIEW programs should only be performed by an advanced LabVIEW technician with adequate knowledge of the program design. The first step in LabVIEW maintenance should begin with either using the LabVIEW 8.2 version or updating and finding new icons that correlate to the ones originally in use in the newer version of the software. FIRST: Make sure to plug the USB converter into the laptop and the Aspect BIS vital signs monitor and that the power has been turned on for each individual component. 1. This program was written using LabVIEW 8.2. If you have a newer version move to section 2b, if you are using 8.2 then continue with 2a. 2a. Make sure all the sub-VI’s are downloaded and functional. 2b. Update all the icons to newer icons that can replace the unrecognized ones. 3. Probe the data outputs between each of the parsing functions. 4. Double check the match icon and make sure that it is extracting the correct data. LCD MAKE SURE TO UNPLUG PRIOR TO WORKING WITH ANY ELECTRONICS!!! Make sure the circuits are dusted and clean. Make sure all the connections are soldered well. Make sure there are no short circuits. If nothing is displayed on the screen, check all connections and consult the troubleshooting section. PDA Make sure a hard reset is done once every two weeks. A hard reset is when the battery is taken out of the device for 30+ seconds. To perform any upgrades to the software on the PDA, the PDA must be attached to the laptop using a USB to Mini USB converter. The alterations must be made using the Pocket PC Landscape Screen for LabVIEW. 24 Laptop The laptop must be powered down regularly to allow for the circuits to refresh and release stored energy. The laptop may need to be replaced if it is used for any other purpose besides the LabVIEW program. Any other applications may slow down the computer and ruin its true function. Make sure proper virus software is installed if the laptop is going to be on a live network. Reinstallation of Software PDA Server Installing D-Link Bluetooth Adapter • Refer to Quick Install Guide provided by D-Link or follow the following instructions. Figure 19: Bluetooth Adapter Figure 20: Extension cable 25 Figure 21: D-Link Driver CD 26 • Don’t plug in Adapter until the Install software prompts you to. Figures 22 and 23: Installing Bluetooth • Inserting the CD into the CD-ROM drive will trigger the auto play file. Then proceed as shown above. 27 Figures 24, 25, and 26: Installation of Bluetooth. Wait while the program installs Bluetooth Utility Setup 28 Figure 27: Bluetooth Manager Figure 28: Click “OK” Figure 29: Wait 29 Figure 30: Status 30 Figures 31 and 32: Click “Finish”, then click “Yes” After the Computer reboots it will be Bluetooth enabled and you may proceed to setting up the PDA and creating a virtual serial port using the Bluetooth manager located at the bottom right corner of your desktop as shown in the figure below. Figure 33: Bluetooth Manager • Double click this icon to open up the manager 31 • Once the manager is opened click on New connection the button looks like the figure below. Figure 34: Creating a Bluetooth connection • This will open up the following window and select Express Mode. Then click Next. Figure 35: Click “Next” • After clicking Next the window should discover the PDA (when the PDA is turned on, if nothing is found refer to the PDA setup and follow those instructions then return to were you left off) 32 Figure 36: Select your device’s name and click “Next”. The software will take a few moments to establish the connection. Figure 37: Click “Next” 33 • After the Connection is established the Bluetooth manager will return to the initial screen and you will see your newly acquired Virtual serial port. Figure 38: Initialize port You cannot establish a connection until the port as been initialized. This will be covered in a later section. 34 Installing USB/Serial Adapter (BELKIN) Figure 39: Click “Next” to continue install CAUTION: Make sure to read the VERY IMPORTANT statement that will come in the next part! Figure 40: Read directions and click “Next” to continue with installation 35 Figure 41: Select “Yes, I want to restart my computer now”, then click “Finish” Congratulations: You have successfully installed the Belkin USB to PDA Adapter Driver Install process. This will allow for data acquisition from the BIS to the LabVIEW program and from the program to the LCD. 36 3 Technical Description The Technical Description is broken down into individual parts for a fast efficient reference. There is the Data Acquisition, the LCD circuit and code, the PDA and LabVIEW program, and Laptop. Data Acquisition Data acquisition consists of a hard connection, recognizing the connection, recognizing the broadcasts, retrieving the correct broadcast data, parsing the received data, and displaying the appropriate data from the received string. Each of these parts has to be done to continue on and work with the next portion of data acquisition. The first step is to determine the correct hard connection to fit the needs of the project. For the BIS Vista vital signs monitor, a serial to USB converter cable was needed. The serial port or RS232 was needed to connect with the BIS Vista, and the USB was needed to connect with the laptop. The Solar 8000i was more difficult because the manual that was being used was for the Solar 800 and the port changed from a RS422 to a RS232. The final hardware required ended up being the USB to RS232 converter for both the BIS Vista and the Solar 8000i. The converter that ended up working and being purchased was the Belkin USB to serial device as shown in Figure 10. This device needs to have corresponding drivers installed into the laptop that is being used to retrieve the data. Figure 42: Belkin USB to serial device Next the process of recognizing the connection must be managed. To recognize the connection there are a few methods that can be used. The first method is to use a command prompt to ping the device that is being connected. The command prompt needs to be opened and then the internet protocol address needs to be discovered for the device the data is being acquisitioned from. The command to type in is “/ping” (internet protocol address) of the device that is being worked with as shown in Figure 11. This is mainly used for network connections via Ethernet connections. Also another method for determining if the connection is visible is using HyperTerminal. HyperTerminal recognizes serial connections. This program can pass data through the hard connection and test a pin to pin loop. If there is a hard connection being acknowledged then when HyperTerminal is started and set up you will be able to choose a COM1 as shown in 37 Figure 12 or any other number that your computer assigns to it, on the list of connect using: ( ). This method is mainly used for serial connection testing. Although it can also be used to determine if there is a TCP/IP connection as well, as shown in Figure 12. Figure 43: Command prompt screen with command inserted Figure 44: HyperTerminal test The next step is to recognize that there are broadcasts on the connection. This can be done using an advanced LabVIEW program called “Packet Sniffer.vi”. This program 38 works using a program called WinPcap_4_0_1 by CACE Technologies. The LabVIEW program calls on this software to read any possible data that is on the network connection that the operator chooses to watch. This program is shown in Figure 13 and the network that will be sniffed is chosen by highlighting the connection with the blue color on the list of adapters in the program. This program is very helpful with obtaining data off of a network, but it can also be used to somewhat parse the data. This program is the only method that was discovered to connect and obtain data from the Solar 8000i vital signs monitor. This is difficult because the commands have to call for the WinPcap program to work correspondingly with the LabVIEW program. Figure 45: Front panel of the Packet Sniffer.vi 39 Figure 46: Block diagram for the Packet Sniffer.vi Next the correct broadcast must be obtained and separated from the rest of the broadcast data. This can be done by either sending a request packet to the network to receive the exact data that is required, which has to be done for the Solar 8000i, or can just be picked up off the network with the BIS Vista monitor. This makes the BIS Vista much easier to work with. To determine if the data is coming from the correct monitor, the program designed must pull the internet protocol from the data and display it. This is also done by the Packet Sniffer.vi. This VI retrieved some idle data broadcasts from the Solar 8000i. This allowed some understanding of how the data would be formatted when it was sent from device to device. An example of these data packets are displayed in below in data packet one and two. Data packets three and four consist of the data that is retrieved from the BIS Vista vital signs monitor. Data packet one: FFFF FFFF FFFF 0000 A106 6811 0800 4500 0074 004D 0000 1E11 95EB 8201 023F 8201 FFFF 0408 1B58 0060 5A5B 0104 0000 8201 023F 4731 E974 4249 4F4D 4544 7C30 3100 0000 0000 0000 0000 0000 0000 0000 0000 0000 0000 0008 0001 07D0 0011 0022 000D 07D0 000C 07D0 0009 07D0 001D 1D4C 0013 0402 001C 0403 0000 0000 0000 0000 0000 0000. Data packet two: FFFF FFFF FFFF 0000 A106 6811 0800 4500 0074 0051 0000 1E11 95E7 8201 023F 8201 FFFF 0408 1B58 0060 5A47 0104 0000 8201 023F 4731 E988 4249 4F4D 4544 7C30 3100 0000 0000 0000 0000 0000 0000 0000 0000 0000 0000 0008 0001 07D0 0011 0022 000D 07D0 000C 07D0 0009 07D0 001D 1D4C 0013 0402 001C 0403 0000 0000 0000 0000 0000 0000 40 Data packet three: 10/25/2007 16:33:57| 8| 4|On |High |Off | 70|No | 0.0| 22.9| 00f1| 97.3| 55.3| 46.3| 48.3| 8|10000000| 0.0| 29.4| 0015| 97.7| 49.9| 44.9| 73.3| 1|10000000| 0.0| 29.4| 00f1| 97.5| 49.9| 45.6| 48.3| 0|10000000| Data packet four: 10/23/2007 15:51:40| 8| 0|On |None |Off | 70|Yes | -3276.8| 26.0| 0005| -3276.8| 54.0| 31.3| 0.0| 1000|12008800| -3276.8| 29.5| 0005| -3276.8| 52.1| 50.6| 0.0| 1443|12002000| -3276.8| 27.7| 0005| -3276.8| 53.1| 40.9| 0.0| 0|1200a800| To parse the data that is received, the protocol for the device must be understood. The BIS Vista projects data that is separated by a vertical bar. This makes it very easy to parse and pull the exact data that is needed and display it with little programming. This can be seen in Figures 15 and 16. Figure 47: Block diagram for parsing BIS Vista data Figure 48: Front panel for parsing BIS Vista data The parsing program for the BIS Vista vital signs monitor was proven to work perfectly. The program was manipulated into the simplest possible format and the data output was inconsistent. 41 The final piece is to be able to stream, parse and display the required data on an easily manipulated front panel. This brings together all the previous steps to one final program. This was only done with the BIS Vista. The Solar 8000i is a much more complicated piece of software. This software would require an understanding of the protocol, which is highly protected by General Electric. The concept of the retrieval streaming, parsing, and saving of data onto a server is the most important aspect of this project. An example of the front panel and block diagram for the BIS Vista is shown in Figures 17 and 18. Figure 49: Front panel of BIS Vista data streaming program 42 Figure 50: Block diagram to retrieve and parse BIS Vista broadcast Another program was written to simulate the data that would be outputted by the Aspect BIS vital signs monitor. The simulated data program was then inputted into the parsing program shown in Figure 42.1, in place of the serial connection. The front panel is the same as displayed in Figure 41. The block diagram is displayed in Figure 42.2. This program works by sending three pieces of data in a loop fashion to simulate a continuous data flow. Figure 51: Block diagram for simulated data PDA This element of the design enables the anesthesiologist to monitor patients from remote locations in the hospital. The Cingular 8525 was used for this application, but any Bluetooth enabled PDA can be substituted. This PDA has a 400 MHz Samsung CPU with Windows Mobile 5.1 (Pocket PC). This operating system allowed the group to easily build a compatible LabVIEW program. The PDA’s LCD screen is a AKU 2.3.0 Display: 2.8 inch, 240x320 pixel transmissive/reflective LCD. 43 Figure 52: Cingular 8525 Before the testing can began the LabVIEW program ActiveSync has to be installed onto the lab computer which will be used to allow the PDA to upload any drivers/programs needed. ActiveSync is available at http://www.microsoft.com/windowsmobile/activesync/default.mspx, this program is provided by Microsoft and allows users to synchronize their PDA to their personal computer. Once the PDA is synced to the computer we are able to upload files which we are able to test. 44 Figure 53: ActiveSync user Interface There are two main methods of establishing communication between the Client PDA and the server. Ideally a TCP/IP connection should be used because it has a greater level of security plus Hartford Hospital has a well establish wireless network that would eliminate any range obstacles that may occur while using a Bluetooth network that we would create. Bluetooth is used because it simplifies the prototype by eliminating any security measures used by the TCP/IP networks. Several measures can be taken to improve the program if a different PDA is used in the application. To improve upon the program, TCP/IP can be used instead of Bluetooth to enhance the performance of the program. This cannot be done because the PDA in this application is not capabale of a TCP/IP connection. The PDA’s MAC address will need to be added to the wireless server and then LEAP (Lightweight Extensible Authentication Protocol) used as the PDA security measure. This means that a new PDA will need to be purchased that is LEAP enabled. 45 Figure 54: This diagram shows how the device will eventually work with the networks already present at Hartford Hospital Using the RWN provides the system with extra security preventing visitors to connect to the network and obtain patient data. Additionally the RWN is wired throughout the hospital so the anesthesiologist would be able to observe the data throughout the hospital. Figure 55: D-Link USB Bluetooth Adapter 46 This adapter is accompanied by drivers which allowed the personal computer to detect the Bluetooth device. Once the drivers are installed an icon will appear on the bottom right hand corner of the desktop. This opens the Bluetooth manager and communication ports can be assigned. For prototyping COM 40 has been assigned. This COM Port is arbitrarily assigned and as long as no other device has the same communication port then it is sufficient. Figure 56: Bluetooth Manager When the virtual serial port is created, it first has to be initialized through LabVIEW. Figure 48 shows front panel and the block diagram of what how the port is initialized. To program the initialize button an event structure is used to separate the data collection from opening the port. Figure 57 displays what happens when the initialize button is pressed. The event structure allows the program to dictate when to send and receive the data and when to open up the virtual serial port. Figure 57: Initialize COM port 47 When the initialize button is pressed the Bluetooth manager can establish the connection as Figure 49 shows. Once the connection is created then PDA can proceed to collect and display data on the chart. Figure 58: PDA VI – Virtual Serial port After the connection is established the server can communicate with the PDA. Figure 50 is the block diagram for the server. Starting from the far left and working to the right, the server starts off by waiting for a request packet from the PDA. The first while loop detects the number of bytes at the port. Once the byte reads one the while loop is stopped and it moves to the next loop. The next loop reads that incoming packet and symbolic telling the server the PDA is ready to receive data from the monitoring equipment. Once the PDA has requested data the loop is turned off and the farthest to the right loop is activated. This last loop controls data transmission. The data is converted from a data type to a variant and then finally to a string format. Once the data is converted it is sent to the PDA. When the PDA receives the information it reverses the conversion back to data type and redisplays the data on an identical chart. 48 Figure 59: Server VI Microcontroller This device uses the PIC 16F877-20/P microcontroller from Microchip because it satisfies all of the needs for the LCD screen. It is a 40-pin 8-bit microcontroller that is required for operation of the LCD display. The microcontroller accepts the input from the MAX232 chip and initializes and controls the LCD display. Figure 60 shows the pin diagram of the PIC16F877. Figure 60: Microprocessor pin diagram 49 The microprocessor uses a 6 MHz oscillator for timing control that is connected to pins 13 and 14. Pins 19 through 21 are used as digital outputs and are connected to pins 1 through 4 of the LCD display. Pins 2 through 5 are used as enable pins 1 and 2, register select, and read/write respectively. This configuration utilizes ports A, D, and C of the microprocessor for data transmission. The USART port is used for serial communications with a PC using an RS232 connection. USART stands for Universal Synchronous Asynchronous Receiver Transmitter. This is the port on the microcontroller that accepts inputs and transmits outputs. The receive port is defined as “RX”, or port 26 on the microcontroller. The transmit port is defined as “TX”, or port 25. MAX232/Serial In order for serial communication between the PC and microcontroller, it is necessary to use a MAX232 chip. The operating voltage of a RS232 cable is approximately 10 volts, and the operating voltage of the microcontroller is 5 volts. The function of the MAX232 is to act as a voltage leveler so the signal from the serial cable can be interpreted by the microcontroller. Figure 61 shows the pin out diagram of the MAX232A, and the associated capacitors and connections that are required in order for the circuit to work. Figure 61: Pin diagram and associated circuitry of MAX232A 50 Pins 11 and 12 of the MAX232A are connected to pins 25 and 26 of the PIC, respectively. Pin 14 of the MAX232A is connected to pin 2 of the DB9 connector, and pin 13 is connected to pin 3. Figure 62 shows the pin diagram of the DB9 connector, and the actual DB9 connector. Pin 5 of the DB9 is connected to ground. Figure 62: DB9 pin diagram LCD Display This device uses a 40 character by 4 line character LCD display. The LCD is an Optrex model DMC40457, with dual Hitachi HD44780 controllers. The HD44780 controller is the industry standard among character LCD displays. The microcontroller sends commands to the LCD controller, and should not be tampered with. The LCD is operating in 4-bit mode and utilizes both of the HD44780 controllers. 4-bit mode means that instead of sending all the data for the LCD at once through 8 wires (8-bit mode) the data gets sent in two segments of 4-bits through 4 wires. The pin assignments of the LCD are shown in figure 63. 51 Figure 63: LCD pin assignments In order for characters to be displayed properly on the LCD, VEE from pin 12 on the LCD must be passed through a 10kΩ potentiometer so the contrast of the display can be adjusted. The circuit for the contrast is shown in Figure 64. Figure 64: Contrast circuit Figure 65 shows the contrast potentiometer within the circuit for the LCD display. In order to adjust the contrast, simply rotate the potentiometer until the information on the screen is displayed. 52 Figure 65: Contrast potentiometer IMPORTANT: Do not touch any of the electric components of this product as electric shock can result. If any of the circuits become damaged, consult a qualified engineer in order to fix the problem. 53 Complete Integration Figure 66: 1 The LCD protoboard, 2 LCD, 3 PDA, and 4 the laptop with the front panel displayed Figure 66 shows each of the four parts of the expert anesthesia monitoring system. These are the individual components. These are the four parts that have to be integrated together. Each part must work concurrently with the others. The first step was to make the BIS monitor work with the LabVIEW program. Figure 67 shows the BIS monitoring system streaming data to the LabVIEW program on the laptop. 54 Figure 67: BIS Monitor transferring data to the laptop using USB to Serial Converter The complete LabVIEW program is displayed in Figures 68 and 69. A serial cable is used to write to the LCD screen and display the necessary data. 55 Figure 68: The front panel for the final program with both the PDA and the BIS monitor LabVIEW programs combined 56 Figure 69: Simulated BIS information being parsed and sent to the PDA Bluetooth program The PDA transmission of live data is accurate but the graph displays a pattern of peaks instead of a constant line. The peaks will represent that actual level of consciousness of the patient as shown in Figure 70. While transmitting over Bluetooth the packets that are received by the PDA are separated with zeros. This makes the graph slightly less clear then a solid line across the screen, but if the user knows that the peaks are the only true data, then the device works perfectly for its application. The anesthetist will know the exact level of consciousness of the patient while outside of the operating room. 57 Figure 70: PDA displaying real time data, where the peaks represent the level of consciousness of the patient 58 Electrical Specifications Laptop Operating Voltage LCD Operating Voltage PDA Operating Voltage ** 5.0 ** ** Volts ** Laptop Operating Current ** ** LCD Operating Current 135 mA PDA Operating Current ** ** ** = Stated by Owners Manual of the device used for these applications (devices interchangeable). Table 1: Electrical specifications 59 Troubleshooting/Technical Support Problem Laptop does not turn on Possible Cause 1. No power LCD does not turn on 1. Power is being shorted 2. ribbon connector failure 1. 1. 2. PDA does not turn on If the USB to serial connection is not recognized PDA will not initialize No data transfer to PDA No data transfer to the LCD PDA does not receive data Failure to connect to com port All other problems 1. Batteries are dead 1. 1. Connection is faulty 2. Software failure 1. 1. Error occurred while starting the PDA 2. Program has a critical error 1. Bluetooth connection error 2. Server is not running 1. 2. 1. Bad connection 2. Contrast is too low 1. Out of range 1. 2. 1. Com port is active with another device 1. Programming errors or part defects have occurred Table 2: Troubleshooting. 2. 1. 2. 1. 1. How to Fix It Plug in the Laptop and turn it on again. If this does not work then the computer may be damaged Turn off the power, replace the leads onto the positive and negative terminals and turn the LCD back on. If this does not work the LCD may have been damaged. Turn off the power to the LCD and make sure ribbon connector is tightly connected. Charge the batteries and try the PDA again. Turn the power off and make sure the connections are tightly attached Reinstall the software for the Belkin USB to serial device Restart the PDA and try again. Upload the PDA software to the PDA again. Check the artificial com port through Bluetooth manager Check server program on the laptop to determine if the server is running correctly, if not restart program Check the serial connection Open box and turn the contrast wheel until appropriate contrast is visible Move closer to the laptop and try to reinitialize the PDA Go to device manager and reconfigure com ports 1. Call technical support for advanced help or replacement of parts 60