1
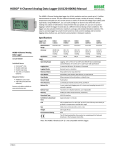
A Quick Tutorial
This has been written to serve as a quick tutorial for you to refer to when setting up a data
logging system. This tutorial will be written with the Campbell Scientific CR10X and CR23X in
mind, however, all data loggers work on identical principles and once you are comfortable with
properly connecting one type of data logger with various sensors, it should be relatively
straightforward to branch out to other data logging systems.
What is a data logger?
Data = Information and Logging = Recording (keeping record of information. A data logger is an
electronic device capable of collecting and storing data.
What is a data logger good for?
Data loggers are widely used to collect any kind of data in
environmental systems as for example in air (precipitation,
humidity, pressure, wind speed, temperature), water (surface and
subsurface water flow, pressure head) or soil (water content,
temperature, CO2 content). The data logger enables to gather
signals from sensors or transducers,
store them and prepare them to be
downloaded for post processing on a
computer. Data loggers are especially useful if data have to be
collected automatically because the process we want to observe is (a)
very fast (temperature change due to a fast chemical reaction), (b) long
observation time and regular readings are needed (e.g. room
temperature measurement every hour but 24h a
day, 7 days a week) or our experiment is just
difficult to reach (temperature and
precipitation measurements every hour one a
remote place that can just be reached e.g. once
a month).
How do I operate a data logger system?
There are many different data logger systems and on the market. The main components and
procedures to operate a data logger, however, are the same. Therefore, instead of providing
details about the different brands and makes, we would like to give a short description of the
main parts and what they are used for.
The main components of a data logging system are
1
as follows:
•
•
•
•
•
sensors and transducer: The sensor “measures” a certain parameter. For example, the air
pressure by converting the pressure in a proportional electric signal (digital or analog as
voltage or current). The signal at the output of the sensor often has to be corrected for
example to eliminate temperature influence on the pressure measurements. Nowadays
sensor and some electronics to correct the output signal from the sensor are part of one
unit, called transducer. The output of the transducer is an electronic signal that can now
be read in the data logger.
data logger: The data logger collects the output signals of the transducers, defines how
often this signals are read from the transducers, converts analog signals in digital
information and stores it and allows us to monitor and finally download it as our rough
data. As for a PC, the data logger needs some software to run it. This data logger program
has to be written by the user and tells the logger for example which transducers are
connected to the logger and at which rate the signals from the transducers have to be read
by the logger. Nowadays programming a data logger is very easy and will be addressed in
the examples below.
power supply: An electrical power supply is needed to run the data logger.
communication cable: The communication cable is usually a serial cable that connects the
data logger with the computer to upload the logger program and download the data.
computer: A computer is needed to download and post process the data.
2
Practical Examples: Measuring temperature, water pressure and
precipitation using a Campbell CR10X data logger
Initial steps:
1. Connect the CR10X data logger with the serial cable to the computer.
2. Connect the data logger to the power supply.
3. Start the computer
Make certain that you have installed Campbell Scientific’s freeware on your computer. The two
necessary programs are: PC200W, version 2.0 & SCWin-Short Cut for Windows, version 1.2.
If you do not have these programs running, download them at the following website:
http://www.campbellsci.com/resource.html
ShortCut for Windows:
SCWin creates simple programs for our CR510, CR500, CR10(X), 21X, and CR23X
dataloggers. SCWin also supports our ET106 and MetData1 weather stations. The newest
version includes the latest sensor files.
PC200W:
PC200W is Campbell Scientifics starter software that supports direct connection between a
datalogger and a computer.
3
Example 1: Temperature Measurements with a Thermocouple
In this example we want to measure temperature using a data logger and a thermocouple as a
temperature sensor. The following paragraphs give step-by-step instructions, assuming that
computer and data logger and power supply are connected correctly.
Supplies:
Desktop or laptop computer
Data logger (CR10X or CR23X)
Several Thermocouple wires (note which type of wire you have)
Flat-head screwdriver
Power supply (12V DC supply)
Communication cables (SC12 for the CR10X or RS232 for the CR23X )
Writing a Data Logger Program
1. Start the program “SCWIN” by double clicking the corresponding icon on the computer
desktop. The following Main Menu (Fig. 1) should appear:
Fig. 1 Main menu of the “SCWIN” program
2. Note only the “Program” button is active. Press the “Program” button and the following
window (Fig. 2) will appear.
4
Fig. 2 Definition of the logger program file
Give a file name for example “temp_measurement” and press “Open”. On the next
window (we want to make a new file) press “Yes” to create the new file. Then, choose
the appropriate data logger “CR10X” and press “OK”. In the next window leave the
scanning time at 10 s and press “OK”. Now you will be returned to the main menu (Fig.
1) and ALL the buttons will be active.
3. Now we wish to define the type of sensor we will be taking measurements with. Press the
“sensors” button and, in the window popping up, choose (under “Available Sensors”)
<Sensors for CR10X/Temperature/> T-type (copper constantan) thermocouple (see Fig.
3). Then push the red arrow and the next window (Fig. 4) shows up. Choose temperature
range corresponding to “-46 to 50 C” Deg C and “Prog_Sig” from Reference
Temperature Measurement, then press “OK” and the window from Fig. 3 will show up
again.
Fig. 3 Defining thermocouple type.
5
Fig. 4 Defining temperature range and reference temperature.
Fig. 5 Wiring diagram for a single T-type thermocouple.
4. Press the “Wiring Diagram” button at the bottom of the window as illustrated in Fig. 3
and a window depicting the wiring diagram of the data logger for a single T-type
thermocouple shows up. Connect the blue wire of the thermocouple with the port 1H and
the red wire of the thermocouple with the port 1L of the CR10X data logger (you will
need a small flathead screw driver to tighten the thermocouple wire down). Press the
6
“Sensors” button in the window of Fig. 5 and the “home” button in the window of Fig. 3.
You should be back now to the main menu (Fig. 1).
5. Press the “Output” button on in the main menu and a window like Fig. 6 will appear. This
window allows you to choose the output preferences in your data file once data collection
begins. First, under “Selected Sensors”, choose those sensors you wish to include in the
output data file. Click on your thermocouple sensor (should be highlighted in blue) and
place it into the “Selected Outputs” window by choosing Average, Minimum or
Maximum (or you may choose all three, in desired). Now, your window should read as
Fig. 7. Under then “Selected Outputs” window, choose the “Data Storage” interval in
minutes or seconds. A sampling interval of 1 minute is sufficient for short tests, unless
you will be exposing the temperature sensor to a rapid temperature change. This is an
important step which determines the total number of sampling points saved to your
output file. Click the Home button to return to the Main Menu.
Fig. 6 Definition of the output with selected sensor.
6. Now it is time to finish the program you have just written in SCWin. On the Main Menu
choose, “Finish”. This will tell SCWin to write the program and save it to the indicated
file. Click “Ok” (see Figure 8).
7
Fig. 7 Definition of the output with selected sensor and output.
Fig. 8 Finishing (saving) the Program.
Connect Data Logger & Transfer Program
Now you must use PC200W to transmit the program (.dld file) to the CR10X data logger (see
Figure 9).
7. This is a good time to connect the data logger to your computer (if you haven’t done so
already). With the CR10X, you must use the CS I/O connection port to connect to a 9-pin
communications port in the back (or side) of your computer. Use an SC12 cable or you
8
may use a SC32B cable (connected to a RS 232). (Please note; you can not simple use a
RS 232 cable connector as it can not communicate with the data logger alone).
Datalogger Connections (Power Supply, Communications Cable, Thermocouple).
8. Connect a “Ground” to the CR10X data logger and then connect the power supply to the
logger. You may use any 12V source with the data logger. Please refer to the CR10X
manual for more information about the appropriate Power Supply.
9. Open PC200W, under “Station Setup” and “Current Datalogger Profile”, choose the
appropriate communications port that your CR10X is connected to. Once selected, click
“Connect”. You should see a picture of the CR10X connected to the appropriate
communications port. The
screen should confirm you
are connected. If the
connection failed, try
changing the communications
port.
Fig. 9
Connect to the Data logger.
9
10. Now, you must load the program you just created in SCWin to PC200W. Locate your
program under “Associated Program” under the “Program” portion of the window.
Navigate to the proper directory and choose the .DLD file you created. Click “Open” and
“Send” your program to the CR10X from your computer terminal. Click “Set Now” to
synchronize your data logger with the clock on your computer.
Load Program
Monitor Data Collection & Collect Data
Now it is time to see if your data logger is receiving sufficient power and communicating
with the sensors to receive measurements from the sensors. Click on “Monitor Locations”
in the upper left hand corner of the PC200W window. Select the readings to be viewed
with two decimals (0.00) and for the values to be updated once every second. In the
Value Field viewer, you will see the
battery voltage, program signal and your
thermalcouple temperature (relative to
20oC). Now click “data Collection”. Your
screen should appear is in Fig. X. Click on
“Collect to” to determine the location of
your data file. Name your file and click
“Save”. Tell PC200W “What to Collect”
by clicking “New Data from Datalogger”.
Click “Collect” and then click “Ok” on the
“Information Window” after the data
collection process is complete. (If the data
collection process does not complete,
return to Step 7.).
Monitor Locations
10
Postprocess Data
11. You have now written and saved a data file
(.dat) to the directory location you have
chosen. Now, find the data file and open the
file using WordPad. Save your file as a text
document (.txt) and open Microsoft Excel to
view and process your data. With Excel open,
select “Import Text File” under the “Data”
dropdown menu. Select the appropriate data
file and chose to import the data as “Comma
Delimited”. Follow through the menus to
import the data. Insert several rows to create
labels for each column. If you are unsure what
a particular column represents, return to the SCWin Output menu to see the order or data
output. Note that the last three columns of the data table are the temperatures measured at
each of the thermocouples relative to the internal reference temperature.
Note that the last three columns are temperature corrected values.
12. You can now return to PC200W and download additional data that has since been
collected to your CR10X. To do so, return to PC200W and click on “Data Collection”,
“Collect Data”. Make certain that you chose “Append to Data File” and not “Overwrite
Data File”. You may return to Word Pad, open the new file and “Save as”, replacing the
old file with the newly appended data. Then, return to Excel and import the new data.
11
Example 2: Temperature and Water Pressure Measurements
Writing a data logger program
1.
3.
Proceed as in the previous example to set up the program using SCWin following steps
one and two above. Choose an appropriate name for the new program.
From the home page press “Sensors”. Under “Available Programs” open the “Generic
Measurements” folder. Select “Full Bridge”, the transducer is of this type of circuit,
and press the red arrow, or double click it (See Fig. 10). Set the “Range of Sensor
Voltage” to +/- 250 mv (See Fig. 11). Then click OK. The sensor should now be
listed under “Selected Sensors” on the left side of the screen. Again under available
sensors, go to temperature and select the Type T thermocouple as described previously.
After the thermocouple has been selected both sensors should be listed under “Selected
Sensors”.
Fig. 10 Defining Transducer
4. Press the “Wiring Diagram” button at the bottom of the window as illustrated in Fig.10
and a window depicting the wiring diagram of the data logger for a pressure transducer
and Type T thermocouple appears, see Fig. 12. Connect the blue wire of the
thermocouple with the port 2H and the red wire of the thermocouple with the port 2L of
the CR10X data logger (you will need a small flathead screw driver to tighten the
thermocouple wire down).
12
Fig. 11 Setting Range of Sensor Voltage
The wiring diagram labeled “Full Bridge” represents the pressure transducer. The
pressure transducer has four prongs. On the bottom of the transducer these prongs are
numbered, note that the numerals are very small. Prong one will connect to the “Excite”
wire which is then connected to port E1 of the data logger. Prong two will connect to the
“High” wire which is then connected to port 1H. Prong 3 is connected to the “Ground”
wire which is then connected to port AG. Prong 4 is connected to the “Low” wire which
is then connected to port 1L. “Shield” is the bare wire in the cable bundle and is
connected to port G. It is set up so that:
Prong 1—Red Wire—Port E1
Prong 2—White Wire—Port 1H
Prong 3—Black Wire—Port AG
Prong 4—Green Wire—Port 1L
Press the “Sensors” button in the window of Fig. 12 and the “home” button in the
window of Fig. 10. You should be back now to the main menu (Fig. 1).
13
Fig. 12 Wiring diagram for transducer and thermocouple
5. From the home screen click “Output”. Choosing output preferences will be similar to
Example 1. Select transducer by clicking on “FullBr” under “Selected Sensors” and then
place it in the “Selected Outputs” file by choosing “Average”. Repeat this process for the
thermocouple. Then under “Selected Outputs “specify the desired data storage interval in
seconds or minutes. This appears like Fig 13. Click “Home”, returning to the main menu.
Fig. 13 Definition of output for transducer and thermocouple
14
6. Now it is time to finish the program you have just written in SCWin. On the Main Menu
choose, “Finish”. This will tell SCWin to write the program and save it to the indicated
file. Click “Ok”. Again this will look similar to Figure 8.
Connect Computer and Transfer Program
This is done the same as an Example 1. Follow steps seven, eight, and nine of Example 1. Be
sure to select the correct program at step nine.
Monitor data collection
Click “Monitor Location”. A screen similar to figure 14 should appear. Battery voltage,
temperature relative to 20 0C, and output from the transducer is shown. Note that the transducer
output is given in millevolts. The pressure transducer must be calibrated so that these voltages
can be converted to pressure.
Fig. 14 Monitoring Pressure and Temperature
Collect and Post Process Data
Collect data and post process data in the same manner as Example 1 following steps ten, eleven,
and twelve.
15
Example 2: Temperature, Water Pressure and Precipitation Measurements
(to be added)
Writing a data logger program
1., 2. Proceed as in the previous example to set up the program using SCWin following steps
one and two above. Choose an appropriate name for the new program.
3. From the home page press “Sensors”. Under “Available Programs” open the “Generic
Measurements” folder. Select “Full Bridge”, the transducer is of this type of circuit, and
press the red arrow, or double click it (See Fig. 10). Set the “Range of Sensor Voltage”
to +/- 250 mv (See Fig. 11). Then click OK. The sensor should now be listed under
“Selected Sensors” on the left side of the screen. Again under available sensors, go to
temperature and select the Type T thermocouple as described previously. After the
thermocouple has been selected both sensors should be listed under “Selected Sensors”.
Fig. 10 Defining Transducer
16
Fig. 11 Setting Range of Sensor Voltage
7. Press the “Wiring Diagram” button at the bottom of the window as illustrated in Fig.10
and a window depicting the wiring diagram of the data logger for a pressure transducer
and Type T thermocouple appears, see Fig. 12. Connect the blue wire of the
thermocouple with the port 2H and the red wire of the thermocouple with the port 2L of
the CR10X data logger (you will need a small flathead screw driver to tighten the
thermocouple wire down).
The wiring diagram labeled “Full Bridge” represents the pressure transducer. The
pressure transducer has four prongs. On the bottom of the transducer these prongs are
numbered, note that the numerals are very small. Prong one will connect to the “Excite”
wire which is then connected to port E1 of the data logger. Prong two will connect to the
“High” wire which is then connected to port 1H. Prong 3 is connected to the “Ground”
wire which is then connected to port AG. Prong 4 is connected to the “Low” wire which
is then connected to port 1L. “Shield” is the bare wire in the cable bundle and is
connected to port G. It is set up so that:
Prong 1—Red Wire—Port E1
Prong 2—White Wire—Port 1H
Prong 3—Black Wire—Port AG
17
Prong 4—Green Wire—Port 1L
Press the “Sensors” button in the window of Fig. 12 and the “home” button in the
window of Fig. 10. You should be back now to the main menu (Fig. 1).
Fig. 12 Wiring diagram for transducer and thermocouple
8. From the home screen click “Output”. Choosing output preferences will be similar to
Example 1. Select transducer by clicking on “FullBr” under “Selected Sensors” and then
place it in the “Selected Outputs” file by choosing “Average”. Repeat this process for the
thermocouple. Then under “Selected Outputs “specify the desired data storage interval in
seconds or minutes. This should look like Fig 13. Click “Home” to return to the main
menu.
18
Fig. 13 Definition of output for transducer and thermocouple
9. Now it is time to finish the program you have just written in SCWin. On the Main Menu
choose, “Finish”. This will tell SCWin to write the program and save it to the indicated
file. Click “Ok”. Again this will look similar to Figure 8.
Connect Computer and Transfer Program
This is done the same as an Example 1. Follow steps seven, eight, and nine of Example 1. Be
sure to select the correct program at step nine.
Monitor data collection
Click “Monitor Location”. A screen similar to figure 14 should appear. Battery voltage,
temperature relative to 20 0C, and output from the transducer is shown. Note that the transducer
output is given in millevolts. The pressure transducer must be calibrated so that these voltages
can be converted to pressure.
19
Fig. 14 Monitoring Pressure and Temperature
Collect and Post Process Data
Collect data and post process data in the same manner as Example 1 following steps ten, eleven,
and twelve.
20
Measuring Temperature with a HOBO Data Logger
Connecting
1. First you must open the HOBO by removing the top cover to gain access. Use an
Allen wrench to remove the four screws holding the top cover in place. Take care
not to lose the screws.
2. The dome nuts on the side may be removed with a 15mm wrench from the
channel you wish to access. For this experiment Channel 1 would be appropriate.
Then slide the black plug out. Do not throw the plug away, so that it may be used
to reseal the logger.
3. Slide dome nut over plug end of cable with threads facing in towards the case.
4. Feed plug end of thermocouple cable from the outside of the case through the
dome fitting of the desired channel. Plug it into the corresponding jack.
5. Thread dome nut back onto fitting. For this particular thermocouple the process
may be difficult.
6. There is a single dome plug on the center of one side. Use a screwdriver to
remove this and gain access to the communication port.
7. Plug the appropriate end of the serial cable into this port and the other end into the
computer.
Launching Data Logger
8. Activate the BoxCar Pro 4.3 software. There should be a short-cut icon for this
program on your desktop, if so, double-clicks to open it. If not you can access it
by going through “Programs” and finding it listed as “Onset Applications”. You
should come to a page similar to Fig. 1.
9. To launch a program to the logger click on Logger from the toolbar and choose
Launch. See Fig. 1.
Fig. 1 Launching the HOBO
10. The program will connect and a page similar to Fig. 2 should appear. Enter an
appropriate name for the program for “Description”. The sampling interval can
also be changed from here from the drop down menu “Interval (Duration)”.
Fig. 2
11. Click Enable/Disable Channels… a menu similar to Figure 3 should appear.
Check Channel 1 and uncheck any other channels that may be active. Use the
drop down menu to choose the correct device that you plugged into the channel.
For this case it should be “+32 F to +110 F [TMCx-HB}”. Click Apply. This
should return you to the previous page which should now be updated, similar to
Fig. 2
Fig. 3 Enabling Channels
12. Now click Start in the upper right hand corner of the screen. A warning will
appear. Answer Yes to continue. The program will then launch the HOBO.
Another pop-up will appear. Unplug the serial cable connecting the HOBO to the
computer, then click OK. The HOBO should now be collecting data. The red led
light should blink as the HOBO takes measurements. The BoxCar window on the
computer will have no new information or active buttons.
Reading Data
13. To view the data that has been collected you need to reconnect the serial cable to
link the HOBO and computer. Start from the same screen as you did to launch
the HOBO, Fig. 1. This should also be the same screen you were left at after you
finished launching the HOBO at the end of step 12. Again click Logger, but
now choose Readout. The HOBO and computer will connect and a warning will
pop up, fig 4. Unplug the serial cable connecting the HOBO and computer, then
click OK.
Fig. 4 Warning Pop-Up
14. A screen will appear, Fig. 5, asking where to save the data. Give it a name and
save it to an appropriate location.
Fig. 5
15. Another screen will appear, fig. 6. Here you may choose from the measurements
that the HOBO has taken which ones you wish to view. You choose which
measurements will be saved by checking them. Uncheck measurements that you
do not wish to view. After you have selected click OK.
Fig. 6 Selecting data to view
16. Your screen should now appear similar to fig. 7. Time is shown on the x-axis and
the temperature measurement is shown on the y-axis. The tool bar gives different
options to manipulate the graph or export it to excel. See fig. 8. By toggling the
cursor over the different buttons you can get a description of each one.
Fig. 7 Data View
Export Excel
Spreadsheet
Fig. 8 Tool Bar Options
17. You can export and save your data as an Excel spreadsheet by clicking the button
pointed out in fig. 8. A window similar to fig. 9 will appear. Click Export.
Fig. 9 Exporting to Excel
18. After you click Export a screen will appear for you to save the data as an Excel
spreadsheet. Choose an appropriate name and location for this file. Click Save.
You can now go and find the Excel file and work with your data.