1
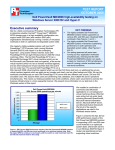
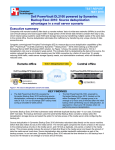
TEST REPORT JANUARY 2009 TM TM Dell PowerEdge T605 with AMD OpteronTM 2384 and HP ProLiant ML370 G5 Server with Intel® Xeon® E5450 comparison Executive summary Dell Inc. (Dell) and Advanced Micro Devices Inc. (AMD) commissioned Principled Technologies (PT) to measure the performance of the following servers running Microsoft Windows Server 2008: TM TM TM Dell PowerEdge T605 with AMD Opteron 2384 HP ProLiant ML370 G5 Server with ® ® Intel Xeon E5450 We simultaneously ran workloads that exercised three of the functions a typical small business server may have to handle: Web, email, and database services. We used WebBench to simulate Web traffic, Microsoft Exchange Load Generator (LoadGen) to simulate email activity, and SysBench to simulate database activity. The Workload section provides more information on the benchmarks. KEY FINDINGS The Dell PowerEdge T605 delivered an average of 41 percent better performance across the three workloads on Windows Server 2008 than the HP ProLiant ML370 G5. (See Figure 1.) The Dell PowerEdge T605 produced a 59 percent higher performance-per-dollar result across the three workloads on Windows Server 2008 than the HP ProLiant ML370 G5. (See Figure 2.) The Dell PowerEdge T605 delivered 48 percent better performance per watt across the three workloads on Windows Server 2008 than the HP ProLiant ML370 G5. (See Figure 3.) Figure 1 presents averaged results for the two servers running the three workloads on Windows Server 2008 relative to the lower-performing server, the HP ProLiant ML370 G5. For each benchmark, we assigned a value of 100 percent to that server’s results and then calculated the percentage performance improvement of the Dell PowerEdge T605. This approach makes each data point a comparative number, with higher numbers indicating better performance. Finally, we took the percentage performance improvement over the HP ProLiant ML370 G5 for the three benchmarks and averaged them. As Figure 1 illustrates, while running on Windows Server 2008, the Dell PowerEdge T605 delivered an average of 41 percent better performance across the Averaged peformance relative to the HP ProLiant ML310 G5 three benchmarks than did 2.0 the HP ProLiant ML370 G5. Normalized performance 1.8 1.6 1.4 Dell T605 1.2 1.0 HP ML350/370 0.8 0.6 0.4 0.2 0.0 Server Figure 1: Averaged performance of the test servers running Windows Server 2008 across the three benchmarks relative to the HP ProLiant ML370 G5. Higher numbers are better. For each server, we took the averaged relative performance results in Figure 1 and divided them by the price. (See Appendix A.) For ease of comparison, we normalized those results to those of the HP ProLiant ML370 G5. As Figure 2 illustrates, the Dell PowerEdge T605 produced a 59 percent higher performance-perdollar result across the three workloads on Windows Server 2008 than the HP ProLiant ML370 G5. Normalized performance-per-dollar results 2.0 1.8 Normalized performance 1.6 1.4 Dell T605 1.2 1.0 We also measured power consumption during the workload run. We took the averaged relative performance results in Figure 1 and divided them by the active power consumption. We normalized those results to those of the HP ProLiant ML370 G5. HP ML350/370 0.8 As Figure 3 illustrates, the Dell PowerEdge T605 delivered 48 percent better performance per watt across the three workloads on Windows Server 2008 than the HP ProLiant ML370 G5. 0.6 0.4 0.2 0.0 Server Figure 2: Normalized performance-per-dollar result of the test servers running Windows Server 2008 across the three benchmarks, relative to the HP ProLiant ML370 G5. Higher numbers are better. The HP ProLiant ML370 G5 has a larger case than the Dell PowerEdge T605. We chose this HP server, rather than the one with the same size case (the HP ProLiant ML350 G5), because we were able to configure the ML370 with a faster processor (an Intel Xeon E5450) than the one in the ML350 (an Intel Xeon E5440). The power supplies in the two HP models were the same, so the case size should not have a significant effect on power consumption. If we had purchased the HP ProLiant ML350 G5, the HP server price would have been lower. By comparing similar configurations, we estimate that if an ML350 with the same processor had been available, it would have decreased the HP server price by about $240, still making the HP server more expensive than the Dell. Workload We ran the following three workloads simultaneously, as a typical small business server might. Normalized performance-per-watt results 2.0 1.8 Normalized performance 1.6 WebBench 1.4 Dell T605 1.2 1.0 HP ML350/370 0.8 0.6 0.4 0.2 0.0 Server Figure 3: Normalized performance-per-watt results of the test servers running Windows Server 2008 across the three benchmarks, relative to the HP ProLiant ML370 G5. Higher numbers are better. Principled Technologies, Inc.: Dell PowerEdge T605 with AMD Opteron 2384 and HP ProLiant ML370 G5 Server with Intel Xeon E5450 comparison WebBench 5.0 (128-bit US version) is an industrystandard benchmark for Web server software and hardware. It uses PC clients to send Web requests to a server under test. It generates performance results by incrementally increasing the number of clients making HTTP 1.0 GET requests to the Web server; the result is a curve showing the server’s performance under increasing load. The peak of that curve represents 2 the peak throughput of the server. WebBench reports both the total number of requests per second the server handled and the server’s total throughput in bytes per second. LoadGen LoadGen is an industry-standard tool for benchmarking an Exchange 2007 Mail Server. LoadGen performs tasks to simulate a standard user generating mail activity. When the workload finishes, LoadGen reports the response time, which is the number of seconds necessary to complete the task. SysBench The developers at SourceForge.net (www.sourceforge.net) created SysBench to test various aspects of the performance of servers running database systems. The benchmark’s original target was the MySQL database system (www.mysql.com), but this version worked with Microsoft SQL Server 2005 Enterprise Edition (www.microsoft.com/sql/editions/enterprise/default.mspx). SysBench created a 100,000-row SQL database and executed a batch of online transaction processing (OLTP) transactions against that data. Test results For testing, we staggered the starting times of the benchmarks to allow each server to ramp up slowly. We began the benchmarks in the following order: WebBench, SysBench, and Microsoft LoadGen. Figure 4 shows a timeline for the benchmark runs. To obtain the final results, we removed the first parts of the WebBench and SysBench runs, and computed the results based on the 30 minutes of peak performance during the LoadGen run. To make sure both servers achieved their optimum results, we allowed them to sit idle for 35 minutes before starting the workload. Multiple benchmark timeline 45 minutes total time 00:00 00:05 00:10 00:15 00:20 00:25 00:30 00:35 00:40 00:45 WebBench SysBench LoadGen Figure 4: The timeline we followed when starting the benchmarks for the multiple-benchmark runs on all servers. The shaded areas from 00:15 to 00:45 represent the period during which we measured performance. Figure 5 presents results for the servers on the three benchmarks relative to the lower-performing server, the HP ProLiant ML370 G5. For each benchmark, we assigned a value of 100 percent to that server’s results and then calculated the percentage performance improvement of the Dell PowerEdge T605. This approach makes each data point a comparative number, with higher numbers indicating better performance. Finally, we took the percentage performance improvement over the HP ProLiant ML370 G5 for the three benchmarks and averaged them. As Figure 5 shows, the Dell PowerEdge T605 running Windows Server 2008 achieved better performance on all benchmarks than the HP ProLiant ML370 G5. Each result is the median of three runs. With the exception of CPU utilization, all results are relative to the HP ProLiant ML370 G5. We used LoadGen to determine the median for all runs. Principled Technologies, Inc.: Dell PowerEdge T605 with AMD Opteron 2384 and HP ProLiant ML370 G5 Server with Intel Xeon E5450 comparison 3 Server Web requests per second Email response time Database transactions per second Average of Web, email, and database scores 93.8% 1.10 1.58 1.57 1.41 90.5% 1.00 1.00 1.00 1.00 Percentage CPU utilization Dell PowerEdge T605 HP ProLiant ML370 G5 Figure 5: Performance for the servers on the three benchmarks, relative to the HP ProLiant ML370 G5. Higher numbers are better. WebBench results We ran WebBench’s default ecommerce API test suite, which generates both secure and non-secure static and dynamic HTTP 1.0 GET requests. While running the ecommerce suite, the clients must negotiate to a secure Web server port using the Secure Socket Layer (SSL) protocol. A default WebBench test suite incrementally increases the number of clients making the HTTP 1.0 GET requests to the Web server. As the workload increases the number of clients, the Web server’s processor utilization also increases, until the clients saturate the processor in the Web server with work. Each workload point with a fixed number of clients is a WebBench “mix.” The ecommerce API test suite begins with a mix that involves one client; the next mix involves four clients; and each subsequent mix increases the number of clients by four. We modified the test suite so it would run 12 clients, with 10 engines per client for the entire test. This allowed us to keep a constant Web load on the server. We performed only 9 mixes for testing to limit the amount of time WebBench ran. A WebBench run reports the total requests per second a server can perform and the total throughput, in bytes per second, that the server delivered. WebBench reports these results for each mix. To obtain the results we list in Figure 6, we averaged the requests per second and throughput from the mixes that ran during the peak performance of the benchmark run, as Figure 4 illustrates. Figure 6 shows the WebBench peak results in requests per second and in throughput (bytes per second) for the test servers. Each result is the median of three runs. Server Dell PowerEdge T605 HP ProLiant ML370 Throughput (bytes per second) Requests per second (raw) 196,359,248.5 179,205,510.6 12,381.6 11,306.9 Requests per second (relative to HP ProLiant ML370 G5) 1.10 1.00 Figure 6: Median WebBench results for the two servers. Higher numbers are better. LoadGen results LoadGen results show the response time each for each server, which is the time in milliseconds it took to complete a request. Because the object of the server is to handle as many requests as possible, lower scores, which show a server able to handle more requests in a given time, are better. Because the results are in response time for each task, we created a weighted average to calculate a final score. To create a weighted average, we used a similar procedure as the one that Microsoft Exchange Server 2003 Load Simulator (LoadSim) uses. (Note: LoadSim is an older tool for testing Exchange Mail Servers; Microsoft has replaced it with LoadGen.) Figure 7 shows the weighted average we used for testing. Principled Technologies, Inc.: Dell PowerEdge T605 with AMD Opteron 2384 and HP ProLiant ML370 G5 Server with Intel Xeon E5450 comparison 4 Task name BrowseCalendar Logon Logoff SendMail ReadAndProcessMessages MoveMail DeleteMail ExportMail CreateFolder PublicFolderPost BrowsePublicFolder PostFreeBusy RequestMeeting MakeAppointment Total Weight 1 0 0 1 53 0 0 0 0 0 0 2 0 0 Task name BrowseContacts CreateContact BrowseTasks CreateTask EditRules DownloadOab EditSmartFolders SynchronizeFolders Search InitializeMailbox UserInit UserTerm ModuleInit ModuleTerm Weight 0 2 0 1 0 0 0 0 0 0 0 0 0 0 60 Figure 7: Weighted average for LoadGen tasks. Users usually run LoadGen tests on servers with large disk storage systems, i.e., a large number of total disk drives. Because our testing focused on small business servers, which do not typically have a large number of disks, the scaling between the servers was not as good as the scaling on the other benchmarks. For testing, we used 200 Microsoft Exchange mailboxes; both servers could handle the load while performing other tasks. Figure 8 shows the average response time for both servers. Each result is the median of three runs. Server Dell PowerEdge T605 HP ProLiant ML370 G5 Average response time (in seconds) Median 95th percentile (relative to HP ProLiant ML370 G5) 94.9 1.58 224.7 1.00 Figure 8: Median LoadGen results for the two servers. Lower response time is better. SysBench results For testing, we created a script so each system would perform as many transactions as possible in a given time. The script processed 10,000 transactions as quickly as possible and then started over again. The output shows the completion time in seconds for each group of 10,000 transactions. We calculated the transactions per second by using the following formula: total transactions = transactions per second time in seconds Figure 9 shows the median SysBench results and processor utilization for the two test servers. Each result is the median of three runs. Principled Technologies, Inc.: Dell PowerEdge T605 with AMD Opteron 2384 and HP ProLiant ML370 G5 Server with Intel Xeon E5450 comparison 5 Server Completion time (seconds) Transactions completed Transactions per second 30:00 30:00 1,426,233.0 909,568.0 792.4 505.3 Dell PowerEdge T605 HP ProLiant ML370 Transactions per second (relative to HP ProLiant ML370 G5) 1.57 1.00 Figure 9: Median SysBench results for the two servers. Higher numbers are better. Test methodology Figure 10 summarizes some key aspects of the configurations of the two server systems; Appendix B provides detailed configuration information. Server Dell PowerEdge T605 HP ProLiant ML370 G5 Processor frequency (GHz) Front-side bus frequency Motherboard chipset RAM (32 GB in each) 2.70 1,000 MHz HyperTransport Broadcom HT 2100 and HT 1000 8 x 4GB PC2-6400 3.00 1,333 MHz Intel 5000P 8 x 4GB PC2-5300 Hard drive 4 x 73GB Broadcom BCM5708C NetXtreme II GigE 4 x 73GB Broadcom BCM5708C NetXtreme II GigE NICs Figure 10: Key aspects of the server configurations. PT configured both servers (with Dell’s approval), and PT purchased them. Installing and configuring the OS We began our testing by installing a fresh copy of Windows Server 2008, Enterprise x64 Edition on each server. We followed this process for each installation: 1. At the Language Selection Screen, click Next. 2. Click Install Now. 3. Select Windows Server 2008 Enterprise without Hyper-V (Full Installation) x64, and click Next. 4. Click the I accept the license agreement check box, and click Next. 5. Click Custom. 6. Click Next. 7. At the warning that the user’s password must be changed before entering the OS, click OK. 8. Type Password1 as the new password. 9. At the Your password has been changed screen, click OK. Installing system updates We installed the following updates using Microsoft Windows update feature: Security Update for Windows Server 2008 x64 Edition (KB958687) Update for Windows Server 2008 x64 Edition (KB957388) Security Update for Windows Server 2008 x64-based Systems (KB938464) Update for Windows Server 2008 Server Manager x64 Edition (KB940518) Update for Windows Server 2008 x64 Edition (KB949189) Security Update for Windows Server 2008 x64 Edition (KB955069) Cumulative Security Update for ActiveX Killbits for Windows Server 2008 x64 Edition (KB956391) Security Update for Windows Server 2008 x64 Edition (KB954459) Security Update for Windows Server 2008 x64 Edition (KB957097) Security Update for Windows Server 2008 x64 Edition (KB958623) Update for Windows Server 2008 x64 Edition (KB959130) Principled Technologies, Inc.: Dell PowerEdge T605 with AMD Opteron 2384 and HP ProLiant ML370 G5 Server with Intel Xeon E5450 comparison 6 Cumulative Security Update for Internet Explorer 7 in Windows Server 2008 x64 Edition (KB958215) Update for Windows Server 2008 x64 Edition (KB957200) Security Update for Windows Server 2008 x64 Edition (KB953733) Security Update for Windows Server 2008 x64 Edition (KB950762) Update for Windows Server 2008 x64 Edition (KB955839) Security Update for Windows Server 2008 x64 Edition (KB958624) Security Update for Windows Server 2008 x64 Edition (KB950974) Update for Windows Server 2008 x64 Edition (KB951978) Update for Windows Server 2008 for x64-based Systems (KB955020) Security Update for Windows Server 2008 x64 Edition (KB954211) Windows Malicious Software Removal Tool x64 – January 2009 (KB890830) Security Update for Windows Mail for Windows Server 2008 x64 Edition (KB951066) Security Update for Windows Server 2008 x64 Edition (KB956841) Security Update for Windows Server 2008 x64 Edition (KB956802) Update for Windows Server 2008 x64 Edition (KB957321) Update for Windows Server 2008 x64 Edition (KB952287) Security Update for Windows Server 2008 x64 Edition (KB958644) Security Update for Internet Explorer 7 in Windows Server 2008 x64 Edition (KB960714) Security Update for Windows Server 2008 x64 Edition (KB951698) Update for Windows Server 2008 x64 Edition (KB950050) Update for Windows Server 2008 x64 Edition (KB955302) Windows Update Agent 7.2.6001.788 General OS settings 1. 2. 3. 4. 5. Open the control panel. Double-click User Accounts. Click Turn User Account Control on or off. Beside Use User Account Control (UAC), uncheck the check box. Reboot the system. Installing and configuring the mail server Setting up the Active Directory 1. Click StartAdministrative ToolsServer Manager. 2. Click Roles on the left side. 3. Click Add Roles. 4. Click the Skip this page by default check box, and click Next. 5. Click the Active Directory Domain Services check box, and click Next. 6. Click Next. 7. Click Install. 8. Click Close. Assigning static IPs to the NICs 1. Click StartNetwork. 2. Click Network and Sharing Center. 3. Click Manage Network Connections. 4. Right-click Local Area Connection. 5. Click Properties. 6. Click Internet Protocol Version 4 (TCP/IPv4), and click Properties. 7. Select Use the following IP Address, and input the following numbers: IP Address: 192.168.1.1 Subnet mask: 255.255.255.0 8. Repeat steps 4 through 7 for Local Area Connection 2 and Local Area Connection 3 using the following IP information for each: Principled Technologies, Inc.: Dell PowerEdge T605 with AMD Opteron 2384 and HP ProLiant ML370 G5 Server with Intel Xeon E5450 comparison 7 Local Area Connection 2: IP Address: 10.1.1.250 Subnet mask: 255.255.255.0 Local Area Connection 3: IP Address: 10.1.2.250 Subnet mask: 255.255.255.0 Setting up the domain 1. Click Start, type cmd in the prompt, and press Enter. 2. Type dcpromo, and press Enter. 3. Click Next. 4. Click Next. 5. Click Next. 6. Select Create a new domain in a new forest, and click Next. 7. Type pender.lan as the FQDN (Fully Qualified Domain Name), and click Next. 8. Set the forest functional level to Windows Server 2003, and click Next. 9. Set the domain functional level to Windows Server 2003, and click Next. 10. Leave defaults on the Additional Domain Controller Options screen, and click Next. 11. If a warning window appears asking about dynamically assigned IP addresses, click Yes. 12. Click Yes to continue. 13. Leave defaults at the Location for Database, Log Files, and SYSVOL screen; and click Next. 14. Type Password1 at the Directory Services Restore Mode Administrator Password screen. 15. At the summary screen, click Next. 16. Click Finish. 17. Click Restart now. Setting up the Application Server 1. Click StartAdministrative ToolsServer Manager. 2. Click Roles on the left side. 3. Click Add Roles. 4. Click the Application Server check box. 5. When the Add features required for Application Server? screen appears, click Add Required Features. 6. Click Next. 7. Click Next 8. At the Select Role Services page for Application Server, click the Web Server (IIS) Support check box. 9. When the Add features required for Web Server (IIS) Support? screen appears, click Add Required Features. 10. Click Next. 11. Click Next. 12. At the Select Role Services page for Web Server (IIS), click IIS 6 Management Compatibility, ASP, and CGI check boxes; and click Next. 13. Click Install. 14. Click Close. Installing Microsoft Exchange 1. Click StartAdministrative ToolsServer Manager. 2. Click Features. 3. Click Add Features. 4. Select check box Windows PowerShell, and select Next. 5. Click Install. 6. Click Close. 7. Run Exchange 2007 SP1 install.exe. 8. Type C:\exc in the choose directory for extracted files text prompt. 9. Click OK. 10. Click OK. Principled Technologies, Inc.: Dell PowerEdge T605 with AMD Opteron 2384 and HP ProLiant ML370 G5 Server with Intel Xeon E5450 comparison 8 11. 12. 13. 14. 15. 16. 17. 18. 19. 20. 21. 22. In the C:\exc folder, double-click setup.exe. Click Step 4 Install Microsoft Exchange Server 2007 SP1. Click Next. Accept License agreement, and click Next. Click Next. Select Typical Exchange Server installation, and click Next. At the Exchange organization screen, click Next. At the Client settings screen, click Next. After the system finishes the readiness check, click Install. Click Finish. Click OK. Restart the system. Enabling Circular Logging 1. Click StartAll ProgramsMicrosoft Exchange Server 2007Exchange Management Console. 2. Expand Server Configuration, and click Mailbox. 3. Right-click First Storage Group, and click Properties. 4. Check the box beside Enable circular logging, and click OK. Disabling Maintenance Schedule 1. Click StartAll ProgramsMicrosoft Exchange Server 2007Exchange Management Console. 2. Expand Server Configuration, and click Mailbox. 3. Right-click Mailbox Database, and click Properties. 4. Click Customize. 5. Double-click the empty gray box above Sunday. 6. Ensure that all cells on the graph turn white, and click OK. 7. Click OK. Installing and configuring the Web server Deploying WebBench data WebBench includes data that must reside on the server and that the Web server must use. We used the following procedure to load that data and set the Web server to use it: 1. Copy the file wbtree.exe from the WebBench CD to the wwwroot directory on the server under test. (The wbtree.exe file is on the WebBench CD at \wb50\workload. The wwwroot directory is located at C:\inetpub\wwwroot). 2. On the server, execute the wbtree.exe file. This program copies the WebBench workload to the server. 3. In the wwwroot folder on the server, create a new folder with the name CGI-BIN. 4. Copy the file simisapi.dll to the CGI-BIN folder. 5. Click StartProgramsAdministrative ToolsComputer Management to open the management console. 6. Go to Services and ApplicationInternet Information Services (IIS) ManagerServerName. 7. Double-click ISAPI and CGI Restrictions. 8. Click Add. 9. Enter the path for the simisapi.dll, and click the check box saying Allow extension path to execute. 10. Click OK. Configuring Internet Information Services (IIS) We configured the Windows Internet Information Services Web server as follows: 1. Open Computer Management. 2. Go to Services and ApplicationsInternet Information Services (IIS) ManagerServerName. 3. Double-click MIME Types. 4. In the MIME Types window, click Add. 5. In the Extension field, type *. 6. In the MIME Type field, type application/octet-stream, and click OK. 7. Double-click the server name on the left side of the window. 8. Double-click ISAPI and CGI Restrictions. Principled Technologies, Inc.: Dell PowerEdge T605 with AMD Opteron 2384 and HP ProLiant ML370 G5 Server with Intel Xeon E5450 comparison 9 9. 10. 11. 12. 13. 14. Click Edit Feature Settings. Click the check boxes beside Allow unspecified CGI module and Allow unspecified ISAPI modules. Click OK. Go to Services and ApplicationsInternet Information Services (IIS) ManagerServerName. Double-click Logging. Click Disable. Installing certificate services Because WebBench includes tests that involve security, we installed Windows Certificate Services as follows: 1. Go to Services and ApplicationsInternet Information Services (IIS) ManagerServerName. 2. Double-click Server Certificates. 3. Click Create Self-Signed Certificate. 4. Name it Performance, and click OK. 5. Go to Services and ApplicationInternet Information Services (IIS) ManagerServerName SitesDefault Web Site. 6. Click Bindings... 7. Click the https entry, and click Edit. 8. Set the SSL Certificate to Performance, and click OK. 9. Click Add. 10. Set the type to http, and set the IP address to 192.168.1.1. 11. Set the Port to 81, and click OK. 12. Click Add. 13. Set the type to https, and set the IP address to 192.168.1.1. 14. Set the SSL Certificate to Microsoft Exchange. 15. Set the Port to 444, and click OK. 16. If a warning pops up, click Yes. 17. Click OK. 18. Double-click SSL settings. 19. Uncheck the Require SSL check box. 20. Click Apply. Creating SSL Communication We enabled SSL communication as follows: 1. Go to Services and ApplicationsInternet Information Services (IIS) ManagerServerName. 2. Expand the Default Web site. 3. Expand wbtree. 4. Click Wbssl. 5. Double-click SSL Settings. 6. Check Require SSL. 7. Check Require 128-bit SSL. 8. Click Apply. We then set the following operating system tuning parameters for optimum WebBench performance. When creating the following parameters, ensure that they are DWORD files, with decimal coding (rather than hexadecimal): HKLM\System\CurrentControlSet\Services\Inetinfo\Parameters\MaxCachesFileSize to 1048576 HKLM\System\CurrentControlSet\Services\HTTP\Parameters\UriMaxUriBytes to 1048576 HKLM\System\CurrentControlSet\Control\FileSystem\NtfsDisableLastAccess to 1 HKLM\System\CurrentControlSet\Services\Tcpip\Parameters\MaxHashTableSize to 65535 Principled Technologies, Inc.: Dell PowerEdge T605 with AMD Opteron 2384 and HP ProLiant ML370 G5 Server with Intel Xeon E5450 comparison 10 Installing and configuring the database server Installing Microsoft SQL Server 2005 1. Insert the SQL Server 2005 CD into the server. 2. Click the Server Components link under the Install section to begin the installation. 3. Accept the license agreement, and click Next. 4. Click Install to install the prerequisites. 5. After the Prerequisites complete installing screen, click Next. 6. At the Welcome screen, click Next. 7. At the System Configuration Check, assuming everything has a status of success, click Next. 8. Enter the registration information, and click Next. 9. At the Components to Install screen, select SQL Server Database Services and Workstation Components, Books Online and development tools. 10. Click Advanced, and click Next. 11. Click Next to start the installation. 12. For Instance Name, leave the default option, and click Next. 13. At the Service Account screen, select Use the built-in system account (Local system), and click Next. 14. Keep the default option for Authentication Mode, and click Next. 15. For Collation Settings, leave the defaults, and click Next. 16. Accept the default Error and Usage Report Settings, and click Next. 17. At the Ready to Install screen, click Install to begin the installation. 18. When the installation software prompts you to do so, insert Microsoft SQL Server 2005 disk 2, and click OK. 19. If a compatibility error occurs during the installation, click Run program. 20. When the setup process completes, click Next. 21. Click Finish to complete the installation. Download and install Service Pack 3 for Microsoft SQL Server 2005 Service Pack 3 is available for download from http://www.microsoft.com/downloads/details.aspx?FamilyID=ae7387c3-348c-4faa-8ae5949fdfbe59c4&displaylang=en. 1. Run SQLServer2005SP3-KB955706-x64-ENU.exe. 2. At the Welcome screen, click Next. 3. At Accept the License Agreement, click Next. 4. At the Feature Selection screen, keep the defaults, and click Next. 5. At the Authentication screen, click Next. 6. At the Error and Usage Reporting Settings screen, click Next. 7. At the Running Processes screen, click Next. 8. Click Install. 9. If a compatibility error occurs during the installation, click Run program. 10. Click Next. 11. At the Installation Complete screen, click Next. 12. Click Finish. 13. Reboot the system. Creating the test database and generating data 1. Select StartAll ProgramsMicrosoft SQL Server 2005SQL Server Management Studio. 2. Type the server name in the Connect to Server window. 3. Click Connect to connect to the server. 4. Right-click the Databases folder in the left window, and select New Database from the pop-up menu. 5. In the Database name field, type sbtest, and click OK. 6. Open a command prompt by selecting StartRun, type cmd, and click OK. 7. In the command prompt, type cd c:\ to change to C:\. 8. To prepare the database, type sysbench.exe --test=oltp --oltp-table-size=100000 prepare, and press Enter. 9. When the command finishes, the C:\ prompt appears. Principled Technologies, Inc.: Dell PowerEdge T605 with AMD Opteron 2384 and HP ProLiant ML370 G5 Server with Intel Xeon E5450 comparison 11 10. Type exit, and press Enter to close the command prompt. 11. In SQL Server 2005 Management Studio, stop the database service by right-clicking Server in the left windowpane, and then select Stop from the drop-down menu. 12. Using Windows Explorer, create the folder C:\backup. 13. With Windows Explorer, copy all sbtest files from C:\Program File\Microsoft SQL Server\MSSQL.1\ MSSQL\Data\ to c:\sysbench_backup. (You should see two files: sbtest.mdf and sbtest_log.ldf.) 14. Once the copy completes, close Windows Explorer. 15. Restart the database service using SQL Server 2005 Management Studio by right-clicking server and selecting Start. Installing the mail test client We began our testing by installing a fresh copy of Microsoft Windows Server 2003 R2, Enterprise x64 Edition Service Pack 2 on the test client. Before following these instructions, make sure to statically assign an IP address for the client, and then plug that port into the system under test. This allows the client to correctly join the domain. We followed this process for each installation: 1. Assign a computer name of Clientx for the mail client, where x is the client number. 2. For the licensing mode, use the default setting of five concurrent connections. 3. For the administrator log on, enter a password. 4. Select Eastern Time Zone. 5. Use typical settings for the Network installation. 6. Assign a name of Testbed for the workgroup. To set up this server, we had to install several additional software components. The following subsections detail the necessary installation processes. Joining the domain 1. Right-click My Computer, and select Properties. 2. Under the Computer Name tab, click Change. 3. In the Computer Name Changes window, under the Member of section, select the Domain radial box, and type pender. 4. To start joining the domain, select OK. 5. When the window appears asking for a person qualified on the domain, type Administrator as the username and Password1 as the password. 6. At the Welcome pop-up window and the window warning that you must reset the computer for the changes to take effect, click OK. 7. At the System Properties window, click OK. 8. When a pop-up appears asking if you want to restart now, click Yes. Installing Internet Information Services 6.0 1. Select StartControl PanelAdd or Remove Programs. 2. Click Add/Remove Windows Components. 3. Select Application Servers, and click Details. 4. Click Active Directory Services, and make sure a check appears in the check box. 5. Select Internet Information Services (IIS), and click Details. 6. Click NNTP Services and SMTP Services, make sure a check appears in both check boxes, and click OK. 7. Click OK to close the Application Server window. 8. At the Windows Components Wizard, click Next to begin the installation. 9. When the system prompts you to do so, insert the OS CD, and click OK. 10. At the Completing the Windows Components Wizard window, click Finish. 11. Close the Add or Remove Programs window. Installing Exchange Server 2007 and Load Generator 1. Insert the Microsoft Exchange Server 2007 CD. The CD should automatically launch the installation software. 2. Click the link to Step 1: Install .NET Framework 2.0. Principled Technologies, Inc.: Dell PowerEdge T605 with AMD Opteron 2384 and HP ProLiant ML370 G5 Server with Intel Xeon E5450 comparison 12 3. 4. 5. 6. 7. 8. 9. 10. 11. 12. 13. 14. 15. 16. When you arrive at the download link, download the x64 version of the .NET Framework, and install. Click the link to Step 3: Install Microsoft Windows PowerShell to go to the download link. When you arrive at the download link, download Microsoft Windows PowerShell, and install with defaults. Search for and then download .NET 2.0 SP1 x64. Install SP1 with all defaults. Click the link to Step 4: Install Microsoft Exchange Server 2007 SP1. Click Next to go past the introduction screen. Accept the license agreement, and click Next. Select No for error reporting, and click Next. Select Custom Exchange Server Installation, and click Next. Check Management Tools, and click Next. After the check finishes, click Install to start the installation process. Once the installation completes, click Finish. Download and install Load Generator using all defaults. Preparing Load Generator 1. Select StartAll ProgramsMicrosoft ExchangeExchange Load Generator. 2. When the Load Generator window appears, select Start a new test. 3. Select Create a new test configuration, and click Continue. 4. In the Specify test settings window, type Password1 as the Directory Access Password and Mailbox Account Master Password, and click Continue with recipient management. 5. Make 200 users in the Mailbox Database, and click Continue. 6. To accept defaults for Advanced recipient settings, click Continue. 7. In the Specify test user groups window, select the plus sign (+) to add a user group. 8. Change the Client Type to Outlook 2007 Cached and the Action Profile to Average, and click Continue. 9. Leave defaults in Remote configurations, and click Continue. 10. Click Save the configuration file as, and name it PenderAverage.cfg. 11. Click Start the initialization phase (recommended before running the test) to start initialization. The initialization process might take a few hours. Backing up the mail database On the test server, once you have set up LoadGen and created its initial mail database, you need to back up that database so you can have clean copies for each test. Use this process to back up that database: 1. Select StartAll ProgramsMicrosoft Exchange Server 2007Exchange Management Console in the mail server. 2. In the left pane, under Server Configuration, click Mailbox. 3. In the right pane, right-click Mailbox Database, and select Dismount Database from the menu. 4. On the Do you want to continue? pop-up message, click Yes. 5. Right-click Public Folder Database, and select Dismount Database from the menu. 6. On the Do you want to continue? pop-up message, click Yes. The red arrow appears when you have dismounted the Public Folder Store. 7. Using Windows Explorer, create two new folders: C:\backup\mailstore and C:\backup\publicstore. 8. With Windows Explorer, copy all files from C:\Program Files\Microsoft\Exchange Server\Mailbox\First Storage Group to C:\backup\mailstore, and all the files from C:\Program Files\Microsoft\Exchange Server\Mailbox\Second Storage Group to C:\backup\publicstore. This process may take several minutes. 9. Close Windows Explorer. 10. In Exchange Management Console, right-click Mailbox Database, and select Mount Database from the menu. 11. Right-click the Public Folder Database, and select Mount Database from the menu. 12. Close Exchange System Manager. Running the test Running WebBench 1. Restart the Web Controller. 2. On the desktop, double-click the Web Controller shortcut. Principled Technologies, Inc.: Dell PowerEdge T605 with AMD Opteron 2384 and HP ProLiant ML370 G5 Server with Intel Xeon E5450 comparison 13 3. 4. 5. 6. 7. 8. 9. 10. 11. Go to the top bar, and click ClientsStart Log In… Restart all of the Web Clients. Wait for all of the Web Clients to appear on the left side of the WebBench Controller Program. Click OK. When the application prompts you to add a test suite, click Yes. Select 45minute_Pender 12 client ecommerce_api_template.tst. Give the run an appropriate name (e.g., Pender_WB_Run1). Click OK. When the Would you like to start executing the test suites? Screen appears, do not click Yes or No. Instead, leave the screen. Running LoadGen 1. Restart the Mail Client. 2. Leave the screen sitting when it boots up. Running SysBench 1. Restart the system under test (SUT). 2. Let the SUT idle for 10 minutes. 3. Run c:\SBSbench_run1.cmd. 4. When the script tells you to, start WebBench. 5. LoadGen and SysBench will begin automatically in the next 15/30 minutes, respectively. 6. Run the restore_all script between each run. Network test bed configuration To generate the workload, we used a network with 14 client PCs. We split 12 of the clients into two segments, or subnets, of 4 clients each. We configured these clients with Windows XP Professional with Service Pack 2 and all critical updates available as of June 7, 2007. We connected each segment to the server under test via one NETGEAR GS724T Gigabit Smart Switch. To balance the load on the server and to prevent a network throughput bottleneck, we connected each segment to a separate network port. We used the remaining two clients for the WebBench controller and LoadGen client. Principled Technologies, Inc.: Dell PowerEdge T605 with AMD Opteron 2384 and HP ProLiant ML370 G5 Server with Intel Xeon E5450 comparison 14 Appendix A – Price information Figure 11 provides the list price information for the test systems as of January 13, 2009. Prices exclude tax and shipping costs. System Price as of January 13, 2009 Dell PowerEdge T605 HP ProLiant ML370 G5 $6,951 $7,831 Figure 11: List price information for the test systems. Prices exclude tax and shipping costs. Principled Technologies, Inc.: Dell PowerEdge T605 with AMD Opteron 2384 and HP ProLiant ML370 G5 Server with Intel Xeon E5450 comparison 15 Appendix B – Test system configuration information Figure 12 provides detailed configuration information about each of the test server systems, which we list in alphabetical order. Servers General Number of processor packages Number of cores per processor package Number of hardware threads per core System power management policy CPU Vendor Name Stepping Socket type Core frequency (GHz) Front-side bus frequency L1 cache L2 cache Platform Vendor and model number Motherboard chipset BIOS name and version BIOS settings Memory module(s) Vendor and model number Type Speed (MHz) Speed in the system currently running @ (MHz) Timing/latency (tCL-tRCD-iRPtRASmin) Size (MB) Number of RAM modules Chip organization Channel Hard disk Vendor and model number Number of disks in system Size (GB) Buffer size (MB) RPM Type Controller Controller driver Operating system Dell PowerEdge T605 HP ProLiant ML370 G5 2 2 4 4 1 1 Balanced Balanced AMD AMD Opteron 2384 2 Socket F 2.70 1,000 MHz HyperTransport 64 KB + 64 KB (per core) 2 MB (4 x 512 KB) Intel Intel Xeon E5450 A Socket 771 LGA 3.00 1,333 MHz 32 KB + 32 KB (per core) 12 MB (2 x 6,144 KB) Dell 0TP407 Broadcom HT 2100 and HT 1000 Dell 3.0.2 (09/29/2008) Default HP 013046-001 Intel 5000P HP P57 (09/29/2008) Default Samsung M393T5160QZA-CF7 PC2-6400 800 Samsung M395T5160QZ4-CE66 PC2-5300 666 800 666 6-6-6-18 5-5-5-15 32,762 8 x 4,096 MB Double-sided Dual 32,768 8 x 4,096 MB Double-sided Dual Seagate ST373455SS 4 73 16 15,000 SAS Dell PERC 6/I Adapter RAID Controller Dell 2.23.0.64 (07/01/2008) Seagate ST973451SS 4 73 16 15,000 SAS Smart Array P400 Controller HP 6.12.4.64 (3/31/2008) Principled Technologies, Inc.: Dell PowerEdge T605 with AMD Opteron 2384 and HP ProLiant ML370 G5 Server with Intel Xeon E5450 comparison 16 Servers Name Build number Service Pack Microsoft Windows update date File system Kernel Language Microsoft DirectX version Graphics Vendor and model number Chipset BIOS version Type Memory size (MB) Resolution Driver Dell PowerEdge T605 HP ProLiant ML370 G5 Windows Server 2008 Enterprise x64 Edition 6001 SP1 January 15, 2009 NTFS ACPI X64-based PC English 10 Windows Server 2008 Enterprise x64 Edition 6001 SP1 January 15, 2009 NTFS ACPI X64-based PC English 10 ATI ES 1000 ATI ES 1000 BK-ATI VER008.005.032.000 Integrated 32 1,024 x 768 x 32-bit ATI Technologies Inc. 8.240.50.3000 (1/21/2008) ATI ES 1000 ATI ES 1000 BK-ATI VER008.005.013.000 Integrated 32 1,024 x 768 x 32-bit ATI Technologies Inc. 8.240.50.3000 (1/21/2008) Broadcom BCM5708C NetXtreme II GigE Integrated 4.4.15.0 (5/14/2008) Intel PRO/1000 PT Dual Port Server Adapter 9.12.36.0 (12/04/2008) Broadcom BCM5708C NetXtreme II GigE Integrated 4.4.15.0 (5/14/2008) Intel PRO/1000 PT Dual Port Server Adapter 9.12.36.0 (12/04/2008) TSSTcorp DVD+RW TS-H653F DVD-RW SCSI HL-DT-ST DVD-ROM GDR-H30N DVD-ROM IDE 7 2.0 4 2.0 Network card/subsystem Vendor and model number Type Driver Additional network adapter Driver Optical drive Vendor and model number Type Interface USB ports Number of ports Type of ports (USB 1.1, USB 2.0) Figure 12: Detailed system configuration information for the two servers. Principled Technologies, Inc.: Dell PowerEdge T605 with AMD Opteron 2384 and HP ProLiant ML370 G5 Server with Intel Xeon E5450 comparison 17 About Principled Technologies We provide industry-leading technology assessment and fact-based marketing services. We bring to every assignment extensive experience with and expertise in all aspects of technology testing and analysis, from researching new technologies, to developing new methodologies, to testing with existing and new tools. When the assessment is complete, we know how to present the results to a broad range of target audiences. We provide our clients with the materials they need, from market-focused data to use in their own collateral to custom sales aids, such as test reports, performance assessments, and white papers. Every document reflects the results of our trusted independent analysis. We provide customized services that focus on our clients’ individual requirements. Whether the technology involves hardware, software, Web sites, or services, we offer the experience, expertise, and tools to help you assess how it will fare against its competition, its performance, whether it’s ready to go to market, and its quality and reliability. Our founders, Mark L. Van Name and Bill Catchings, have worked together in technology assessment for over 20 years. As journalists, they published over a thousand articles on a wide array of technology subjects. They created and led the Ziff-Davis Benchmark Operation, which developed such industry-standard benchmarks as Ziff Davis Media’s Winstone and WebBench. They founded and led eTesting Labs, and after the acquisition of that company by Lionbridge Technologies were the head and CTO of VeriTest. Principled Technologies, Inc. 1007 Slater Road, Suite 250 Durham, NC 27703 www.principledtechnologies.com [email protected] Principled Technologies is a registered trademark of Principled Technologies, Inc. All other product names are the trademarks of their respective owners. Disclaimer of Warranties; Limitation of Liability: PRINCIPLED TECHNOLOGIES, INC. HAS MADE REASONABLE EFFORTS TO ENSURE THE ACCURACY AND VALIDITY OF ITS TESTING, HOWEVER, PRINCIPLED TECHNOLOGIES, INC. SPECIFICALLY DISCLAIMS ANY WARRANTY, EXPRESSED OR IMPLIED, RELATING TO THE TEST RESULTS AND ANALYSIS, THEIR ACCURACY, COMPLETENESS OR QUALITY, INCLUDING ANY IMPLIED WARRANTY OF FITNESS FOR ANY PARTICULAR PURPOSE. ALL PERSONS OR ENTITIES RELYING ON THE RESULTS OF ANY TESTING DO SO AT THEIR OWN RISK, AND AGREE THAT PRINCIPLED TECHNOLOGIES, INC., ITS EMPLOYEES AND ITS SUBCONTRACTORS SHALL HAVE NO LIABILITY WHATSOEVER FROM ANY CLAIM OF LOSS OR DAMAGE ON ACCOUNT OF ANY ALLEGED ERROR OR DEFECT IN ANY TESTING PROCEDURE OR RESULT. IN NO EVENT SHALL PRINCIPLED TECHNOLOGIES, INC. BE LIABLE FOR INDIRECT, SPECIAL, INCIDENTAL, OR CONSEQUENTIAL DAMAGES IN CONNECTION WITH ITS TESTING, EVEN IF ADVISED OF THE POSSIBILITY OF SUCH DAMAGES. IN NO EVENT SHALL PRINCIPLED TECHNOLOGIES, INC.’S LIABILITY, INCLUDING FOR DIRECT DAMAGES, EXCEED THE AMOUNTS PAID IN CONNECTION WITH PRINCIPLED TECHNOLOGIES, INC.’S TESTING. CUSTOMER’S SOLE AND EXCLUSIVE REMEDIES ARE AS SET FORTH HEREIN. Principled Technologies, Inc.: Dell PowerEdge T605 with AMD Opteron 2384 and HP ProLiant ML370 G5 Server with Intel Xeon E5450 comparison 18