1
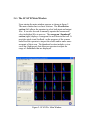
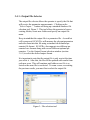
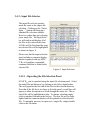
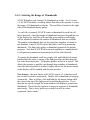
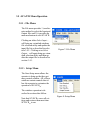
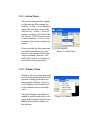
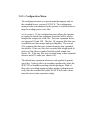
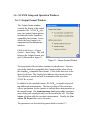
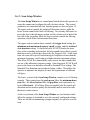
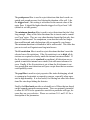
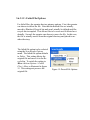
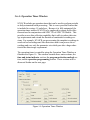
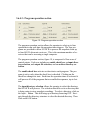
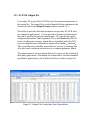
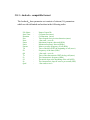
SCAN’R
tm
Snapshot Characterization and Analysis
Version 1.6
Software Manual
Copyright 2005-2009 Binary Acoustic Technology.
All Rights Reserved.
This software and documentation are copyrighted by Binary Acoustic
Technology, doing business under the trademark SCAN’Rtm. The
software and documentation are licensed, not sold, and may be used
or copied only in accordance with the SCAN’Rtm License Agreement
accompanying the software and/or reprinted in this document. This
software embodies valuable trade secrets proprietary to Binary
Acoustic Technology.
All trademarks referenced in this document are the property of their
respective owners.
Specifications subject to change without notice.
Copyright 2005-2009 Binary Acoustic Technology LLC. All rights
reserved worldwide. No part of this publication may be reproduced,
stored in a retrieval system, or transmitted, in any form or by any
means, electronic, mechanical, photocopying, recording, scanning,
digitizing, or otherwise, without the prior consent of Binary Acoustic
Technology LLC.
How to contact us
Binary Acoustic Technology is a web-based business.
Web:
www.binaryacoustictech.com
E-Mail : [email protected]
SCAN’Rtm LICENSE AGREEMENT
This user license agreement (the "AGREEMENT") is an agreement between you (individual or single entity)
and Binary Acoustic Technology LLC, for the SCAN’Rtm software (the "SOFTWARE") that is accompanying this AGREEMENT. USE OF THIS PRODUCT CONSTITUES YOUR ACCEPTANCE OF THESE
TERMS AND CONDITIONS.
The SOFTWARE is the property of Binary Acoustic Technology LLC and is protected by copyright laws and
international copyright treaties. The SOFTWARE is not sold, it is licensed.
PRODUCT VERSION
If you accepts the terms and conditions of this AGREEMENT, you have certain rights and obligations as follow:
YOU MAY:
1.
Install and use one (1) primary copy of the PRODUCT VERSION on a computer and one (1) backup
copy on a laptop or mobile computer.
YOU MAY NOT:
1.
Sublicense, rent or lease the PRODUCT VERSION or any portion of it.
2.
Decompile, disassemble, reverse engineer or modify the PRODUCT VERSION or any portion of it.
3.
Distribute copies of the PRODUCT VERSION without written consent from an authorized representative of Binary Acoustic Technology
TRANSFER OF LICENSE
You may transfer your license to another individual or single entity on a permanent basis provided
that you retain no copies and the recipient agrees to the terms of this Agreement. Notice must be given by you
to Binary Acoustic Technology that such a transfer has taken place.
WARRANTY DISCLAIMER
The SOFTWARE is supplied "AS IS". Binary Acoustic Technology LLC disclaims all
warranties, expressed or implied, including, without limitation, the warranties of merchantability and of fitness for any purpose. The user must assume the entire risk of
using the SOFTWARE.
DISCLAIMER OF DAMAGES
Binary Acoustic Technology LLC assumes no liability for damages, direct or consequential, which may result from the use of the SOFTWARE, even if Binary Acoustic
Technology LLC has been advised of the possibility of such damages. Any liability of
the seller will be limited to refund the purchase price.
Chapter 1 : Installation
1.1 : What you should have received
The SCAN’Rtm package includes one SCAN’Rtm CD-ROM
and this manual. The CD-ROM contains the software distribution along with a setup function that uses the Microsoft
Windows installer.
1.2 : New Installation
Place the CD-ROM in the drive. After a short delay the CDROM window should open. If this does not happen, doubleclick the CD-ROM symbol in the My Computer folder.
When the CD-ROM window appears double click the Setup
icon. This will bring up the Window Installer. Follow the
directions to complete the installation.
1.3 : Updating an Older Version
Follow the same procedure as described in the section 1.2.
For reasons of safety it is good practice to create a backup
of your previous data before proceeding.
It is also recommended to uninstall older versions of
SCAN’R before installing new versions.
Chapter 2 : SCAN’Rtm
2.1 : Introduction
SCAN’Rtm is an automated snapshot characterization and analysis
tool. It is designed to help address two main issues present in bat
monitoring projects; namely 1) handling the high volume of data
that is produced by modern Time Expanded (TE) and Full Bandwidth (FB) bat detectors, and 2) converting the recordings into
meaningful measurements that can potentially be used to identify
individual species and estimate populations.
First, SCAN’Rtm includes a novel bat detection technique that can
distinguish between actual bat calls and false alarms which are due
to insects and other noise sources. This feature is fully automated.
SCAN’Rtm will process an entire snapshot directory and separate
the files into two lists, a list of “passed” files that contain bat calls
and a list of “failed” files that don’t. Afterward, with a single button click, the operator can either delete all of the failed files or save
all the passed files into a separate archive directory.
Second, SCAN’Rtm includes a fully automated characterization
processor which isolates each bat vocalization and measures the
relevant vocalization parameters. It supports two different base parameter sets. It currently produces base parameter sets that conform to both Analooktm and SonoBattm protocols. In addition
SCAN’Rtm supports a few enhanced parameter measurements including Signal Pressure Level (SPL) and curvature, a spectral shape
measurement.
These two processing features can be employed to scan though volumes of recorded data and extract/archive only the files of interest.
Chapter 3 : Running SCAN’R
3.1 : Running from desktop
A SCAN’Rtm desktop icon is created and
placed on your desktop during the install.
You can start SCAN’Rtm from the desktop
by double clicking on the SCAN’Rtm icon
illustrated by Figure 1.
Figure 1: SCAN’Rtm Icon
3.2 : Running from Start Menu
SCAN’Rtm can also be run from the Start menu. You can run it
by selecting Start => All Programs => SCANR
3.3 : Exiting
There are two ways to exit the program. The first is using the
red ‘X’ button in the upper right corner of the window. The
other way is using the File => Exit menu item.
3.4 : The SCAN’R Main Window
Upon startup the main window appears as shown in figure 2.
The main window has two basic sections. The file selection
section (left) allows the operator to select both input and output
files. It can also be used to manually operate the scanner and
select individual files to process. The sonogram “thumbnail”
section (right) displays a sonogram for each detected bat call. It
provides quick visual feedback on the progress of the scanner
and allows the operator to inspect the results and/or make measurements of their own. The thumbnail section includes a view
scroll bar (light green) that allows an operator to adjust the
range of thumbnails that are displayed.
Figure 2: SCAN’Rtm Main Window
3.4.1 : Output File Selector
The output file selector allows the operator to specify the file that
will receive the parameter measurements . Clicking on the
“Select Output…” button will bring up a standard windows file
selection tool, Figure 3. This tool allows the operator to browse
existing folders, create new folders and specify an output filename.
Keep in mind that the output file is a parameter file. As each bat
call is processed, SCAN’Rtm will measure the relevant parameters
and store them into this file using a standard tab delimited parameter file format. SCAN’Rtm also supports two different parameter base formats along with several different optional parameters. Use the Output Format selection window (section
3.6.1) to select the desired output format.
It is important to note that the output file is only reset at the time
you select it. After this, the file will be updated with results from
each new scan. This will continue until either a new file is selected or the same file is reselected. To rerun a scan, overwriting
the previous results, you must first reselect the output file.
Figure 3: File selection tool
3.4.2 : Input File Selector
The input file selector operates
much the same as the output file
selection. Clicking on the “Select
Input…” button will bring up a
standard file selection window.
However, rather than just selecting
just a single file. The Input Selector will read in and display all of
the files in the selected directory.
All files will be listed and the original selected file will be highlighted
as shown in figure 4.
Please note that the input selection
panel includes a comment display
which is updated with any SPECT’Rtm or SonoBattm compatible
comment field that is found in the
selected file.
Figure 4: Input Selection
3.4.2.1 : Operating the File Selection Panel
SCAN’Rtm can be operated using the input file selection panel. Select
the initial file and directory by clicking on the Select Input button.
This will populate the list with all the files in the selected directory.
Note that if the file list is too large to fit in the panel, a scroll bar will
appear to allow the operator to scroll through the entire list. The selected file will be highlighted in blue. To change selection simply
click on another filename in the list box. The new file will be highlighted and the comment display will be updated to reflect the new
file. To manually process (or reprocess) a single file, simply double
click on the file name.
3.4.3 : Sonogram “Thumbnail” Display
The thumbnail is a sixteen pane sonographic display that is organized in
four rows and four columns as illustrated in figure 5. The panes are updated with each new detection. Each pane holds a single call. The update
order is left-to-right and top-to-bottom.
The thumbnail display provides visual feedback of the scanner progression. It provides a mouse driven interface to allow the operator to select
thumbnails of interest and inspect the results. The measurement interface
is similar to SPECT’Rtm. The display includes measurement readouts at
the bottom of the screen. Simply move the mouse over the desired region
of a thumbnail. SCAN’Rtm senses the position of the mouse and updates
the readouts accordingly. To make differential measurements, click on a
point of interest and then move the mouse. The readout will now show
the difference between the point originally clicked and the new location of
the mouse.
Figure 5: Thumbnail display
3.4.4 : Zooming the “Thumbnail” Display
Double click the left mouse button to zoom , on any of the sixteen
thumbnails, to get a closer look. When zoomed, the resolution of the display is increased and the display is updated with the automated parameter
estimates for that call. As shown in figure 6, the zoomed thumbnail is
enlarged by nearly a factor of four. To un-zoom, click the right mouse
button.
The zoomed thumbnail now includes parameter measurements in the upper right corner . A zoomed sonogram is overlaid with computer generated tracking and feature identification information to provide the operator with all of the signal characteristic information in one display. This is
useful for checking the performance of the SCAN’Rtm against various
types of bat call as well as for quick visual species identification.
Please note that the parameter measurements displayed use the same parameter set format that is selected for the output file.
Figure 6: Thumbnail display
3.4.5 : Selecting the Range of Thumbnails
SCAN’R displays only sixteen (16) thumbnails at a time. As of version
1.2, SCAN’R includes a scrolling feature that allows the operator to select
the range of 16 thumbnails to display. The scroll bar is located at the right
side of the thumbnail display group.
As each file is scanned, SCAN’R creates a thumbnail for each bat call
that is detected. Once the number of thumbnails increases beyond the size
of the display, the scroll bar will turn light green and the scroll display
will be adjusted to indicate the number of thumbnails that are available.
The number of thumbnails that can be created per snapshot is limited to
two hundred. Once SCAN’R reaches this limit, it will stop generating
thumbnails. The limit only applies to thumbnail generation for display
purposes. Note that SCAN’R will scan each snapshot to completion and
it will generate parameter measurements for all bat calls detected.
To operate the thumbnail scroll bar, simply click and hold the left mouse
button while the cursor is on top of the light green bar and then drag the
bar to the desired position. The display updates as the bar is moved. This
allows the operator to quickly scan through large numbers of thumbnails.
Once the desired position is reached, simply release the left mouse button
an the display will be updated with the new position.
New feature: One new feature in SCAN’R version 1.2 is that the scroll
bar can also be used in zoom mode. Double click a thumbnail to bring up
zoom mode. Then, as before, click and hold the left mouse button while
the cursor is on top of the light green bar and then drag the bar. If you
drag the bar slowly enough, the zoom window will display a progression
thumbnails. This allows the operator to inspect a sequence of thumbnails
more easily. This is also a good way to study bat calls in a timesequenced “movie mode”.
3.4.6 : Operating Brightness and Contrast Controls
Simply stated, the Brightness and Contrast controls allow the operator to adjust the screen appearance. Moving either slider left
reduces the screen brightness/contrast, while moving the slider
right increase the screen brightness/contrast.
To be more precise, the Brightness and Contrast controls actually
control how the underlying sonographic data maps to the screen
color and/or intensity. Explained this way, the brightness and
contrast actual control the level of sonographic detail that will be
mapped to the screen. The brightness control actually establishes
the mean value of the display, while the contrast controls the linear range or sensitivity around the mean value.
Once you master operation of the brightness and intensity controls, you will find them a great tool to use to discover the subtle
details of bat vocalizations.
3.5 : SCAN’R Menu Operation
3.5.1 : File Menu
The File menu provides 1) an alternate method to select the Input and
Output files and 2) it provides the
main mechanism to exit SCAN’R.
Clicking on either Select Input…
will bring up a standard windows
file selection utility and update the
input file list as described in selection 3.4.2. Clicking on or Select
Output... will again bring up a standard selection utility and then update the output file as described in
section 3.4.1.
Figure 7: File Menu
3.5.2 : Setup Menu
The Scan Setup menu allows the
operator to bring up the three primary control window. All of these
windows contain controls that allow the operator to customize the
operation of SCAN’Rtm.
The windows operation is described in sections that follow.
Note that SCAN’Rtm saves all settings and restores them next time
SCAN’Rtm is run.
Figure 8: Setup Menu
3.5.3 : Action Menu
The Action menu provides options
to start and stop file scanning operations. Action=>Scan initiates a
scan of the currently selected file
(file list box). Action=>Scan All
initiates scanning of all files in the
file list box. This effectively scans
an entire directory. Action=>Stop
terminates the current scanning operation.
Please note that the Stop operation
is primarily intended to give the
operator a mechanism to abort the
current scanning operation. Normally this is just to test settings or
to rerun the current operation.
Figure 9: Action Menu
3.5.4 : Window Menu
Similar to the Scan Setup menu, the
Scan Window menu also allows the
operator to bring up the three primary control windows. However,
it also displays a check mark next
to the windows that are currently
active.
The Scan Window is primarily intended to quickly bring active windows to the forefront when they are
hidden behind other windows on
the desktop.
Figure 10: Window Menu
3.5.5 : Configuration Menu
The configuration menu is a special menu that appears only in
the extended license version of SCAN’R. The configuration
menu provides a mechanism for the operator to select default settings for reading generic wave files.
As of version 1.3.6, the configuration menu allows the operator
to supply the default time expansion factor that will be used to
interpret the sample rate of the file. Two time expansion factors
are supported 1X and 10X. The first, 1X, supports files that were
recorded in real-time using a high speed digitizer. The second,
10X, supports files that were generated using a time expanded
bat detector. If the wav files were recorded with a high speed digitizer or if the files are marked with the actual sample rate,
choose 1X. If the wav files were recorded using a time expanded
detector and a PC audio port, choose 10X.
The default time expansion selection is only applied to generic
wave files. It has no effect on recordings produced by either the
SPECT’R or SonoBat recording software packages. Both of
these place recording setting and other attribute information directly into the recorded files which SCAN’R will read to determine the correct time expansion setting.
3.6 : SCAN’R Setup and Operation Windows
3.6.1 : Output Format Window
The Output format window
controls the format of the output
parameter file. SCAN’Rtm supports two output format options,
an Analooktm and a SonoBattm
compatible base format. It also
allows the base format to be
augmented with additional parameters.
Click on the Setup=>Output
Format… menu entry. This will
bring up the Output Format window as illustrated in figure 11.
Figure 11 : Output Format Window
The top portion of the window contains two check boxes. One box
selects the Analooktm compatible base format and the other selects
the SonoBattm compatible base format. Click on the box next to the
desired selection. The checked box indicates the current selection.
The selection is stored and will be remembered the next time
SCAN’Rtm is used.
In addition to the standard formats, SCAN’Rtm is capable of providing additional measurements. The lower portion of the screen provides a mechanism for the operator to include these measurements in
the output format. The sound pressure level option adds a measurement of the peak sound pressure level detected in the call. The Curvature selection adds the curvature measurement. Finally, the Curvature Fit Error adds a curve fit metric.
The parameters are described in greater detail in section 3.7.
3.6.2 : Scan Setup Window
The Scan Setup Window is a control panel which allows the operator to
setup the scanner and configure the call selection criteria. The control
parameters are separated into two function groups as show in figure 12.
The upper section controls the initial call detection criteria, while the
lower section controls the final call filtering. The primary difference between the two is that the upper section sets the criteria used to detect the
bat calls in the recording, while the lower section controls the filtering
operation which filters out unwanted detections.
The upper section contains three controls, the trigger level setting, the
minimum and maximum frequency cutoff settings, and the standard
view duration setting. To detect bat calls, SCAN’R tracks the noise
floor of the recording and searches for burst sound energy that is greater
than the noise by at least the value set by the Trigger Level. At the same
time, the scan will reject all sound energy at frequencies lower than the
minimum frequency cutoff setting or higher than the maximum setting.
This allow SCAN’R to immediately reject insects an other sounds that
are out of the ultrasonic frequency range. Once triggered, SCAN’R will
process the burst over duration selected by Standard View setting. The
Standard View duration can be adjusted using a slider. This allows the
operator to optimize the displays to meet the requirements of different
call types.
The lower section of the Scan Setup Window contains a set of filtering
controls. These controls are the peak power filter, the minimum duration filter , the fit restriction filter, the pop filter, and a parameter selective filter bank . All of these filters are applied after the initial call
detection and are used to qualify the detections and/or search for calls
that meet certain criteria.
At the very bottom of the Scan Setup Window are two buttons which
allow the operator to load and/or save the currently configured settings.
These are useful for maintaining settings templates for specific scan criteria.
Figure 12 : Scan Setup Window
The peak power filter is used to reject detections that don’t reach a required peak sound pressure level during the duration of the call. Like
the trigger level , this setting is referenced to the current value of the
noise floor. It should be higher than the trigger level by at least 3 dB
(default is set 6dB greater).
The minimum duration filter is used to reject detections that don’t last
long enough. Many of the false detections due to insects can be considered “pop” noise. They are very short duration bursts that last only fractions of a millisecond. In comparison, even short bat calls last longer
than a millisecond, and echolocation calls are normally even longer.
The minimum duration is defaulted to half a millisecond. This value has
proven to work well against most bug interference.
The fit restriction filter is used to reject detections that don’t meet the
selected curve fit restrictions. If the fit restriction is set to high, all detections are required to closely match the internal curvature model. If
the fit restriction is set to standard (or medium), all detections are required to match the internal curve model, but with more tolerance for
error. Finally, if the fit restriction is set to low, the fit tolerance is set
low enough that most detections will pass except those that no creature
could possibly create.
The pop filter is used to reject pop noise like static discharging, which
is common in electrostatic or capacitive sensors, especially when operated in high humidity. It is also useful, for filtering out other false detections like rain drops hitting the detector.
Finally, the filter bank provides a selectable set of filters that are based
on the scanned parameter measurements. These are primarily intended
to allow SCAN’R to be operated to search for a particular call type, because they are very selective. Please see sections 3.8.1 and 3.8.2 for a
description of the parameters.
3.6.3 : Scan Results Window
The Scan Results Windows presents
the final results of the scan processing. The Scan Results Window is
illustrated in figure 13.
At the very top of the window is the
selection criteria filter. This is the
final filter in the selection process.
SCAN’Rtm counts up the total number of detections in each file and
compares this to the selection criteria. If the number of detections is
greater than or equal to the selection
criteria value, the file is moved to the
“selected” file list (top list). Otherwise the file is moved to the “failed”
file list (bottom list).
Scan results are updated with each
file that is processed either manually
(one file at a time) or automatically
using the Action=>Scan All menu
selection. It also includes counters
that track the total number of passed
files, the total number of detections
in all of the passed files, and the
number of failed files.
Figure 13: Scan Results Window
3.6.3.1 : Maintaining Call Archives
The Scan Results window provides flexible options to help maintain call
archives and minimize disk storage by weeding out bad files. The operator is given the option to delete, move, or archive select files or groups of
files.
The Scan Results window groups files into two lists, “passed” files and
“Failed” files. The passed file list includes all files that meet the file selection criteria specified in the Scan Setup window. The failed file list includes all files that did not meet the file selection criteria. These lists are
update as SCAN’R finishes scanning each file. Once all the files has been
scanned, the operator has the option to delete, move, or archive selected
files.
3.6.3.1.1 : Passed File Options
For passed files, the operator has three primary options. First, the operator can choose to archive the file. When archived, a copy of the file is
placed in an archive directory. Second, the operator can choose to move
the file. In this case, the file is actually moved from the original directory
and placed in another directory. Finally, if the operator decides that the
file should not have passed, the file can be manually moved over to the
The passed file option is selected using the Scan Results Options menu.
The passed file option defaults to Archive. This setting preserves the
original file. To switch the setting to
Move click on Options->Passed
Files->Move as illustrated in figure
14. This setting will not preserve the
original file.
Figure 14: Passed File Options
3.6.3.1.2 : Failed File Options
For failed files, the operator has two primary options. First, the operator
can choose to delete the file. Note that the deleted files are actually
moved to Window’s Recycle bin and won’t actually be deleted until the
recycle bin in emptied. This allows files to be recovered if deleted accidentally. Second, the operator can choose to move the file. In this case,
the file is actually moved from the original directory and placed in another directory.
The failed file option is also selected
using the Scan Results Options
menu. The failed file option defaults
to Delete. This setting deletes the
original file and moves it to the Recycle bin. To switch the setting to
Move click on Options->Failed
Files->Move as illustrated in figure
15. This setting not preserve the
original file.
Figure 15: Passed File Options
3.6.4 : Operation Timer Window
SCAN’R includes an operation timer that can be used to perform periodic
or daily automated batch processing. This is a new powerful feature that
is included in version 1.5 and above. Because it is fully automated, the
operation timer enables SCAN’R to be employed in remote field collection and used in conjunction with SPECT’R or SPECT’R Mobile. This
provides a new data collection capability that is able to reduce data storage requirements and extend the duration of unattended recording sessions. For example, SCAN’R can prescreening the snapshot recordings to
weed out bad recordings and false detections and it can process the recordings and save only the parameter sets which provides a huge reduction in the data storage requirement.
The operation timer is controller using the Operation Timer Window as
illustrated in Figure 16. The window contains three main sections; the
time and status indicator section, the program activation method section, and the operation programming section. These sections will be
discussed further on the next page.
Figure 16: Operation Timer Window
3.6.4.1 : Time and Status Indicator
The time and status indicator section displays both the current time and
the current status of the operation timer. The time is displayed in ether
UTC (universal coordinated time) or the local time. An indicator is also
displayed showing which time is currently being displayed. The indicator
with either be UTC or Local. The status indicator displays the current
status of the operation timer.
Changing the time standard is accomplished using the Setup=>Time
Standard menu option. Use this
menu option to select the desired
time standard setting. The current
setting will be indicated with a
check-mark.
Figure 17: Passed File Options
3.6.4.2 : Program Activation Method
The program activation method section allows the operator to choose
how the operation timer will activate the programs. Programs can either
be activated beginning at a specific time each day or they can be activated periodically through the day with a specified interval.
To activate programs once per day, enter the start time in the time edit
box and click on the corresponding check box. To activate programs periodically throughout the day, enter the activation interval in minutes into
the minutes edit box and click on the corresponding check box.
To disable the operation timer, uncheck both of the options.
3.6.4.3 : Program operation section
Figure 18: Program operation section
The program operation section allows the operator to select up to four
operations to run each time the operation timer triggers. The four programs are provided to allow SCAN’R to process the snapshots from up
to four AR125 ultrasonic receivers. This is the maximum number of receivers that can be run using a single computer.
The program operation section, figure 18, is composed of four rows of
control entries. Each row includes an enable check box, an input directory selection, and output file selection, and an archive directory selection.
The enable check box activates or deactivates each program. The program is active only when the check box is checked. Clicking on the
check box changes its state. Each time the operation timer is activated it
will process all of the programs that are enabled in sequence, top to bottom.
The input directory selection allows the operator to select the directory
that SCAN’R will process. The selection should be set to a directory that
is being using to store snapshot recordings. To select a directory, click on
the Input… button. This will bring up a directory browsing GUI. Navigate through the directory structure to select the desired directory. Then
click on the OK button.
The output file selection allows the operatory to select a directory and
file name to store all of the scan parameter results. To select an output
directory click on the Output… button and this will bring up a windows
file selection GUI. Use the GUI to select an output directory and then
type in the desired file name.
The file name specified in the output selection field is actually just a base
file name, the beginning of a file name. SCAN’R will take this file name
and append a time tag to it to for the actual file name. In effect, the base
file name provides a convenient mechanism that the operator can use to
track sequences of files that are created each time SCAN’R activates.
The file naming convention is <base file name>_DyyyymmddThhmnss,
where:
yyyy=year, mm=month, dd=day,
hh=hour, mn=minute, ss=second.
The archive directory selection allows the operator to select an optional
archive directory. This is a directory that will be used to store all of the
good snapshots after they have been processed. Again this directory is
optional. If an archive directory is chosen, then all of the good file will
be written to the archive directory and all of the bad files will be deleted.
This in effect will weed out all of the bad files. If no archive directory is
chosen, then all snapshot files will be deleted. This in effect will remove
all snapshot files from the disk and only retain the scan parameters.
To select an archive directory, click on the Arch… button to bring up a
directory browsing window. Browse through the window to select the
desired directory and then click on the OK button.
To deselect an archive directory, click on the Arch… button to bring up a
directory browsing window and then click on the Cancel button.
3.7 : Trace Window
In addition to the Sonogram, SCAN’R includes a Trace Window that allows the operator to see a time versus frequency plot of the call sequence.
The time is plotted horizontally with increasing time going from left to
right. The frequency is plotted vertically with increasing frequency going
from bottom to the top.
The Trace Window is somewhat analogous to the bat call display of the
Anabattm system (www.titley.com). The main difference is that the Trace
Window displays both the fundamental frequency component (green
trace) as well as the second harmonic (blue trace) if present.
The Trace Window is linked with the sonographic display so you can operate it in conjunction with the main window. If you double click the
mouse on one of the calls on the trace window, then the main window will
display the associated sonogram. Vice versa, if you double click on one
of the thumbnails in the main window, than a cursor will highlight the associated call on the Trace Window.
The Trace Window is quite handy for maintaining a set of reference parameter calls. It allow an operator to select and save call reference sequences that can be used for call comparison and identification.
Figure 19: Trace Window
To bring up the Trace Window, select Window=>Trace… using the menu
options at the top of the main window. The trace window will initially be
blank, but it will update with call detections each time SCAN’R scans a
file.
Operating the Trace Window is fairly simple:
1) To select a call, simply point to the call using the mouse and
double click the left mouse button. This will bring up a marker to
highlight the selected call and update the main display with the
corresponding sonogram.
2) To select a group of calls, simply drag the mouse over the region
of interest while holding the left mouse buttons down. This will
highlight the entire area with a green background as shown in
figure 20.
Once a selection is made there are three options: A) you can delete the
selected entries from the call sequence by clicking on the Delete Selected
button, B) you can save the selected calls to a new file by clicking on the
Save Selected button, or C) you can append the selected calls to an existing file by clicking on the Append Selected button.
Figure 20: Trace Window
3.8 : SCAN’R Output file
If an output file is specified, SCAN’R writes the measured parameters to
the output file. The output file is a tab-delimited file that conforms to the
format selected by the Output Format window (section 3.6.1).
The ability to provides detection parameter sets provides SCAN’R with
two important applications: 1) it can be used to generate call parameters
that can be used for bat species identification. 2) it can also be used to
compress and translate Time Expanded (TE) or Full Bandwidth (FB) detector recording into a storage format that is compatible with the ZCD
(zero crossing detector) format that is employed in AnaBattm/Analooktm.
This second function will allow mixed detector surveys by ensuring that
all results can be analyzed and archived to a common parameter format.
The output format is an open format that can be processed by second and
third party applications. In addition, the format can be read into standard
spreadsheet applications, such as Microsoft Excel as show in figure 20.
Figure 21: Output File Loaded into Excel Spreadsheet
3.8.1 : Analooktm compatible format
The Analooktm base parameter set consists of sixteen (16) parameters
which are tab-delimited and written in the following order:
File Name
Start Time
Duration
Prev
Next
Fmax
Fmin
Fmean
Tk
Fk
Qk
Tc
Fc
S1
Sc
Qual
:
:
:
:
:
:
:
:
:
:
:
:
:
:
:
:
Name of input file
Call start time (msec)
Call duration (msec)
Time elapsed since previous detection (msec)
<Not used—set to 0>
Maximum frequency detected (KHz)
Minimum frequency detected (KHz)
Mean or average frequency of call (KHz)
Time of the knee WRT the beginning of call (msec)
Frequency of the knee (KHz)
<Not used—set to 0>
Time of the characteristic WRT the beg call (msec)
The characteristic frequency (KHz)
The initial slope at the beginning of the call (OPS)
The characteristic slope in octaves per second (OPS)
<Not used-set to 0>
3.8.2 : SonoBattm compatible format
The SonoBattm base parameter set consists of twenty two (22) parameters
which are tab-delimited and written in the following order:
File Name
Time
Duration
prev
Fmax
Fmin
Bandwidth
Dom. Freq
Dom F Loc
High Fc
Low Fc
Slope
Th
Su
Sl
Heel Flag
H1
H2
H3
H4
H5
H6
:
:
:
:
:
:
:
:
:
:
:
:
:
:
:
:
:
:
:
:
:
:
Name of input file
Call start time (msec)
Call duration (msec)
Time elapsed since previous detection (msec)
Maximum frequency detected (KHz)
Minimum frequency detected (KHz)
Total BW [Fmax - Fmin] (KHz)
Frequency at strongest sound pressure level (KHz)
Location of Dom. Freq (percent of total duration)
High end of characteristic (KHz) [Similar to Fk]
Low end of characteristic (KHz) [Similar to Fc]
Global slope of the call (KHz per msec)
Time of the heel or High Fc (percent of duration)
Upper slope [start to High Fc] (KHz per msec)
Lower slope [High Fc to Low Fc] (KHz per msec)
1 if heel is obvious
Fundimental frequency (KHz) *
2nd harmonic frequency (KHz) *
<not used, set to 0>
<not used, set to 0>
<not used, set to 0>
<not used, set to 0>
* Note that the marker frequencies H1 and H2 are only used if SCAN’R detects the
presence of a second harmonic. In this event, H1 and H2 are set to frequencies at the
point in the call were the 2nd harmonic is strongest. Otherwise they are both set to
zero.
3.8.3 : Optional Parameters
Either base parameter set can be enhanced with up to three (3) additional
parameters. These are also tab-delimited and are appended to the base
parameter set in the following order:
SPL
Curv
Fit
:
:
:
Peak Sound Pressure Level (SPL dB)
Curvature measurement
Curvature fit error (RMS error in Hz)
The SPL parameter is valid only when using calibrated detectors like
the BAT AR125. Otherwise, it can only be considered as relative signal
strength measurement that may vary from detector to detector.
The Curvature measurement is a novel way to characterize the shape of
bat calls. This idea was described by Simon Jolly in the Australasian
Bat Society Newsletter in 1997. The basic premise is that bat calls can
me modeled by the equation:
frequency ~= time P
where P is an integer value
SCAN’R employs this model, but enhances it to allow a fractional exponent (P). SCAN’R also adopts a new convention to easily identify upward curving and downward curving calls.
If the call is downward curving P is positive and:
frequency ~= time P
where P is an fractional value
If the call is upward curving P is negative and:
frequency ~= time 1/(-P)
where P is an fractional value
Thus for any value of P, P and -P reflect the same basic shape, but P
curves downward while –P curves upward.
Finally, the curve fit error parameter is a measurement of how much
error exists between the curvature model and the actual shape of the call.
The measurement is the Root Mean Squared (RMS) value calculated as
the difference between the frequency calculated as a function of the
model compared against the frequency measurements of the data. The
units are RMS Hertz.
Low values of curve fit error mean that the data is a closer match to the
model. Higher values mean that the data is NOT fitting the model. As a
general rule, SCAN’Rtm expects to see an error less than 100 Hz RMS to
trust that the data fits the model.
4.0 : Further Information
For further information or trouble shooting, please contact
us or visit our web site.
Web:
www.binaryacoustictech.com
E-Mail : [email protected]