1
Example
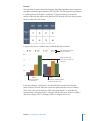
You may want to create a chart that compares how bird populations have changed in
two alpine sampling regions between 2007 and 2010. This data may first be presented
in a table with rows for Region 1 and Region 2. The researcher has counted the
number of birds in each region each year from 2007 through 2010, thus having 4 data
points (or values) for each region.
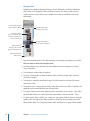
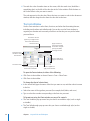
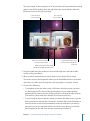
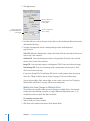
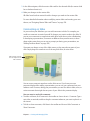
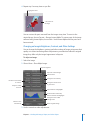
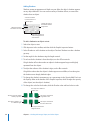
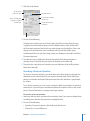
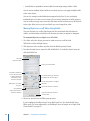
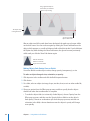
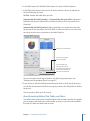
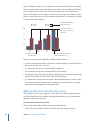
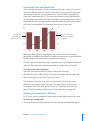
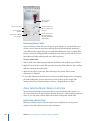
If you plot this data as a column chart, it will look like the one below:
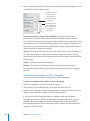
The chart legend denotes
the four data series.
These two bars of the
same color represent one
data series.
Each bar represents
one data point.
Each data set contains four bars,
one from each data series.
In this chart, Region 1 and Region 2 are called the data series because the data
points (numbers of birds) from each region are represented by a series of columns
of the same color, one for each year. Each column for Region 1 is set beside the
corresponding column for Region 2, and each side-by-side set of columns is called a
data set or category (2007 is a category, 2008 is a category, and so on).
Chapter 9    Creating Charts from Data
137