1
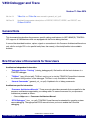
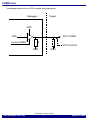
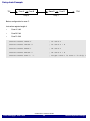
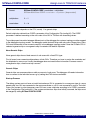
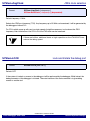
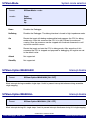
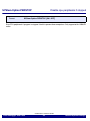
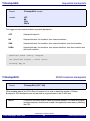
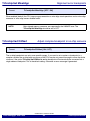
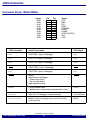
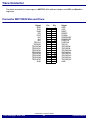
V850 Debugger and Trace TRACE32 Online Help TRACE32 Directory TRACE32 Index TRACE32 Documents ...................................................................................................................... ICD In-Circuit Debugger ................................................................................................................ Processor Architecture Manuals .............................................................................................. V850 .......................................................................................................................................... V850 Debugger and Trace ................................................................................................... 1 General Note ...................................................................................................................... 4 Brief Overview of Documents for New Users ................................................................. 4 Warning .............................................................................................................................. 5 Application Note ................................................................................................................ 6 Location of Debug Connector 6 Reset Line 6 FLMD0 Line 7 Mask-Options of V850/Fx3, Cargate 8 Quick Start JTAG ............................................................................................................... 9 Troubleshooting ................................................................................................................ 12 SYStem.Up Errors 12 FAQ ..................................................................................................................................... 12 Configuration ..................................................................................................................... 13 System Overview 13 General System Settings .................................................................................................. SYStem.CONFIG Configure debugger according to target topology Daisy-chain Example 14 16 TapStates 17 SYStem.CONFIG.CORE Assign core to TRACE32 instance 18 CPU type selection 19 Run-time memory access (intrusive) 19 SYStem.CPU SYStem.CpuAccess SYStem.JtagClock SYStem.LOCK SYStem.MemAccess SYStem.Mode SYStem.Option IMASKASM ©1989-2014 Lauterbach GmbH V850 Debugger and Trace 14 1 JTAG clock selection 20 Lock and tristate the debug port 20 Memory access selection 21 System mode selection 22 Interrupt disable 22 SYStem.Option IMASKHLL Interrupt disable 22 SYStem.Option PERSTOP Disable cpu peripherals if stopped 23 Exception Lines Enable .................................................................................................... 24 SYStem.Option RESET Reset line enable 24 SYStem.Option STOP Stop line enable 24 SYStem.Option WAIT Wait line enable 24 Request line enable 25 SYStem.Option NMI0 SYStem.Option REQest NMI0 line enable 25 SYStem.Option NMI1 NMI1 line enable 25 SYStem.Option NMI2 NMI2 line enable 25 CPINT line enable 26 SYStem.Option CPINT Trace System Settings ...................................................................................................... 27 SYStem.Option BTM Branch trace message 27 SYStem.Option DTM Data trace message 28 SYStem.Option KEYCODE Keycode 28 SYStem.Option OPWIDTH Trace interface width 29 Trace STALL mode 30 Trace clock mode 30 Breakpoints ........................................................................................................................ 31 SYStem.Option STALL SYStem.Option TCMODE Software Breakpoints 31 On-chip Breakpoints 31 Breakpoint in ROM 32 Example for Breakpoints 32 TrOnchip Commands ........................................................................................................ TrOnchip.view Display on-chip trigger window TrOnchip.CONVert 33 33 Adjust range breakpoint in on-chip resource 33 TrOnchip.SEQ Sequential breakpoints 34 TrOnchip.RCU ROM-Correction breakpoints 34 Set on-chip trigger to default state 35 TrOnchip.RESet TrOnchip.SIZE Trigger on byte, word, long memory accesses 35 TrOnchip.Set Alignment Alignment error breakpoints 35 TrOnchip.Set MissAlign Alignment error breakpoints 36 Adjust complex breakpoint in on-chip resource 36 Memory Classes ................................................................................................................ 37 TrOnchip.VarCONVert DataFlash: Memory Class 37 Trace ................................................................................................................................... 38 NBD Interface ..................................................................................................................... 39 Runtime Measurement ...................................................................................................... 40 JTAG Connector ................................................................................................................ Connector 20 pin 100mil /NWire ©1989-2014 Lauterbach GmbH V850 Debugger and Trace 41 41 2 Trace Connector ................................................................................................................ 42 Connector MICTOR/N-Wire and Trace 42 Connector KEL/N-Wire and Trace 43 NBD Connector .................................................................................................................. 44 Support ............................................................................................................................... 45 Available Tools 45 Compilers 55 Realtime Operation Systems 56 3rd Party Tool Integrations 56 Products ............................................................................................................................. 57 Product Information 57 Order Information 57 ©1989-2014 Lauterbach GmbH V850 Debugger and Trace 3 V850 Debugger and Trace Version 11-Nov-2014 30-Jun-14 TrBus.Out and TrBus.Set were moved to general_ref_t.pdf. 20-Dec-13 Updated the parameter descriptions of DRPRE, DRPOST, IRPRE, and IRPOST, see SYStem.CONFIG. General Note This documentation describes the processor specific settings and features for NEC V850E(S). TRACE32ICD supports all V850 devices which are equipped with the N-wire debug interface. If some of the described functions, options, signals or connections in this Processor Architecture Manual are only valid for a single CPU or for specific family lines, the name(s) of the family/families is/are added in brackets. Brief Overview of Documents for New Users Architecture-independent information: • ”Debugger Basics - Training” (training_debugger.pdf): Get familiar with the basic features of a TRACE32 debugger. • ”T32Start” (app_t32start.pdf): T32Start assists you in starting TRACE32 PowerView instances for different configurations of the debugger. T32Start is only available for Windows. • “General Commands” (general_ref_<x>.pdf): Alphabetic list of debug commands. Architecture-specific information: • “Processor Architecture Manuals”: These manuals describe commands that are specific for the processor architecture supported by your debug cable. To access the manual for your processor architecture, proceed as follows: - • Choose Help menu > Processor Architecture Manual. “RTOS Debugger” (rtos_<x>.pdf): TRACE32 PowerView can be extended for operating systemaware debugging. The appropriate RTOS manual informs you how to enable the OS-aware debugging. ©1989-2014 Lauterbach GmbH V850 Debugger and Trace 4 General Note Warning Signal Level The debugger output voltage follows the target voltage level. It supports a voltage range of 0.4 … 5.2 V. ESD Protection NOTE: To prevent debugger and target from damage it is recommended to connect or disconnect the debug cable only while the target power is OFF. Recommendation for the software start: • Disconnect the debug cable from the target while the target power is off. • Connect the host system, the TRACE32 hardware and the debug cable. • Power ON the TRACE32 hardware. • Start the TRACE32 software to load the debugger firmware. • Connect the debug cable to the target. • Switch the target power ON. • Configure your debugger e.g. via a start-up script. Power down: • Switch off the target power. • Disconnect the debug cable from the target. • Power OFF the TRACE32 hardware. ©1989-2014 Lauterbach GmbH V850 Debugger and Trace 5 Warning Application Note Location of Debug Connector Locate the debug connector as close as possible to the processor to minimize the capacitive influence of the trace length and cross coupling of noise onto the JTAG signals. Reset Line Ensure that the debugger signal RESET is connected directly to the RESET of the processor. This will provide the ability for the debugger to drive and sense the status of RESET. Debugger Target VCC Reset-Sense CPU Reset Force-Reset ©1989-2014 Lauterbach GmbH V850 Debugger and Trace 6 Application Note FLMD0 Line The debugger forces this line to VDD to enable flash programming. Debugger Target VDD VDD Force-FLMD0 CPU FLMD0 1K CPU PortOut GND GND ©1989-2014 Lauterbach GmbH V850 Debugger and Trace 7 Application Note Mask-Options of V850/Fx3, Cargate The mask options require a special handling. In normal operation mode the mask option values are located in flash memory at address 0x7A, 0x7B. In emulation mode these values have to be copied to a certain debug register EMUMO at address 0xFFFFF9FA. • the value of address 0x7A has to be copied to the low byte of EMUMO • the value of address 0x7B has to be copied to the high byte of EMUMO The new options become active at the next SYStem.UP. Add following startup sequence to your script: SYStem.Up disable RomSecurityUnit ; initial startup ; see demo scripts ; set MaskOptions to EMUMO register Data.Set 0xFFFFF9FA %Word 0x0800 SYStem.Up disable RomSecurityUnit ... ... ; now the MaskOption settings are active ; see demo scripts ©1989-2014 Lauterbach GmbH V850 Debugger and Trace 8 Application Note Quick Start JTAG Starting up the Debugger is done as follows: 1. Select the device prompt B: for the ICD Debugger, if the device prompt is not active after the TRACE32 software was started. b: 2. Select the CPU type to load the CPU specific settings. SYStem.CPU 70F3281 3. If the TRACE32-ICD hardware is installed properly, the following CPU is the default setting: JTAG Debugger for V850 4. V850SA Tell the debugger where’s FLASH/ROM on the target. MAP.BOnchip 0x00000000++0x7FFFF This command is necessary for the use of on-chip breakpoints. 5. Enter debug mode SYStem.Up This command resets the CPU and enters debug mode. After this command is executed it is possible to access the registers.Set the chip selects to get access to the target memory. Data.Set… Following command sequence is required for CPU types which are equipped with a ROM Security Unit (RSU). As long as the ROM Security is active the debugger gets no access to CPU memory. ©1989-2014 Lauterbach GmbH V850 Debugger and Trace 9 Quick Start JTAG This example estimates 0xff as memory content at address 0x70 … 0x79. ; BROM switching Data.Set 0xfffff8d0 Data.Set 0xfffff8d4 Data.Set 0xfffff8d4 Data.Set 0xfffff8d4 %Byte %Byte %Byte %Byte 0xa5 0x08 0xf7 0x08 ; KeyCode setting ; data at 0x70 … x79 is estimated as 0xff Data.Set 0xfffff9c0 %Word 0xffff 0xffff Print DATA.LONG(D:0x70) Data.Set 0xfffff9c0 %Word 0xffff 0xffff Print DATA.LONG(D:0x74) Data.Set 0xfffff9c0 %Word 0x0000 0xffff Print DATA.LONG(D:0x78) Print DATA.LONG(D:0xfffff9c4) 6. Load the program. ; (ubrof specifies the format, ; sieve.d85 is the file name) Data.LOAD.ubrof sieve.d85 The option of the Data.LOAD command depends on the file format generated by the compiler. For information on the compiler options refer to the section Compiler. A detailed description of the Data.LOAD command is given in the “General Commands Reference”. ©1989-2014 Lauterbach GmbH V850 Debugger and Trace 10 Quick Start JTAG The start up can be automated using the programming language PRACTICE. A typical start sequence is shown below: b:: ; Select the ICD device prompt WinCLEAR ; Delete all windows MAP.BOnchip 0x000000++0x07ffff ; Specify where’s FLASH/ROM SYStem.CPU 70F3281 ; Select the processor type SYStem.Up ; Reset the target and enter debug ; mode Data.Load.ubrof sieve.d85 ; Load the application Register.Set PC main ; Set the PC to function main Data.List ; Open disassembly window *) Register /SpotLight ; Open register window *) Frame.view /Locals /Caller ; Open the stack frame with ; local variables *) Var.Watch %Spotlight flags ast ; Open watch window for variables *) PER.view ; Open window with peripheral register ; *) Break.Set sieve ; Set breakpoint to function sieve Break.Set 0x1000 /Program ; ; ; ; Break.Set 0x3FFB100 /Program ; Set software breakpoint to address ; 3FFB100 (address 3FFB100 is in RAM) Set on-chip breakpoint to address 1000 (address 1000 is in FLASH) (Refer to the restrictions in On-chip Breakpoints.) *) These commands open windows on the screen. The window position can be specified with the WinPOS command. ©1989-2014 Lauterbach GmbH V850 Debugger and Trace 11 Quick Start JTAG Troubleshooting SYStem.Up Errors The SYStem.Up command is the first command of a debug session where communication with the target is required. If you receive error messages while executing this command this may have the following reasons. All The target has no power. All The target is in reset: The debugger controls the processor reset and use the RESET line to reset the CPU on every SYStem.Up. All There are additional loads or capacities on the JTAG lines. All The JTAG clock is too fast. FAQ No information available ©1989-2014 Lauterbach GmbH V850 Debugger and Trace 12 Troubleshooting Configuration System Overview HUB PC or Workstation 100 MBit Ethernet Target Debug Cable PODBUS IN POWER DEBUG / ETHERNET LAUTERBACH POWER POWER 7-9 V COLLISION C B DEBUG CABLE ETHERNET CON ERR RECEIVE LAUTERBACH TRIGGER TRANSMIT DEBUG CABLE USB EMULATE RESERVED FOR POWER TRACE SELECT RECORDING A PODBUS OUT JTAG Connector TRIG Ethernet Cable POWER DEBUG / ETHERNET AC/DC Adapter ©1989-2014 Lauterbach GmbH V850 Debugger and Trace 13 Configuration General System Settings SYStem.CONFIG Configure debugger according to target topology Format: SYStem.CONFIG <parameter> <number_or_address> SYStem.MultiCore <parameter> <number_or_address> (deprecated) <parameter> (General): state CORE (JTAG): DRPRE <bits> DRPOST <bits> IRPRE <bits> IRPOST <bits> TAPState <state> TCKLevel <level> TriState [ON | OFF] Slave [ON | OFF] <core> The four parameters IRPRE, IRPOST, DRPRE, DRPOST are required to inform the debugger about the TAP controller position in the JTAG chain, if there is more than one core in the JTAG chain (e.g. ARM + DSP). The information is required before the debugger can be activated e.g. by a SYStem.Up. See Daisychain Example. For some CPU selections (SYStem.CPU) the above setting might be automatically included, since the required system configuration of these CPUs is known. TriState has to be used if several debuggers (“via separate cables”) are connected to a common JTAG port at the same time in order to ensure that always only one debugger drives the signal lines. TAPState and TCKLevel define the TAP state and TCK level which is selected when the debugger switches to tristate mode. Please note: nTRST must have a pull-up resistor on the target, TCK can have a pull-up or pull-down resistor, other trigger inputs needs to be kept in inactive state. Multicore debugging is not supported for the DEBUG INTERFACE (LA-7701). ©1989-2014 Lauterbach GmbH V850 Debugger and Trace 14 General System Settings state Show multicore settings. CORE For multicore debugging one TRACE32 GUI has to be started per core. To bundle several cores in one processor as required by the system this command has to be used to define core and processor coordinates within the system topology. Further information can be found in SYStem.CONFIG.CORE. DRPRE (default: 0) <number> of TAPs in the JTAG chain between the core of interest and the TDO signal of the debugger. If each core in the system contributes only one TAP to the JTAG chain, DRPRE is the number of cores between the core of interest and the TDO signal of the debugger. DRPOST (default: 0) <number> of TAPs in the JTAG chain between the TDI signal of the debugger and the core of interest. If each core in the system contributes only one TAP to the JTAG chain, DRPOST is the number of cores between the TDI signal of the debugger and the core of interest. IRPRE (default: 0) <number> of instruction register bits in the JTAG chain between the core of interest and the TDO signal of the debugger. This is the sum of the instruction register length of all TAPs between the core of interest and the TDO signal of the debugger. IRPOST (default: 0) <number> of instruction register bits in the JTAG chain between the TDI signal and the core of interest. This is the sum of the instruction register lengths of all TAPs between the TDI signal of the debugger and the core of interest. TAPState (default: 7 = Select-DR-Scan) This is the state of the TAP controller when the debugger switches to tristate mode. All states of the JTAG TAP controller are selectable. TCKLevel (default: 0) Level of TCK signal when all debuggers are tristated. TriState (default: OFF) If several debuggers share the same debug port, this option is required. The debugger switches to tristate mode after each debug port access. Then other debuggers can access the port. JTAG: This option must be used, if the JTAG line of multiple debug boxes are connected by a JTAG joiner adapter to access a single JTAG chain. Slave (default: OFF) If more than one debugger share the same debug port, all except one must have this option active. JTAG: Only one debugger - the “master” - is allowed to control the signals nTRST and nSRST (nRESET). ©1989-2014 Lauterbach GmbH V850 Debugger and Trace 15 General System Settings Daisy-chain Example TDI Core A Core B Core C Chip 0 Core D TDO Chip 1 Below, configuration for core C. Instruction register length of • Core A: 3 bit • Core B: 5 bit • Core D: 6 bit SYStem.CONFIG.IRPRE 6 ; IR Core D SYStem.CONFIG.IRPOST 8 ; IR Core A + B SYStem.CONFIG.DRPRE 1 ; DR Core D SYStem.CONFIG.DRPOST 2 ; DR Core A + B SYStem.CONFIG.CORE 0. 1. ; Target Core C is Core 0 in Chip 1 ©1989-2014 Lauterbach GmbH V850 Debugger and Trace 16 General System Settings TapStates 0 Exit2-DR 1 Exit1-DR 2 Shift-DR 3 Pause-DR 4 Select-IR-Scan 5 Update-DR 6 Capture-DR 7 Select-DR-Scan 8 Exit2-IR 9 Exit1-IR 10 Shift-IR 11 Pause-IR 12 Run-Test/Idle 13 Update-IR 14 Capture-IR 15 Test-Logic-Reset ©1989-2014 Lauterbach GmbH V850 Debugger and Trace 17 General System Settings SYStem.CONFIG.CORE Assign core to TRACE32 instance Format: SYStem.CONFIG.CORE <coreindex> <chipindex> SYStem.MultiCore.CORE <coreindex> <chipindex> (deprecated) <chipindex>: 1…i <coreindex> 1…k Default coreindex: depends on the CPU, usually 1. for generic chips Default chipindex: derived from CORE= parameter of the Configuration File (config.t32). The CORE parameter is defined according to the start order of the GUI in T32Start with ascending values. To provide proper interaction between different parts of the debugger the systems topology must be mapped to the debuggers topology model. The debugger model abstracts chips and sub cores of these chips. Every GUI must be connect to one unused core entry in the debugger topology model. Once the SYStem.CPU is selected a generic chip or none generic chip is created at the default chipindex. None Generic Chips None generic chips have a fixed amount of sub cores with a fixed CPU type. First all cores have successive chipnumbers at their GUIs. Therefore you have to assign the coreindex and the chipindex for every core. Usually the debugger does not need further information to access cores in none generic chips, once the set-up is correct. Generic Chips Generic chips can accommodate an arbitrary amount of sub cores. The debugger still needs information how to connect to the individual cores e.g. by setting the JTAG chain coordinates. Start-up Process The debug system must not have an invalid state where a GUI is connected to a wrong core type of a none generic chip, two GUI are connected to the same coordinate or a GUI is not connected to a core. The initial state of the system is value since every new GUI uses a new chipindex according to its CORE= parameter of the Configuration File (config.t32). If the system contains less chips than initially assumed, the chips must be merged by calling SYStem.CONFIG.CORE. ©1989-2014 Lauterbach GmbH V850 Debugger and Trace 18 General System Settings SYStem.CPU CPU type selection Format: SYStem.CPU <cpu> <cpu>: 70F3143 | 70F3186 … Default selection: V850SA. Selects the CPU type. SYStem.CpuAccess Format: Run-time memory access (intrusive) SYStem.CpuAccess Enable | Denied | Nonstop Default: Denied. Enable Allow intrusive run-time memory access. In order to perform a memory read or write while the CPU is executing the program the debugger stops the program execution shortly. Each short stop takes 1 … 100 ms depending on the speed of the debug interface and on the number of the read/write accesses required. A red S in the state line of the TRACE32 screen indicates this intrusive behavior of the debugger. Denied Lock intrusive run-time memory access. Nonstop Lock all features of the debugger, that affect the run-time behavior. Nonstop reduces the functionality of the debugger to: • run-time access to memory and variables • trace display The debugger inhibits the following: • to stop the program execution • all features of the debugger that are intrusive (e.g. action Spot for breakpoints, performance analysis via StopAndGo mode, conditional breakpoints etc.) ©1989-2014 Lauterbach GmbH V850 Debugger and Trace 19 General System Settings SYStem.JtagClock Format: JTAG clock selection SYStem.JtagClock [<frequency>] SYStem.BdmClock [<frequency>] (deprecated). Default frequency: 1 MHz. Selects the JTAG port frequency (TCK). Any frequency up to 25 MHz can be entered, it will be generated by the debuggers internal PLL. For CPUs which come up with very low clock speeds it might be necessary to slow down the JTAG frequency. After initialization of the CPUs PLL the JTAG clock can be increased. If there are buffers, additional loads or high capacities on the JTAG/COP lines, reduce the debug speed. SYStem.LOCK Format: Lock and tristate the debug port SYStem.LOCK [ON | OFF] Default: OFF. If the system is locked, no access to the debug port will be performed by the debugger. While locked, the debug connector of the debugger is tristated. The main intention of the lock command is to give debug access to another tool. ©1989-2014 Lauterbach GmbH V850 Debugger and Trace 20 General System Settings SYStem.MemAccess Memory access selection Format: SYStem.MemAccess <mode> <mode>: QUiCK NBD Denied Selects the method for realtime memory access while the core is running. All debugger windows which are opened with the option /E will use the selected non intrusive memory access. QUICK Does a pseudo realtime access. For each single memory access the application is interrupted for about 50 CPU clocks (10 MHz --> 5 us interruption). This method can only be used if NO breakpoints are set. The JTAG clock speed should be as fast as possible to get good performance. NBD Requires extra debugger hardware to handle the CPUs NBD-interface. This interface allows a non intrusive memory access while the core is running. Denied Disables any realtime memory access. ©1989-2014 Lauterbach GmbH V850 Debugger and Trace 21 General System Settings SYStem.Mode System mode selection Format: SYStem.Mode <mode> <mode>: Down NoDebug Go Up Down Disables the Debugger. NoDebug Disables the Debugger. The debug interface is forced to high impedance mode. Go Resets the target with debug mode enabled and prepares the CPU for debug mode entry. After this command the CPU is in the SYStem.Up mode and running. Now, the processor can be stopped with the break command or until any break condition occurs. Up Resets the target and sets the CPU to debug mode. After execution of this command the CPU is stopped and prepared for debugging. All register are set to the default value. Attach Not supported. StandBy Not supported. SYStem.Option IMASKASM Format: Interrupt disable SYStem.Option IMASKASM [ON | OFF] Mask interrupts during assembler single steps. Useful to prevent interrupt disturbance during assembler single stepping. SYStem.Option IMASKHLL Format: Interrupt disable SYStem.Option IMASKHLL [ON | OFF] Mask interrupts during HLL single steps. Useful to prevent interrupt disturbance during HLL single stepping. ©1989-2014 Lauterbach GmbH V850 Debugger and Trace 22 General System Settings SYStem.Option PERSTOP Format: Disable cpu peripherals if stopped SYStem.Option PERSTOP [ON | OFF] Stop CPU peripherals if program is stopped. Useful to prevent timer exceptions. Only supported for V850/E2 cores. ©1989-2014 Lauterbach GmbH V850 Debugger and Trace 23 General System Settings Exception Lines Enable The V850 supports disabling of several CPU pins. This can be very useful to prevent watchdog resets or external NMI sources. SYStem.Option RESET Format: Reset line enable SYStem.Option RESET [ON | OFF] Enable/Disable Reset line. Default: ON SYStem.Option STOP Format: Stop line enable SYStem.Option STOP [ON | OFF] Enable/Disable Stop line. Default: ON SYStem.Option WAIT Format: Wait line enable SYStem.Option WAIT [ON | OFF] Enable/Disable Wait line. Default: ON ©1989-2014 Lauterbach GmbH V850 Debugger and Trace 24 Exception Lines Enable SYStem.Option REQest Format: Request line enable SYStem.Option REQ [ON | OFF] Enable/Disable Request line. Default: ON SYStem.Option NMI0 Format: NMI0 line enable SYStem.Option NMI0 [ON | OFF] Enable/Disable NMI0 line. Default: ON SYStem.Option NMI1 Format: NMI1 line enable SYStem.Option NMI1 [ON | OFF] Enable/Disable NMI1 line. Default: ON SYStem.Option NMI2 Format: NMI2 line enable SYStem.Option NMI2 [ON | OFF] Enable/Disable NMI2 line. Default: ON ©1989-2014 Lauterbach GmbH V850 Debugger and Trace 25 Exception Lines Enable SYStem.Option CPINT Format: CPINT line enable SYStem.Option CPINT [ON | OFF] Enable/Disable CPINT line. Default: ON ©1989-2014 Lauterbach GmbH V850 Debugger and Trace 26 Exception Lines Enable Trace System Settings SYStem.Option BTM Branch trace message Format: SYStem.Option BDM <mode> <mode>: ON OFF MIN MAX Select type of recorded branch trace messages: OFF Program flow trace is disabled. MAX Trace any branch-type, except “non-taken-conditional-branches”. ON (Default) like MAX but for ”taken-direct-branches” only the branch-sourceaddress is recorded. MIN Like ON but “unconditional-branches” are not recorded. ©1989-2014 Lauterbach GmbH V850 Debugger and Trace 27 Trace System Settings SYStem.Option DTM Data trace message Format: SYStem.Option DTM <mode> <mode>: OFF Read Write ReadWrite Select type of recorded data trace messages: OFF Data trace is disabled. Read Read-cycles are recorded’. Write Write-cycles are recorded’. readWrite Read- and Write-cycles are recorded’. SYStem.Option KEYCODE Format: Keycode SYStem.Option KEYCODE [<12x 8bit values>] Has to be the same value as present in CPUs ID-code input registers ID_IN[0..2]. The KEYCODE is sent to the CPU during system up to unlock the ID-Code-Protection unit. A matching KEYCODE is a must to get debug control. More details on ID-Code-Protection can be found in the CPUUsers-Manual. ©1989-2014 Lauterbach GmbH V850 Debugger and Trace 28 Trace System Settings SYStem.Option OPWIDTH Trace interface width Format: SYStem.Option OPWIDTH <mode> <mode>: 4 8 16 Selects the number of data channels of the trace interface. ©1989-2014 Lauterbach GmbH V850 Debugger and Trace 29 Trace System Settings SYStem.Option STALL Trace STALL mode Format: SYStem.Option TCMODE <mode> <mode>: ON OFF Selects Trace STALL mode. ON Program execution might be stalled to prevent overrun of trace interface. OFF Program execution is done in realtime. The trace interface might loose trace messages. SYStem.Option TCMODE Trace clock mode Format: SYStem.Option TCMODE <mode> <mode>: 1/1 1/2 1/2DDR Selects Trace clockspeed. 1/1: Trace clock is equal to CPU system clock. 1/2: Trace clock is equal to CPU system clock / 2. 1/2DDR: Not supported ©1989-2014 Lauterbach GmbH V850 Debugger and Trace 30 Trace System Settings Breakpoints There are two types of breakpoints available: Software breakpoints (SW-BP) and on-chip breakpoints (HWBP). Software Breakpoints Software breakpoints are the default breakpoints. A special breakcode is patched to memory so it only can be used in RAM or FLASH areas.There is no restriction in the number of software breakpoints. On-chip Breakpoints The following list gives an overview of the usage of the on-chip breakpoints by TRACE32-ICD: CPU Family Address Breakpoints Data Breakpoints Sequential Breakpoints V850E(S) all devices 2 ranges - include or exclude Qualifier for: - Instruction-Fetch - Data-Read - Data-Write - Size ANY/8/16/32 2 ranges - include or exclude A->B V850E(S) devices with ROM Correction Unit (RCU) 4 or 8 additional breakpoints on - Instruction-Fetch Only in Flash area - requires onchip break mapping MAP.BOnchip <range> - can be disabled with command TO.RCU OFF ©1989-2014 Lauterbach GmbH V850 Debugger and Trace 31 Breakpoints Breakpoint in ROM With the command MAP.BOnchip <range> it is possible to inform the debugger about ROM (FLASH,EPROM) address ranges in target. If a breakpoint is set within the specified address range the debugger uses automatically the available on-chip breakpoints. Example for Breakpoints Assume you have a target with FLASH from 0 to 0xFFFFF and RAM from 0x100000 to 0x11FFFF. The command to configure TRACE32 correctly for this configuration is: Map.BOnchip 0x0--0x0FFFFF The following breakpoint combinations are possible. Software breakpoints: Break.Set 0x100000 /Program ; Software Breakpoint 1 Break.Set 0x101000 /Program ; Software Breakpoint 2 Break.Set 0xx /Program ; Software Breakpoint 3 On-chip breakpoints: Break.Set 0x100 /Program ; On-chip Breakpoint 1 Break.Set 0x0ff00 /Program ; On-chip Breakpoint 2 ©1989-2014 Lauterbach GmbH V850 Debugger and Trace 32 Breakpoints TrOnchip Commands TrOnchip.view Format: Display on-chip trigger window TrOnchip.view Open TrOnchip window. TrOnchip.CONVert Format: Adjust range breakpoint in on-chip resource TrOnchip.CONVert [ON | OFF] The on-chip breakpoints can only cover specific ranges. If a range cannot be programmed into the breakpoint it will automatically be converted into a single address breakpoint when this option is active. This is the default. Otherwise an error message is generated. TrOnchip.CONVert ON Break.Set 0x1000--0x17ff /Write Break.Set 0x1001--0x17ff /Write … ; sets breakpoint at range ; 1000--17ff sets single breakpoint ; at address 1001 TrOnchip.CONVert OFF Break.Set 0x1000--0x17ff /Write Break.Set 0x1001--0x17ff /Write ; sets breakpoint at range ; 1000--17ff ; gives an error message ©1989-2014 Lauterbach GmbH V850 Debugger and Trace 33 TrOnchip Commands TrOnchip.SEQ Sequential breakpoints Format: TrOnchip.SEQ <mode> <mode>: OFF BA CBA DBCA This trigger-on-chip command selects sequential breakpoints. OFF Sequential break off. BA Sequential break, first condition, then second condition. CBA Sequential break, first condition, then second condition, then third conditon. DCBA Sequential break, first condition, then second condition, then third conditon and the fourth condition. Break.Set sieve /Charly /Program Var.Break.Set flags[3] /Delta /Write TrOnchip.SEQ CD TrOnchip.RCU Format: ROM-Correction breakpoints TrOnchip.RCU [OFF | ON] When enabled (default) the CPU’s Rom-Correction-Unit is used to extend the number of Onchip Breakpoints. RCU breakpoints can only be used for program breaks in the FLASH area. NOTE: A DBTRAP instruction code is visible at the break address. It is visible for program and data accesses, which causes trouble if the application does memory checking like CRC. ©1989-2014 Lauterbach GmbH V850 Debugger and Trace 34 TrOnchip Commands TrOnchip.RESet Format: Set on-chip trigger to default state TrOnchip.RESet Sets the TrOnchip settings and trigger module to the default settings. TrOnchip.SIZE Format: Trigger on byte, word, long memory accesses TrOnchip.SIZE [ON | OFF] If ON, breakpoints on single-byte, two-byte or four-byte addressranges only hit if the CPU accesses this ranges with a byte, word or long buscycle. Default: OFF TrOnchip.Set Alignment Format: Alignment error breakpoints TrOnchip.Set Alignment [OFF | ON] When enabled (default) the CPU stops program execution on any miss-aligned memory access. NOTE: Miss-aligned memory accesses are supported by the V850-ES core. The TrOnchip.Set Alignment should be set to OFF. ©1989-2014 Lauterbach GmbH V850 Debugger and Trace 35 TrOnchip Commands TrOnchip.Set MissAlign Format: Alignment error breakpoints TrOnchip.Set MissAlign [OFF | ON] When enabled (default) the CPU stops program execution on miss-align stack operations and on miss-align accesses in “miss-align access disable mode”. NOTE: Miss-aligned memory accesses are supported by the V850-ES core. The TrOnchip.Set MissAlign should be set to OFF. TrOnchip.VarCONVert Format: Adjust complex breakpoint in on-chip resource TrOnchip.VarCONVert [ON | OFF] The on-chip breakpoints can only cover specific ranges. If you want to set a marker or breakpoint to a complex variable, the on-chip break resources of the CPU may be not powerful enough to cover the whole structure. If the option TrOnchip.VarCONVert is on the breakpoint will automatically be converted into a single address breakpoint. This is the default setting. Otherwise an error message is generated. ©1989-2014 Lauterbach GmbH V850 Debugger and Trace 36 TrOnchip Commands Memory Classes The following memory classes are available: Memory Class Description P Program D Data (also DataFlash without ID-Tag) DF DataFlash with ID-Tag: Memory contents are presented as 64bit value Data: bit [31..0] ID-Tag: bit [32] DataFlash: Memory Class By default the DataFlash is handled like a normal 32bit flash memory, the ID-Tag is ignored. The contents are presented as 32bit values with addresses counting up 0x0, 0x4, 0x8, 0xC … (use command: Data.Dump D:<address> /Long). The presentation of the additional ID-Tag bit require slight changes in the display. By using the DF: memory class the ID-Tag is handled like an additional databit, so the data dump window shows 64bit values, whereas the address counting is still 0x0, 0x4, 0x8, 0xC … (use command Data.Dump DF:<address> /Quad). Because of the 64bit presentation a Data.Save <filename> DF:<addressrange> command will save double of data than defined by the addressrange. Also the download of dataflash contents with ID-Tag require double of data than defined by the addressrange (Data.Load <filename> DF:<address>). ©1989-2014 Lauterbach GmbH V850 Debugger and Trace 37 Memory Classes Trace tbd. ©1989-2014 Lauterbach GmbH V850 Debugger and Trace 38 Trace NBD Interface The usage of NBD (Non Break Debug Interface) requires extra debug hardware to get access to the CPUs NBD interface. This extra hardware is plugged in between the debug box and the debug dongle. Connection to the CPUs NBD interface is done by a 16pin flat cable. The interface allows realtime access to target memory while the application program is running. Furthermore it allows the access to certain debug configuration registers to: • Replace CPU internal FLASH by RAM in blocks of 4 KByte • Activate the NBD_TRIGGER signal on access to certain memory locations • Readout the CPUs ID-code The NBD configuration registers are accessible in the CPUs peripheral window. ©1989-2014 Lauterbach GmbH V850 Debugger and Trace 39 NBD Interface Runtime Measurement Runtime measurement is done with about 5 µs resolution. The debuggers RUNTIME window gives detailed information about the complete run-time of the application code and the run-time since the last GO/STEP/STEP-OVER command. ©1989-2014 Lauterbach GmbH V850 Debugger and Trace 40 Runtime Measurement JTAG Connector Connector 20 pin 100mil /NWire Signal GND GND GND GND GND GND GND GND GND GND Pin 1 3 5 7 9 11 13 15 17 19 Pin 2 4 6 8 10 12 14 16 18 20 Signal DCK DMS DDI DRSTPORT0IN RESETFLMD0 PORT1IN/RDYZ DDO VDD JTAG Connector Signal Description CPU Signal DMS JTAG-TMS, output of debugger TMS DDI JTAG-TDI, output of debugger TDI DCK JTAG-TCK, output of debugger TCK TRST JTAG-TRST, output of debugger TRST DDO JTAG-TDO, input for debugger TDO RESET RESET input/output of debugger - Force target Reset - Sense target Reset (see application note) RESET FLMD0 FLASH Mode0 signal - enable flash programming (see application note) FLMD0 PortIn0 Input Port for Debugger, currently unused not connected PortIn1/RDYZ READY- input of debugger, only used for E2 core CPUs like Px4 RDYZ ©1989-2014 Lauterbach GmbH V850 Debugger and Trace 41 JTAG Connector Trace Connector The default connection for trace support is MICTOR. With additional adaptors also KEL and GlenAir is supported. Connector MICTOR/N-Wire and Trace Signal GND DCK DMS DDI DDO N/C N/C N/C TRCCLK TRCEND TRCDATA0 TRCDATA1 TRCDATA2 TRCDATA3 TRCDATA4 TRCDATA5 TRCDATA6 TRCDATA7 GND Pin 1 3 5 7 9 11 13 15 17 19 21 23 25 27 29 31 33 35 37 Pin 2 4 6 8 10 12 14 16 18 20 22 24 26 28 30 32 34 36 38 Signal GND VDD DRSTRESETFLMD0 RESERVED RESERVED PORT1IN PORT2IN TRCCE TRCDATA8 TRCDATA9 TRCDATA10 TRCDATA11 TRCDATA12 TRCDATA13 TRCDATA14 TRCDATA15 GND ©1989-2014 Lauterbach GmbH V850 Debugger and Trace 42 Trace Connector Connector KEL/N-Wire and Trace A13 B13 A12 B12 A11 A3 B11 B3 A2 B2 A1 Top View B1 Pin Number Signal Name Input/Output (User Side) Treatment (User Side) A1 CLKOUT Output 22 … 33 series resistor (recommended) A2 TRCDATA0 Output 22 … 33 series resistor (recommended) A3 TRCDATA1 Output 22 … 33 series resistor (recommended) A4 TRCDATA2 Output 22 … 33 series resistor (recommended) A5 TRCDATA3 Output 22 … 33 series resistor (recommended) A6 TRCEND Output 22 … 33 series resistor (recommended) A7 DDI Input 10 k pull-up A8 DCK Input 10 k pull-up A9 DMS Input 10 k pull-up A10 DDO Output 22 … 33 series resistor (recommended) A11 DRST Input 10 k pull-up A12 RESET Input 10 k pull-up A13 FLMD0 Input open B1 … B10 GND - Connection to the power GND B11 Port0_In - Open B12 Port1_IN - Open B13 + 3.3 V - Connection to the power ©1989-2014 Lauterbach GmbH V850 Debugger and Trace 43 Trace Connector NBD Connector Signal TRIGOUTCLK SYNC DATA0 DATA1 DATA2 MODE Pin 1 3 5 7 9 11 13 15 Pin 2 4 6 8 10 12 14 16 Signal VCC GND GND GND GND GND DATA3 RESETO- NBD Connector Signal Description CPU Signal TRIG NBD_Trigger signal, debugger input TRIG_DBG OUT NBD_DataDirection signal, debugger output usually not used A LOW indicates direction Interface --> CPU CLK NBD_Clock, debugger output CLK_DBG SYNC NBD_SYNC signal, debugger output SYNC_DBG# DATA[3 … 0] NBD_DATA[3 … 0], debugger input/output AD[3 … 0]_DBG MODE NBD_Mode enable, debugger output MODE_NBD RESETO NBD_ResetOut signal, debugger input RESETO_DBG Indicates any kind of Reset forced to the CPU VCC Reference Voltage for NBD Interface (2 … 5 V) debugger input PowerSupply of user system ©1989-2014 Lauterbach GmbH V850 Debugger and Trace 44 NBD Connector Support 703500 703538 70F3111 70F3134 70F3186 70F3187 70F3231 70F3231Y 70F3232 70F3232Y 70F3233 70F3233Y 70F3234 70F3234Y 70F3235 70F3235Y 70F3236 70F3236Y 70F3237 70F3237Y 70F3238 70F3238Y 70F3239 70F3239Y 70F3261 70F3261Y 70F3263 70F3263Y 70F3264 70F3264Y 70F3266 70F3266Y 70F3271 70F3271Y YES YES YES YES YES YES YES YES YES YES YES YES YES YES YES YES YES YES YES YES YES YES YES YES YES YES YES YES YES YES YES YES YES YES YES INSTRUCTION SIMULATOR POWER INTEGRATOR ICD TRACE ICD MONITOR ICD DEBUG FIRE ICE CPU Available Tools YES YES YES YES YES YES YES YES YES YES YES YES YES YES YES YES YES YES YES YES YES YES YES YES YES YES YES YES YES YES YES YES YES YES ©1989-2014 Lauterbach GmbH V850 Debugger and Trace 45 Support YES YES YES YES YES YES YES YES YES YES YES YES YES YES YES YES YES YES YES YES YES YES YES YES YES YES YES YES YES YES YES YES YES YES YES YES YES YES YES YES YES INSTRUCTION SIMULATOR POWER INTEGRATOR ICD TRACE ICD MONITOR ICD DEBUG FIRE ICE CPU 70F3273 70F3273Y 70F3274 70F3274Y 70F3276 70F3276Y 70F3281 70F3281Y 70F3283 70F3283Y 70F3284 70F3284Y 70F3286 70F3286Y 70F3288 70F3288Y 70F3318 70F3319 70F3320 70F3325 70F3333 70F3334 70F3335 70F3336 70F3340 70F3341 70F3342 70F3343 70F3344 70F3345 70F3346 70F3347 70F3348 70F3350 70F3351 70F3352 70F3353 70F3354 70F3355 70F3356 70F3357 YES YES YES YES YES YES YES YES YES YES YES YES YES YES YES YES YES YES YES YES YES YES YES YES YES YES YES YES YES YES YES YES YES YES YES YES YES YES YES YES YES ©1989-2014 Lauterbach GmbH V850 Debugger and Trace 46 Support YES YES YES YES YES YES YES YES YES YES YES YES YES YES YES YES YES YES YES YES YES YES YES YES YES YES YES YES YES YES YES YES YES YES YES YES YES YES YES YES YES INSTRUCTION SIMULATOR POWER INTEGRATOR ICD TRACE ICD MONITOR ICD DEBUG FIRE ICE CPU 70F3358 70F3364 70F3365 70F3366 70F3367 70F3368 70F3370 70F3371 70F3372 70F3373 70F3374 70F3375 70F3376 70F3377 70F3378 70F3379 70F3380 70F3381 70F3382 70F3383 70F3384 70F3385 70F3402 70F3403 70F3416 70F3417 70F3420 70F3421 70F3422 70F3423 70F3424 70F3425 70F3426 70F3427 70F3440 70F3441 70F3461 70F3474 70F3475 70F3476 70F3477 YES YES YES YES YES YES YES YES YES YES YES YES YES YES YES YES YES YES YES YES YES YES YES YES YES YES YES YES YES YES YES YES YES YES YES YES YES YES YES YES YES ©1989-2014 Lauterbach GmbH V850 Debugger and Trace 47 Support YES YES YES YES YES YES YES YES YES YES YES YES YES YES YES YES YES YES YES YES YES YES YES YES YES YES YES YES YES YES YES YES YES YES YES YES YES YES YES YES YES INSTRUCTION SIMULATOR POWER INTEGRATOR ICD TRACE ICD MONITOR ICD DEBUG FIRE ICE CPU 70F3478 70F3479 70F3480 70F3481 70F3482 70F3486 70F3487 70F3488 70F3502 70F3503 70F3504 70F3505 70F3506 70F3507 70F3508 70F3509 70F3522 70F3523 70F3524 70F3525 70F3526 70F3529 70F3530 70F3532 70F3535 70F3536 70F3537 70F3548 70F3549 70F3550 70F3551 70F3552 70F3553 70F3554 70F3555 70F3556 70F3557 70F3558 70F3559 70F3560 70F3561 YES YES YES YES YES YES YES YES YES YES YES YES YES YES YES YES YES YES YES YES YES YES YES YES YES YES YES YES YES YES YES YES YES YES YES YES YES YES YES YES YES ©1989-2014 Lauterbach GmbH V850 Debugger and Trace 48 Support YES YES YES YES YES YES YES YES YES YES YES YES YES YES YES YES YES YES YES YES YES YES YES YES YES YES YES YES YES YES YES YES YES YES YES YES YES YES YES YES YES INSTRUCTION SIMULATOR POWER INTEGRATOR ICD TRACE ICD MONITOR ICD DEBUG FIRE ICE CPU 70F3562 70F3563 70F3564 70F3565 70F3566 70F3567 70F3568 70F3569 70F3570 70F3571 70F3572 70F3573 70F3574 70F3575 70F3576 70F3577 70F3578 70F3579 70F3580 70F3581 70F3582 70F3583 70F3584 70F3585 70F3586 70F3587 70F3588 70F3589 70F3592 70F3700 70F3701 70F3702 70F3703 70F3704 70F3706 70F3707 70F3709 70F3710 70F3711 70F3712 70F3715 YES YES YES YES YES YES YES YES YES YES YES YES YES YES YES YES YES YES YES YES YES YES YES YES YES YES YES YES YES YES YES YES YES YES YES YES YES YES YES YES YES ©1989-2014 Lauterbach GmbH V850 Debugger and Trace 49 Support YES YES YES YES YES YES YES YES YES YES YES YES YES YES YES YES YES YES YES YES YES YES YES YES YES YES YES YES YES YES YES YES YES YES YES YES YES YES YES YES YES INSTRUCTION SIMULATOR POWER INTEGRATOR ICD TRACE ICD MONITOR ICD DEBUG FIRE ICE CPU 70F3716 70F3717 70F3718 70F3719 70F3720 70F3721 70F3722 70F3723 70F3724 70F3735 70F3736 70F3737 70F3738 70F3739 70F3740 70F3741 70F3742 70F3743 70F3744 70F3745 70F3746 70F3747 70F3750 70F3752 70F3755 70F3757 70F3778 70F3779 70F3780 70F3781 70F3782 70F3783 70F3784 70F3785 70F3786 70F3787 70F3797 70F3798 70F3799 70F3800 70F3801 YES YES YES YES YES YES YES YES YES YES YES YES YES YES YES YES YES YES YES YES YES YES YES YES YES YES YES YES YES YES YES YES YES YES YES YES YES YES YES YES YES ©1989-2014 Lauterbach GmbH V850 Debugger and Trace 50 Support YES YES YES YES YES YES YES YES YES YES YES YES YES YES YES YES YES YES YES YES YES YES YES YES YES YES YES YES YES YES YES YES YES YES YES YES YES YES YES YES YES INSTRUCTION SIMULATOR POWER INTEGRATOR ICD TRACE ICD MONITOR ICD DEBUG FIRE ICE CPU 70F3802 70F3803 70F3804 70F3805 70F3806 70F3807 70F3808 70F3809 70F3810 70F3811 70F3812 70F3813 70F3814 70F3815 70F3816 70F3817 70F3818 70F3819 70F3820 70F3821 70F3822 70F3823 70F3824 70F3825 70F3826 70F3827 70F3828 70F3829 70F3830 70F3831 70F3832 70F3833 70F3834 70F3835 70F3836 70F3837 70F3913 70F3914 70F3915 70F3916 70F3917 YES YES YES YES YES YES YES YES YES YES YES YES YES YES YES YES YES YES YES YES YES YES YES YES YES YES YES YES YES YES YES YES YES YES YES YES YES YES YES YES YES ©1989-2014 Lauterbach GmbH V850 Debugger and Trace 51 Support YES YES YES YES YES YES YES YES YES YES YES YES YES YES YES YES YES YES YES YES YES YES YES YES YES YES YES YES YES YES YES YES YES YES YES YES YES YES YES YES YES YES INSTRUCTION SIMULATOR POWER INTEGRATOR ICD TRACE ICD MONITOR ICD DEBUG FIRE ICE CPU 70F3918 70F3919 70F3920 70F3921 70F3922 70F3923 70F3924 70F3925 70F3926 70F3927 70F3931 70F3932 70F3933 70F3934 70F3935 70F3936 70F3937 70F3938 70F3939 70F4000 70F4001 70F4002 70F4003 70F4004 70F4005 70F4006 70F4007 70F4008 70F4009 70F4010 70F4011 70F4012 NB85E NB85ET V850E/IA4 V850E/MA3 V850E/ME2 V850E/ME3 V850E/PH2 V850E/PH3 V850E/PHOENIX-F YES YES YES YES YES YES YES YES YES YES YES YES YES YES YES YES YES YES YES YES YES YES YES YES YES YES YES YES YES YES YES YES YES YES YES YES YES YES YES YES YES ©1989-2014 Lauterbach GmbH V850 Debugger and Trace 52 Support YES YES YES YES YES YES YES YES YES YES YES YES YES YES YES YES YES YES YES YES YES YES YES YES YES YES YES YES YES YES YES YES YES YES YES YES YES YES YES YES YES INSTRUCTION SIMULATOR POWER INTEGRATOR ICD TRACE ICD MONITOR ICD DEBUG FIRE ICE CPU V850E/PHOENX-FS V850E/RS1 V850ES/DG2 V850ES/DG3 V850ES/DJ2 V850ES/DJ3 V850ES/DJ4 V850ES/DK4-H V850ES/DL3 V850ES/DN4-H V850ES/DR4-3D V850ES/DX3 V850ES/DX4 V850ES/FE2 V850ES/FE3 V850ES/FF2 V850ES/FF3 V850ES/FG2 V850ES/FG3 V850ES/FJ2 V850ES/FJ3 V850ES/FK3 V850ES/HE2 V850ES/HE3 V850ES/HF2 V850ES/HF3 V850ES/HG2 V850ES/HG3 V850ES/HJ2 V850ES/HJ3 V850ES/HX2 V850ES/HX3 V850ES/IG4 V850ES/IG4-H V850ES/IH4 V850ES/IH4-H V850ES/IX4 V850ES/IX4-H V850ES/JC3-H V850ES/JC3-L V850ES/JD3-H YES YES YES YES YES YES YES YES YES YES YES YES YES YES YES YES YES YES YES YES YES YES YES YES YES YES YES YES YES YES YES YES YES YES YES YES YES YES YES YES YES ©1989-2014 Lauterbach GmbH V850 Debugger and Trace 53 Support YES YES YES YES YES YES YES YES YES YES YES YES YES YES YES YES YES YES YES YES YES YES YES YES YES YES YES YES YES YES YES YES YES YES YES YES YES YES INSTRUCTION SIMULATOR POWER INTEGRATOR ICD TRACE ICD MONITOR ICD DEBUG FIRE ICE CPU V850ES/JE3-E V850ES/JE3-H V850ES/JE3-L V850ES/JF3-E V850ES/JF3-L V850ES/JG2 V850ES/JG3 V850ES/JG3-E V850ES/JG3-L V850ES/JH3-E V850ES/JJ2 V850ES/JJ3 V850ES/JJ3-E V850ES/JK1+ V850ES/JX2 V850ES/JX3 V850ES/JX3-E V850ES/JX3-H V850ES/JX3-L V850ES/PG4 V850ES/PJ4 V850ES/PX4 V850ES/SG2 V850ES/SG3 V850ES/SJ2 V850ES/SJ3 V850ES/SJ3-H V850ES/SK3-H V850FE4-L V850FF4-L V850FG4 V850FG4-L V850FJ4 V850FJ4-L V850FK4 V850FK4-H V850FK4-L V850FKG4 YES YES YES YES YES YES YES YES YES YES YES YES YES YES YES YES YES YES YES YES YES YES YES YES YES YES YES YES YES YES YES YES YES YES YES YES YES YES ©1989-2014 Lauterbach GmbH V850 Debugger and Trace 54 Support YES YES YES YES YES INSTRUCTION SIMULATOR POWER INTEGRATOR ICD TRACE ICD MONITOR ICD DEBUG FIRE ICE CPU V850FL4 V850FL4-H V850FM4-H V850FX4-H V850FX4-L YES YES YES YES YES Compilers Language Compiler Company Option C GCCV850 ELF/STABS C C C GREENHILLS-C ICCV850 CA850 Free Software Foundation, Inc. Greenhills Software Inc. IAR Systems AB Renesas Technology, Corp. Comment ELF/DWARF UBROF ELF/NEC ©1989-2014 Lauterbach GmbH V850 Debugger and Trace 55 Support Realtime Operation Systems Name Company Comment Elektrobit tresos Erika OSEK ProOSEK uC/OS-II Elektrobit Automotive GmbH Evidence Elektrobit Automotive GmbH Micrium Inc. via ORTI via ORTI via ORTI via ORTI 2.0 to 2.8 3rd Party Tool Integrations CPU Tool Company ALL ALL ALL ADENEO X-TOOLS / X32 CODEWRIGHT ALL CODE CONFIDENCE TOOLS CODE CONFIDENCE TOOLS EASYCODE ECLIPSE RHAPSODY IN MICROC RHAPSODY IN C++ LDRA TOOL SUITE ATTOL TOOLS VISUAL BASIC INTERFACE LABVIEW Adeneo Embedded blue river software GmbH Borland Software Corporation Code Confidence Ltd ALL ALL ALL ALL ALL ALL ALL ALL ALL ALL ALL ALL ALL ALL ALL ALL CODE::BLOCKS C++TEST RAPITIME DA-C SIMULINK VECTORCAST/RSP WINDOWS CE PLATF. BUILDER Host Windows Windows Windows Code Confidence Ltd Linux EASYCODE GmbH Eclipse Foundation, Inc IBM Corp. IBM Corp. LDRA Technology, Inc. MicroMax Inc. Microsoft Corporation Windows Windows Windows Windows Windows Windows Windows NATIONAL INSTRUMENTS Corporation Open Source Parasoft Rapita Systems Ltd. RistanCASE The MathWorks Inc. Vector Software Windows Windows Windows Windows Windows Windows Windows Windows ©1989-2014 Lauterbach GmbH V850 Debugger and Trace 56 Support Products Product Information OrderNo Code Text LA-7835 N-Wire Debugger for V850 (ICD) JTAG-V850 supports NEC V850 with N-Wire includes software for Windows, Linux and MacOSX requires Power Debug Interface USB 2.0/USB 3.0, Power Debug Ethernet or Power Debug II debug cable with 20 pin connector requires LA-7936 if KEL connector is used on the target requires LA-7937 if Mictor connector is used on the target LA-7936 Converter KEL to 20 Pin/100 mil CONV-V850/VR-KEL Converter KEL connector to debug cable LA-7937 JTAG Converter to Mictor38 for V850/NEC VR CONV-V850/VR-MICTOR Converter from 20 pin male connector of LA-7835 (N-Wire Debugger for V850) LA-7842 (N-Wire Debugger for NEC VR-Series) to Mictor38 LA-7939 NBD Box for Real-Time-Memory-Access V850 NBD-BOX-V850 NBD Interface support for V850 allows real-time-memory access to target memory Placed between Power Debug Module and Debug Cable 16 Pin/100 mil connection to target Requires: PowerDebugUSB 2, PowerDebugEthernet or PowerTrace LA-3718 Converter V850-20 Pin to E1-14 Pin CONV-V850-E1 Converter V850-20 Pin to E1-14 Pin Order Information Order No. Code Text LA-7835 LA-7936 LA-7937 LA-7939 LA-3718 JTAG-V850 CONV-V850/VR-KEL CONV-V850/VR-MICTOR NBD-BOX-V850 CONV-V850-E1 N-Wire Debugger for V850 (ICD) Converter KEL to 20 Pin/100 mil JTAG Converter to Mictor38 for V850/NEC VR NBD Box for Real-Time-Memory-Access V850 Converter V850-20 Pin to E1-14 Pin Additional Options ©1989-2014 Lauterbach GmbH V850 Debugger and Trace 57 Products Order No. Code Text LA-2102 LA-2101 LA-7960X AD-HS-16 AD-HS-20 MULTICORE-LICENSE Adapter Half-Size 16 pin Adapter Half-Size 20 pin License for Multicore Debugging ©1989-2014 Lauterbach GmbH V850 Debugger and Trace 58 Products