1
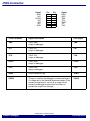
Blackfin Debugger TRACE32 Online Help TRACE32 Directory TRACE32 Index TRACE32 Documents ...................................................................................................................... ICD In-Circuit Debugger ................................................................................................................ Processor Architecture Manuals .............................................................................................. Blackfin .................................................................................................................................... Blackfin Debugger ................................................................................................................ 1 General Note ...................................................................................................................... 3 Brief Overview of Documents for New Users ................................................................. 3 Warning .............................................................................................................................. 4 Application Note ................................................................................................................ 5 Location of Debug Connector 5 Quick Start JTAG ............................................................................................................... 6 Troubleshooting ................................................................................................................ 8 SYStem.Up Errors 8 FAQ ..................................................................................................................................... 8 Configuration ..................................................................................................................... 9 System Overview 9 General System Settings .................................................................................................. SYStem.CONFIG Configure debugger according to target topology 10 10 Daisy-chain Example 12 TapStates 13 SYStem.CONFIG.CORE SYStem.CPU SYStem.CpuAccess 14 CPU type selection 15 Run-time memory access (intrusive) 15 JTAG clock selection 16 Lock and tristate the debug port 16 Real-time memory access (non-intrusive) 17 SYStem.JtagClock SYStem.LOCK SYStem.MemAccess Assign core to TRACE32 instance System mode selection 18 SYStem.Option IMASKASM SYStem.Mode Interrupt disable 18 SYStem.Option IMASKHLL Interrupt disable 18 Breakpoints ........................................................................................................................ 19 Software Breakpoints 19 ©1989-2015 Lauterbach GmbH Blackfin Debugger 1 On-chip Breakpoints 19 Breakpoint in ROM 19 Example for Breakpoints 20 Memory Classes ................................................................................................................ 21 JTAG Connector ................................................................................................................ 22 Support ............................................................................................................................... 23 Available Tools 23 Compilers 23 Realtime Operation Systems 23 3rd Party Tool Integrations 25 Products ............................................................................................................................. 26 Product Information 26 Order Information 26 ©1989-2015 Lauterbach GmbH Blackfin Debugger 2 Blackfin Debugger Version 06-Nov-2015 30-Jun-14 TrBus.Out and TrBus.Set were moved to general_ref_t.pdf. General Note This documentation describes the processor specific settings and features for the Blackfin Embedded Media Processor. TRACE32-ICD supports all Blackfin devices which are equipped with the JTAG debug interface. If some of the described functions, options, signals or connections in this Processor Architecture Manual are only valid for a single CPU the name is added in brackets. Brief Overview of Documents for New Users Architecture-independent information: • ”Debugger Basics - Training” (training_debugger.pdf): Get familiar with the basic features of a TRACE32 debugger. • ”T32Start” (app_t32start.pdf): T32Start assists you in starting TRACE32 PowerView instances for different configurations of the debugger. T32Start is only available for Windows. • “General Commands” (general_ref_<x>.pdf): Alphabetic list of debug commands. Architecture-specific information: • “Processor Architecture Manuals”: These manuals describe commands that are specific for the processor architecture supported by your debug cable. To access the manual for your processor architecture, proceed as follows: - • Choose Help menu > Processor Architecture Manual. “RTOS Debugger” (rtos_<x>.pdf): TRACE32 PowerView can be extended for operating systemaware debugging. The appropriate RTOS manual informs you how to enable the OS-aware debugging. ©1989-2015 Lauterbach GmbH Blackfin Debugger 3 General Note Warning Signal Level The debugger output voltage follows the target voltage level. It supports a voltage range of 0.4 … 5.2 V. ESD Protection NOTE: To prevent debugger and target from damage it is recommended to connect or disconnect the debug cable only while the target power is OFF. Recommendation for the software start: • Disconnect the debug cable from the target while the target power is off. • Connect the host system, the TRACE32 hardware and the debug cable. • Start the TRACE32 software. • Connect the debug cable to the target. • Switch the target power ON. Power down: • Switch off the target power. • Disconnect the debug cable from the target. ©1989-2015 Lauterbach GmbH Blackfin Debugger 4 Warning Application Note Location of Debug Connector Locate the debug connector on your target board as close as possible to the processor to minimize the capacitive influence of the trace length and cross coupling of noise onto the JTAG signals. ©1989-2015 Lauterbach GmbH Blackfin Debugger 5 Application Note Quick Start JTAG Starting up the Debugger is done as follows: 1. Select the device prompt B: for the ICD Debugger, if the device prompt is not active after the TRACE32 software was started. b: 2. Select the CPU type to load the CPU specific settings. SYStem.CPU BF537 3. Enter debug mode: SYStem.Up This command resets the CPU and enters debug mode. After the execution of this command access to the registers and to memory is possible. Before performing the first access to external SDRAM or FLASH the External Bus Interface Unit (EBIU) must be configured. 4. The following command sequence is for the BF537 processor and configures the SDRAM controller with default values that were derived for maximum flexibility. They work for a system clock frequency between 54 MHz and 133 MHz. In the example a ST M29W320DB flash device is used in 16-bit mode. All four memory banks and CLKOUT are enabled. ; configure SDRAM controller Data.Set 0xFFC00A1sLONG 0x0091998D Data.Set 0xFFC00A14 %WORD 0x0025 Data.Set 0xFFC00A1C %WORD 0x03A0 ; enable all flash memory banks and clock out Data.Set 0xFFC00A00 %WORD 0x00FF ; ST M29W320DB flash device in 16-bit mode FLASH.Create 1. 0x20000000--0x20003FFF 0x4000 FLASH.Create 1. 0x20004000--0x20007FFF 0x2000 FLASH.Create 1. 0x20008000--0x2000FFFF 0x8000 FLASH.Create 1. 0x20010000--0x203FFFFF 0x10000 ; EBIU_SDGCTL ; EBIU_SDBCTL ; EBIU_SDRRC ; EBIU_AMGCTL AM29LV100 AM29LV100 AM29LV100 AM29LV100 Word Word Word Word ©1989-2015 Lauterbach GmbH Blackfin Debugger 6 Quick Start JTAG 5. Load the program. Data.LOAD.Elf demo.dxe ; The file demo.dxe is in ELF format The option of the Data.LOAD command depends on the file format generated by the compiler. For information on the compiler options refer to the section Compiler. A detailed description of the Data.LOAD command is given in the “General Commands Reference”. The start up can be automated using the programming language PRACTICE. A typical start sequence is shown below: b:: ; Select the ICD device prompt WinClear ; Delete all windows SYStem.CPU BF537 ; select the processor SYStem.Up ; Reset the target and enter debug mode Data.Load.Elf sieve.dxe ; Load the application Register.Set PC main ; Set the PC to function main Data.List ; Open disassembly window *) Register ; Open register window *) PER.view ; Open window with peripheral register *) Break.Set sieve ; Set breakpoint to function sieve Break.Set 0x1000 /p ; Set on-chip breakpoint to address 1000 ; Refer to the restrictions in ; On-chip Breakpoints. *) These commands open windows on the screen. The window position can be specified with the WinPOS command. ©1989-2015 Lauterbach GmbH Blackfin Debugger 7 Quick Start JTAG Troubleshooting SYStem.Up Errors The SYStem.Up command is the first command of a debug session where communication with the target is required. If you receive error messages while executing this command this may have the following reasons. All The target has no power. All There are additional loads or capacities on the JTAG lines. All The JTAG clock is too fast. FAQ No information available ©1989-2015 Lauterbach GmbH Blackfin Debugger 8 Troubleshooting Configuration System Overview HUB PC or Workstation 1 GBit Ethernet Target PODBUS SYNC SELECT ACTIVITY ETHERNET DEBUG CABLE DEBUG CABLE LINK POWER 7-9 V PODBUS OUT LAUTERBACH LAUTERBACH RUNNING USB Ethernet Cable Debug Cable POWER DEBUG II POWER PODBUS EXPRESS OUT JTAG Connector TRIG POWER DEBUG II AC/DC Adapter ©1989-2015 Lauterbach GmbH Blackfin Debugger 9 Configuration General System Settings SYStem.CONFIG Configure debugger according to target topology Format: SYStem.CONFIG <parameter> <number_or_address> SYStem.MultiCore <parameter> <number_or_address> (deprecated) <parameter> (General): state CORE (JTAG): DRPRE <bits> DRPOST <bits> IRPRE <bits> IRPOST <bits> TAPState <state> TCKLevel <level> TriState [ON | OFF] Slave [ON | OFF] <core> The four parameters IRPRE, IRPOST, DRPRE, DRPOST are required to inform the debugger about the TAP controller position in the JTAG chain, if there is more than one core in the JTAG chain (e.g. ARM + DSP). The information is required before the debugger can be activated e.g. by a SYStem.Up. See Daisychain Example. For some CPU selections (SYStem.CPU) the above setting might be automatically included, since the required system configuration of these CPUs is known. TriState has to be used if several debuggers (“via separate cables”) are connected to a common JTAG port at the same time in order to ensure that always only one debugger drives the signal lines. TAPState and TCKLevel define the TAP state and TCK level which is selected when the debugger switches to tristate mode. Please note: nTRST must have a pull-up resistor on the target, TCK can have a pull-up or pull-down resistor, other trigger inputs needs to be kept in inactive state. Multicore debugging is not supported for the DEBUG INTERFACE (LA-7701). ©1989-2015 Lauterbach GmbH Blackfin Debugger 10 General System Settings state Show multicore settings. CORE For multicore debugging one TRACE32 GUI has to be started per core. To bundle several cores in one processor as required by the system this command has to be used to define core and processor coordinates within the system topology. Further information can be found in SYStem.CONFIG.CORE. DRPRE (default: 0) <number> of TAPs in the JTAG chain between the core of interest and the TDO signal of the debugger. If each core in the system contributes only one TAP to the JTAG chain, DRPRE is the number of cores between the core of interest and the TDO signal of the debugger. DRPOST (default: 0) <number> of TAPs in the JTAG chain between the TDI signal of the debugger and the core of interest. If each core in the system contributes only one TAP to the JTAG chain, DRPOST is the number of cores between the TDI signal of the debugger and the core of interest. IRPRE (default: 0) <number> of instruction register bits in the JTAG chain between the core of interest and the TDO signal of the debugger. This is the sum of the instruction register length of all TAPs between the core of interest and the TDO signal of the debugger. IRPOST (default: 0) <number> of instruction register bits in the JTAG chain between the TDI signal and the core of interest. This is the sum of the instruction register lengths of all TAPs between the TDI signal of the debugger and the core of interest. TAPState (default: 7 = Select-DR-Scan) This is the state of the TAP controller when the debugger switches to tristate mode. All states of the JTAG TAP controller are selectable. TCKLevel (default: 0) Level of TCK signal when all debuggers are tristated. TriState (default: OFF) If several debuggers share the same debug port, this option is required. The debugger switches to tristate mode after each debug port access. Then other debuggers can access the port. JTAG: This option must be used, if the JTAG line of multiple debug boxes are connected by a JTAG joiner adapter to access a single JTAG chain. Slave (default: OFF) If more than one debugger share the same debug port, all except one must have this option active. JTAG: Only one debugger - the “master” - is allowed to control the signals nTRST and nSRST (nRESET). ©1989-2015 Lauterbach GmbH Blackfin Debugger 11 General System Settings Daisy-chain Example TDI Core A Core B Core C Chip 0 Core D TDO Chip 1 Below, configuration for core C. Instruction register length of • Core A: 3 bit • Core B: 5 bit • Core D: 6 bit SYStem.CONFIG.IRPRE 6 ; IR Core D SYStem.CONFIG.IRPOST 8 ; IR Core A + B SYStem.CONFIG.DRPRE 1 ; DR Core D SYStem.CONFIG.DRPOST 2 ; DR Core A + B SYStem.CONFIG.CORE 0. 1. ; Target Core C is Core 0 in Chip 1 ©1989-2015 Lauterbach GmbH Blackfin Debugger 12 General System Settings TapStates 0 Exit2-DR 1 Exit1-DR 2 Shift-DR 3 Pause-DR 4 Select-IR-Scan 5 Update-DR 6 Capture-DR 7 Select-DR-Scan 8 Exit2-IR 9 Exit1-IR 10 Shift-IR 11 Pause-IR 12 Run-Test/Idle 13 Update-IR 14 Capture-IR 15 Test-Logic-Reset ©1989-2015 Lauterbach GmbH Blackfin Debugger 13 General System Settings SYStem.CONFIG.CORE Assign core to TRACE32 instance Format: SYStem.CONFIG.CORE <coreindex> <chipindex> SYStem.MultiCore.CORE <coreindex> <chipindex> (deprecated) <chipindex>: 1…i <coreindex>: 1…k Default coreindex: depends on the CPU, usually 1. for generic chips Default chipindex: derived from CORE= parameter of the configuration file (config.t32). The CORE parameter is defined according to the start order of the GUI in T32Start with ascending values. To provide proper interaction between different parts of the debugger the systems topology must be mapped to the debuggers topology model. The debugger model abstracts chips and sub-cores of these chips. Every GUI must be connect to one unused core entry in the debugger topology model. Once the SYStem.CPU is selected a generic chip or none generic chip is created at the default chipindex. None Generic Chips None generic chips have a fixed amount of sub-cores with a fixed CPU type. First all cores have successive chip numbers at their GUIs. Therefore you have to assign the coreindex and the chipindex for every core. Usually the debugger does not need further information to access cores in none generic chips, once the setup is correct. Generic Chips Generic chips can accommodate an arbitrary amount of sub-cores. The debugger still needs information how to connect to the individual cores e.g. by setting the JTAG chain coordinates. Start-up Process The debug system must not have an invalid state where a GUI is connected to a wrong core type of a none generic chip, two GUI are connected to the same coordinate or a GUI is not connected to a core. The initial state of the system is value since every new GUI uses a new chipindex according to its CORE= parameter of the configuration file (config.t32). If the system contains fewer chips than initially assumed, the chips must be merged by calling SYStem.CONFIG.CORE. ©1989-2015 Lauterbach GmbH Blackfin Debugger 14 General System Settings SYStem.CPU CPU type selection Format: SYStem.CPU <cpu> <cpu>: BF531 | BF532 | BF533 | BF534 … Default selection: BF534. Selects the CPU type. SYStem.CpuAccess Format: Run-time memory access (intrusive) SYStem.CpuAccess Enable | Denied | Nonstop Default: Denied. Enable Allow intrusive run-time memory access. In order to perform a memory read or write while the CPU is executing the program the debugger stops the program execution shortly. Each short stop takes 1 … 100 ms depending on the speed of the debug interface and on the number of the read/write accesses required. A red S in the state line of the TRACE32 screen indicates this intrusive behavior of the debugger. Denied Lock intrusive run-time memory access. Nonstop Lock all features of the debugger, that affect the run-time behavior. Nonstop reduces the functionality of the debugger to: • run-time access to memory and variables • trace display The debugger inhibits the following: • to stop the program execution • all features of the debugger that are intrusive (e.g. action Spot for breakpoints, performance analysis via StopAndGo mode, conditional breakpoints etc.) ©1989-2015 Lauterbach GmbH Blackfin Debugger 15 General System Settings SYStem.JtagClock Format: JTAG clock selection SYStem.JtagClock [<frequency>] SYStem.BdmClock <frequency> (deprecated). Default frequency: 1 MHz. Selects the JTAG port frequency (TCK). Any frequency up to 50 MHz can be entered, it will be generated by the debuggers internal PLL. For CPUs which come up with very low clock speeds it might be necessary to slow down the JTAG frequency. After initialization of the CPUs PLL the JTAG clock can be increased. If there are buffers, additional loads or high capacities on the JTAG/COP lines, reduce the debug speed. SYStem.LOCK Format: Lock and tristate the debug port SYStem.LOCK [ON | OFF] Default: OFF. If the system is locked, no access to the debug port will be performed by the debugger. While locked, the debug connector of the debugger is tristated. The main intention of the lock command is to give debug access to another tool. ©1989-2015 Lauterbach GmbH Blackfin Debugger 16 General System Settings SYStem.MemAccess Real-time memory access (non-intrusive) Format: SYStem.MemAccess Denied<cpu-specific> BTC “BTC” allows a non intrusive memory access while the core is running, if a Background Telemetry Channel (BTC) is defined in your application. Any information on how to create such a channel can be found in Analog Devices’ VisualDSP++ user’s manual. The JTAG clock speed should be as fast as possible to get good performance Denied Real-time memory access during program execution to target is disabled. ©1989-2015 Lauterbach GmbH Blackfin Debugger 17 General System Settings SYStem.Mode System mode selection Format: SYStem.Mode <mode> <mode>: Down Go Attach Up Down Disables the debugger. Go Resets the target with debug mode enabled and prepares the CPU for debug mode entry. After this command the CPU is in the system.up mode and running. Now, the processor can be stopped with the break command or if a break condition occurs. Attach User program remains running (no reset) and the debug interface is initialized. Up Resets the target and sets the CPU to debug mode. After execution of this command the CPU is stopped and prepared for debugging. StandBy Not supported. NoDebug Not supported. SYStem.Option IMASKASM Format: Interrupt disable SYStem.Option IMASKASM [ON | OFF] Mask interrupts during assembler single steps. Useful to prevent interrupt disturbance during assembler single stepping. SYStem.Option IMASKHLL Format: Interrupt disable SYStem.Option IMASKHLL [ON | OFF] Mask interrupts during HLL single steps. Useful to prevent interrupt disturbance during HLL single stepping. ©1989-2015 Lauterbach GmbH Blackfin Debugger 18 General System Settings Breakpoints There are two types of breakpoints available: software breakpoints and on-chip breakpoints. Software Breakpoints Software breakpoints are the default breakpoints. A special breakcode is patched to memory so it only can be used in RAM or FLASH areas.There is no restriction in the number of software breakpoints. On-chip Breakpoints The Blackfin processor has a total of six instruction and two data on-chip breakpoints. A pair of two breakpoints may be further grouped together to form a range breakpoint. A range breakpoint can be including or excluding. In the first case the core is stopped if an address in the range is detected, in the second case the core is stopped when an address outside of the range is observed. Breakpoint in ROM With the command MAP.BOnchip <range> it is possible to inform the debugger about ROM (FLASH,EPROM) address ranges in target. If a breakpoint is set within the specified address range the debugger uses automatically the available on-chip breakpoints. ©1989-2015 Lauterbach GmbH Blackfin Debugger 19 Breakpoints Example for Breakpoints Assume you have a target with FLASH from 0x20000000 to 0x200FFFFF and RAM from 0x0 to 0x1000000. The command to configure TRACE32 correctly for this configuration is: Map.BOnchip 0x20000000--0x200FFFFF The following breakpoint combinations are possible. Software breakpoints: Break.Set 0x0 /Program ; Software Breakpoint 1 Break.Set 0x1000 /Program ; Software Breakpoint 2 On-chip breakpoints: Break.Set 0x20000100 /Program ; On-chip Breakpoint 1 Break.Set 0x2000ff00 /Program ; On-chip Breakpoint 2 ©1989-2015 Lauterbach GmbH Blackfin Debugger 20 Breakpoints Memory Classes The following memory classes are available: Memory Class Description P Program D Data ©1989-2015 Lauterbach GmbH Blackfin Debugger 21 Memory Classes JTAG Connector Signal GND N/C VDDIO N/C N/C N/C GND Pin 1 3 5 7 9 11 13 Pin 2 4 6 8 10 12 14 Signal EMUGND TMS TCK TRSTTDI TDO JTAG Connector Signal Description CPU Signal TMS JTAG-TMS, output of debugger TMS TDI JTAG-TDI, output of debugger TDI TCK JTAG-TCK, output of debugger TCK /TRST JTAG-TRST, output of debugger /TRST TDO JTAG-TDO, input for debugger TDO /EMU JTAG Emulation Flag /EMU VDDIO This pin is used by the debugger to sense the target I/ O voltage and to set the drive levels accordingly. If the sensed voltage level is too low (e.g. target has no power) the debugger powers down its drivers to prevent the target from damage. VDDIO ©1989-2015 Lauterbach GmbH Blackfin Debugger 22 JTAG Connector Support ADSP-BF531 ADSP-BF532 ADSP-BF533 ADSP-BF534 ADSP-BF536 ADSP-BF537 ADSP-BF538 ADSP-BF538F ADSP-BF542 ADSP-BF544 ADSP-BF547 ADSP-BF548 ADSP-BF549 INSTRUCTION SIMULATOR POWER INTEGRATOR ICD TRACE ICD MONITOR ICD DEBUG FIRE ICE CPU Available Tools YES YES YES YES YES YES YES YES YES YES YES YES YES Compilers Language Compiler Company Option ASM C C VISUALDSP++ VISUALDSP++ GCC ELF/DWARF2 ELF/DWARF2 ELF/DWARF2 C++ VISUALDSP++ Analog Devices Inc. Analog Devices Inc. Free Software Foundation, Inc. Analog Devices Inc. Comment ELF/DWARF2 Realtime Operation Systems ©1989-2015 Lauterbach GmbH Blackfin Debugger 23 Support Name Company Comment ThreadX ThreadX uC/OS-II uCLinux VDK Express Logic Inc. Express Logic Inc. Micrium Inc. Freeware II Analog Devices Inc. 3.0, 4.0, 5.0 2.0 to 2.92 Kernel Version 2.4 and 2.6 ©1989-2015 Lauterbach GmbH Blackfin Debugger 24 Support 3rd Party Tool Integrations CPU Tool Company ALL ALL ALL ADENEO X-TOOLS / X32 CODEWRIGHT ALL CODE CONFIDENCE TOOLS CODE CONFIDENCE TOOLS EASYCODE ECLIPSE RHAPSODY IN MICROC RHAPSODY IN C++ CHRONVIEW LDRA TOOL SUITE UML DEBUGGER Adeneo Embedded blue river software GmbH Borland Software Corporation Code Confidence Ltd ALL ALL ALL ALL ALL ALL ALL ALL ALL ALL ALL ALL ALL ALL ALL ALL ALL ALL ALL ALL ALL ATTOL TOOLS VISUAL BASIC INTERFACE LABVIEW Windows Windows Windows Code Confidence Ltd Linux EASYCODE GmbH Eclipse Foundation, Inc IBM Corp. IBM Corp. Inchron GmbH LDRA Technology, Inc. LieberLieber Software GmbH MicroMax Inc. Microsoft Corporation Windows Windows Windows Windows Windows Windows Windows NATIONAL INSTRUMENTS Corporation Open Source Parasoft Rapita Systems Ltd. RistanCASE Symtavision GmbH The MathWorks Inc. Timing Architects GmbH Undo Software Vector Software Windows CODE::BLOCKS C++TEST RAPITIME DA-C TRACEANALYZER SIMULINK TA INSPECTOR UNDODB VECTORCAST WINDOWS CE PLATF. BUILDER Host Windows Windows Windows Windows Windows Windows Windows Windows Windows Linux Windows Windows ©1989-2015 Lauterbach GmbH Blackfin Debugger 25 Support Products Product Information OrderNo Code Text LA-7833 JTAG Debugger for BLACKFIN (ICD) JTAG-BLACKFIN supports Blackfin Core includes software for Windows, Linux and MacOSX requires Power Debug Module debug cable with 14 pin connector Order Information Order No. Code Text LA-7833 JTAG-BLACKFIN JTAG Debugger for BLACKFIN (ICD) Additional Options LA-7960X MULTICORE-LICENSE License for Multicore Debugging ©1989-2015 Lauterbach GmbH Blackfin Debugger 26 Products