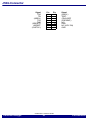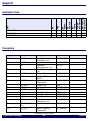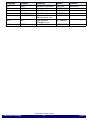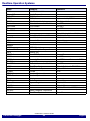
1
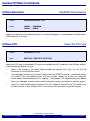
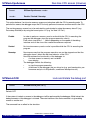
PWRficient Debugger TRACE32 Online Help TRACE32 Directory TRACE32 Index TRACE32 Documents ...................................................................................................................... ICD In-Circuit Debugger ................................................................................................................ Processor Architecture Manuals .............................................................................................. PWRficient ............................................................................................................................... PWRficient Debugger ........................................................................................................... 1 General Note ...................................................................................................................... 3 Brief Overview of Documents for New Users ................................................................. 3 Warning .............................................................................................................................. 5 Target Design Requirement/Recommendations ............................................................ 6 General 6 Quick Start ......................................................................................................................... 7 Troubleshooting ................................................................................................................ 8 SYStem.Up Errors 8 FAQ ..................................................................................................................................... 10 Configuration ..................................................................................................................... 11 System Overview 11 PWRficient PA6T Specific Implementations ................................................................... Breakpoints 12 12 Software Breakpoints 12 On-chip Breakpoints 12 Breakpoints on Data Addresses 13 Memory Classes 14 Cache 15 Memory Coherency 15 MOESI States 15 Debugging Information 16 Debugging through Reset 16 Programming the On-chip FLASH 17 On-chip Trace 18 General SYStem Commands ............................................................................................ SYStem.BdmClock Set BDM clock frequency ©1989-2015 Lauterbach GmbH PWRficient Debugger 1 19 19 SYStem.CPU Select the CPU type 19 Run-time CPU access (intrusive) 20 Lock and tristate the debug port 20 Run-time memory access (non-intrusive) 21 Select operation mode 22 SYStem.CpuAccess SYStem.LOCK SYStem.MemAccess SYStem.Mode SYStem.CONFIG Configure debugger according to target topology Example 23 24 CPU specific SYStem Commands ................................................................................... 26 SYStem.Option DCREAD Read from data cache 26 SYStem.Option FREEZE Freeze system timers on debug events 26 Invalidate instruction cache before go/step 26 Read from instruction cache 27 Disable interrupts while single stepping 27 Disable interrupts while HLL single stepping 27 Enable multiple address spaces support 28 SYStem.Option ICFLUSH SYStem.Option ICREAD SYStem.Option IMASKASM SYStem.Option IMASKHLL SYStem.Option MMUSPACES CPU specific MMU Commands ........................................................................................ MMU.TLB 29 Display MMU TLB entries 29 Loads MMU TLB entries 29 Set an MMU TLB entry 30 CPU specific TrOnchip Commands ................................................................................. 31 MMU.TLB.SCAN MMU.TLB.Set TrOnchip.CONVert Adjust range breakpoint in on-chip resource 31 TrOnchip.EVTEN Enable EVTI and EVTO pins 31 TrOnchip.RESet Reset on-chip trigger settings 32 Enable on-chip trigger facilities 32 TrOnchip.Set TrOnchip.VarCONVert Adjust hll breakpoint in on-chip resource 33 View on-chip trigger setup window 34 JTAG Connector ................................................................................................................ 35 Support ............................................................................................................................... 36 TrOnchip.view Available Tools 36 Compilers 36 Realtime Operation Systems 38 3rd Party Tool Integrations 39 Products ............................................................................................................................. 40 Product Information 40 Order Information 40 ©1989-2015 Lauterbach GmbH PWRficient Debugger 2 PWRficient Debugger Version 06-Nov-2015 General Note This documentation describes the processor specific settings and features for TRACE32-ICD for the following members of the P.A. Semi PWRficientTM PA6T CPU family: • P.A. Semi PWRficientTM PA6T-1682M • P.A. Semi PWRficientTM PA6T-1672M • P.A. Semi PWRficientTM PA6T-1352E Support for other PWRficientTM family members will be available as soon as they are officially released. (Pre-release support is also available, but only with explicit permission from P.A. Semi.) If some of the described functions, options, signals or connections in this Processor Architecture Manual are only valid for a single CPU or for specific families, the name(s) of the family(ies) is added in brackets. Brief Overview of Documents for New Users Architecture-independent information: • ”Debugger Basics - Training” (training_debugger.pdf): Get familiar with the basic features of a TRACE32 debugger. • ”T32Start” (app_t32start.pdf): T32Start assists you in starting TRACE32 PowerView instances for different configurations of the debugger. T32Start is only available for Windows. • “General Commands” (general_ref_<x>.pdf): Alphabetic list of debug commands. Architecture-specific information: • “Processor Architecture Manuals”: These manuals describe commands that are specific for the processor architecture supported by your debug cable. To access the manual for your processor architecture, proceed as follows: ©1989-2015 Lauterbach GmbH PWRficient Debugger 3 General Note • Choose Help menu > Processor Architecture Manual. “RTOS Debugger” (rtos_<x>.pdf): TRACE32 PowerView can be extended for operating systemaware debugging. The appropriate RTOS manual informs you how to enable the OS-aware debugging. ©1989-2015 Lauterbach GmbH PWRficient Debugger 4 Brief Overview of Documents for New Users Warning Signal Level NOTE: The debugger drives the output pins of the BDM/JTAG/COP connector with the same level as detected on the VCCS pin. If the IO pins of the processor are 3.3 V compatible then the VCCS should be connected to 3.3 V. See also System.Up Errors. ESD Protection NOTE: To prevent debugger and target from damage it is recommended to connect or disconnect the debug cable only while the target power is OFF. Recommendation for the software start: 1. Disconnect the debug cable from the target while the target power is off. 2. Connect the host system, the TRACE32 hardware and the debug cable. 3. Power ON the TRACE32 hardware. 4. Start the TRACE32 software to load the debugger firmware. 5. Connect the debug cable to the target. 6. Switch the target power ON. 7. Configure your debugger e.g. via a start-up script. Power down: 1. Switch off the target power. 2. Disconnect the debug cable from the target. 3. Close the TRACE32 software. 4. Power OFF the TRACE32 hardware. ©1989-2015 Lauterbach GmbH PWRficient Debugger 5 Warning Target Design Requirement/Recommendations General • Locate the BDM/JTAG/COP connector as close as possible to the processor to minimize the capacitive influence of the trace length and cross coupling of noise onto the JTAG signals. Don’t put any capacitors (or RC combinations) on the JTAG lines. • Connect TDI, TDO, TMS and TCK directly to the CPU. Buffers on the JTAG lines will add delays and will reduce the maximum possible JTAG frequency. If you need to use buffers, select ones with little delay. Most CPUs will support JTAG above 30 MHz, and you might want to use high frequencies for optimized download performance. • Ensure that JTAG HRESET is connected directly to the HRESET of the processor. This will provide the ability for the debugger to drive and sense the status of HRESET. The target design should only drive HRESET with open collector/open drain. • For optimal operation, the debugger should be able to reset the target board completely (processor external peripherals, e.g. memory controllers) with HRESET. • In order to start debugging right from reset, the debugger must be able to control CPU HRESET and CPU TRST independently. There are board design recommendations to tie CPU TRST to CPU HRESET, but this recommendation is not suitable for JTAG debuggers. . Debug cable with blue ribbon cable The T32 internal buffer/level shifter will be supplied via the VCCS pin. Therefore it is necessary to reduce the VCCS pull-up on the target board to a value smaller 10 . ©1989-2015 Lauterbach GmbH PWRficient Debugger 6 Target Design Requirement/Recommendations Quick Start Starting up the Debugger is done as follows: 1. Select the device prompt B: for the ICD Debugger (only necessary if the device prompt is not active after the TRACE32 software was started.) b:: 2. Select the CPU type to load the CPU specific settings.If your CPU is not listed, you can use one of the generic CPU types (MPC85XX,MPX55XX). SYStem.CPU PA6T1682 3. Specify that on-chip breakpoints should be used by the debugger, if a program breakpoint is set to the boot page (read-only memory): MAP.BOnchip 0xFFFFF000--0xFFFFFFFF 4. For simplicity, we now use CFE for the complex SoC initialisation, and let the target run until the CFE prompt is displayed in the terminal window: SYStem.Mode Attach The default state after selecting the CPU type, SYStem.Mode Down, holds the CPU in reset (HRESET). SYStem.Mode Attach releases reset and lets the CPU run, but uses active JTAG lines to poll the current system state. 5. When the CFE command prompt is displayed in the terminal (any terminal of your liking, or you can use our built-in terminal using the TERM command), break into the CFE command loop: Break 6. Load the program. ; ELF specifies the format, ; demo.elf is the file name Data.LOAD.ELf demo.elf The option of the Data.LOAD command depends on the file format generated by the compiler. For information on the compiler options refer to the section Compiler. A detailed description of the Data.LOAD command is given in the “General Commands Reference”. ©1989-2015 Lauterbach GmbH PWRficient Debugger 7 Quick Start Troubleshooting SYStem.Up Errors The SYStem.Up or SYStem.Attach command is the first command of a debug session where communication with the target is required. If you receive error messages while executing this command, there can be several reasons. The next sections list possible errors and explains how to fix them. Target Power Fail The Target has no power, the debug cable is not connected or not connected properly. Check if the JTAG VCC pin is driven by the target. The voltage of the pin must be identical to the debug voltage of the JTAG signals. It is recommended to connect VCC directly to the pin, or via a resistor < 5 k. Emulation Pod Configuration Error The debugger was not able to determine the connected processor. There are two possible reasons for this error. In both cases, please check the AREA window for more information: • The connected processor is not supported by the used software. Please check if the processor is supported by the debugger. Processors that appeared later than the debugger software version are usually not supported. Please download and install the latest software from our homepage, or contact technical support to get a newer software. Please also check if the processor or the software update is covered by your current licence. • A JTAG communication error prevented correct determination of the connected processor. Please check if the debugger is properly connected to the target. Target Reset Fail On SYStem.Up, the debugger will assert HReset in order to stop the CPU at the reset address. A target reset fail means, that an unexpected reset behavior caused an error: • The reset is asserted longer than 500ms and is not visible on the JTAG connector.Please check the signal level of the JTAG HRESET pin. • The target reset is permanently asserted. Check target reset circuitry and reset pull-up • A chip external watchdog caused a reset after the debugger asserted reset. Disable the watchdog and try again. ©1989-2015 Lauterbach GmbH PWRficient Debugger 8 Troubleshooting Emulation Debug Port Fail An emulation debug port fail can have a variety of reasons. Please check the AREA window for a detailed error message. Here is a collection of frequently seen issues: • JTAG communication error. Please check the signals on the debug connector. • Problems related with Reset can not always be detected as those. Please check Target Reset Fail. • AREA window error message “Error reading BPTR“: This error usually occurs if the CPU is permanently in reset or checkstop. Please check on your target: - reset and chkstp signals - power supply - bootstrap configuration pins - system clocks and PLL TAP IR problem Even without causing physical damage, electrostatic discharges in the vicinity of the debug setup can affect communication between debugger and target. E.g. with Electra systems, ESD can cause invalid JTAG instruction (IR) and data register (DR) values to be read out. If an inconsistent IR state is detected by the debugger, a “TAP IR problem” error message will be issued. ©1989-2015 Lauterbach GmbH PWRficient Debugger 9 Troubleshooting FAQ No information available ©1989-2015 Lauterbach GmbH PWRficient Debugger 10 FAQ Configuration System Overview ©1989-2015 Lauterbach GmbH PWRficient Debugger 11 Configuration PWRficient PA6T Specific Implementations Breakpoints There are two types of breakpoints available: Software breakpoints and on-chip breakpoints. Software Breakpoints To set a software breakpoint, before resuming the CPU, the debugger replaces the instruction at the breakpoint address with a trap instruction. If it is necessary to use the trap interrupt in the target program, on the PA6T architecture it is possible to use another instruction for this functionality. Please contact us if you need this option. On-chip Breakpoints To set breakpoints on code in read-only memory, only the on-chip instruction address breakpoints are available. With the command MAP.BOnchip <range> it is possible to declare memory address ranges for use with on-chip breakpoints to the debugger. The number of breakpoints is then limited by the number of available on-chip instruction address breakpoints. • On-chip breakpoints: Total amount of available on-chip breakpoints. • Instruction address breakpoints: Number of on-chip breakpoints that can be used to set Program breakpoints into ROM/FLASH/EEPROM. • Data address breakpoints: Number of on-chip breakpoints that can be used as Read or Write breakpoints. • Data value breakpoint: Number of on-chip data value breakpoints that can be used to stop the program when a specific data value is written to an address or when a specific data value is read from an address CPU Family On-chip Breakpoints Instruction Address Breakpoints Data Address Breakpoints Data Value Breakpoints PA6T 2 Instruction 2 Read/Write 2 single breakpoints or 1 breakpoint ranges 2 single breakpoints or 1 breakpoint range 0 You can check your currently set breakpoints with the command Break.List. If no more on-chip breakpoints are available you will get an error message on trying to set a new on-chip breakpoint. ©1989-2015 Lauterbach GmbH PWRficient Debugger 12 PWRficient PA6T Specific Implementations Breakpoints on Data Addresses Breakpoints on data addresses are bound to several conditions: 1. The source of the data access (read and/or write) must be the CPU, as the data address breakpoints are part of the CPU. Any other accesses from on-chip or off-chip peripherals (DMA etc.) will not be recognized by the data address breakpoints. 2. The data being targeted must be qualified by an address in memory. It is not possible to set a data address breakpoint to GPR, SPR etc. ©1989-2015 Lauterbach GmbH PWRficient Debugger 13 PWRficient PA6T Specific Implementations Memory Classes To specify which and how target memory is accessed, there are memory classes. A memory class consists of one or more letters followed by a colon “:”. Memory classes can be applied almost everywhere an address has to be specified. Here are some examples: Command: Effect: DATA.LIST P:0x1000 Opens a List window displaying program memory DATA.SET SPR:256. %Long 0x00223344 Write value 0x00223344 to SPR VRSAVE The following memory classes are available: Memory Class Description P Program D Data SPR Special Purpose Register IC Instruction Cache DC Data Cache NC No Cache (only physical memory) In addition to the memory classes, there are memory class attributes: Examples: Command: Effect: DATA.LIST SP:0x1000 Opens a List window displaying supervisor program memory DATA.SET ED:0x3330 0x4F Write 0x4F to address 0x3330 using real-time memory access The following memory class attributes are available: Memory Class Description E Use real-time memory access A Given address is physical (bypass MMU) U User memory S Supervisor memory Memory class attributes can also be used without a memory class, but U: and S: are usually combined with D: and P: (UD: user data, SD: supervisor data, UP: user program, UD: user data). ©1989-2015 Lauterbach GmbH PWRficient Debugger 14 PWRficient PA6T Specific Implementations Cache Memory Coherency The following table describes which memory will be updated depending on the selected memory class: memory class D-Cache I-Cache L2 Cache Memory (uncached) DC: updated not updated not updated not updated IC: not updated updated not updated not updated L2: not updated not updated updated not updated NC: not updated not updated not updated updated D: updated not updated updated updated P: not updated updated (*) updated updated (*) Depending on the debugger configuration, the coherency of the instruction cache will not be achieved by updating the instruction cache, but by invalidating the instruction cache. See ”SYStem.Option ICFLUSH Invalidate instruction cache before go/step” (debugger_pwr.pdf) for details. MOESI States The cache logic of PWRficient PowerPC cores behaves according to the MOESI state model (PowerISA Book III-S). To maintain a consistent debug display model with embedded (Book III-E) systems, the debugger will display Valid, Locked, and Dirty flags. State translation table: Display Flag MOESI State Valid NOT I (invalid) Locked O (owned) OR E (exclusive) Dirty M (modified) (internal shared flag) S (shared) Please note that the valid flag is independent of the other state flags. ©1989-2015 Lauterbach GmbH PWRficient Debugger 15 PWRficient PA6T Specific Implementations Debugging Information Debugging through Reset The core will reset all on-chip breakpoints and debug registers upon RESET, so it is not possible to debug through a reset. If RESET is visible in the JTAG_HReset pin, the debugger will report the reset and change the system mode to down. ©1989-2015 Lauterbach GmbH PWRficient Debugger 16 PWRficient PA6T Specific Implementations Programming the On-chip FLASH Note: This functionality is currently in development. ©1989-2015 Lauterbach GmbH PWRficient Debugger 17 PWRficient PA6T Specific Implementations On-chip Trace Processors of the PA6T series have a built-in trace system. The on-chip trace can be configured and accessed via the Onchip window. The on-chip trace can also be accessed via the Trace window, if the trace method is set to “Onchip”. Note: This functionality is currently in development. Processors of the PA6T series have a built-in trace buffer with 256 entries. It can be used to trace transactions that occur on the internal memory bus if the selected inferface. The trace buffer holds information about transaction address, transaction type, source and target ID and the byte count. The interface can be selected with the command Onchip.Mode.IFSel. All other configurations can be done directly via the peripheral view in the section Debug Features and Watchpoint Facility. Here is an example on how to set up the on-chip trace buffer to trace the data accesses of the PowerPC core. Please note that only uncached accesses will be recorded in the trace buffer: ; select interface ECM Onchip.Mode.IFSEL ECM ; configure onchip trace ; TBCR0 address match disable 0x40000000 ; transaction match disable 0x20000000 ; source ID enable 0x04000000 ; method trace events 0x00020000 Data.Set iobase.address()+0x000E2040 %LONG 0x64020000 ; TBCR1 src ID = d-fetch 0x00110000 Data.Set iobase.address()+0x000E2044 %LONG 0x00110000 ; enable automatically when CPU is started Onchip.AutoArm ON ; initialize trace buffer Onchip.Init ; start program until some_func is reached Go some_func ; display trace buffer Onchip.List Regarding instruction fetch traces, please note that the trace buffer is connected outside the caches, so instruction fetches on cached addresses will not appear in the trace. As the core will always fetch a full instruction cache way (32 bytes) at once, the program trace can not be reconstructed using this on-chip trace. For more information about general trace commands see ’Trace’ in ’General Commands Reference Guide T’ and ’Onchip Trace Commands’ in ’General Commands Reference Guide O’. ©1989-2015 Lauterbach GmbH PWRficient Debugger 18 PWRficient PA6T Specific Implementations General SYStem Commands SYStem.BdmClock Set BDM clock frequency Format: SYStem.BdmClock <rate> <rate>: 100000. … 50000000. 100kHz … 50MHz Selects the frequency for the debug interface. For multicore debugging, it is recommended to set the same JTAG frequency for all cores. SYStem.CPU Select the CPU type Format: SYStem.CPU <cpu> <cpu>: PA6T1682 | PA6T1672 | PA6T1352 Selects the CPU type. If the needed CPU type is not available in the CPU selection of the SYStem window, or if the command results in an error, • check if the licence of the debug cable includes the desired CPU type. You will find the information in the VERSION window. • if the debugger software is up-to-date. Please check the VERSION window to see which version is installed. CPUs that appeared later than the software release are usually not supported. Please check www.lauterbach.com for updates. If the needed CPU appeared after the release date of the debugger software, please contact technical support and request a software update. • if the CPU name matches one the names in the CPU selection. Search for the CPU name in the SYStem window, or type SYStem.CPU to the command line and click through the hotkeys. ©1989-2015 Lauterbach GmbH PWRficient Debugger 19 General SYStem Commands SYStem.CpuAccess Run-time CPU access (intrusive) Format: SYStem.CpuAccess <mode> <mode>: Enable | Denied | Nonstop This option declares if an intrusive memory access can take place while the CPU is executing code. To perform this access, the debugger stops the CPU shortly, performs the access and then restarts the CPU. The run-time memory access has to be activated for each window by using the memory class E: (e.g. Data.dump E:0x100) or by using the format option %E (e.g. Var.View %E var1). Enable In order to perform a memory read or write while the CPU is executing the program the debugger stops the program execution shortly. Each short stop takes 1 … 100 ms depending on the speed of the debug interface and on the size of the read/write accesses required. Denied No intrusive memory read or write is possible while the CPU is executing the program. Nonstop Nonstop ensures that the program execution can not be stopped and that the debugger doesn’t affect the real-time behavior of the CPU. Nonstop reduces the functionality of the debugger to: • run-time access to memory and variables • trace display The debugger inhibits the following: • to stop the program execution • all features of the debugger that are intrusive (e.g. spot breakpoints, performance analysis via StopAndGo, conditional breakpoints etc.) SYStem.LOCK Format: Lock and tristate the debug port SYStem.LOCK [ON | OFF] Default: OFF. If the system is locked, no access to the debug port will be performed by the debugger. While locked, the debug connector of the debugger is tristated. The main intention of the lock command is to give debug access to another tool. The command has no effect for the simulator. ©1989-2015 Lauterbach GmbH PWRficient Debugger 20 General SYStem Commands SYStem.MemAccess Run-time memory access (non-intrusive) Format: SYStem.MemAccess <mode> <mode>: Denied | CPU This option declares if and how a non-intrusive memory access can take place while the CPU is executing code. Although the CPU is not halted, run-time memory access creates an additional load on the processor’s internal data bus. The run-time memory access has to be activated for each window by using the memory class E: (e.g. Data.dump E:0x100) or by using the format option %E (e.g. Var.View %E var1). It is also possible to activate this non-intrusive memory access for all memory ranges displayed on the TRACE32 screen by setting SYStem.Option DUALPORT ON. Denied Memory access is disabled while the CPU is executing code. CPU The debugger performs memory accesses via a dedicated CPU interface. This memory access will snoop data cache and L2 cache if a memory class for data (“D:”) is used. ©1989-2015 Lauterbach GmbH PWRficient Debugger 21 General SYStem Commands SYStem.Mode Select operation mode Format: SYStem.Mode <mode> <mode>: Down | NoDebug | Go | Attach | StandBy | Up Select target reset mode. Down Disables the debugger. The state of the CPU remains unchanged. NoDebug Resets the target with debug mode disabled. In this mode no debugging is possible. The CPU state keeps in the state of NoDebug. Go Resets the target with debug mode enabled and prepares the CPU for debug mode entry. After this command the CPU is in the SYStem.Up mode and running. Now, the processor can be stopped with the break command or any break condition. Attach This command works similar to the Up command. The difference is, that the target CPU is not reset. The BDM/JTAG/COP interface will be synchronized and the CPU state will be read out. After this command the CPU is in the SYStem.Up mode and can be stopped for debugging. Up Resets the target and sets the CPU to debug mode. After execution of this command the CPU is stopped and prepared for debugging. All register are set to the default value. ©1989-2015 Lauterbach GmbH PWRficient Debugger 22 General SYStem Commands SYStem.CONFIG Configure debugger according to target topology Format: SYStem.CONFIG <parameter> <number_or_address> <parameter> (JTAG): DRPRE DRPOST IRPRE IRPOST TAPState TCKLevel TriState Slave state The four parameter IRPRE, IRPOST, DRPRE, DRPOST are required to inform the debugger about the TAP controller position in the JTAG chain, if there is more than one core in the JTAG chain. The information is required before the debugger can be activated e.g. by a SYStem.Up. See example below. On some CPU selections (SYStem.CPU) with known system configuration the above setting might be set automatically. TriState has to be used if more than one debugger are connected to the common JTAG port at the same time. TAPState and TCKLevel define the TAP state and TCK level which is selected when the debugger switches to tristate mode. NOTE: nTRST must have a pull-up resistor on the target, EDBGRQ must have a pull-down resistor. ©1989-2015 Lauterbach GmbH PWRficient Debugger 23 General SYStem Commands DRPRE (default: 0) <number> of TAPs in the JTAG chain between the core of interest and the TDO signal of the debugger. If each core in the system contributes only one TAP to the JTAG chain, DRPRE is the number of cores between the core of interest and the TDO signal of the debugger. DRPOST (default: 0) <number> of TAPs in the JTAG chain between the TDI signal of the debugger and the core of interest. If each core in the system contributes only one TAP to the JTAG chain, DRPOST is the number of cores between the TDI signal of the debugger and the core of interest. IRPRE (default: 0) <number> of instruction register bits in the JTAG chain between the core of interest and the TDO signal of the debugger. This is the sum of the instruction register length of all TAPs between the core of interest and the TDO signal of the debugger. IRPOST (default: 0) <number> of instruction register bits in the JTAG chain between the TDI signal and the core of interest. This is the sum of the instruction register lengths of all TAPs between the TDI signal of the debugger and the core of interest. TAPState (default: 7 = Select-DR-Scan) This is the state of the TAP controller when the debugger switches to tristate mode. All states of the JTAG TAP controller are selectable. TCKLevel (default: 0) Level of TCK signal when all debuggers are tristated. TriState (default: OFF) If more than one debugger share the same JTAG port, this option is required. The debugger switches to tristate mode after each JTAG access. Then other debuggers can access the port. Slave (default: OFF) If more than one debugger share the same JTAG port, all except one must have this option active. Only one debugger - the “master” - is allowed to control the signals nTRST and nSRST (nRESET). state Show state. Example TDI ---> Core A ---> Core B ---> PA6T ---> Core C ---> TDO ©1989-2015 Lauterbach GmbH PWRficient Debugger 24 General SYStem Commands Instruction register length of • Core A: 3 bit • Core B: 5 bit • Core C: 6 bit SYStem.CONFIG IRPRE 6 ; IR Core C SYStem.CONFIG IRPOST 8 ; IR Core A + B SYStem.CONFIG DRPRE 1 ; DR Core C SYStem.CONFIG DRPOST 2 ; DR Core A + B SYStem.Up TapStates 0 Exit2-DR 1 Exit1-DR 2 Shift-DR 3 Pause-DR 4 Select-IR-Scan 5 Update-DR 6 Capture-DR 7 Select-DR-Scan 8 Exit2-IR 9 Exit1-IR 10 Shift-IR 11 Pause-IR 12 Run-Test/Idle 13 Update-IR 14 Capture-IR 15 Test-Logic-Reset ©1989-2015 Lauterbach GmbH PWRficient Debugger 25 General SYStem Commands CPU specific SYStem Commands SYStem.Option DCREAD Format: Read from data cache SYStem.Option DCREAD [ON | OFF] Default: ON. If enabled, Data.dump windows for memory class D: (data) and variable windows display the memory values from the data caches (L1D or L2), if valid. If no cached data is available, physical memory will be read. SYStem.Option FREEZE Format: Freeze system timers on debug events SYStem.Option FREEZE [ON | OFF] Default: ON. Enabling this option will lead the debugger to set the upper half of the TBCTL register to 0, freezing all system timers, when a debug event is detected. Note: This functionality is currently in development. SYStem.Option ICFLUSH Format: Invalidate instruction cache before go/step SYStem.Option ICFLUSH [ON | OFF] Default: ON. Invalidates the instruction cache before starting the target program (Step or Go). If this option is disabled, the debugger will update data and instruction cache for program memory downloads, modifications and breakpoints. Disabling this option might cause performance decrease on memory accesses. ©1989-2015 Lauterbach GmbH PWRficient Debugger 26 CPU specific SYStem Commands SYStem.Option ICREAD Format: Read from instruction cache SYStem.Option ICREAD [ON | OFF] Default: OFF: If enabled, Data.List window and Data.dump window for memory class P: (program memory) display the memory values from the instruction cache or L2 cache if valid. If the data is not available in cache, the physical memory will be displayed. SYStem.Option IMASKASM Format: Disable interrupts while single stepping SYStem.Option IMASKASM [ON | OFF] Default: OFF. If enabled, the interrupt mask bits of the CPU will be set during assembler single-step operations. The interrupt routine is not executed during single-step operations. After single step the interrupt mask bits are restored to the value before the step. SYStem.Option IMASKHLL Format: Disable interrupts while HLL single stepping SYStem.Option IMASKHLL [ON | OFF] Default: OFF. If enabled, the interrupt mask bits of the cpu will be set during HLL single-step operations. The interrupt routine is not executed during single-step operations. After single step the interrupt mask bits are restored to the value before the step. NOTE: Don’t enable this option for code that disables MSR_EE. The debugger will disable MSR_EE while the CPU is running and restore it after the CPU stopped. If a part of the application is executed that disables MSE_EE, the debugger can not detect this change and will restore MSE_EE. ©1989-2015 Lauterbach GmbH PWRficient Debugger 27 CPU specific SYStem Commands SYStem.Option MMUSPACES Format: Enable multiple address spaces support SYStem.Option MMUSPACES [ON | OFF] SYStem.Option MMU [ON | OFF] (deprecated) Default: OFF. Enables the usage of the MMU to support multiple address spaces. The command should not be used if only one translation table is used. Enabling the option will extend the address scheme of the debugger by a 16 bit memory space identifier. The option can only be enabled when there are no symbols loaded. ©1989-2015 Lauterbach GmbH PWRficient Debugger 28 CPU specific SYStem Commands CPU specific MMU Commands MMU.TLB Format: Display MMU TLB entries MMU.TLB Displays a table of all MMU TLB entries of the selected TLB table. If the selected CPU only supports one TLB table, it can be displayed by just typing MMU.TLB. Note: This functionality is currently in development. MMU.TLB.SCAN Format: Loads MMU TLB entries MMU.TLB.SCAN Loads the TLB table entries from the CPU to the debugger internal MMU table. This commands makes the TLBs information available for the TRACE32 debugger even when the program execution is running and the TRACE32 debugger has no access to the TLBs. This is required for the realtime memory access (See also SYStem.MemAccess). Use the command TRANSlation.ON to enable the debugger internal MMU table. Note: This functionality is currently in development. ©1989-2015 Lauterbach GmbH PWRficient Debugger 29 CPU specific MMU Commands MMU.TLB.Set Set an MMU TLB entry Format: MMU.TLB.Set <index> <mas1> <mas2> <mas3> <mas7> <index>: TLB entry index. From 0 to (number of TLB entries)-1 of the specified TLB table <mas1>: <mas2>: <mas3>: Values corresponding to the values that would be written to the MAS1/2/3 registers in order to set a TLB entry. See chip user’s manual for details on MAS registers Sets the specified MMU TLB table entry in the CPU. The parameter <tlb> is not available for CPUs with only one TLB table. MMU.TLB.Set 0x1 0x80000300 0x00000000 0x4000003f Note: This functionality is currently in development. ©1989-2015 Lauterbach GmbH PWRficient Debugger 30 CPU specific MMU Commands CPU specific TrOnchip Commands Note: This functionality is currently in development. TrOnchip.CONVert Format: Adjust range breakpoint in on-chip resource TrOnchip.CONVert [ON | OFF] There are 2 data address breakpoints. These breakpoints can be used to mark two single data addresses or one data address range. ON (default) After a data address breakpoint is set to an address range all on-chip breakpoints are spent. As soon as a new data address breakpoint is set the data address breakpoint to the address range is converted to a single data address breakpoint. Please be aware, that the breakpoint is still listed as a range breakpoint in the Break.List window. Use the Data.View command to verify the set data address breakpoints. OFF An error message is displayed when the user wants to set a new data address breakpoint after all on-chip breakpoints are spent by a data address breakpoint to an address range. TrOnchip.CONVert ON Break.Set 0x6020++0x1f Break.Set 0x7400++0x3f Data.View 0x6020 Data.View 0x7400 TrOnchip.EVTEN Format: Enable EVTI and EVTO pins TrOnchip.EVTEN [ ON | OFF] Default: ON. When enabled, the processor is configured to enable the EVTI/EVTO pins. If disabled, that pins can be used for GPIO. NOTE 1: This options reflect the EVT_EN bit in the PCR register of the NPC. It is not available on all processor derivates. Please check the reference manual for availability. ©1989-2015 Lauterbach GmbH PWRficient Debugger 31 CPU specific TrOnchip Commands NOTE 2: If the EVTx pins are used for GPIO, they should not be connected to the debug/trace connector to avoid additional load and other possible errors. TrOnchip.RESet Format: Reset on-chip trigger settings TrOnchip.RESet Resets the on-chip trigger system to the default state. TrOnchip.Set Enable on-chip trigger facilities Format: TrOnchip.Set <source> [ON | OFF] <source>: eXception BRANCH Enables the specified on-chip trigger facility to stop the CPU on several events. The debugger sets the corresponding bit in the DBCR0 register before resuming the CPU. ©1989-2015 Lauterbach GmbH PWRficient Debugger 32 CPU specific TrOnchip Commands TrOnchip.VarCONVert Adjust hll breakpoint in on-chip resource Format: TrOnchip.VarCONVert [ON | OFF] ON (default) After a data address breakpoint is set to an hll variable all on-chip breakpoints are spent. As soon as a new data address breakpoint is set the data address breakpoint to the hll variable is converted to a single data address breakpoint. Please be aware, that the breakpoint is still listed as a range breakpoint in the Break.List window. Use the Data.View command to verify the set data address breakpoints. OFF An error message is displayed when the user wants to set a new data address breakpoint after all on-chip breakpoints are spent by a data address breakpoint to an hll variable. TrOnchip.CONVert ON Var.Break.Set flags Var.Break.Set ast Data.View flags Data.View ast ©1989-2015 Lauterbach GmbH PWRficient Debugger 33 CPU specific TrOnchip Commands TrOnchip.view Format: View on-chip trigger setup window TrOnchip.view Display the trigger setup dialog window. ©1989-2015 Lauterbach GmbH PWRficient Debugger 34 CPU specific TrOnchip Commands JTAG Connector Signal TDO TDI (QREQ-) TCK TMS (SRESET-) HRESET(CKSTOP-) Pin 1 3 5 7 9 11 13 15 Pin 2 4 6 8 10 12 14 16 Signal (QACK-) TRSTJTAG-VREF (PRESENT-) N/C GND N/C (KEY PIN) GND ©1989-2015 Lauterbach GmbH PWRficient Debugger 35 JTAG Connector Support PA6T-1352E PA6T-1672M PA6T-1682M YES YES YES INSTRUCTION SIMULATOR POWER INTEGRATOR ICD TRACE ICD MONITOR ICD DEBUG FIRE ICE CPU Available Tools YES YES YES Compilers Language Compiler Company Option ADA GNAT ELF/DWARF C C CXPPC CC C XCC-V C C GREEN-HILLS-C GCC C MCCPPC C C C C C C C++ ULTRA-C HIGH-C DCPPC D-CC D-CC D-CC GCC C++ GREEN-HILLSC++ CCCPPC Free Software Foundation, Inc. Cosmic Software Freescale Semiconductor, Inc. GAIO Technology Co., Ltd. Greenhills Software Inc. HighTec EDV-Systeme GmbH Mentor Graphics Corporation Radisys Inc. Synopsys, Inc TASKING Wind River Systems Wind River Systems Wind River Systems Free Software Foundation, Inc. Greenhills Software Inc. C++ Mentor Graphics Corporation Comment ELF/DWARF XCOFF SAUF ELF/DWARF ELF/DWARF ELF/DWARF ROF ELF/DWARF ELF/DWARF IEEE COFF ELF/DWARF ELF/DWARF ELF/DWARF ELF/DWARF ©1989-2015 Lauterbach GmbH PWRficient Debugger 36 Support Language Compiler Company Option Comment C++ C++ C++ C++ C/C++ MSVC HIGH-C++ D-C++ GCCPPC CODEWARRIOR EXE/CV5 ELF/DWARF ELF/DWARF ELF/STABS ELF/DWARF WindowsCE GCC GCC JAVA FASTJ Microsoft Corporation Synopsys, Inc Wind River Systems Wind River Systems Freescale Semiconductor, Inc. Free Software Foundation, Inc. Wind River Systems ELF/DWARF ELF/DWARF ©1989-2015 Lauterbach GmbH PWRficient Debugger 37 Support Realtime Operation Systems Name Company Comment AMX ChorusOS CMX-RTX DEOS ECOS Elektrobit tresos ERCOSEK Erika FreeRTOS Linux Linux LynxOS MQX MQX NetBSD NORTi Nucleus PLUS OS-9 OSE Delta OSEK OSEKturbo PikeOS ProOSEK pSOS+ QNX RTEMS RTXC 3.2 RTXC Quadros Sciopta SMX ThreadX uC/OS-II uITRON VRTXsa VxWorks KadakProducts Ltd. Oracle Corporation CMX Systems Inc. DDC-I, Inc. eCosCentric Limited Elektrobit Automotive GmbH ETAS GmbH Evidence Freeware I MontaVista Software, LLC LynuxWorks Inc. Freescale Semiconductor, Inc. Synopsys, Inc MISPO Co. Ltd. Mentor Graphics Corporation Radisys Inc. Enea OSE Systems Freescale Semiconductor, Inc. Sysgo AG Elektrobit Automotive GmbH Wind River Systems QNX Software Systems RTEMS Quadros Systems Inc. Quadros Systems Inc. Sciopta Micro Digital Inc. Express Logic Inc. Micrium Inc. Mentor Graphics Corporation Wind River Systems implemented by DDC-I 1.3, 2.0 and 3.0 via ORTI via ORTI via ORTI v7 Kernel Version 2.4 and 2.6, 3.x, 4.x 3.0, 3.1, 4.0, 5.0 3.1.0, 3.1.0a, 4.0 3.x and 4.x 2.40 and 2.50 4.x and 5.x via ORTI via ORTI/former MetrowerksOSEK via ORTI 2.1 to 2.5, 3.0, with TRACE32 6.0 to 6.5.0 4.10 3.4 to 4.0 3.0, 4.0, 5.0 2.0 to 2.92 HI7000, RX4000, NORTi,PrKernel 5.x to 7.x ©1989-2015 Lauterbach GmbH PWRficient Debugger 38 Support 3rd Party Tool Integrations CPU Tool Company ALL ALL ALL ADENEO X-TOOLS / X32 CODEWRIGHT ALL CODE CONFIDENCE TOOLS CODE CONFIDENCE TOOLS EASYCODE ECLIPSE RHAPSODY IN MICROC RHAPSODY IN C++ CHRONVIEW LDRA TOOL SUITE UML DEBUGGER Adeneo Embedded blue river software GmbH Borland Software Corporation Code Confidence Ltd ALL ALL ALL ALL ALL ALL ALL ALL ALL ALL ALL ALL ALL ALL ALL ALL ALL ALL ALL ALL ALL ATTOL TOOLS VISUAL BASIC INTERFACE LABVIEW Windows Windows Windows Code Confidence Ltd Linux EASYCODE GmbH Eclipse Foundation, Inc IBM Corp. IBM Corp. Inchron GmbH LDRA Technology, Inc. LieberLieber Software GmbH MicroMax Inc. Microsoft Corporation Windows Windows Windows Windows Windows Windows Windows NATIONAL INSTRUMENTS Corporation Open Source Parasoft Rapita Systems Ltd. RistanCASE Symtavision GmbH The MathWorks Inc. Timing Architects GmbH Undo Software Vector Software Windows CODE::BLOCKS C++TEST RAPITIME DA-C TRACEANALYZER SIMULINK TA INSPECTOR UNDODB VECTORCAST WINDOWS CE PLATF. BUILDER Host Windows Windows Windows Windows Windows Windows Windows Windows Windows Linux Windows Windows ©1989-2015 Lauterbach GmbH PWRficient Debugger 39 Support Products Product Information OrderNo Code Text LA-3754 JTAG Debugger for PWRficient (ICD) DEBUG-PWRFICIENT supports PA6T-1682M supports (1.8V - 5.0V) Concurrent debugging of both cores in dual-core chip requires a License for Multicore Debugging (LA-7960X) includes software for Windows, Linux and MacOSX requires Power Debug Module debug cable with 16 pin connector Order Information Order No. Code Text LA-3754 DEBUG-PWRFICIENT JTAG Debugger for PWRficient (ICD) Additional Options LA-7960X MULTICORE-LICENSE License for Multicore Debugging ©1989-2015 Lauterbach GmbH PWRficient Debugger 40 Products