1
This literature was published years prior to the establishment of Agilent Technologies as a company independent from Hewlett-Packard
and describes products or services now available through Agilent. It may also refer to products/services no longer supported by Agilent.
We regret any inconvenience caused by obsolete information. For the latest information on Agilent’s test and measurement products go to:
www.agilent.com/find/products
Or in the US, call Agilent Technologies at 1-800-452-4844 (8am–8pm EST)
HP 71500A Microwave
Transition Analyzer
Group Delay Personality
Product Note 70820-10
HP 71500A/70820A
Product Note Series
Measure Group Delay and Phase
through Frequency Converters
with Internal Local Oscillators
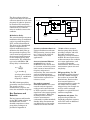
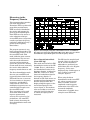
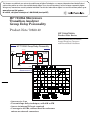
HP 71500A Group Delay Personality
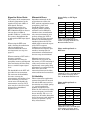
(AM shown)
Receiver
RF carrier
HP 71500A
Modulator
AM or FM
CH1
Digital
Demod
Internal
LO
with IBASIC
Digital
Phase
Comparator
CH2
Modulation
source
HP-IB
Measurement Block Diagram
• Accuracy to .2 ns
• Uses envelope delay technique, with AM or FM
• Access to internal LOs not required
• Coverage to 40 GHz, without need for reference
mixers or external converters
Table of Contents
Introduction
Product Description
Why Measure Group Delay?
Group Delay Techniques
Direct Phase
Modulation Delay
Key Features and Benefits
Measurement Overview
3
3
3
3
3
4
4
Direct Demodulation Mode (Zoom FFT Off)
Zoom FFT Mode
Marker Options (Zoom FFT on)
5
5
5
5
6
6
7
8
Normalization
9
Measurement Block Diagram
Modulation Source
Synthesizer Support
Measuring in the Frequency Domain
How to do normalization
What frequency span to use?
Unambiguous delay range
Negative delay
Measurement Times
Using the Personality
Obtaining the Program
Firmware Upgrades
Downloading the Program
Loading from an external computer
Storing to a memory card
Loading from a memory card or disk drive
Menu Overview
Setting Up and Doing a Measurement
Printing/Plotting the Results
Accuracy Considerations
Typical Accuracy
Noise Reduction
Averaging
Smoothing
Signal-to-Noise Ratio
Mismatch Error
LO Stability
Modifying the Program
Manuals
Changing Defaults
Adding Sources
Appendix A
Comparison to Other Instruments
Vector Network Analyzers
Scalar Network Analyzers
Microwave Link Analyzers
HP 11770A Link Measurement Personality
Summary
9
9
10
10
11
11
11
11
11
12
12
13
13
14
16
17
17
17
17
17
18
18
18
19
19
19
19
20
20
20
20
20
21
21
3
Introduction
Measuring absolute group delay
through frequency translating
devices such as downconverters
or receivers is difficult at best,
particularly at microwave
frequencies. Vector network
analyzers are excellent tools for
measuring group delay relative
to a “golden device”, but they
are difficult to use for absolute
measurements. For microwave
devices without access to
internal local oscillators (LOs),
the problem is especially
difficult as vector network
analyzers cannot be used at all.
For these cases, a modulation
technique must be used, which
often involves a custom solution
with external mixers, filters,
LOs, and discriminators or
detectors — in other words,
complex and expensive.
Customers have been asking for
a better solution for a long time.
The HP 71500A microwave
transition analyzer coupled with
a downloadable Instrument
BASIC (IBASIC) personality
offers a cost-effective and simple
solution for microwave group
delay measurements of
frequency translating devices.
Product Description
The group delay personality is a
downloadable IBASIC
application program that runs
internally in the HP 71500A.
It is targeted for measurements
of microwave frequency
converters and receivers with
internal LOs, or any microwave
frequency converter where
absolute group delay is desired.
It is intended for measuring
sub-systems or systems where
the source and the HP 71500A
can be located near one another.
It is not intended for end-to-end
measurements separated by a
long-distance, due to the need
for the HP 71500A to measure
both the RF and the baseband
modulation source.
The program uses the modulation
delay technique for measuring
group delay, using either AM
or FM. The modulated RF
carrier is measured in channel
1, and the baseband modulation
signal is measured in channel 2.
Why Measure Group
Delay?
Ideal networks pass modulated
signals containing information
without inducing any additional
distortion. They are
characterized by both flat
magnitude response and linear
(constant slope) phase shift
versus frequency. Since group
delay is the derivative of phase
with respect to frequency, this
implies a flat group delay
response. All of the frequency
components of the signals
passing through the deviceunder-test (DUT) will
experience the same amount of
time delay. The real world,
however, is composed of non-ideal
networks, which cause
distortion due to amplitude and
phase nonlinearities. Group
delay is one measure of phase
nonlinearity. It is particularly
important to characterize group
delay for systems where some
type of phase modulation is
used, such as FM, QPSK, or
64QAM.
Group Delay
Techniques
Group delay is defined
mathematically as the negative
of the derivative of a network’s
phase versus frequency
response:
Ø
td = – d
––
dw
(td in seconds, Ø in radians,
w in radians/second)
Group delay
or
1
dØ
td = – –– x ––
360 df
(td in seconds, Ø in degrees,
f in hertz)
There are two basic techniques
for measuring group delay of a
component or sub-system.
Direct Phase
For linear, non-frequency
translating devices, the most
commonly used technique is the
direct phase method. A vector
network analyzer is used to
measure the phase response of
a DUT, and a numerical
differentiation is done to derive
group delay. The derivative is
approximated by using Ư
,
∆ƒ
where delta phase is the phase
difference between adjacent
trace points, and delta
frequency is the frequency step
size (total frequency span
divided by the number of trace
points). Since delta frequency is
a nonzero quantity, there is
averaging occurring over this
frequency interval. This interval
is known as the measurement
aperture. Larger apertures give
less group delay resolution
(more averaging occurs), but
less trace noise. Conversely, a
smaller aperture implies more
resolution at the expense of a
noisier measurement.
4
The direct phase technique
requires that both the test and
reference signals be at the same
frequency in order for phase to
be measured. For measuring
frequency translating devices, a
reference DUT or external
mixer is needed to ensure this
condition.
Modulation Delay
The second technique measures
modulation delay. A modulated
carrier is passed through the
DUT, and then demodulated.
The phase of the demodulated
signal is compared to the
original modulating signal to
determine the delta phase at
that particular frequency. The
carrier must be stepped across
the frequency band of interest
for the complete group delay
measurement. The modulation
type can be AM, FM or PM.
Group delay is calculated as:
Øe
td = ––––
––––
360x fm
(td in seconds, Øe
{envelope phase shift} in
degrees, fm {modulation
frequency} in hertz)
The HP 71500A group delay
personality uses this technique.
The aperture of this
measurement is equal to two
times the modulation frequency.
Key Features and
Benefits
The key features and benefits
for the HP 71500A solution are
described below. A more
detailed comparison to other
group delay techniques is
provided in Appendix A.
(AM shown)
Receiver
RF carrier
HP 71500A
Modulator
AM or FM
CH1
Internal
LO
Digital
Demod
with IBASIC
Digital
Phase
Comparator
CH2
Modulation
source
HP-IB
Figure 1: Measurement block diagram.
Accuracy to better than 1 ns.
Using normalization and zoom
FFT processing, accuracy down
to +/- 0.2 ns can be achieved.
This is adequate for most
applications.
Access to internal LOs not
required. Since it is the
modulation on the carrier that
is of concern and not the carrier
itself, access to internal LOs or
frequency references is
unnecessary. The vector network
analyzer method measures
phase of the RF signals directly,
and therefore requires LO or
reference access.
No need for external
reference mixers. The vector
network analyzer approach
needs an extra external mixer
or DUT to provide a reference
signal that is the same frequency
as the test signal. While this
method provides excellent
relative measurements
(referenced to a golden standard),
absolute delay measurements
are difficult due to the need to
calibrate the mixers. The HP
71500A solution measures
absolute group delay directly,
providing a simpler and more
traceable measurement.
Frequency coverage extends to
40 GHz. No extra upconverters
or downconverters are needed to
cover most applications, such
as satellite transponder
measurements. This lowers the
measurement system cost and
complexity.
FM group delay. The FM
demodulation routine internal
to the HP 71500A eliminates
the need for an external FM
discriminator. Receivers that
have internal limiters or
saturated amplifiers require the
use of FM, since any AM is
stripped away. An example of a
receiver with a saturated
amplifier is a typical Ku band
satellite transponder.
Amplitude and phase. The
program also provides the
amplitude and phase response
of the DUT with no additional
measurement time.
5
Simplified user interface.
Custom menukeys tailor the
MTA’s user interface for making
group delay measurements
without the need for an external
computer.
Limitations
The key limitations of this
application are that it is slower
than most other solutions, and
the relative accuracy, while
adequate for most measurements,
may not be as good compared
to what customers have come to
expect from instruments such
as the HP 8510 vector network
analyzer.
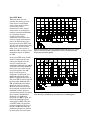
HP 71500A with
IBASIC
70004A
CH 1
CH 2
20 dB
Attenuator
HP-IB
10 MHz
Ref
A block diagram view of the
measurement is shown in figure
1. The modulated RF carrier is
measured in channel 1 of the
HP 71500A, while the baseband
modulation signal is measured
as a reference in channel 2.
The modulation source can be a
stand-alone instrument or
internal to the RF source.
Modulation Source
There are two basic
measurement setups. The first
setup (figure 2) uses the internal
modulation capabilities of the
source, such as (optionally)
provided by the HP 8360 family
of synthesizers. The second
setup (figure 3) uses an external
modulation source, controlled
either manually or via HP-IB.
Many non-HP-IB modulation
sources have poor frequency
accuracy. In some cases, it may
be necessary to fine-tune
the modulation frequency of the
Internal
LO
836xxA
AM/FM Output
(rear panel)
Internal Modulation Opt. 002
RF
Out
Frequency Translating DUT
Figure 2: Measurement setup using internal modulation.
HP 71500A with
IBASIC
Measurement
Overview
Measurement Block
Diagram
70820A
70004A
70820A
CH 1
CH 2
Attenuator
HP-IB
10 MHz
Ref
Internal
LO
836xxA
RF
Out
Modulation
Input
Frequency Translating DUT
Modulation Source
Figure 3: Measurement setup using an external modulation source.
source to match the value used
in the program.
Note: when connecting
synthesizers or modulation
sources that are to be controlled
via HP-IB, use the HP-IB
connector on the rear panel of
the HP 70820A module, NOT
the HP-IB connector on the
HP 70004A mainframe/display.
Connecting the 10 MHz
references of the HP 71500A
and the sources together is
recommended, but not required.
Synthesizer Support
The group delay program
supports the HP 836xx, HP 834x,
HP 70340A, and HP 3325A
synthesizers. The program can
easily be modified to drive other
synthesizers if necessary (see
Adding Sources on page 19).
The group delay personality
does not require 1 Hz frequency
resolution of the RF source, but
this feature is very desirable for
other measurements (such as
pulsed-RF characterization) and
is highly recommended if a new
source is being ordered.
6
Measuring in the
Frequency Domain
This program makes extensive
use of the Fast Fourier
Transform (FFT) to perform the
group delay measurement.
FFTs are used to demodulate
the carrier and compute the
phase of the baseband signal.
Zoom FFTs are also used as a
noise reduction technique.
A zoom FFT takes a larger time
record to get better frequency
resolution, and displays only a
portion of the frequency
domain data.
The program operates in two
basic measurement modes. The
recommended practice is to use
the zoom FFT mode. This
mode yields the most accurate
measurements. The user can
select the trade-off between
accuracy and measurement
speed. The greater the amount
of zoom used, the more accurately
the carrier and modulation
frequency must be known as well.
The direct demodulation mode
does not use zoom FFTs and
is generally faster than the zoom
FFT mode, but not as accurate.
It is less sensitive to frequency
inaccuracy, and should be
used when the carrier and
modulation frequencies are not
controlled well enough to use
the zoom FFT mode.
Trace averaging can be used
with either mode to further
improve measurement
accuracy. For a given level of
performance, the zoom FFT
mode is faster than using the
direct demodulation mode with
averaging.
Figure 4: Screen display using direct demodulation mode (zoom FFT off).
The upper trace shows the demodulated RF carrier. The lower trace shows
the modulation signal. Both signals are in the frequency domain.
Direct Demodulation Mode
(Zoom FFT Off)
This mode uses the built-in FM
demodulation routine of the HP
71500A. Trace 3, which shows
the demodulated carrier in the
frequency domain, is defined as
FM(CH1), and trace 4, which
shows the modulation signal in
the frequency domain, is
defined as CH2. Both traces are
transformed into the frequency
domain using the FFT. The
displayed signals appear at the
far left-hand portion of the
screen (figure 4). The markers
take one reading on each trace,
using the local peak function
to ensure the signal peak is
measured.
The RF signal is sampled such
that the carrier is centered in
the IF, and the modulation
sidebands are unaliased (not
folded about DC or the Nyquist
frequency). If they were
displayed, they would appear as
they would on a spectrum
analyzer (figure 5).
When using the direct
demodulation mode (zoom FFT
off), phase versus frequency
data is available, however,
amplitude versus frequency
information of the DUT is not
measured. Amplitude
information is available when
using the zoom FFT mode.
7
Zoom FFT Mode
With this mode, the user
specifies the amount of zoom
used, from 1 to 128. Higher
zoom values result in better
accuracy, but slower
measurement times. Larger
zoom values are analogous to
smaller resolution bandwidths
in a spectrum analyzer.
A typical value which
represents a good trade-off of
accuracy versus measurement
time is 16. Each factor of two
increase in the zoom FFT value
will slow the measurement time
down by two as well. In this
mode, trace 3 (the carrier) is
defined as CH1, and trace 4 (the
modulation signal) is defined
as CH2.
In the zoom FFT mode, the RF
signal is sampled so that the
carrier gets mixed to the IF
near DC, and half of the
modulation sidebands are folded
around DC such that sideband
pairs of the same order end up
very close together (for AM,
there is only one pair of
sidebands). If this result was
displayed without the zoom
FFT, it would look like figure 6.
The zoom FFT is used to expand
the first order sidebands. For
FM, all sideband pairs higher
than first order are ignored.
Markers are used to measure
the amplitude and phase of the
sidebands, and the program
uses this information to perform
the necessary demodulation.
Normally, if a modulation
frequency of 1 MHz is used, the
first order sidebands will be
separated by 2 MHz. With the
zoom FFT mode, the program
sets the sampling frequency of
the HP 71500A such that the
sideband separation is reduced
by about twice the zoom factor.
Figure 5: Screen display showing an FM modulated RF signal as it would
appear in the IF using direct demodulation mode, but without the FM
demodulation function applied.
Carrier
1st order
sideband pair 2nd order
sideband pair
3rd order
sideband pair
4th order
sideband pair
Area expanded by zoom FFT
Figure 6: Screen display of an FM modulated RF signal as it would appear
in the IF using zoom FFT mode, but without the zoom FFT applied.
8
When the program is running,
the top trace of the display
shows the first order sideband
pair, and the bottom trace shows
the baseband signal, but this
time the signals are centered on
the screen (figure 7).
With the zoom FFT mode, both
amplitude and phase versus
frequency can be measured,
with no additional measurement
time.
Marker Options
(zoom FFT on)
When the zoom FFT mode is
selected, the group delay
program defaults to placing the
marker on signals using the
highest peak function. This
allows the measurement to be
done even if the LO in the DUT
drifts somewhat, causing the
sidebands to move around, or if
the modulation frequency is not
known exactly (this is often the
case when using an external
signal generator to generate the
modulation signal).
If there are contaminating
signals present, it is possible
that the marker will find an
incorrect signal which may be
bigger than a desired signal.
This can happen, for example,
when the DUT produces
significant carrier harmonics
that are not filtered away. To
avoid this, an option is available
to use direct marker placement
and the local peak function. In
this mode, the marker is set to
where the signal is expected,
and a local peak is done to
ensure that the peak of the
signal is found. However, if the
Figure 7: Screen display using zoom FFT mode. The upper trace shows the
first sideband pair of the modulated RF carrier. The lower trace shows the
modulation signal. Both signals are in the frequency domain.
LO frequency of the DUT has
drifted enough, or has
significant amounts of residual
FM, or the modulation
frequency cannot be set
accurately enough, the marker
may be placed too far from the
signal for local peak to work
properly. This will result in a
bad measurement. Direct
marker placement with local
peak should only be used in an
environment with very stable
and accurately known signal
frequencies.
When using a manual
modulation source, it may be
necessary to fine-tune the
modulation frequency to match
the value used in the program,
to ensure correct marker
placement. If it appears that
neither marker mode is finding
the correct signals, then the
direct demodulation mode
should be used. The user can
choose between highest or local
peak, by using the markers
softkey under the Options
menu.
9
Normalization
Trace normalization is desirable
for relative measurements, and
required for absolute delay
measurements. For obtaining
the best relative accuracy,
performing a normalization
removes the group delay
contributions of the
interconnect cables and the test
equipment. An absolute group
delay measurement can only be
done by first establishing a
reference, which is the group
delay of the test setup without
the DUT in place. In general,
normalization improves
measurement accuracy
considerably, but is not as good
as what can be achieved using
calibration standards and 12term error correction as done in
standard vector network
analysis.
How to do normalization
Normalization is done by doing
a measurement without the
DUT, and then pressing the
NORMALZ key under the
Process menu to store the
reference trace. The
measurement configuration
must be set up for a nonfrequency translating
measurement, by setting the LO
frequency to 0 Hz and the RF
and LO multipliers (N and M) to
one, under the Config menu.
Next, the DUT is inserted and
another measurement is done,
this time setting the correct LO
frequency and multipliers that
correspond to the frequency
translation of the DUT (see step
3 on page 14 about the Config
menu for a more detailed
description of setting up a
measurement). The reference
and test measurements must
have the same number of
points, so set the start, stop,
and step frequencies
accordingly.
Care should be taken when
measuring frequency-inverting
devices, where the IF frequency
sweeps downward in frequency
as the RF is swept upward. In
this case, the reference and test
sweeps as measured at the HP
71500A input should both be in
the same direction (i.e., either
both upwards or both
downwards in frequency). This
means that the RF sweep
direction will reverse from the
reference to the test sweep.
What frequency span to use?
When performing a
normalization on a frequency
translating device, there are
two choices for the frequency
range to use for the reference
sweep: either the frequency
span corresponding to the
DUT’s input, or to its output. In
both cases, either the input
cable or the output cable will be
measured during the reference
sweep at a different frequency
than during the test sweep.
This will not be a problem if
high quality interconnect cables
of the appropriate type for the
frequency range of the
measurement are used. Cables
such as these will have flat
group delay over the full RF and
IF frequency range. Their
contribution to absolute delay
will then be removed by the
normalization process.
When using good cables, the
choice of which frequency span
to use for the reference trace is
simple. For relative
measurements, use the
frequency span corresponding to
the DUT output for establishing
the reference trace. This will
remove any measurement
irregularities due to the HP
71500A (these are more
significant at lower frequencies,
especially below 300 MHz).
For absolute measurements, the
first choice for establishing the
reference trace is to use the
span corresponding to the DUT
input. This ensures that the
delay contribution of the
modulator will be removed. If
the modulator delay is
independent of carrier
frequency, then the
normalization could be done at
the span corresponding to the
DUT output, which has the
advantage of removing any
irregularities due to the HP
71500A. The delay of some FM
modulators is also a function
of the modulation frequency
(this is true for the FM
modulator in an HP 8360 series
synthesizer). If the modulation
frequency is changed after a
normalization has been done,
a new reference sweep is
required.
10
When the group delay flatness
of the cables is not a significant
contribution to measurement
error, the normalization process
should be done with both the
input and output cables
present. If cable contribution is
likely to be a significant factor
over one or both of the
frequency ranges used in the
measurement, then the
normalization can be done with
only one of the cables. The other
cable can then be measured
separately over its intended
frequency range, using the
direct phase measurement
(either with a vector network
analyzer or the HP 71500A),
and its delay contribution
manually removed from the
normalized test data. The group
delay program currently does
not incorporate a two-part
normalization such as this.
Measuring the second cable in
this way is necessary for an
absolute measurement, but may
not be needed for relative
measurements if its
contribution would not be a
significant factor in the
measurement.
Unambiguous delay range
The nature of the modulation
technique for measuring group
delay is such that absolute
group delay values are valid
only for 0±(.5/fmod), where fmod
is the modulation frequency
used for the measurement. This
corresponds to 0±180° of phase
shift. After +180°, the
measurement will wrap around
to –180°, which changes the
sign of the group delay from
positive to negative. This is
equivalent to subtracting
1/fmod worth of delay.
For the zoom FFT mode, the
unambiguous range is further
reduced by a factor of two to
0±(.25/fmod). If the absolute
delay is beyond these limits, it
will be displayed incorrectly.
For example, if the absolute
delay of a DUT and test setup
was 273 ns, and the zoom FFT
mode was used with a
modulation frequency of 1 MHz,
the program would measure
–227 ns (273 ns - .5/1 MHz). If
the direct demodulation mode
was used (zoom FFT off), the
program would measure the
absolute delay correctly, since
the maximum delay range in
this case would be ±500 ns.
The maximum measurable
delay range must be considered
when measuring the absolute
delay of a DUT if a normalized
measurement is done with
significant reference delay. The
reference delay and the delay of
the DUT must be less than the
unambiguous range. For
example, if the unambiguous
range is ±500 ns, and the
reference sweep had 373 ns of
delay, then the DUT delay must
be less than 127 ns. Beyond
this, the delay value will be
negative (until it wraps around
a second time).
The only way to increase the
unambiguous measurement
range is to lower the modulation
frequency. However, this
reduces the aperture as well,
which increases measurement
noise. If the measured absolute
delay of your device changes
significantly with decreasing
modulation frequency
(assuming normalization is
done), then the electrical length
of the device is too long for a
valid measurement at that
modulation frequency. If you
know the approximate electrical
length of your device and can
therefore infer how many phase
wraps occurred, then an invalid
absolute group delay
measurement can be corrected.
If direct demodulation (zoom
FFT off) was used, add N ×
(1/fmod); if the zoom FFT was
used, add N × (.5/fmod), where
N is an integer which accounts
for the number of times the
measurement wrapped around.
Negative delay
Negative values of group delay
can occur when the
measurement wraps around as
described above, or when the
reference path length is longer
than the measurement path.
The program has a flag which
controls whether negative delay
numbers are corrected or not.
The default is set to show
negative numbers (no
correction). This allows
normalization to work correctly
when the reference path is
longer than the measurement
path. For example, if the
reference measurement had -4
ns of absolute delay and the
DUT measured 56 ns, then the
normalized measurement would
correctly show 60 ns of delay (56
ns - (–4 ns)).
11
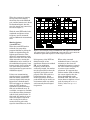
Measurement Time vs. Trace Length
min
27
Obtaining the Program
24
21
18
15
Zoom=128
Zoom=64
12
9
6
3
0
Using the
Personality
Zoom=32
Zoom=16
Zoom=Off
1
4
8
16
32
64
Zoom=8
128
The HP 71500A group delay
personality is distributed free of
charge on an “as is” basis,
without a formal HP product
number. It is neither a fully
supported nor specified product.
The user is free to modify the
IBASIC code to customize it for
their particular measurement
application. The program can be
obtained by contacting your
local HP sales or application
engineer.
Trace Length
Firmware Upgrades
Figure 8: Measurement times versus trace length for various zoom factors.
For N averages, the measurement times will increase by a factor of N.
If the flag is set such that
negative delay values are
corrected, then 1/fmod worth of
delay is added when the direct
demodulation mode is used, and
.5/fmod worth of delay is added
when the FFT zoom mode is
used. This makes any negative
values positive. This operating
mode can correct a
measurement when one phase
wrap has occurred, but can
make a normalized
measurement invalid.
Following the previous example
(using the zoom FFT and 1 MHz
modulation), the normalized
measurement would show -440
ns, which is clearly not correct
(56 ns - (-4 ns + 500 ns)).
To change the negative delay
flag, the user must edit the
program. The variable can be
found in the Measure_group
subroutine. With the USER keys
active, type:
EDIT Measure_group
Set Neg_delay_flag to 0 to
correct negative delay values;
set to 1 to display negative
numbers.
Measurement Times
The time required to perform a
group delay measurement
varies considerably, depending
on the accuracy and resolution
needed. Figure 8 shows typical
measurement times versus
trace length for various zoom
values. These measurement
times will increase by a factor
of N when N averages are used.
What if I have an older
instrument?
This personality needs firmware
revision 1.1 or greater. If you
have an HP 71500A or an HP
70820A module with firmware
revision 1.0 or 1.01, then a
firmware upgrade kit must be
ordered (product number HP
70863A). This upgrade sells for
$2000, and adds several new
features besides the capability
to run IBASIC programs.
Additional features include
increased trace memory for
single-shot measurements, limit
lines, and enhanced trace math
operations.
Downloading the
Program
The group delay personality
must be downloaded into the
memory of the instrument each
time the instrument is powered
up (program memory is volatile).
There are two basic ways to
accomplish this. One method
12
involves using an external
computer, and the other uses
the mass storage capability of
the HP 70004A color
display/mainframe. The latter
method can load the program
either from a floppy disk or a
memory card. Since the
program is likely to be supplied
on a floppy disk, it is desirable
to copy it to a memory card as
soon as possible. Subsequent
downloadings can then be done
from the memory card, which
alleviates the need to have an
external computer or floppy
disk drive.
address and volume number.
The following examples are for
an HP 9122 or HP 9133 floppy
disk drive set to HP-IB address 0:
Loading from an external
computer
After loading the program, press
the RUN softkey or type RUN,
followed by the return key.
The program will prompt you
for the file name to download. In
keeping with the above example
using a floppy disk, you would
type:
The most common way of
downloading the program with
an external computer is to use a
floppy disk. Alternately, the
program can be downloaded
directly from the computer’s
hard disk drive. This is useful if
the program was obtained via
e-mail or ftp. Several choices
for computers exist, such as an
HP 9000 series 300 running
HP BASIC/WS, an HP 9000
series 300/400/700 running
HP-UX (with HP BASIC/UX
running as an application), or a
personal computer (PC) running
HP BASIC/DOS. The computer
must have an IEEE-488 (HP-IB)
port to communicate with the
HP 70004A mainframe.
From the HP BASIC operating
environment, load and run the
ASCII program DOWNLOAD.
To load an ASCII file using HP
BASIC, use the GET command.
You may need to specify the
mass storage logical name,
GET“DOWNLOAD:CS80,700,1”
or
GET “DOWNLOAD:,700,1”
If you are not getting the
program from a floppy disk,
skip the “:,700,1” portion of the
filename, but include the full
path name for the file. The MSI
command could be used to set
the HP BASIC environment to
the correct directory.
G_DEL_IB:,700,1
You should see the program
lines displayed on the screen as
the program is being
downloaded to the HP 71500A.
This process will take a few
minutes to complete. At the end
of the download process, the
program will ask you if you want
to store the program to the
mainframe’s default drive. If you
have a formatted 128K RAM
memory card available, and the
default drive is set to MEMORY
CARD (select under the DISPLAY
keys: Mass Storage; msi),
then enter “Y” to store the
program. An alternate way to
store the program to a memory
card is described in the next
section, along with details of
how to format a memory card.
If you are working in a UNIX®
environment, it is possible to
download the program directly
from the hard disk drive using a
script program, without having
to run HP BASIC or use a
floppy disk. This method is
much faster than using the HP
BASIC download program.
Storing to a memory card
Once the group delay program
has been downloaded to the
instrument, it can then be stored
to a memory card. A 128K RAM
memory card (HP 82215A)
should be used.
Note: the memory card uses a
CR2016 lithium battery. It is
recommended that the battery
be changed annually. To retain
the data stored on the card, the
battery should be replaced
while the card is installed in the
mainframe with the power on.
The memory card must be
formatted before it can be used.
To format a new card, press the
MENU key below the display,
followed by mass storage
(more 2 of 2) under the
States menu (page 2 of 2).
Next, press more followed by
FORMAT. You can select either
DOS or LIF format. After the
formatting is compete, press the
USER key to activate the
IBASIC keys. To save a program
on the card, simply type:
SAVE “G_DEL_IB”
UNIX® is a registered trademark of UNIX Systems Laboratories Inc. in the U.S.A. and other countries.
13
Either an HP-HIL keyboard can
be used for entering the
command (plugged into the
front of the HP 70004A
display/mainframe), or the
“typing aids” key under the
Utility menu of the USER keys.
As the program is stored on the
card, the LED to the left of the
card will flash intermittently.
If there is a problem with the
mass storage definition, refer to
chapter 3 of the HP 71500A
Instrument BASIC User’s
Guide (70820-90055). After you
have successfully stored the
program onto the memory card,
slide the write-protect switch to
the outside position. This will
prevent accidental erasure.
Loading from a memory
card or disk drive
The second method of
downloading the program is to
use the mass storage features of
the HP 70004A mainframe.
Press the DISPLAY key under
the display, followed by Mass
Storage on the left, followed by
msi on the right. Select
MEMORY CARD if the program
has already been stored to a
memory card (see above), or
HP-IB disk if loading from an
external disk drive (connected
to the HP-IB connector on the
back of the mainframe).
Using an HP 9122 or HP 9133
disk drive as before, make sure
that the HP-IB ADDRESS is set
to 0, the UNIT NUMBER to 1, and
the VOLUME NUMBER to 0.
The next step is to actually load
the program. The easiest way
is to use the MENU keys of the
HP 71500A. Press the MENU key
below the display, followed by
States (page 2 of 2) on the
left, followed by mass storage
(more 2 of 2) on the right.
Next, use the up/down stepkeys
to highlight the file to be loaded.
Then press LOAD FILE on the
right. After the file has loaded,
it will automatically run.
It is possible to have the program
automatically load and run
when you power up the analyzer,
by having an “auto-start” file
stored in addition to the group
delay program. The HP 71500A
will look for the auto-start file
on whatever mass storage
device was last used. If you are
using a memory card to store
the group delay program, use
the procedure described
previously to download and copy
the program AUTOST from the
floppy disk to the memory card.
See page 3-8 of the HP 71500A
Instrument BASIC User’s
Guide (70820-90055) for more
information on auto-start files.
Menu Overview
The group delay personality
provides the user with a custom
menu structure, tailored to the
group delay measurement
application. These menus are
accessed under the USER
softkeys. Note that when the
group delay program is running,
successive presses of the USER
key will toggle between the
personality softkeys and the
IBASIC softkeys. The personality
softkeys are structured
similarly to the standard MENU
keys in that the left-hand keys
are fixed, while the right-hand
keys change according to which
left-hand key is pressed. The
personality has six left-hand
menus to choose from:
Sweep: the start, stop, and step
frequencies are set here, as well
as the number of averages to
use during the measurement.
The VIEW SPECTRM key allows
a preview of the measurement
to confirm that everything is set
up correctly. The MEASURE key
starts the actual measurement.
A HELP key is available.
Config: this menu is used to
enter the parameters which
define the hardware setup, such
as mixing numbers and LO
frequency, and the modulation
type and frequency.
Options: this menu allows you
to choose whether to turn the
following functions on or off:
single shot, FFT zoom, phase
and amplitude traces, and
invert phase mode. Also choose
whether markers use highest or
local peak mode. A HELP key is
also available here.
Process: the normalization
softkeys are located here, as
well as an autoscale key. The
FIND LO key invokes a signal
identification routine, which is
used to determine the exact LO
frequency of the DUT.
Sources: set RF, LO, and
modulation source type and
addresses here.
Power: set the power levels of
the various sources used. Also
set the modulation depth (for
AM) or modulation deviation
(for FM) when using a source
with internal modulation.
14
Setting Up and Doing a
Measurement
The order of keystrokes for
setting up a group delay
measurement is not crucial. The
HELP key under the Sweep
menu describes one possible
sequence:
1. Configure the sources
(Sources menu): the
personality allows for the
HP-IB control for up to three
sources (RF, LO, and
modulation). At a minimum,
you must have control of the
RF source to perform a
measurement. When entering
an HP-IB address, use the
last two digits only (for
example, enter 19 rather
than 819). If you are using an
HP 8360 series synthesizer
with the internal modulation
generator option (Opt. 002),
the mod address should be
the same as the RF address,
and both RF src: and Mod
src: should be set to
HP836XX.
When using an HP 70340A
synthesizer, set RF src: to
HP 836XX.
2. Set the power level of the
sources (Power menu):
usually, only the RF power is
set. If a non-HP-IB modulation
generator or the internal
modulation option of the
HP 8360 is used, you need
not set the MOD POWER. If the
internal modulation option is
available, set the AM DEPTH
or FM DEVIATion, as
appropriate. For best results
with either internal or
external modulation, use an
AM depth of 90%, or an FM
deviation of twice the
modulation frequency (ß=2).
This will maximize the
amplitude of the modulation
sidebands of interest.
Note: that when measuring a
multiplier with FM, the
deviation must be corrected by
the multiplication factor.
For example, if using 1 MHz of
FM to test a x3 multiplier, the
deviation should be set to
2 MHz/3 or 667 KHz.
3. Configure the system (Config
menu): the first step is to
select the modulation type
and frequency with the top
two softkeys. Remember, the
measurement aperture is
equal to twice the modulation
frequency, and is independent
of the frequency step.
Next, enter M, N and the LO
frequency which correspond
to the hardware setup. The
following equation is used to
compute the IF frequency at
the output of the DUT:
IF = M*RF + N*LO
The signs of M and N are
determined from whether the
DUT is an up or
downconverter, and whether
it uses high or low-side LO
mixing. The IF frequency
must always be positive, but
it can sweep either up or
down in frequency. This
flexibility allows measurement
of frequency-inverting devices.
Frequency inversion only
occurs when measuring a
downconverter where the LO
frequency is higher than the
RF frequency. Use the
following guide for setting M
and N:
Upconverters:
M = 1, N = 1
(IF = RF + LO)
Downconverters:
For LO > RF,
M = -1, N = 1
(IF = LO - RF)*
For LO < RF,
M = 1, N = -1
(IF = RF - LO)
* frequency inversion occurs
If the DUT is a multiplier, set
M to the correct harmonic
number, and set N and LO to
zero.
The softkey labeled RF is
used for setting the
synthesizer frequency after
VIEW SPECTRM is pressed.
The value for RF is normally
the center of the passband of
interest. During the actual
measurement, this value is
not used, as the synthesizer
is programmed according to
the start, stop, and step
frequencies.
If the LO frequency is not
known exactly, use the FIND
LO routine under the Process
menu. This routine also
programs the synthesizer to
the value set by the RF
softkey. After the LO
frequency is computed, it
automatically updates the
value for the LO softkey. This
routine requires that M and
N are set correctly.
15
The circuit ON/OFF
softkey is used to display or
disable the block diagram
drawing. Although the
drawing shows a connection
of the 10 MHz reference
between the sources and the
HP 71500A, it is usually not
necessary to do so.
to select between the two
marker modes, LOCAL or
HIGHEST (see discussion of
Marker options on page 8).
The phase ON/OFF softkey
determines whether a phase
trace is displayed below the
group delay trace. When
using the zoom FFT mode, an
amplitude trace is also
displayed when phase is set
to ON.
4. Choose the options (Options
menu): the sglshot ON/OFF
softkey determines whether
the measurement is performed
in the single-shot or repetitive
mode of the HP 71500A. This
product note describes the
operation when the singleshot mode is used, where the
modulation frequency must
be less than one half of the
single-shot sample rate,
which is usually between 10
and 20 MHz. The repetitive
mode can be used for higher
modulation frequencies, but
all of the frequencies involved
(including the LO in the DUT)
must be known much more
accurately than in the singleshot case. In general, it is
recommended that everything
be locked together for the
repetitive mode. The zoom
FFT mode is not available
when sglshot is set to OFF.
5. Set the sweep parameters
(Sweep menu): enter the
start, stop and step
frequencies of the RF source
with the top three softkeys.
If the source is to be swept
down in frequency, make the
start frequency higher than
the stop frequency, and enter
a negative value for the
frequency step.
The zoom ON/OFF softkey
determines whether the zoom
FFT mode (zoom ON) or the
direct demodulation mode
(zoom OFF) is used. When
using FFT zoom, the ZOOM
FACTOR softkey is used to
enter the amount of zoom
desired (see discussion of
Measuring in the
Frequency Domain on
page 6). This zoom factor is
only used during the actual
measurement, and not when
VIEW SPECTRM is pressed.
The markers softkey is used
Ideally, the frequency step
should be equal to twice the
modulation frequency for
uniform sampling across the
measurement band. This
provides full group delay
characterization with the
minimum number of data
points. Setting the frequency
step smaller than this fills in
the trace with more points,
but doesn’t provide any
additional group delay
resolution (over-sampled
case). If the frequency step is
larger than twice the
When set to ON, the invert
ON/OFF softkey adds 180°of
phase shift to each
measurement. This is
to account for some
modulators that perform an
inversion of the modulation
signal. This has the effect of
adding .5/fmod worth of delay
to all of the group delay values.
modulation frequency, a
warning message is displayed
on the screen to alert the
user that group delay
variations may be missed
(under-sampled case). Care
should be taken to make the
measurement aperture and
frequency step small enough
to resolve all of the group
delay variations which occur
across the measurement
band for the particular DUT
being tested.
The AVERAGE softkey is used
to enter the number of
averages used during the
measurement.
Before doing an actual
measurement, it is a good
idea to confirm that
everything is set up correctly.
One way to do this is to press
the VIEW SPECTRM softkey.
An FFT of the modulated
carrier is displayed, centered
at the DUT output frequency.
If no signal appears, check
that everything is correctly
set in the Config menu. This
spectrum display is very
useful for setting the right
amount of modulation when
a manual modulation
generator is used.
If the frequency span of the
spectrum is too wide to
clearly see the modulation
sidebands, then the zoom
transform can be used from
the standard HP 71500A
menus to expand the display
(increase the frequency
resolution). To access the
zoom transform, press MENU,
then Traces, then trnsfrm
control. Set zoom to ON
after setting the correct
CENTER and SPAN values.
16
6. Start the measurement
(Sweep menu): to invoke a
measurement, press the
MEASURE key. At any time
during the acquisition of
data, the ABORT key can be
pressed to stop the
measurement. It may take a
few seconds before anything
happens because the abort is
processed after the current
trace acquisition is completed.
If the instrument appears to
be frozen after pressing
ABORT, press INSTR PRESET
followed by the USER key to
return to the personality.
If the top trace does not show
a signal during a
measurement, check that the
stop, start, and step
frequencies, and N and M are
correctly set. As the program
steps along, the IF frequency
and delta phase of the point
being measured is shown on
the display.
7. Normalize and scale the results
(Process menu): if the
measured trace is to be used
as a reference for
normalization, then press the
NORMALZ softkey (see the
previous discussion about
normalization on page 9).
The normal ON/OFF key is
used to turn normalization on
or off. The trace definitions
will change according to the
status of this softkey (e.g.,
MEM1 for an unnormalized
trace, and MEM1-MEM3 for
a normalized trace).
The AUTO-SCALE softkey is
used to automatically scale
the traces to fit the screen. If
a phase trace is displayed,
then the electrical length is
automatically subtracted to
show deviation from linear
phase. This auto-delay
routine uses the entire phase
trace to do a least-squares fit
to a straight line. If it is
desired to flatten out a
smaller portion of the phase
trace, such as the center of
the passband of a filter, then
the auto-delay routine must
be done in conjunction with
markers. The markers should
be placed on trace 2 to define
the frequency band of interest.
The auto-delay routine can
then be invoked again by
pressing AUTO-SCALE. This
routine can also be done via
the MENU keys by pressing
AUTO DELAY under the
Scale menu (more 2 of 2).
All of the traces can be
manually scaled or offset if
desired by using the
appropriate keys under the
Scale menu (more 1 of 2).
Printing/Plotting the
Results
An HP-IB printer or plotter is
needed to directly obtain a
hardcopy of the traces. It should
be connected to the HP-IB
connector of the HP 70004A
display/mainframe, and NOT to
the HP-IB connector on the
HP 70820A module. Make sure
that the HP-IB switch on the rear
panel of the display/mainframe
is set to the on (up) position.
Non-HP-IB printers such as
LaserJets and DeskJets can be
used with an HP-IB to
Centronics converter, such as
the HP 92203J/K.
The PRINT or PLOT keys on the
display/mainframe are used to
dump the traces to the printer
or plotter. Hardcopy parameters
such as printer type, and the
address of the print or plot
device are set under the
Hard Copy menu of the
DISPLAY keys. When using an
HP-IB to Centronics converter,
select either the THINK JET or
the PAINTJT BLACK printer
driver. Do not press any keys on
the display until the printout is
complete — otherwise, the
printout will be aborted.
If the program was loaded into
the memory of the HP 71500A
via a memory card or external
disk, and no computer is
connected to the
display/mainframe HP-IB
connector, then the PRINT and
PLOT keys on the
display/mainframe work
properly. If an external
computer was used to download
the program to the HP 71500A
and it is still connected to the
HP-IB bus, then it either must
be physically removed from the
bus, or it must relinquish bus
control to allow the
display/mainframe to control
the printer or plotter. To remove
the computer as a bus
controller, type the following
BASIC commands in the
computer:
LOCAL 7
SEND 7; UNT UNL DATA
Now press the appropriate key
on the display/mainframe to
initiate a print or plot.
17
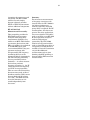
Accuracy
Considerations
Typical Accuracy
Tables 1, 2, and 3 show typical
measurement
repeatability/accuracy versus
zoom size at 1 and 20 GHz.
These numbers do not take into
account mismatch errors, or
frequency normalization error,
so they represent best case
conditions (mismatch is
discussed in more detail on page
18). Each data point in the table
was derived from two nonfrequency translating
measurements of a cable, each
with a 100 MHz span centered
at the carrier frequency. The
first measurement was used as
the reference trace for a
normalized measurement.
The measurement was then
repeated with normalization on,
to determine how much trace
noise was present. These values
are typical of what would be
achieved if normalizing to the
DUT output frequency, which
optimizes for relative group
delay measurements. The RF
carrier power was set to 0 dBm
(the maximum allowable input),
and no averaging was used.
Group Delay vs. Zoom Size
RF=1 GHz
ns
Zoom = off
+/- 1
Zoom = 8
+/- 300 ps
+/- 1.2 ns
Zoom = 16
+/- 275 ps
+/- 1.1 ns
Zoom = 32
+/- 250 ps
+/- 1.0 ns
The results in Tables 1, 2 and 3
can be improved by averaging,
at the expense of measurement
time. N averages increase the
accuracy and measurement
speed by a factor of N. The
accuracy improvement
expressed in dB is 10*log(N).
A 3 dB improvement requires
doubling the number of averages.
+/- 3
ns
Zoom = 64
+/- 200 ps
+/- 750 ps
Zoom = 128
+/- 150 ps
+/- 500 ps
Table 1: Typical group delay
accuracy versus zoom size with no
averaging. Excludes mismatch error.
Phase and Amplitude vs.
Zoom Size
RF = 1 GHz
Phase
Ampl.
Zoom = off
+/- 1°
–
Zoom = 8
+/- .5°
+/- .1 dB
Zoom = 16
+/- .4°
+/- .1 dB
Zoom = 32
+/- .3°
+/- .05 dB
Zoom = 64
+/- .2°
+/- .05 dB
Zoom = 128
+/- .2°
+/- .05 dB
Table 2: Typical phase and
amplitude accuracy versus zoom
size with no averaging, at 1 GHz.
Excludes mismatch error.
Phase and Amplitude vs.
Zoom Size
RF = 20 GHz
Noise Reduction
Averaging
RF=20 GHz
Phase
Ampl.
Zoom = off
+/- 5°
–
Zoom = 8
+/- 2°
+/- .2 dB
Zoom = 16
+/- 1°
+/- .15 dB
Zoom = 32
+/- .8°
+/- .15 dB
Zoom = 64
+/- .7°
+/- .1 dB
Zoom = 128
+/- .5°
+/- .1 dB
Table 3: Typical phase and
amplitude accuracy versus zoom
size with no averaging, at 20 GHz.
Excludes mismatch error.
Smoothing
Smoothing may also be applied
to the trace to reduce the
excursions caused by noise. The
smoothing function is
implemented as a variablelength median smoothing filter.
The number of trace points used
to compute the median is set by
the smoothing value. Smoothing
tends to work best when the
number of trace points is large.
The smoothing function is
accessed via the MENU keys,
under the Traces menu. Press
avg,hld, followed by smooth
ON|OFF until ON is underlined.
Enter the smoothing value
desired. The results of the
smoothing can be compared to
the original trace by toggling
between on and off. While
smoothing can be a useful tool
to reduce displayed trace noise,
too much smoothing affects the
desired data, by reducing
non-noise variations caused by
the DUT itself.
18
Signal-to-Noise Ratio
Mismatch Error
The accuracy of the measurement
is directly proportional to the
signal-to-noise ratio (SNR) of
both signals. For best
measurement results, the
signals at both inputs to the
HP 71500A should be as close to
(but not above) 0 dBm as
possible. Tables 4, 5, and 6 show
the accuracy degradation due
to sub-optimum RF input signal
levels.
Impedance mismatch in the
system between cables, the
DUT, and test equipment causes
group delay, phase and
amplitude ripples versus
frequency. Error caused by
mismatch can be difficult to
eliminate since normalization
only removes mismatch error
present without the DUT in
place. If the DUT has poor port
matches, the mismatch error
introduced when the DUT is
added will be measured as part
of the DUT’s response.
Judicious use of attenuators
and isolators will improve port
matches, insuring that the
measurement contributions of
the test setup are minimized.
When using the FFT zoom
mode, choosing the modulation
index to maximize the
measured sideband levels is
also important (see step 2 on
page 14).
When measuring a DUT with a
frequency response
characteristic of a filter, the
group delay accuracy will degrade
when measuring the filter skirt,
due to a smaller output signal
level.
The bandwidth of the DUT will
also affect the measurement.
The narrower the bandwidth,
the more accurate the
measurement will be due to less
noise. Similarly, a DUT with
excess noise will degrade the
measurement accuracy. DUT
noise may be in the form of LO
phase noise or broadband
amplified noise.
Mismatch error can occur
within the DUT as well. For
this reason, a DUT consisting of
a filter and a mixer may have
significantly worse group delay
performance as compared to the
filter alone, due to the
interactions between the filter,
mixer and internal connections.
LO Stability
This measurement application
assumes that both the internal
LO and the RF source used as
the stimulus are of high quality
(i.e., typical synthesizer
stability and phase noise).
While the LO needs to be stable,
its exact frequency need not be
known initially. The Find LO
routine can be used to determine
the LO frequency with sufficient
accuracy to perform a group
delay measurement.
Group Delay vs. RF Input
Power
RF=1 GHz
RF=20 GHz
0 dBm
+/- 275 ps
+/- 1.1 ns
-10 dBm
+/- 300 ps
+/- 1.5 ns
-20 dBm
+/- 350 ps
+/- 2.0 ns
-30 dBm
+/- 500 ps
+/- 2.5 ns
-40 dBm
+/- 1.2 ns
+/- 3
ns
-50 dBm
+/- 4
+/- 7
ns
ns
Table 4: Typical group delay
accuracy versus RF input power
with no averaging. Zoom size = 16.
Excludes mismatch error.
Phase and Amplitude vs.
RF Power
RF = 1 GHz
Phase
Ampl.
0 dBm
+/- .4°
+/- .1 dB
-10 dBm
+/- .5°
+/- .1 dB
-20 dBm
+/- .7°
+/- .1 dB
-30 dBm
+/- 1.0°
+/- .1 dB
-40 dBm
+/- 1.5°
+/- .1 dB
-50 dBm
+/- 10°
+/- .25 dB
Table 5: Typical phase and
amplitude accuracy versus RF input
power with no averaging. Zoom
size = 16. Excludes mismatch error.
Phase and Amplitude vs.
RF Power
RF = 20 GHz
Phase
Ampl.
0 dBm
+/- 1.0°
+/- .15 dB
-10 dBm
+/- 1.5°
+/- .2 dB
-20 dBm
+/- 2.0°
+/- .2 dB
-30 dBm
+/- 2.5°
+/- .2 dB
-40 dBm
+/- 4°
+/- .3 dB
-50 dBm
+/- 10°
+/- .5 dB
Table 6: Typical phase and
amplitude accuracy versus RF input
power with no averaging. Zoom
size = 16. Excludes mismatch error.
19
When using the FFT zoom
mode, the highest peak function
of the markers can be used to
track an LO that is drifting
slightly during the measurement.
Larger zoom factors result in
less tolerance to LO drift during
the measurement, since the
frequency span becomes
smaller. If the sidebands drift
out of the displayed frequency
span, then obviously the
measurement will be invalid.
The direct demodulation mode
has the most tolerance to LO
drift and residual-FM. Even if
the LO drift is small enough to
allow the measurement to be
done, it can cause degradation
of the group delay accuracy.
Modifying the
Program
The group delay personality for
the HP 71500A may be modified
as necessary to tailor it to your
particular measurement needs.
Manuals
The following manuals will be
helpful for modifying the code:
HP 71500A IBASIC User’s Guide:
70820-90055
HP 71500A Programming
Manual:
70820-90053
HP IBASIC User’s Handbook:
E2083-90005
HP BASIC Condensed
Reference:
98616-90005
All of the commands in the
condensed reference which are
compatible with IBASIC are
indicated by IN. An asterisk *
following the IN indicates that
some restrictions or extensions
may apply.
In addition to the above
manuals, the command preview
and key-logging capability of
IBASIC allow you to see on the
screen or insert in the program
the remote command
equivalents of front-panel key
presses. This greatly reduces
the need for the instrument
programming manual. These
features are accessed under the
IBASIC Miscel menu,
followed by key log. Select
PREVIEW for screen display, or
ON for inserting lines into the
program. Press OFF to
terminate the key-logging mode.
Changing Defaults
The program can be modified so
that it comes up with the all of
the variables preset to your
measurement needs, with the
exception of the source HP-IB
addresses and types. To change
the defaults, make sure the
program is not running and the
USER keys are selected, and
type:
edit “default_values”
After you have changed the
appropriate values, be sure to
re-save the program onto a
memory card or floppy disk. If
you get an error indicating that
the card or disk does not have
enough room to hold the
program, it may be necessary to
delete the old file first, and then
save the current program with
the same name as before.
Adding Sources
To add support for a different
synthesizer, the following
routines in the program must
be modified:
Easy_read
Reset_source
Set_freq
Set_mod_freq
Set_power
Set_output
Set_modulator
Set_mod_pct
Set_mod_dev
Check_assign
Source_menu
Where needed, add the
appropriate output commands
that are consistent with the
programming syntax for the
new synthesizer.
20
Appendix A
Comparison to Other
Instruments
This discussion is meant to
clarify where the HP 71500A
fits in compared to other group
delay measurement solutions.
Vector Network Analyzers
The most common tool for
measuring group delay of linear
devices is the vector network
analyzer (VNA). VNAs utilize
the direct phase measurement
technique. They are very fast
and accurate. A VNA by itself
can only measure non-frequency
translating devices. For
frequency translating
components, an external mixer
or extra DUT must be used so
that the frequency at the
reference and test channels is
the same. However, in order to
make a group delay
measurement, the LO for the
external mixer must be phase
locked to the LO used within
the DUT. This can be
accomplished by either providing
or having access to the internal
LO (or its frequency reference).
This prevents VNAs from
measuring components where
the LO is embedded with no
external access.
The VNA cannot directly
measure absolute group delay
either. Absolute delay must be
inferred from several
measurements involving
swapping of mixers, or an
assumption that the mixer
contributes little delay. The HP
71500A can measure absolute
delay directly, with a relatively
simple normalization routine.
Trade-offs
Scalar Network Analyzers
Although the HP 71500A can
make these absolute and
relative group delay
measurements, there is a tradeoff in performance compared to
using a vector network analyzer
— reduced speed and accuracy.
Measurement speed is slower
for two reasons. The first is that
a stepped CW approach is
required, which is slower than
using a continuous sweep. The
second reason is that the noise
reduction techniques needed for
high accuracy measurements
take a fair amount of time (FFT
zoom, trace averaging, or both).
An example of speed for a
typical measurement using FFT
zoom and no averaging, is
about 2 minutes for a 32 point
sweep (using a zoom factor of
16). For absolute delay
measurements, there may be an
overall measurement speed
improvement because of a
simpler calibration routine —
no external mixer calibrations
are needed.
Some scalar network analyzers
(SNAs) can be configured to
measure AM group delay,
providing fast sweeps and
medium accuracy for relatively
low cost. Their primary target is
for high volume manufacturing
test, where throughput is more
important than accuracy. SNAs
use the AM envelope technique,
using broadband diode detectors
to strip the AM from the RF
carrier. As such, they can
measure both linear and
frequency translating devices
with internal LOs. The lack of
capability to provide FM group
delay precludes their use for
some applications where AM
can’t be used. Although slower
and more expensive, the MTA’s
main advantages are providing
FM group delay and better
accuracy.
The second disadvantage is that
measurement accuracy is likely
to be less than what can be
achieved using a VNA due to lack
of full vector error correction,
and linearity limitations within
the HP 71500A. An HP 8510C
network analyzer can achieve
relative group delay accuracies
below 100 ps for linear devices,
or for measurements relative
to a golden standard.
Microwave Link Analyzers
The microwave link analyzer
(MLA) provides fast and
accurate FM group delay
measurements, and also makes
other important measurements
on analog microwave radio links.
For loop-back testing (testing a
link over a short distance), one
MLA is used. For end-to-end
link measurements, two MLAs
are used. MLAs are used directly
only for IF-IF measurements
(non-frequency translating
links). For measuring frequency
translating links, (RF-IF or
IF-RF measurements),
the system must provide the
necessary converters and access
to IF ports. For measuring
subassemblies like frequency
converters, extra components
such as mixers, filters, and LOs
would be needed, thereby greatly
21
increasing the system cost and
complexity. The HP 71500A
solution is much simpler,
because it directly provides
RF-IF or IF-RF measurements
without additional components.
HP 11770A Link
Measurement Personality
This personality provides the
HP 8590 E-series spectrum
analyzers with group delay
measurement capability very
similar to an MLA. This solution
can measure devices from 300
KHz to 2.9 GHz; it is not limited
to 70/140 MHz IFs as with
a conventional MLA. Using two
spectrum analyzers with
this personality, RF frequency
translating devices can be
measured relatively inexpensively.
The link analyzer personality
has one potentially serious
limitation — it cannot measure
devices that perform a
frequency inversion (i.e., the IF
sweeps downward in frequency
as the RF is swept upwards).
This can occur when measuring
downconverters such as direct
broadcast satellite (DBS) tuners
that use high-side LO mixing
(LO > RF). The MTA does not
have this limitation as it is
tuned independently from
the source.
Summary
For microwave measurements
of frequency converters with
internal LOs, the HP 71500A is
the highest performance
solution, especially when FM
group delay is required. For RF
measurements, the choices are
greater. For many applications,
lower cost solutions will suffice,
such as an SNA, or two HP 8590
E-series spectrum analyzers
with the link analyzer
personality. The HP 71500A
solution can fill certain niches
such as when FM group delay of
a frequency inverting device is
needed, or where the instrument
can provide additional
measurements such as time
domain pulsed-RF profiling, or
dynamic AM-to-PM conversion
measurements.
For more information, call
your local HP sales office
listed in your telephone
directory or an HP regional
office listed below for the
location of your nearest sales
office.
United States of America:
1 800 452 4844
Canada:
(416) 206 4725
Japan:
(81) 426 48 0722
Latin America:
Miami, Florida
(305) 267 4245/4220
Australia/New Zealand:
(008) 13 1347
Melbourne Caller
272 2555
In Europe, Africa, and Middle East
please call your local HP sales
office or representative:
Austria/East Central Europe:
(1) 25000-0
Belgium and Luxembourg:
(02) 778 31 11
Denmark:
45 99 10 00
Finland:
(90) 88 721
France:
(1) 69.82.65.00
Germany:
(06172) 16 0
Greece:
(01) 68 96 411
Ireland:
(01) 284 4633
Asia Pacific:
Hong Kong
(852) 599 7070
Israel:
(03) 5380 333
Korea
(2) 769 0800
Italy:
(02) 92 122 241
Taiwan
(2) 717 9524
Netherlands:
(020) 547 6669
Singapore
(65) 291 8554
Norway:
(22) 73 56 00
India
(11) 690 355
Portugal:
(11) 301 73 30
PRC
(1) 505-3888
South Africa:
(011) 806 1000
Spain:
900 123 123
Sweden:
(08) 750 20 00
Switzerland:
(01) 735 7111
Turkey:
(312) 425 83 13
United Kingdom:
(0344) 366 666
For countries not listed,
contact Hewlett-Packard,
International Sales Europe,
Geneva, Switzerland
Tel: +41-22-780-4111
Fax: +41-22-780-4770
Data Subject to Change
Copyright © 1994
Hewlett-Packard Company
Printed in U.S.A. 4/94
5091-8634E