1
ReadyNAS OS 6.1
•
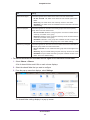
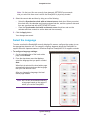
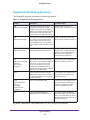
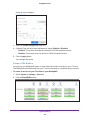
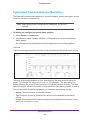
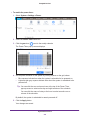
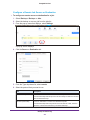
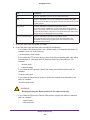
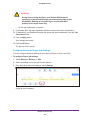
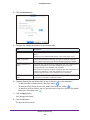
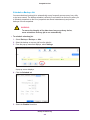
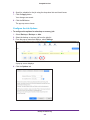
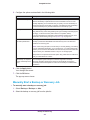
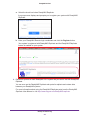
Update. Select how often the information in the graphic is updated. You can select from 1
to 30 minutes.
Network
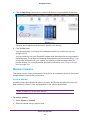
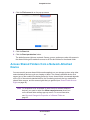
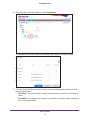
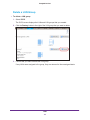
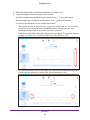
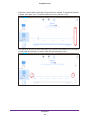
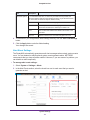
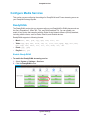
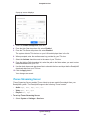
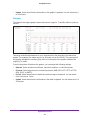
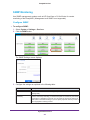
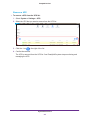
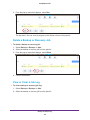
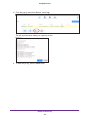
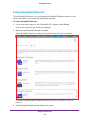
The Network throughput graphic shows the network usage for Tx and Rx traffic in bytes per
second.
The range is flexible and depends on your selections from the drop-down lists above the
graphic. For example, the range can be 0 to 60 bytes or from 0 to 40 KB. The upper part of
the graphic indicates the incoming (Rx) traffic; the lower part of the graphic indicates the
outgoing (Tx) traffic.
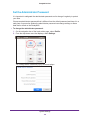
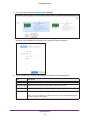
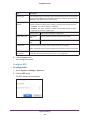
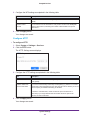
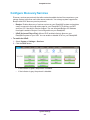
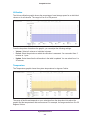
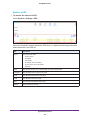
From the drop-down lists above the graphic, you can adjust the following settings:
•
Network. Select all network interfaces, individual interfaces, or individual bonds.
•
Protocol. Select all protocols or individual protocols (SMB, NFS, AFP, HTTP, HTTPS,
SSH, iSCSI, or SMTP).
•
Period. Select the period over which the network usage is measured. You can select
from 5 minutes to 1 year.
•
Update. Select how often the information in the table is updated. You can select from 1 to
30 minutes.
System Maintenance
217