1
Agilent N9340B
Handheld
Spectrum Analyzer
User’s Guide
!"
Notices
© Agilent Technologies, Inc. 2008-2009
No part of this manual may be reproduced
in any form or by any means (including
electronic storage and retrieval or
translation into a foreign language)
without prior agreement and written
consent from Agilent Technologies, Inc. as
governed by United States and
international copyright laws.
Warranty
Second edition, July 2009
Printed in China
Agilent Technologies, Inc.
No. 116 Tuo Xin West 1st Street
Hi-Tech Industrial Zone (South),
Chengdu 610041, China
The material contained in this document
is provided “as is,” and is subject to
being changed, without notice, in future
editions. Further, to the maximum extent
permitted by applicable law, Agilent
disclaims all warranties, either express
or implied, with regard to this manual
and any information contained herein,
including but not limited to the implied
warranties of merchantability and fitness
for a particular purpose. Agilent shall not
be liable for errors or for incidental or
consequential damages in connection
with the furnishing, use, or performance
of this document or of any information
contained herein. Should Agilent and the
user have a separate written agreement
with warranty terms covering the
material in this document that conflict
with these terms, the warranty terms in
the separate agreement shall control.
Software Revision
Technology Licenses
This guide is valid for A.01.00 revisions of
the Agilent N9340B Handheld Spectrum
Analyzer firmware.
The hardware and/or software described
in this document are furnished under a
license and may be used or copied only in
accordance with the terms of such
license.
Manual Part Number
N9340-90008
Edition
CAU TION
A CAUTION notice denotes a hazard. It
calls attention to an operating procedure, practice, or the like that, if not
correctly performed or adhered to,
could result in damage to the product
or loss of important data. Do not proceed beyond a CAUTION notice until
the indicated conditions are fully
understood and met.
WAR NIN G
A WARNING notice denotes a hazard.
It calls attention to an operating procedure, practice, or the like that, if not
correctly performed or adhered to,
could result in personal injury or
death. Do not proceed beyond a
WARNING notice until the indicated
conditions are fully understood and
met.
Restricted Rights Legend
If software is for use in the performance of
a U.S. Government prime contract or
subcontract, Software is delivered and
licensed as “Commercial computer
software” as defined in DFAR
252.227-7014 (June 1995), or as a
“commercial item” as defined in FAR
2.101(a) or as “Restricted computer
software” as defined in FAR 52.227-19
(June 1987) or any equivalent agency
regulation or contract clause. Use,
duplication or disclosure of Software is
subject to Agilent Technologies’ standard
commercial license terms, and non-DOD
Departments and Agencies of the U.S.
Government will receive no greater than
Restricted Rights as defined in FAR
52.227-19(c)(1-2) (June 1987). U.S.
Government users will receive no greater
than Limited Rights as defined in FAR
52.227-14 (June 1987) or DFAR
252.227-7015 (b)(2) (November 1995), as
applicable in any technical data.
Contents
1
Overview
Introduction
2
Front Panel Overview
5
Display Annotations
Top Panel Overview
Instrument Markings
2
6
7
8
Getting Started
Checking Shipment and Order List
Power Requirements
AC Power Cords
10
11
12
Safety Considerations
13
Working with Batteries 16
Powering on the Analyzer for the First Time 18
Preparation for Use
19
Making a Basic Measurement 20
3
System and File
System Setting 24
Power On and Preset Settings 24
Factory Default Settings 25
Visual and Audio Adjustment 26
General system settings 26
Switch Timer 27
IP configuration 27
Upgrading Firmware 28
Ext Input 28
Adding an Option 29
Show System 30
Show Error 30
Perform a Time Base Calibration 30
Low Frequency Channel
File
31
32
4
Making Measurements
Measuring Multiple Signals
38
Measuring a Low-Level Signal
43
Improving Frequency Resolution and Accuracy
Making Distortion Measurements
48
49
Making a Stimulus Response Transmission Measurement
Measuring Stop Band Attenuation of a Low-pass Filter
Making a Reflection Calibration Measurement
55
57
59
Measuring Return Loss Using the Reflection Calibration Routine
Making an Average Power Measurement 63
Spectrogram 68
Demodulating an FM Signal
71
Analysis the Demodulated Signals
ASK/FSK Demodulation Analysis
73
76
Monitoring the ADSL Signal with Option XDM 79
5
Key Reference
Amplitude
82
BW/SWP
86
Enter
92
ESC/CLR 92
Frequency
Marker
95
MEAS
100
MODE
112
SPAN
128
TRACE
93
132
62
LIMIT
137
6
Overview
Error Messages
140
Error Message List
7
141
Troubleshooting
Check the basics
146
Warranty and Service Options
Contact Agilent Technologies
8
Menu Map
147
148
Documentation Conventions:
1. A pair of curly brackets { } indicates a softkey, for example
{Start} refers to the Start softkey.
2. A pair of square brackets [ ] indicates a hardkey,
for example, [ENTER] refers to the ENTER hardkey.
3. “Analyzer” refers to Agilent N9340B handheld spectrum
analyzer in the following chapters.
4. “DUT” refers to a device under test.
Agilent N9340B
Handheld Spectrum Analyzer
1
Overview
!"
1
1
Overview
Introduction
The Agilent N9340B is a handheld spectrum
analyzer with a frequency range of 100 kHz to 3
GHz, tunable to 9 kHz. It has several different
measurement modes. Each mode offers a set of
automatic measurements that pre- configure the
analyzer settings for ease of use. It provides
ultimate measurement flexibility in a package that
is ruggedized for field environments and
convenient for mobile applications.
Functionality and Feature
The Agilent N9340B provides your with a
comprehensive functionality set and measurement
convenience, including:
• Power Measurement
provides power measurement functionality on
OBW (Occupied Bandwidth), channel power, ACPR
(Adjacent Channel Power Ratio).
• Spectrogram
provides the capability to analyze the stability of
a signal over the time. With option INM, the
N9340B can unattended monitor the signal
capturing performance or intermittent events
over extended periods of time.
• Spectrum Emission Mask
provides a Pass/Fail testing capability with a
mask for out- of- channel emissions measurement.
• High Accuracy Power Measurement
The N9340B supports Agilent U2000 series
power sensors for high accuracy power
measurement as a power meter.
2
N9340B User’s Guide
Overview
1
• IBOC Measurement (Option IBC)
Provides the in- band- on- channel measurement
capability through a dedicated measurement
personality and selected hardware improvement.
• xDSL Measurement (Option XDM)
supports measurements on ADSL, ADSL2+ and
VDSL networks.
• Demodulation analysis function
provides AM/FM and ASK/FSK demodulation
analysis function. (AM/FM: Option- AMA
ASK/FSK: Option- DMA)
• Tracking generator (Option TG3)
provides an RF source for scalar network
analysis.
• High-sensitivity measurement (Option PA3)
includes a 3 GHz pre- amplifier enabling highly
sensitivity measurements, useful in the analysis
of low- level signals.
For the latest product technical information, please
refer to the link below:
http://www.agilent.com/find/n9340b
For the latest option information, please refer to
the link below:
http://www.agilent.com/find/n9340b_upgrades
N9340B User’s Guide
3
1
Overview
Optimized Usability
The Agilent N9340B handheld spectrum analyzer
provides enhanced usability:
• The 6.5-inch TFT colorful LCD screen ( 640 × 480 pixels)
enables you to read the scans easily and clearly
outdoors.
• Arc-shaped handle and rugged rubber casing ensure a
comfortable and firm hold and ruggedness.
• SCPI remote control via USB and LAN port.
• The PC software in the N9340B Helpkit CD is
convenient for your further editing and data
analysis.
• 4-hour-time battery provides you a continuous
work time in the field test.
• The light sensor adjusts the display brightness
according to the environment to save power.
• The headphone jack on the top panel is for the
audio signal analysis and monitor.
• Back-lit keys makes you find the right keys in
darkness easily.
4
N9340B User’s Guide
Overview
1
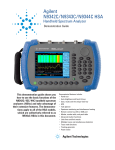
Front Panel Overview
11
12
13
10
9
N9340B
100 kHz - 3.0 GHz
HANDHELD SPECTRUM ANALYZER
F1
F2
F3
F4
F5
1 ABC
2 DEF
3 GHI
4 JKL
5 M NO
6 PQR
7 STU
8 VW X
9 YZ_
8
F6
0 SAVE
7
LIM IT
F7
PRESET
M ARKER
ESC/ CLR
6
ENTER
SYS
M ODE
M EAS
TRACE
BW /
SW P
AM PTD
SPAN
FREQ
5
1
Caption
2
3
4
Function
1
Power Switch
Toggles the analyzer between on and off
2
Function keys
Includes hardkeys: SYS, FREQ, SPAN, AMPTD,
BW/SWP, TRACE, MEAS, and MODE
3
Preset
Returns the analyzer to a known state, also turns
on/off power save feature (press for 1 sec.)
4
Enter
Confirms a parameter selection or configuration
5
MARKER
Activates the marker function
6
ESC/CLR
Exits and closes the dialog box or clears the
character input
7
LIMIT
Sets limit lines for quick Pass/Fail judgement
8
Save
Quick saves the current screen/trace
9
Arrow keys
Increases or decreases a parameter step by step
10
Knob
Selects an mode or edits a numerical parameter
11
Softkeys
Indicates current menu functions on the LCD
12
Speaker
Actives in demodulation mode
13
Screen
Displays measured traces and status
N9340B User’s Guide
5
1
Overview
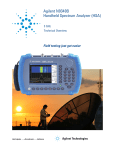
Display Annotations
13
14
1
12
2
15:44:03 03,10,08
3
4
11
5
6
6
7
8
10
9
Description
Associated Function Key
1
Time and Date
[SYS] > {Setting} > {General}
2
Reference Level
[AMPTD]
3
Amplitude Scale
[AMPTD]
4
Detector Mode
[TRACE] > {More} > {Detector}
5
Center Frequency
[FREQ] > {Center Freq}
6
Resolution Bandwidth
[BW/SWP] > {RBW}
7
Display Status Line
Displays status and error messages.
8
Video Bandwidth
[BW/SWP] > {VBW}
9
Frequency Span
[SPAN]
10
Sweep Time
[BW/SWP] > {Sweep Time}
11
Key Menu
See key label description in the key reference for more information.
12
Key Menu Title
Refers to the current activated function
13
Marker Amplitude
[Marker]
14
Marker Frequency
[Marker]
N9340B User’s Guide
Overview
1
Top Panel Overview
9
10
8
50 VDC M AX
33 dBm (2 W) M AX
EXT TRIG IN/
EXT REF IN
RF INPUT 50
RF OUT 50
Ext. Pow er
Charging
PC
12-18 VDC
55W MAX
1
2
3
4
5
Caption
1 External DC power
connector
6
7
Function
Provides input for the DC power source via an
AC-DC adapter, or Automotive type DC adapter.
2 LED indicator (Charging)
Lights (On) when the battery is charging
3 LED indicator
Lights (On) when external DC power is connected to the tester
4 USB interface (Device)
Connects to a PC
5 USB interface (Host)
Connects to a USB memory stick or disk
6 Headphone
Connects to a headphone
7 LAN Interface
Connects to a PC for SCPI remote control
8 RF OUT Connector
The output for the built-in tracking generator.
Enabled with Option TG3.
9 EXT TRIG IN/REF IN
(BNC, Female)
Connects to an external TTL signal or a 10 MHz
reference signal. The TTL signal is used to
trigger the analyzer’s internal sweep
10 RF IN Connector (50 Ω)
Accepts an external input with a frequency range
from 100 kHz to 3 GHz, tunable to 9 kHz.
N9340B User’s Guide
7
1
Overview
Instrument Markings
The CE mark shows that the product
complies with all relevant European
Legal Directives.
The CSA mark is a registered trademark
of the Canadian Standards Association.
N10149
ISM1-A
ICES/NMB-001
The C-Tick mark is a registered trademark
of the Australian Spectrum Management
Agency.
This symbol is an Industrial Scientific
and Medical Group 1 Class A product
(CISPR 11, Clause 4)
The ISM device complies with Canadian
Interference- Causing Equipment Standard- 001.
indicates that the user must refer to
specific instructions in use.
The symbol is used to mark a position of
the instrument power switch.
indicates this product complies with the
WEEE Directive (2002/96/EC) marking
requirements and you must not discard
this equipment in domestic household
waste. Do not dispose in domestic household waste. To return unwanted products, contact your local Agilent office, or
refer to
http://www.agilent.com/environment/product/
8
N9340B User’s Guide
Agilent N9340B
Handheld Spectrum Analyzer
2
Getting Started
Information on checking the analyzer
when received, preparation for use,
basic instrument use, familiarity with
controls, defining preset conditions,
updating firmware, and contacting
Agilent Technologies.
9
Agilent Technologies
9
2
Getting Started
Checking Shipment and Order List
Check the shipment and order list when you
receive the shipment.
• Inspect the shipping container for damages.
Signs of damage may include a dented or torn
shipping container or cushioning material that
indicate signs of unusual stress or compacting.
• Carefully remove the contents from the shipping
container, and verify if the standard accessories
and your ordered options are included in the
shipment.
• For any question or problem, contact Agilent
Technologies Customer Contact Center (CCC) for
consultant and service. See “Contact Agilent
Technologies" on page 148. For the latest service
information please refer to:
http://www.agilent.com/find/assist
10
N9340B User’s Guide
Getting Started
2
Power Requirements
The AC power supplied must meet the following
requirements:
Voltage:
100 VAC to 240 VAC
Frequency:
47 to 63 Hz
Power:
Maximum 63 W
The AC/DC power supply charger adapter supplied
with the analyzer is equipped with a three- wire
power cord, in accordance with international safety
standards. This power cord grounds the analyzer
cabinet when it is connected to an appropriate
power line outlet. The power cord appropriate to
the original shipping location is included with the
analyzer.
Various AC power cables are available from Agilent
that are unique to specific geographic areas. You
can order additional AC power cords are correct
for use in different areas. The AC Power Cords
table provides a lists of the available AC power
cords, the plug configurations, and identifies the
geographic area in which each cable is typically
used.
The detachable power cord is the product
disconnecting device. It disconnects the main AC
circuits from the DC supply before other parts of
the product. The front- panel switch is only a
standby switch and do not disconnect instrument
from AC LINE power.
N9340B User’s Guide
11
2
Getting Started
AC Power Cords
Plug Type
Cable Part
Number
8121-1703
Plug a
Description
BS 1363/A
For use in
Country & Region
Option 900
United Kingdom, Hong
Kong, Singapore, Malaysia
250V 10A
8120-0696
AS 3112:2000 Option 901
Australia, New Zealand
250V 10A
8120-1692
IEC 83 C4
Option 902
Continental Europe, Korea,
Indonesia, Italy, Russia
250V 16A
8120-1521
125V 10A
8120-2296
CNS 10917-2 Option 903
/NEMA 5-15P Unite States, Canada,
Taiwan, Mexico
SEV 1011
Option 906
Switzerland
250V 10A
8120-4600
SABS 164-1
Option 917
South Africa, India
230V 15A
8120-4754
JIS C8303
Option 918
Japan
125V 15A
8120-5181
SI 32
Option 919
Israel
250V 16A
8120-8377
GB 1002
Option 922
China
250V 10A
12
N9340B User’s Guide
Getting Started
2
Safety Considerations
Agilent has designed and tested the N9340B
handheld spectrum analyzer for Measurement,
Control and Laboratory Use in accordance with
Safety Requirements IEC 61010- 1: 2001, UL
61010- 1 (2004), and CSA C22.2 No.61010- 1- 04. The
tester is supplied in a safe condition. The N9340B
is also designed for use in Installation Category II
and Pollution Degree 2 per IEC 61010 and IEC
60664 respectively.
Read the following safety notices carefully before
you start to use a N9340B handheld spectrum
analyzer to ensure safe operation and to maintain
the product in a safe condition.
WA RN ING
WA RN ING
WA RN ING
Personal injury may result if the analyzer’s cover is
removed. There are no operator-serviceable parts inside.
Always contact Agilent qualified personnel for service.
Disconnect the product from all voltage sources while it
is being opened.
This product is a Safety Class I analyzer. The main plug
should be inserted in a power socket outlet only if provided
with a protective earth contact. Any interruption of the
protective conductor inside or outside of the product is likely
to make the product dangerous. Intentional interruption is
prohibited.
Electrical shock may result when cleaning the analyzer
with the power supply connected. Do not attempt to
clean internally. Use a dry soft cloth to clean the outside
case only.
WA RN ING
Always use the three-pin AC power cord supplied with
this product. Failure to ensure adequate earth grounding
by not using this cord may cause personal injury and
product damage.
N9340B User’s Guide
13
2
Getting Started
WA RN ING
CAU
CAU
TI O- N
CAU
CAU
TI O- N
CAU
CAU
TI O- N
14
Danger of explosion if the battery is incorrectly replaced.
Replace only with the same type battery recommended.
Do NOT dispose of batteries in a fire.
Do NOT place batteries in the trash. Batteries must be
recycled or disposed of properly.
Recharge the battery only in the analyzer. If left unused, a
fully charged battery will discharge itself over time.
Temperature extremes will affect the ability of the battery
to charge. Allow the battery to cool down or warm up as
necessary before use or charging.
Storing a battery in extreme hot or cold temperatures will
reduce the capacity and lifetime of a battery. Battery
storage is recommended at a temperature of less than
25 oC.
Never use a damaged or worn-out adapter or battery.
Charging the batteries internally, even while the analyzer
is powered off, the analyzer may keep warm. To avoid
overheating, always disconnect the analyzer from the AC
adapter before storing the analyzer into the soft carrying
case.
Connect the automotive adapter to the power output
connector for IT equipment, when charging the battery on
your automotive.
The VxWorks operating system requires full conformity to
USB 1.1 or USB 2.0 standards from a USB disk. Not all the
USB disk are built that way. If you have problems
connecting a particular USB disk, please reboot the
analyzer before inserting the next USB stick.
N9340B User’s Guide
Getting Started
2
Environmental Requirements
The N9340B is designed for use under the
following conditions:
• Operating temperature:
0 oC to 40 oC (using AC- DC adapter)
–10 oC to +50 oC (using battery)
• Storage temperature: –40 oC to +70 oC
• Battery temperature: 0 oC to 45 oC
• Humidity: 85% + 5%
Electrical Requirements
The analyzer allows the use of either a lithium
battery pack (internal), AC- DC adapter shipped
with the analyzer, or optional automotive +12 VDC
adapter for its power supply.
Electrostatic Discharge (ESD) Precautions
This analyzer was constructed in an ESD protected
environment. This is because most of the
semiconductor devices used in this analyzer are
susceptible to damage by static discharge.
Depending on the magnitude of the charge, device
substrates can be punctured of destroyed by
contact or proximity of a static charge. The result
can cause degradation of device performance, early
failure, or immediate destruction.
These charges are generated in numerous ways,
such as simple contact, separation of materials,
and normal motions of persons working with static
sensitive devices.
When handling or servicing equipment containing
static sensitive devices, adequate precautions must
be taken to prevent device damage or destruction.
Only those who are thoroughly familiar with
industry accepted techniques for handling static
sensitive devices should attempt to service circuitry
with these devices.
N9340B User’s Guide
15
2
Getting Started
Working with Batteries
CAU
CAU
TI O- N
Full charge the battery before first using the analyzer.
Installing a Battery
Step
Notes
1 Open the battery cover
Use a phillips type screwdriver,
loosen the retaining screw, then
pull the battery cover open.
2 Insert the battery
Observe correct battery polarity
orientation when installing.
3 Close the battery cover Push the cover closed, then
re-fasten the cover with the
retaining screw.
Viewing Battery Status
Determine the battery status using either of the
following methods:
• Checking the battery icon in the lower- right corner of the front- panel screen: it indicates the
approximate level of charge.
• Press the gray button in the upper right corner
of the battery, the number of lighted green LED
indicates the percentage of the battery power.
• Press [SYS] > {More} > {Show System} > {Page down}
to check the current battery information.
16
N9340B User’s Guide
Getting Started
2
Charging a Battery
You may charge the battery both in the tester and
in the external battery charger (option BCG).
CAU
CAU
TI O- N
Connect the automotive adapter to the IT power outlet of your
automobile (with option 1DC) for battery recharging.
1 Insert the battery in the analyzer.
2 Plug in the AC- DC adapter and switch on the
external power.
3 The charge indicator lights, indicating that the
battery is charging. When the battery is fully
charged, the green charging indicator turns off.
During charging and discharging, the battery
voltage, current, and temperature are monitored. If
any of the monitored conditions exceed their safety
limits, the battery will terminate any further
charging or discharging until the error condition is
corrected.
The charging time for a fully depleted battery, is
approximately four hours.
N9340B User’s Guide
17
2
Getting Started
Powering on the Analyzer for the First Time
Insert the battery into the analyzer or connect the
analyzer to an external line power supply via the
AC- DC adapter, then press the power switch on
the front panel of your N9340B to power on the
analyzer.
CAU
CAU
TI O- N
Use only the original AC-DC adapter or originally supplied
battery for the power source.
The maximum RF input level of an average continuous
power is 33 dBm (or +50 VDC signal input). Avoid
connecting a signal into the analyzer that exceeds the
maximum level.
Allow the analyzer to warm- up for 30 minutes
before making a calibrated measurement. To meet
its specifications, the analyzer must meet operating
temperature conditions.
Install battery
Press Power Switch
18
N9340B User’s Guide
Getting Started
2
Preparation for Use
Use [SYS] hardkey to check or set the system
settings of your analyzer.
Setting up your N9340B
1 Press [SYS] > {Setting} > {General} to set time and
power saving mode:
• Press {Time/Date} to set the time and date.
2 Press [SYS] > {Setting} > {Language} to select a
language displayed on screen. There are 11
languages for your selection.
3 Press [SYS] > {Brightness} and then rotate the
knob to adjust display brightness.
4 Press [SYS] > {Key Beep} to toggle the buzzer beep
function between on and off.
Checking Instrument Information
1 Press [SYS] > {More} > {Show System} to display the
system information.
2 Press [SYS] > {More} > {Option} to display the
option information.
3 Press [SYS] > {More} > {Show Error} to display the
error information.
Testing buttons Press [SYS] > {More} > {Diagnostics} >
{Front Panel} to test all the front panel keys except
[PRESET], [ESC/CLR] and power switch.
N9340B User’s Guide
19
2
Getting Started
Making a Basic Measurement
This section provides information on basic analyzer
operations. It assumes that you are familiar with
the front and top panel buttons and keys, and
display annotations of your analyzer. If you are
not, please refer to “Front Panel Overview" on
page 5, and “Top Panel Overview" on page 7, and
“Instrument Markings" on page 8.
For more details on making measurements, please
refer to “Making Measurements" on page 37”.
Entering Data
When setting measurement parameters, there are
several ways to enter or modify active function
values:
1 Using the Front Panel Knob
Increases or decreases the current value.
2 Using the Arrow Keys
Increases or decreases the current value by the
step unit defined.
Press [FREQ] > {CF Step} to set the frequency by an
auto- coupled step (Step = Span/10, when {CF Step}
mode is set to Auto).
3 Using the Numeric Keypad
Enters a specific value. Then press a terminator
key (either a specified unit softkey or [ENTER]) to
confirm input.
4 Using the Unit Softkeys
Terminates a parameter value which requires a
unit input.
5 Using the Enter Key
Terminates an entry or confirms a selection.
20
N9340B User’s Guide
Getting Started
2
Viewing a Signal on the Analyzer
1 Use a signal generator to generate a CW signal
of 1.0 GHz, at a power level of 0.0 dBm.
2 Press [SYS] > {Setting} > {PwrOn/Preset} > {Preset
Type} and select DFT to toggle the preset setting to
factory- defined status.
3 Press the green [Preset] key to restore the
analyzer to its factory- defined setting.
4 Connect the generator’s RF OUT connector to
analyzer’s RF IN connector.
5 Press [FREQ] > 1 > {GHz} to set the analyzer center
frequency to 1 GHz.
6 Press [SPAN] > 5 > {MHz} to set the analyzer
frequency span to 5 MHz.
7 Press [MARKER] > {Peak Search} to place a marker
(M1) at the highest peak (1 GHz) on the display.
The Marker amplitude and frequency values appear
in the function block and in the upper- right corner
of the screen.
Use the front- panel knob, arrow keys, or the
softkeys in the Peak Search menu to move the
marker and read out the value of both frequency
and amplitude displayed on the screen.
Figure 2-1
N9340B User’s Guide
View a signal (1 GHz, 0 dBm)
21
2
22
Getting Started
N9340B User’s Guide
Agilent N9340B
Handheld Spectrum Analyzer
3
System and File
This chapter provides the information
on basic system setting and file
operation, Such as, display, option
activation, calibration, firmware
upgrade and test data saving/loading.
Agilent Technologies
23
3
System and File
System Setting
This section provides you the basic system
configuration which is frequently used before or
after the measurement operation. Please refer to
the description below to get a better user
experience and ease your test and measurement.
Power On and Preset Settings
Selecting a preset type
Press [SYS] > {Setting} > {PwrOn/Preset} > {Preset Type}
to choose the preset types. The analyzer has three
types of preset setting for you to choose from:
DFT Restores the analyzer to its factory- defined
setting. The factory default settings can be
found, “Factory Default Settings" on page 25.
User Restores the analyzer to a user- defined setting. Refer to the descriptions as below.
Last
Restores the analyzer to the last time setting.
Saving a User-defined Preset
If you frequently use system settings that are not
the factory defaults, refer to the following steps to
create a user- defined system settings that can be
easily recalled at the power up state:
1 Set analyzer parameters by the knob, the arrow
keys or the numeric keypad.
2 Press [SYS] > {Setting} > {PwrOn/Preset} > {Save
User} to save the current parameters as the user
preset setting.
3 Press [SYS] > {Setting} > {PwrOn/Preset} > {Preset
Type User} to set the preset mode to user defined
system setting.
4 Press [Preset], the instrument will be set to the
state you previously saved.
24
N9340B User’s Guide
System and File
3
Factory Default Settings
Parameter
Center Frequency
Start Frequency
Stop Frequency
Span
Reference Level
Attenuation
Scale/DIV
Scale Type
RBW
VBW
Average Type
Sweep time
Sweep Mode
Trace 1
Trace 2
Trace 3
Trace 4
Trace 1 Detection
Trace 2 Detection
Trace 3 Detection
Trace 4 Detection
Trace Average
Marker
File Type
Save Path
Mode
External Input type
N9340B User’s Guide
Default Setting
1.5 GHz
0.0 Hz
3.0 GHz
3.0 GHz
0.0 dBm
Auto (20 dB)
10 dB/DIV
Log
Auto (1 MHz)
Auto (1 MHz)
Log Power
Auto
Normal
Clear write
Blank
Blank
Blank
Pos Peak
Pos Peak
Pos Peak
Pos Peak
All Off
All Off
Trace
Local
Spectrum Analyzer
Trigger in (TTL signal input)
25
3
System and File
Visual and Audio Adjustment
Display Adjustment
Press [SYS] > {Brightness} to toggles the screen
brightness between Auto and Man. When it sets to
Auto, the brightness will adjust according to the
environment automatically with the built- in light
sensor. When it sets to Man, you can set a fixed
brightness value manually.
Setting Button Backlight
Press [SYS] > {KeyBackLight} > {BackLight} to toggles
the button backlight Auto and Man. You can select
the backlight brightness and the auto- off idle time
in manual mode.
Setting Key Beep
Press [SYS] > {Key Beep} to activate the key beep
function as an indicator of key operation.
General system settings
Provides the following system setting options:
Time/Date
Press [SYS] > {Setting} > {General} > {Time/Date} to set
the date and time of the analyzer.
You need to input the time in a HHMMSS format,
and the date in a YYYYMMDD format.
Power Manager
Press [SYS] > {Setting} > {General} > {Power manager} to
select a power saving mode from the followings.
You can choose the idle time limit as 5, 15, 30
minutes or 4 hours in all the three mode.
• Backlight
The analyzer turns off the backlight of the LCD
screen after a user- defined idle time. Press any
key to re- activate the backlight after the
backlight power- saving mode has been triggered.
26
N9340B User’s Guide
System and File
3
• LCD
The analyzer turns off the LCD display after a
user- defined idle time. Press any key to
re- activate the LCD display after the LCD
display power- saving mode has been triggered.
• All - Backlight & LCD
The analyzer turns off the both the LCD display
and the backlight after a user- defined idle time.
Press any key to re- activate the backlight and
LCD display after the backlight and LCD
power- saving mode has been triggered.
NO TE
Pressing [Preset] for more than 1 second will turn off the LCD
display for power saving. Press any key will turn on the display
immediately.
Switch Timer
Pressing [SYS] > {Switch Timer} > {Timer} sets the time
switch to power on/off the N9340B in a
user- defined time and date. This switch timer
function requires the power supply connected or
charged battery installed.
Press {Repeat Mode Everyday} to set the N9340B boot
up/off in the pre- saved time everyday. The
pre- saved date is invalid in this mode.
IP configuration
The N9340B supports LAN port connection for
data transfer. Press [SYS] > {Setting} > {IP Admin} >
{IP Address Static} to manually set the IP address,
gateway and subnet mask with the proper LAN
information, or just press [SYS] > {Setting} > {IP
Admin} > {IP Address DCHP} to get the IP address in
LAN dynamically according DCHP.
Press {Apply} to enable all the configurations you
set.
N9340B User’s Guide
27
3
System and File
Upgrading Firmware
Follow the steps below to update the N9340B
firmware:
1 Download the latest N9340B firmware from
http://www.agilent.com/find/n9340b_upgrades
2 Extract files to the root directory of a USB stick.
You will see a folder named “N9340DATA” with
file Bappupgrade.hy.
3 Insert the USB stick into the top panel USB
connector.
4 Press [SYS] > {More} > {Upgrade} > {Firmware} to
activate the updating procedure. Press Enter to
upgrade the firmware. The analyzer will perform
the update automatically.
5 Unplug the USB stick and restart the N9340B
when message “All modules have been upgraded,
please restart” is displayed.
6 Press [SYS] > {More} > {Show System} to find the
updated MCU firmware version.
NO TE
CAU
CAU
TI O- N
Please make sure your USB stick is in FAT16 or FAT32 format.
USB stick with self-startup partition or multi-partitions is not
support by N9340B.
In updating process, there must be a constant power
supply to for at least 15 minutes. If power fails during the
updating process it can cause damage to the instrument.
Ext Input
Toggles the channel for external input between Ref
and Trig. Ref refers to a 10 MHz reference signal; Trig
refers to a TTL signal.
28
N9340B User’s Guide
System and File
3
External Reference (Ref)
Use the external reference function as follows:
1 Input a 10 MHz signal to the EXT TRIG IN/REF IN
connector.
2 Press [SYS] > {Setting} > {Input/Output Ref} to enable
the external reference signal input.
The analyzer then turns off its internal reference.
External Trigger (Trig)
When an external TTL signal is used for triggering
function, the analyzer uses the inner reference as
default.
Use the external trigger function as follows:
1 Press [SYS] > {Setting} > {Input/Output Trig} to enable
the external TTL signal input.
2 Press [SPAN] > {Zero Span} to activate the Trigger
function.
3 Access the associated softkeys to select the
rising edge (Ext Rise) or the falling edge (Ext Fall)
as the trigger threshold.
NO TE
The trace will halt in external trigger mode till the trigger
threshold is met or the free run function is activated.
Adding an Option
Pressing [SYS] > {More} > {Option} > {Add Option} brings
up a dialog box for entering the option license
code. Use the numeric keypad to input the option
license code and then use the [ENTER] key as a
terminator. If the analyzer recognizes the option
license code, a message “Option activated
successfully” will appear in the status line.
Otherwise, a message “Invalid option licence” will
appear in the status line.
Press [SYS] > {More} > {Option} > {Show Option} to view
the installed options.
N9340B User’s Guide
29
3
System and File
Show System
Pressing [SYS] > {More} > {Show system} displays the
following hardware, software and battery
information of the analyzer:
Machine Model
Battery Info
MCU Firmware Version
Name
DSP Firmware Version
Serial NO.
FPGA Firmware Version
Capacity
RF Firmware Version
Temperature
RF Module S/N
Charge Cycles
KeyBoard Module S/N
Voltage
This Run Time
Current
Temperature
Charge Status
Source Voltage
Remain Time
Power Source
Host ID
Show Error
Pressing [SYS] > {More} > {Show Error} accesses a list
of the 30 most recent error messages. The most
recent error will appear at the bottom of the list. If
the error list is longer than 30 entries, the analyzer
reports an error message [–350, Query
overflow]. When in remote control, and the error
list is greater than 30 entries, the error display is
halted and a message at the bottom of the list
informs the user that error exceed 30.
For more information, refer to “Error Messages" on
page 139.
Perform a Time Base Calibration
The N9340B provides a manual calibration function
to calibrate the time base. The analyzer should
warm up for approximately 30 minutes before
calibration.
30
N9340B User’s Guide
System and File
3
When the calibration function is triggered, the
current measurement is interrupted and a gauge
displays on the LCD. The gauge simply indicates
calibration action rather than calibration course, as
the calibration time is unpredictable. When the
calibration is finished, the LCD displays a
calibration, and the interrupted measurement
restarts.
NO TE
Time base calibration takes during a short time only when the
inner temperature is stable. When the inner temperature is
increasing, calibration takes a long-time course or will fail. If
the input reference signal is abnormal, the calibration cycle
will take a long and unpredictable time to exit, and the LCD
displays an error message.
Please refer to the operation procedures as below:
1 Use a BNC cable to connect a 10 MHz reference
signal to the EXT TRIG IN connector.
2 press [SYS] > {More} > {Calibration} > {Time Base} to
initiate a calibration.
Low Frequency Channel
Press [SYS] > {More} > {More} > {LowFreqChannel} to
enable the low frequency channel function. When
this softkey is enabled, the trace in the low
frequency range will has a better DANL.
This softkey is only available in spectrum analysis
mode with option XDM or option IBC.
N9340B User’s Guide
31
3
System and File
File
Pressing [SYS] > {File} accesses to the menu that
allows you to manage the file saving and loading.
NO TE
A USB memory stick of FAT32 or FAT16 format and with only
one memory zone is primarily required when using USB
memory stick for file saving and loading.
Viewing file list
Refer to the following two steps to view file list:
1 Select the directory to view.
Press [SYS] > {File} > {View} to toggle the displayed
file list from local memory or an external USB
memory stick.
Select the file type you wish to view.
Press [SYS] > {File} > {File setup} > {File type} to select
a file type.
File Types
Each file type has a specific purpose as defined
below. Pressing [SYS] > {File} > {File Setup} > {File type}
allows the user to select a file type from one of the
following:
• Trace (*.DAT)
A trace file records trace data and controls.
• Screen (*.JPG)
A screen file records graphic information of the
current screen.
• State (*.STA)
A state file records the current controls and
settings of the analyzer. Use this file type for
saving test parameters for future recall, such as
Frequency, Amplitude and BW settings.
• Limit (*.LIM)
A limit file records the limit settings. You can
edit the limit file and transfer this file between
the N9340B and PC software.
32
N9340B User’s Guide
System and File
3
• CSV (*.CSV)
A CSV file records the trace data and available
for review on PC.
• Setup (*.SET)
A setup file records the system setting
information, such as language, date/time, and
power saving mode. This file type is not used for
test parameter setup information.
Save Path
Press [SYS] > {File} > {File Setup} > {Save Path} to
select a path from the local memory or external
USB memory device.
Saving a file
NO TE
When selecting a file type, you can edit a file name by
pressing the numeric and alphabetic hardkeys on the right
side of the analyzer’s front panel.
Refer to the following three steps to save a file:
1 Press [SYS] > {File} > {File Setup} to select the save
path and file type.
2 Edit a file name.
A file name can consist of letters and digits. A
single key stroke on the numerical keypad inputs
a digital number; and consecutive key stroke
selects and inputs a letter.
3 Press {Save} to save the file.
When a file saving completes, the message “File
Saved” displays on the bottom line of the screen.
NO TE
When the saving path to USB, files are automatically saved
into a folder named as N9340DATA in the root directory of the
USB memory stick.
If the USB memory stick connection can not be updated,
remove the USB memory stick, then cycle the power and
re-insert the USB memory stick.
N9340B User’s Guide
33
3
System and File
Saving Multiple Test Setups
Test Setups that are unique and are necessary to
recall frequently can be saved as an instrument
state file. Other file types are described on “File
Types" on page 32.
Quick Saving a Trace or a Screen
Press [0/Save] to quickly save a trace or a screen to
either the local memory or an external USB device,
depending upon the setup of the save path.
Refer to the steps for saving a trace/screen:
1 Press [SYS] > {File} > {File Setup} > {Shortcut Type} to
indicate the shortcut type to either a trace or a
screen copy.
2 Press [SYS] > {File} > {File Setup} > {Save Path} to
either local memory or an external USB device.
3 Press [Return], [Save] to save a trace or a screen
copy to the pre- defined memory. The trace or
screen will be automatically assigned with a
default file name. A trace will be assigned with a
file name, such as HYTRACE, HYTRACE_1, and
consecutive decimal numbers appended to the
alphabetic file name, such as HYSCREEN,
HYSCREEN_1 and consecutive decimal numbers
appended to the alphabetic file name.
NO TE
[SYS] > {Screen Save} is also available for screen save. When
this key is pressed, a pop-up window indicates you input a file
name for the screen you want to save.
Quick saving a setup
Press [SYS] > {More} >{More} > {SaveSYS Setup} to
quick save the current system settings. This does
not include the test parameters, such as,
Frequency, BW, and Amplitude settings.
34
N9340B User’s Guide
System and File
3
Quick loading a setup
• Load default
Press [SYS] > {More} > {More} > {LoadSYS Setup} >
{Load default} to recall the factory default setup.
• User Setup
Press [SYS] > {More} > {More} > {LoadSYS Setup} >
{User Setup} to recall a customized setup that has
been saved previously.
All the quick saving utility of system state is equal to the
saving utility under the [SYS] > {File}.
NO TE
Deleting a file
1 Press [SYS] > {File} > {View} to select a directory.
2 Press [SYS] > {File} > {File setup} > {File type} to
select a file type.
3 Rotate the knob to highlight a file.
4 Press {Delete} to delete a selected file. The file
will be deleted once user presses Yes to confirm
deleting.
CAU
CAU
TI O- N
BE
Once a file is deleted, it CANNOT be recovered. Carefully
decide whether to delete a file before proceeding.
Loading a file
1 Press [SYS] > {File} > {View} to select a directory.
2 Press {File Setup} > {File type} to select a file type.
3 Rotate the knob to highlight a file.
4 Press {Load Now} to recall the saved file.
NO TE
The screen file can not be loaded into the analyzer.
N9340B User’s Guide
35
3
36
System and File
N9340B User’s Guide
Agilent N9340B
Handheld Spectrum Analyzer
4
Making Measurements
!"
37
4
Making Measurements
Measuring Multiple Signals
This section provides information on measuring
multiple signals.
Comparing Signals on the Same Screen
The N9340B can easily compare frequency and
amplitude signal differences. For example,
measuring radio or television signal spectra. The
Delta Marker function allows two signals to be
compared when both appear on the screen at the
same time.
In this following example, a 50 MHz input signal is
used to measure frequency and amplitude
differences between two signals on the same
screen. The Delta Marker function is demonstrated
in this example.
1 Press [PRESET] to set the analyzer to a factory
default setting.
2 Input a signal (0 dB, 50 MHz) to the RF IN connector of the analyzer.
3 Set the analyzer start frequency, stop frequency
and reference level to view the 50 MHz signal
and its harmonics up to 100 MHz:
• Press [FREQ] > 40 > {MHz}
• Press [FREQ] > 110 > {MHz}
• Press [AMPTD] > 0 > {dBm}
4 Press [MARKER] > {Peak search} to place a marker
on the highest peak on the display (50 MHz).
The {Next Left PK} and {Next Right PK} softkeys are
available to move the marker from peak to peak.
5 Press [MARKER] > {Delta} to anchor the first
marker (labeled as M1) and activate a delta
marker.
The label on the first marker now reads 1R,
indicating that it is the reference point.
6 Move the second marker to another signal peak
using the front panel knob or by using the {Peak
38
N9340B User’s Guide
Making Measurements
4
Search} softkey. In this example the next peak is
100 MHz, a harmonic of the 50 MHz signal:
• Press [MARKER] > {Peak Search} > {Next Right PK} or
{Next Left PK}.
NO TE
To increase the resolution of the marker readings, turn on
the frequency count function. For more information, please
refer to “Improving Frequency Resolution and
Accuracy" on page 48.
Figure 4-2 Delta pair marker with signals (same screen)
N9340B User’s Guide
39
4
Making Measurements
Resolving Signals of Equal Amplitude
In this example a decrease in resolution bandwidth
is used in combination with a decrease in video
bandwidth to resolve two signals of equal
amplitude with a frequency separation of 100 kHz.
Notice that the final RBW selected is the same
width as the signal separation while the VBW is
slightly narrower than the RBW.
1 Connect two sources to the analyzer input as
shown below.
Figure 4-3 Setup for obtaining two signals
N 9310A
RF Sig nal Generator
FUN CTION S
9 kHz - 3.0 GHz
Frequency
AM
Amplit ude
I/Q
FM
Ent er
Remot e
M
7
8
9
4
5
6
1
2
3
0
·
U tility
Pr eset
Sw eep
File
Local
Pulse
Trig ger
LF Out
M OD
On/ Off
RF
On/ Off
Standby
On
LF OUT
RF OU T 50
REVERSE PW R
4W M AX 30VDC
Directional
coupler
Signal generator
N9310A
RF Signal G enerator
FUN CTIONS
9 kHz - 3.0 GHz
AM
Frequency
Am plitude
Rem ote
I/ Q
FM
M
Enter
7
8
9
4
5
6
1
2
3
0
·
Standby
On
Ut ility
Preset
Sw eep
File
Local
Pulse
Trigger
LF Out
M OD
O n/ Off
RF
On/ Off
LF OUT
RF OUT 50
REVERSE PWR
4 W MA X 30 VD C
Signal generator
2 Set one source to 300 MHz. Set the frequency of
the other source to 300.1 MHz. Set both source
amplitudes to –20 dBm.
3 Setup the analyzer to view the signals:
• Press [PRESET]
• Press [FREQ] > 300.05 > {MHz}
• Press [SPAN] > 2 > {MHz}
• Press [BW/SWP] > 30 > {kHz}
Use the knob or the arrow keys to further reduce
the resolution bandwidth and better resolve the
signals.
40
N9340B User’s Guide
Making Measurements
4
As you decrease the resolution bandwidth, you
improve the resolution of the individual signals and
it also increases the sweep timing. For fastest
measurement times, use the widest possible
resolution bandwidth.
Under factory preset conditions, the resolution
bandwidth is coupled to the span.
Figure 4-4 Resolving signals of equal amplitude
N9340B User’s Guide
41
4
Making Measurements
Resolving Small Signals
Hidden by Large Signals
This example uses narrow resolution bandwidths to
resolve two input signals with a frequency
separation of 50 kHz and an amplitude difference
of 60 dB.
1 Connect two sources to the analyzer input connector as shown in Figure 4- 3 on page 40.
2 Set one source to 300 MHz at –10 dBm. Set the
other source to 300.05 MHz at –70 dBm.
3 Set the analyzer as follows:
• Press [PRESET]
• Press [FREQ] > 300.05 > {MHz}
• Press [SPAN] > 500 > {kHz}
• Press [BW/SWP] > 300 > {Hz}
4 Reduce the resolution bandwidth filter to view
the smaller hidden signal. Place a delta marker
on the smaller signal:
• Press [MARKER] > {Peak Search}
• Press [MARKER] > {Delta}
• Press [MARKER] > {Peak Search} > {Next Right PK}
or {Next Left PK}
Figure 4-5 Resolving small signal hidden by a large signal
42
N9340B User’s Guide
Making Measurements
4
Measuring a Low-Level Signal
This section provides information on measuring
low- level signals and distinguishing them from
spectrum noise. There are four main useful
techniques as follows to measure a low- level signal.
Reducing Input Attenuation
The ability to measure a low- level signal is limited
by internally generated noise in the spectrum
analyzer.
The input attenuator affects the level of a signal
passing through the analyzer. If a signal is very
close to the noise floor, reducing input attenuation
will bring the signal out of the noise.
1 Preset the analyzer:
2 Input a signal (1 GHz, –80 dBm) to RF IN.
3 Set the CF, span and reference level:
• Press [FREQ] > 1 > {GHz}
• Press [SPAN] > 5 > {MHz}
• Press [AMPTD] > –40 > {dBm}
4 Move the desired peak (in this example, 1 GHz)
to the center of the display:
• Press [MARKER] > {Peak Search}
• Press [MARKER] > {Marker To} > {To Center}
Figure 4-6 A signal closer to the noise level (Atten: 10 dB)
N9340B User’s Guide
43
4
Making Measurements
5 Reduce the span to 1 MHz and if necessary
re- center the peak.
• Press [SPAN] > 1 > {MHz}
6 Set the attenuation to 20 dB. Note that increasing the attenuation moves the noise floor closer
to the signal level.
• Press [AMPTD] > {Attenuation} > 20 > {dB}
Figure 4-7 A signal closer to the noise level (Atten: 20 dB)
7 Press [AMPTD] >{Attenuation} > 0 > {dB} to set the
attenuation to 0 dB.
Figure 4-8 A signal closer to the noise level (Atten: 0 dB)
44
N9340B User’s Guide
Making Measurements
4
Decreasing the Resolution Bandwidth
Resolution bandwidth settings affect the level of
internal noise without affecting the amplitude level
of continuous wave (CW) signals. Decreasing the
RBW by a decade reduces the noise floor by 10 dB.
1 Refer to “Reducing Input Attenuation" on
page 43, and follow steps 1, 2 and 3.
2 Decrease the resolution bandwidth:
• Press [BW/SWP], and toggle RBW setting to
Man (manual), then decrease the resolution
bandwidth using the knob, the arrow keys or
the numeric keypad.
The low level signal appears more clearly because
the noise level is reduced.
Figure 4-9 Decreasing resolution bandwidth
N9340B User’s Guide
45
4
Making Measurements
Using the Average Detector and
Increased Sweep Time
The analyzer’s noise floor response may mask
low- level signals. Selecting the instruments
averaging detector and increasing the sweep time
will smooth the noise and improve the signal’s
visibility. Slower sweep times are necessary to
average noise variations.
1 Refer to “Reducing Input Attenuation" on
page 43, and follow steps 1, 2 and 3.
2 Press [TRACE] > {More} > {Detector} > {Average} to
select the average detector.
3 Press [BW/SWP] > {Sweep Time} to set the sweep
time to 500 ms.
Note how the noise appears to smooth out. The
analyzer has more time to average the values for
each of the displayed data points.
4 Press [BW/SWP] > {Avg Type} to change the average type.
Figure 4-10
46
Using the average detector
N9340B User’s Guide
Making Measurements
4
Trace Averaging
Averaging is a digital process in which each trace
point is averaged with the previous sweeps data
average for the same trace point.
Selecting averaging, when the analyzer is auto
coupled, changes the detection mode to sample,
smoothing the displayed noise level.
NO TE
This is a trace processing function and is not the same as
using the average detector (as described on page 46).
1 Refer to the first procedure “Reducing Input
Attenuation" on page 43, and follow steps 1, 2
and 3.
2 Press [TRACE] > {Average} (On) to turn average on.
3 Press 50 > [ENTER] to set the average number to
50.
As the averaging routine smoothes the trace, low
level signals become more visible.
Figure 4-11
N9340B User’s Guide
Trace averaging
47
4
Making Measurements
Improving Frequency Resolution and Accuracy
Using the frequency counter to improve frequency
resolution and accuracy.
NO TE
Marker count properly functions only on CW signals or
discrete spectral components. The marker must be > 40 dB
above the displayed noise level.
1 Press [PRESET] (Factory Preset)
2 Input a signal (1 GHz, –30 dBm) to the analyzer’s RF IN connector.
3 Set the center frequency to 1 GHz and the span
to 5 MHz.
4 Press [MARKER] > {More} > {Mode} > {Freq Count} to
turn the frequency counter on.
5 Move the marker by rotating the knob, to a point
half- way down the skirt of the signal response.
6 Press [MARKER] > {More} > {Mode} > {Normal} to
turn off the marker counter.
Figure 4-12 Using the frequency counter
48
N9340B User’s Guide
Making Measurements
4
Making Distortion Measurements
This section provides information on measuring
and identifying signal distortion.
Identifying Analyzer Generated Distortion
High level input signals may cause analyzer
distortion products that could mask the real
distortion present on the measured signal. Use
trace and the RF attenuator to determine which
signals, if any, may be internally generated
distortion products.
In this example, a signal from a signal generator is
used to determine whether the harmonic distortion
products are generated by the analyzer.
1 Input a signal (200 MHz, –10 dBm) to the analyzer RF IN connector.
2 Set the analyzer center frequency and span:
• Press [PRESET] (factory preset)
• Press [FREQ] > 400 > {MHz}
• Press [SPAN] > 700 > {MHz}
The signal produces harmonic distortion products
(spaced 200 MHz from the original 200 MHz signal)
Figure 4-13 Harmonic distortion
N9340B User’s Guide
49
4
Making Measurements
3 Change the center frequency to the value of the
second (400 MHz) harmonic:
• Press [MARKER] > {Peak Search}
• Press [MARKER] > {Marker To} > {To Center}
4 Change the span to 50 MHz and re- center the
signal:
• Press [SPAN] > 50 > {MHz}
• Press [MARKER] > {Peak Search}
5 Set the attenuation to 0 dB:
• Press [AMPTD] > {Attenuation} > 0 > {dB}
• Press [MARKER] > {Marker To} > {To Ref}
6 To determine whether the harmonic distortion
products are generated by the analyzer, first save
the trace data in trace 2 as follows:
• Press [TRACE] > {Trace (2)}
• Press [TRACE] > {Clear Write}
7 Allow trace 2 to update (minimum two sweeps),
then store the data from trace 2 and place a
delta marker on the harmonic of trace 2:
• Press [TRACE] > {View}
• Press [MARKER] > {Peak Search}
• Press [MARKER] > {Delta}
The Figure 4- 14 shows the stored data in trace 2
and the measured data in trace 1. The Marker
Delta indicator reads the difference in amplitude
between the reference and active trace markers.
50
N9340B User’s Guide
Making Measurements
4
Figure 4-14 Identifying Analyzer Distortion (O dB atten)
8 Press [AMPTD] > {Attenuation} > 10 > {dB} to
increase the RF attenuation to 10 dB.
Figure 4-15 Identifying Analyzer Distortion (10 dB atten)
The marker readout comes from two sources:
• Increased input attenuation causes poorer
signal- to- noise ratio. This causes the marker
delta value to be positive.
• Reduced contribution of the analyzer circuits
to the harmonic measurement causes the
marker to be negative.
A large marker delta value readout indicates
significant measurement errors. Set the input
attenuator at a level to minimize the absolute value
of marker delta.
N9340B User’s Guide
51
4
Making Measurements
Third-Order Intermodulation Distortion
Two- tone, third- order intermodulation (TOI)
distortion is a common test in communication
systems. When two signals are present in a
non- linear system, they may interact and create
third- order intermodulation distortion products
that are located close to the original signals.
System components such as amplifiers and mixers
generate these distortion products.
In this example we test a device for third- order
intermodulation using markers. Two sources are
used, one set to 300 MHz and the other to 301
MHz.
1 Connect the equipment as shown in figure below.
N9310A
RF S ignal Generator
FUNCTIONS
9 kHz - 3.0 GHz
Frequency
AM
Amplitude
7
Remote
I/ Q
FM
Enter
M
8
9
4
5
6
1
2
3
0
·
Utility
Preset
Sw eep
File
Local
Pulse
Trigger
LF Out
MOD
On/ Off
RF
On/ Off
LF OUT
Standby
On
RF OUT 50
REVERSE PW R
4W MAX 30 VDC
Signal generator
N9310A
RF Signal Generator
FUNCTIONS
9 kHz - 3.0 GHz
Frequency
AM
Amplitude
Standby
On
I/ Q
FM
Ente r
Remote
Directional
coupler
M
7
8
9
4
5
6
1
2
3
0
·
Utility
Prese t
Sw eep
File
Local
Pulse
Trigger
LF Out
MOD
On/ Off
RF
On/ Off
LF OUT
RF OUT 50
REVERSE PW R
4W MA X 30VDC
Signal generator
This combination of signal generators and
directional coupler (used as a combiner) results in
a two- tone source with very low intermodulation
distortion.
Although the distortion from this setup may be
better than the specified performance of the
analyzer, it is useful for determining the TOI
performance of the source/analyzer combination.
52
N9340B User’s Guide
Making Measurements
4
After the performance of the source/analyzer
combination has been verified, the DUT (device
under test, for example, an amplifier) would be
inserted between the directional coupler output
and the analyzer input.
NO TE
The coupler used should have a high isolation between
the two input ports to limit the sources intermodulation.
2 Set one source (signal generator) to 300 MHz
and the other source to 301 MHz. This will
define the frequency separation at 1 MHz. Set
both sources equal in amplitude, as measured by
the analyzer. In this example, they are both set
to –5 dBm.
3 Set the analyzer center frequency and span:
• Press [PRESET] (Factory preset)
• Press [FREQ] > 300.5 > {MHz}
• Press [SPAN] > 5 > {MHz}
4 Reduce the RBW until the distortion products
are visible:
• Press [BW/SWP] > {RBW}, and reduce the RBW
using the knob, the arrow keys or the numeric
keypad.
5 Move the signal to the reference level:
• Press [MARKER] > {Peak Search}
• Press [MARKER] > {Marker To} > {To Ref}
6 Reduce the RBW until the distortion products
are visible:
• Press [BW/SWP] > {RBW}, and reduce the RBW
using the knob, the arrow keys or the numeric
keypad.
7 Activate the second marker and place it on the
peak of the distortion product (beside the test
signal) using the Next Peak:
• Press [MARKER] > {Delta}
N9340B User’s Guide
53
4
Making Measurements
• Press [MARKER] > {Peak Search} > {Next Left
(Right) PK}
8 Measure the other distortion product:
• Press [MARKER] > {Normal}
• Press [MARKER] > {Peak Search} > {Next Left
(Right) Peak}
9 Measure the difference between this test signal
and the second distortion product.
• Press [MARKER] > {Normal}
• Press [MARKER] > {Peak Search} > {Next Left/Right
Peak}
Figure 4-16 TOI test screen
54
N9340B User’s Guide
Making Measurements
4
Making a Stimulus Response Transmission
Measurement
The procedure below describes how to use a
built- in tracking generator to measure the rejection
of a low pass filter, a type of transmission
measurement.
1 To measure the rejection of a low pass filter,
connect the equipment as shown below.
A 370 MHz low- pass filter is used as a DUT in
this example.
Figure 4-17 Transmission Measurement Test Setup
DUT
N9340A
100 kH z - 3.0 GHz
HANDHELD SPECTRUM ANALYZER
1 ABC
2 D EF
4 JKL
7 STU
M ARKER
3 GHI
5M N O
6 PQR
8 VWX
9 YZ_
0 SAVE
LIM IT
ESC/ CLR
PRESET
ENTER
SYS
MO DE
M EAS
TRACE
BW/
SWP
AMPTD
SPAN
FREQ
2 Press [Preset] to perform a factory preset.
3 Set the start and stop frequencies and resolution
bandwidth:
• Press [FREQ] > {Start Freq} > 100 > {MHz}
• Press [FREQ] > {Stop Freq} > 1 > {GHz}
• Press [BW/SWP] > {RBW} > 1 > {MHz}
4 Turn on the tracking generator and if necessary,
set the output power to –10 dBm:
Press [MODE] > {Track Generator} > {Amplitude (On)} >
–10 > {dBm}.
CAU
CAU
TI O- N
Excessive signal input may damage the DUT. Do not
exceed the maximum power that the device under test can
tolerate.
N9340B User’s Guide
55
4
Making Measurements
5 Press [BW/SWP] > {Sweep Time (Auto)} to put the
sweep time into stimulus response auto coupled
mode.
6 Increase measurement sensitivity and smooth the
noise:
Press [BW/SWP] > {RBW} > 30 > {kHz}
Press [BW/SWP] > {VBW} > 30 > {kHz}
A decrease in the displayed amplitude is caused
by tracking error.
7 Connect the cable from the tracking generator
output to the analyzer input. Store the frequency
response in trace 4 and normalize:
Press [MEAS] > {Normalize} > {Store Ref} (1 → 4) >
{Normalize (On)}
8 Reconnect the DUT to the analyzer and change
the normalized reference position:
Press [MEAS] > {Normalize} > {Norm Ref Posn} > 8 >
[ENTER]
9 Measure the rejection of the low- pass filter:
Press [Marker] > {Normal} > 370 > MHz, {Delta} > 130
> {MHz}
The marker readout displays the rejection of the
filter at 130 MHz above the cutoff frequency of
the low- pass filter.
Figure 4-18 Measure the Rejection Range
56
N9340B User’s Guide
Making Measurements
4
Measuring Stop Band Attenuation of a
Low-pass Filter
When measuring filter characteristics, it is useful
to look at the stimulus response over a wide
frequency range. Setting the analyzer x- axis
(frequency) to display logarithmically provides this
function. The following example uses the tracking
generator to measure the stop band attenuation of
a 370 MHz low pass filter.
1 Connect the DUT as shown in Figure 4- 17 on
page 55. This example uses a 370 MHz low pass
filter.
2 Press [Preset] to perform a factory preset.
3 Set the start and stop frequencies:
• Press [FREQ] > {Start Freq} > 100 > {MHz}
• Press [FREQ] > {Stop Freq} > 1 > {GHz}
• Press [AMPTD] > {Scale Type} > {Log}
4 Press [BW/SWP] > 10 > {kHz} to set the resolution
bandwidth to 10 kHz.
CAU
CAU
TI O- N
Excessive signal input may damage the DUT. Do not exceed
the maximum power that the device under test can
tolerate.
5 Turn on the tracking generator and if necessary,
set the output power to - 10 dBm:
Press [MODE] > {Track Generator} > {Amplitude (On)} >
–10 > {dBm}.
6 Press [BW/SWP] > {Sweep Time (Auto)} to put the
sweep time into stimulus response auto coupled
mode. Adjust the reference level if necessary to
place the signal on screen.
7 Connect the cable (but not the DUT) from the
tracking generator output to the analyzer input.
Store the frequency response into trace 4 and
normalize:
Press [MEAS] > {Normalize} > {Store Ref} (1 → 4) >
{Normalize (On)}
N9340B User’s Guide
57
4
Making Measurements
8 Reconnect the DUT to the analyzer. Note that the
units of the reference level have changed to dB,
indicating that this is now a relative measurement.
9 To change the normalized reference position:
Press [MEAS] > {Normalize} > {Norm Ref Posn} > 8 >
[ENTER]
10Place the reference marker at the specified cutoff frequency:
Press [MARKER] > {Normal} > 370 > MHz
11 Set the 2nd marker as a delta frequency of 37
MHz:
Press {Delta} > 37 > MHz
12In this example, the attenuation over this
frequency range is 19.16 dB/octave (one octave
above the cutoff frequency).
13Use the front- panel knob to place the marker at
the highest peak in the stop band to determine
the minimum stop band attenuation. In this
example, the peak occurs at 600 MHz. The attenuation is 51.94 dB.
Figure 4-19Minimum Stop Band Attenuation
58
N9340B User’s Guide
Making Measurements
4
Making a Reflection Calibration Measurement
The following procedure makes a reflection
measurement using a coupler or directional bridge
to measure the return loss of a filter. This example
uses a 370 MHz low- pass filter as the DUT.
The calibration standard for reflection
measurements is usually a short circuit connected
at the reference plane (the point at which the DUT
is connected). A short circuit has a reflection
coefficient of 1 (0 dB return loss). It reflects all
incident power and provides a convenient 0 dB
reference.
1 Connect the DUT to the directional bridge or
coupler as shown below. Terminate the
unconnected port of the DUT.
Figure 4-20 Reflection Measurement Short Calibration Test Setup
Short
Circuit
or
DUT
Coupled Port
N9340A
100 kH z - 3.0 G Hz
HANDHELD SPECTRUM ANALYZER
1 ABC
2 DEF
4 JKL
7 STU
M ARKER
3 GHI
5 M NO
6 PQ R
8 V WX
9 Y Z_
0 SAV E
LIM IT
ESC/ CLR
PRESET
EN TER
SYS
NO TE
M ODE
M EAS
TRACE
BW/
SWP
AM PTD
SPAN
FREQ
If possible, use a coupler or bridge with the correct test
port connector types for both calibrating and measuring.
Adapters between the test port and DUT degrades
coupler/bridge directivity and system source match.
For best response, use the same adapter for the
calibration and the measurement. Terminate the second
port of a two port device.
N9340B User’s Guide
59
4
Making Measurements
2 Connect the tracking generator output of the
analyzer to the directional bridge or coupler.
3 Connect the analyzer input to the coupled port
of the directional bridge or coupler.
4 Press [Preset] to perform a factory preset.
5 Turn on the tracking generator and if necessary,
set the output power to –10 dBm:
Press [MODE] > {Track Generator} > {Amplitude (On)} >
–10 > {dBm}
CAU
CAU
TI O- N
Excessive signal input may damage the DUT. Do not
exceed the maximum power that the device under test can
tolerate.
6 Set the start and stop frequencies and resolution
bandwidth:
• Press [FREQ] > {Start Freq} > 100 > {MHz}
• Press [FREQ] > {Stop Freq} > 1 > {GHz}
• Press [BW/Avg] > 1 > MHz
7 Replace the DUT with a short circuit.
8 Normalize the trace:
Press [MEAS] > {Normalize} > {Store Ref (1 → 4)} >
{Normalize (On)}
This activates the trace 1 minus trace 4 function
and displays the results in trace 1.
The normalized trace or flat line represents 0
dB return loss. Normalization occurs with each
sweep. Replace the short (cal device) with the
DUT.
NO TE
60
Since the reference trace is stored in trace 4, changing
trace 4 to Clear Write invalidates the normalization.
N9340B User’s Guide
Making Measurements
4
Figure 4-21 Short Circuit Normalized
N9340B User’s Guide
61
4
Making Measurements
Measuring Return Loss Using the Reflection
Calibration Routine
This procedure uses the reflection calibration
routine in the previous procedure “Making a
Reflection Calibration Measurement" on page 59, to
calculate the return loss of the 370 MHz low- pass
filter.
1 After calibrating the system with the above
procedure, reconnect the filter in place of the
short (cal device) without changing any analyzer
settings.
2 Use the marker to read return loss. Position the
marker with the front- panel knob to read the
return loss at that frequency.
Rotate the knob to find the highest peak and
the readout is the maximum return loss.
Figure 4-22 Measuring the Return Loss of the Filter
62
N9340B User’s Guide
Making Measurements
4
Making an Average Power Measurement
Average power measurements provide a key metric
in transmitter performance.
Base station transmit power must be set accurately
to achieve optimal coverage in wireless networks. If
the transmit power is set too high due to
inaccurate power measurements, undesired
interference can occur. If the transmit power is set
too low, coverage gaps or holes may occur. Either
case may affect system capacity and may translate
into decreased revenue for service providers.
Average power can be measured for the channel of
interest while the base station is active. All other
channels should be inactive. Average power is a
broadband measurement. If other signals are
present the analyzer will also measure their power
contributions.
CAU
CAU
TI O- N
The maximum power for the RF IN port and the RF OUT
port of the analyzer is +20 dBm. The maximum power for
the Power Sensor port is +24 dBm. When directly coupled
to a base station, the test set can be damaged by excessive power applied to any of these three ports.
To prevent damage in most situations when directly
coupling an analyzer to a base station, use a high power
attenuator between the analyzer and the BTS.
The analyzer supports the U2000 Series USB power
sensors.
The U2000 Series USB power sensors do not need
manual calibration and zero routines performed.
Calibration and zeroing are performed without
removing the power sensor from the source,
through internal zeroing. With internal zeroing of
U2000 Series USB power sensors, there is no need
to disconnect the sensor or power-off the DUT.
The U2000 Series do not require 50 MHz reference
signal calibration, allowing the factory calibration
to ensure measurement accuracy. For best
accuracy, users are recommended to perform
N9340B User’s Guide
63
4
Making Measurements
external zeroing for input signals below -30 dBm
for best accuracy.
NO TE
NO TE
If you suspect other signals may be present, it is
recommended that you turn off all the other channels and
measure average power only on the signal of interest.
Another option is to measure channel power (which is
less accurate), that filters out all other channels (signals).
You can measure channel power for CDMA using the
CDMA Analyzer or CDMA Over Air tool. For other
modulation formats, use their respective analyzers (that is,
GSM, 1xEV-DO, or W-CDMA) or measure channel power
using either the spectrum analyzer or the Channel Scanner
tool.
Connect the power meter as close as possible to the
power amplifier/duplexer output. Do not use a coupled
port. Sensors may not be as accurate at the power levels
provided by coupled ports.
Making a Basic Average Power Measurement
To make an average power measurement, connect
the power sensor and cable, zero and calibrate the
meter, before making a measurement.
Zeroing of the Power Meter will occur
automatically:
• Every time the Power Meter function is used.
• When a 5 degree C. change in instrument
temperature occurs.
• Whenever the power sensor is changed.
• Every 24 hours (min.).
• Before measuring low level signals -for example,
10 dB above the lowest specified power the
power sensor is capable of.
Calibrating the Power Meter every time you cycle
the power on and off.
In most situations, you can press {Zero} to complete
the two steps (zero and cal) together.
64
N9340B User’s Guide
Making Measurements
4
To Make a Basic Average Power Measurement
You can follow the steps below to make a basic
average power measurement.
1 Press [Preset] to perform a factory preset.
2 Press [MODE] > {Power Meter} > [ENTER] to turn on
the power meter.
3 Zero and calibrate the meter. Press {Zeroing} to
make a Zero operation of the power sensor
followed by a calibration operation.
4 Connect the power sensor to the power Ref 50
MHz port. The analyzer supports the U2000
Series power sensors.
5 Connect the external attenuation, if required,
with the power sensor used.
6 Connect the analyzer to the base station.
Connect the power sensor to the signal to be
measured. A typical BTS connection is after the
output of the power amplifier and duplexer. The
connection requires a 2 ft. cable and two Type- N
barrel connectors, in addition to the power
sensor and external attenuator.
Figure 4-23 Connection with base station
N9340B User’s Guide
65
4
Making Measurements
Setting Power Meter Resolution
You can choose from four levels of Power Meter
resolution. Higher resolutions provide more
accuracy but slow the measurement speed.
1 Press [Preset] to perform a factory preset.
2 Press [MODE] > {Power Meter} > [ENTER] to turn on
the power meter.
3 Press {Meas Disp} > {Resolution}. Select 1,2,3 or 4.
The four options represent different resolution as
follow:
• [1] = 1
• [2] = 0.1
• [3] = 0.01
• [4] = 0.001
Setting the Power Meter’s Top and Bottom End-Points
Setting the end points (Disk Range) close to
expected measurement value changes the
sensitivity of the Power Meter scale resolution. This
is an advantage in viewing small changes in power.
However, this will not affect the overall range of
the sensor.
1 Press [Preset] to perform a factory preset.
2 Press [MODE] > {Power Meter} > [ENTER] to turn on
the power meter.
3 Press {Meas Disp} > {Disp Range} to access the
end- points menu.
4 Press {Top} and enter the maximum scale value
desired using the numeric keypad. Then press
{dBm} to complete the setup.
5 Press {Bottom} and enter the minimum scale value
desired using the numeric keypad. Then press
{dBm} to complete the setup.
66
N9340B User’s Guide
Making Measurements
4
Setting the Power Meter’s Upper and Lower Limits
The internal Power Meter can be configured to
detect when a measurement has failed a user
predefined upper and lower limits.
1 Press [Preset] to perform a factory preset.
2 Press [MODE] > {Power Meter} > [ENTER] to turn on
the power meter.
3 Press {Meas Setup} > {Limits} to access the limits
menu.
4 Press {Limits} to activate the limits function. Each
time the softkey is pressed, the selected option
changes.
5 Press {Upper Limits} and enter the high limit value
using the numeric keypad. Then press {dBm} to
complete the setup.
6 Press {Lower Limits} and enter the low limit value
using the numeric keypad. Then press {dBm} to
complete the setup.
N9340B User’s Guide
67
4
Making Measurements
Spectrogram
The scrolling three- dimensional display is noted for
its ability to track the frequency and power
behavior over the time, particularly intermittent
signals. The user can use spectrogram to analyze
the stability of a signal over the time, or to identify
intermittent interference signals in communications
systems.
The X- axis represents frequency, and amplitude is
represented by color, red for a strong signal and
blue for noise floor. The Y- axis represents time,
with the trace from the newest sweep displayed at
the bottom of the screen. Earlier traces move up
toward the top with each new sweep. Two coupled
markers allow the user to place a marker on any
trace in the spectrogram and view the normal
spectrum for the time of that sweep. The time
interval between sweeps can be adjusted, and up to
1500 traces can be displayed and saved.
Figure 4-24 Spectrogram submenu screenshot
Please refer to the procedures below to perform a
Spectrogram measurement.
1 Connect the Omni Antenna to RF IN connector.
2 Set the center frequency and span.
68
N9340B User’s Guide
Making Measurements
4
Press [FREQ], {Center Freq}, [1.8052], {GHz}, [SPAN], [5],
{MHz}.
3 Turn on the Spectrogram function.
Press [MEAS], {More 1 of 2}, {Spectrogram}.
4 Set the update interval time between two frames.
Press {Update Int. On}, rotating the knob or pressing
numeric keypads to set the update interval time.
5 Turn on Marker 1 and Marker 2.
Press [MARKER], {State On}, {Marker (2)}, {State On}.
6 Press {Frequency}, rotate knob to change the
frequency of marker as you want.
7 Press [Meas], {Spectrogram}, {Save&Load}, {Save RAM}
to save spectrogram data.
The spectrogram has been saved into a
spectrogram data file for your further use. It’s
convenient for you to load the saved file as below:
Press {Save&Load}, {Load Spctrg}, Rotating the knob
to highlight the file which will be recalled, Press
{Load Now}, the spectrogram will be loaded.
Spectrogram Monitoring with Option INM
Option INM extends the N9340B spectrogram
capability further with the ability to continuously
monitor and save spectrogram data over time not
only to the analyzer’s internal memory or a USB
stick, but also directly to a PC. With option INM
users can save more than 1,500 continuous frames
of data depending on the size of the USB stick or
PC memory.
NO TE
When in spectrogram auto save process, the
measurement will be paused up to more than 10 seconds.
Limit lines with pass/fail functionality is available
in this measurement. The N9340B will identify the
failed frame of spectrogram data with a red mark.
It allows you to use marker to find the
previous/next frame failed data to quickly find the
N9340B User’s Guide
69
4
Making Measurements
offending event or interference. The spectrogram
data may be played back for review on either the
analyzer’s display or on a PC utilizing N9340B PC
Software
NO TE
NO TE
For the spectrogram, the marker operation is only within
200 frames displayed on screen. And on PC software, the
marker operation is available in whole spectrogram file.
The max update rate of spectrogram monitoring function in
N9340B PC software is slower than N9340B. If display mode
is set to “Spectrg&Trace”, the max update rate is 1.5
updates/second. If display mode is set to “trace”, the update
rate is increased to 2 updates/second.
Spectrogram Audio Alert
The spectrogram provides the sound audio alert
with the deferent frequency by the different control
parameters. This alert needs two markers to
specify the measure channel. The Band Power of the
channel specified by two markers is measured
without the audio alert. The Alert Limit is set to
specify the lowest band power that makes the
buzzer beep.
Please refer to the procedures below to turn on the
audio alert.
1 Press [Meas] > {Spectrogram} to access into the
spectrogram mode.
2 Press [Marker] > {More} > {Audio Alert} to enable
the audio alert.
70
N9340B User’s Guide
Making Measurements
4
Demodulating an FM Signal
This section demonstrates how to demodulate and
listen to an FM signal using the built- in FM
demodulator.
Using the built in FM demodulator you can tune to
an FM signal and view the results of the detector
output as displayed in the time- domain.
Alternatively, the demodulated signal is also
available as an audio output (to the speaker or
headphone jack).
1 Perform a factory preset:
Press [Preset] (Factory Preset, if present).
2 Use a signal source or an antenna for an FM
signal to analyze. In this example the signal
source is used transmitting at 300 MHz with FM
deviation of 10 kHz and FM rate of 1 kHz.
NO TE
If you are using a broadcast FM signal in the United States,
for example, the FM channels are broadcasting between
87.7 MHz to 107.7 MHz. The optional preamplifier is essential
for the broadcast FM signal demodulation.
3 Set the center frequency to the center of the FM
signal (in this case 300 MHz):
Press [FREQ] > 300 > {MHz}.
4 Set the analyzer to zero span for time- domain
analysis:
Press [SPAN] > {Zero Span}.
Press [BW/SWP] > {Sweep Time} > 4 > {ms}.
5 Turn off the input attenuation and turn on the
optional pre- amplifier:
Press [AMPTD] > {Attenuation} > 0 > {dB}.
Press {Preamp On}
N9340B User’s Guide
71
4
Making Measurements
6 Set the resolution bandwidth to capture the full
bandwidth of the FM signal. To calculate the
required bandwidth use
RBW =((2 x Frequency Deviation)+(2 x Modulation
Rate))
In our case the RBW should be: (2 x 10 kHz) +
(2 x 1 kHz) = 22 kHz With 1- 3- 10 sequence
RBW selections, choose the next highest RBW of
30 kHz:
Press [BW/SWP] > 30 > {kHz}.
7 Turn on the FM demodulator:
Press [SPAN] > {Demod} > {FM ON}.
Listen to the FM audio signal.
Press [SPAN] > {Demod} > {Speaker Vol}, rotate the
knob.
Alternatively you can also use the headphone
jack.
72
N9340B User’s Guide
Making Measurements
4
Analysis the Demodulated Signals
The N9340B provides the optional AM/FM (Option
AMA) and ASK/FSK (Option- DMA) demodulation
analysis function for analysis the demodulated
signals. These functions can be activated by license
key.
AM/FM Demodulation Analysis
Optional AM/FM demodulation analysis provides
modulation metrics, including carrier power,
modulation rate, AM depth/FM deviation, SINAD
and carrier frequency offset. User definable limits
provide Pass/Fail indicators of four types:
Maximum carrier power, Maximum AM modulation
index or FM deviation, Minimum AM modulation
index or FM deviation, and Minimum carrier
frequency offset.
The user can save the waveforms with metrics for
reporting as well as the set- up parameters for
future measurements or analysis. In the following
example, you can use any source available (such as
AM/FM radio) as long as it has AM/FM signal
generation capability.
AM Demodulation Analysis
Please refer to the procedures below for the AM
demodulation analysis:
1 Connect the signal generator to RF IN connector
and turn on the signal generator’s AM and RF
output.
2 Turn on the AM demodulation analysis function.
Press [MODE], Rotating the knob to highlight
Demodulation Analysis, [ENTER], {AM}.
3 Press {Carries Freq} > [100] > {MHz} to set the
carrier frequency.
N9340B User’s Guide
73
4
Making Measurements
4 Set the attenuation state to Auto (default):
Press {More 1 of 3} > {More 2 of 3} > {Attenuation Auto}
> {More 3 of 3}
5 Press {Y Scale} > {Auto Scale} > {Return} to set the Y
scale.
6 Set the AM depth limit and turn on the limit
function:
Press {More 1 of 3} > {Limits} > {AM Depth UP} > [51]
> {%} > {AM Depth Low} > [49] > {%} > {Limits on}
The red value in the result indicates the
demodulated AM depth exceeds the limits set as
above.
Figure 4-25 AM demodulation analysis
FM Demodulation Analysis
Please refer to the procedures below for the FM
demodulation analysis:
1 Connect the signal generator to RF IN connector
and turn on the signal generator’s FM and RF
output.
2 Turn on the FM demodulation analysis function.
Press [MODE], Rotating the knob to highlight
Demodulation Analysis, [ENTER], {FM}.
74
N9340B User’s Guide
Making Measurements
4
3 Press {Carries Freq} > [100] > {MHz} to set the
carrier frequency.
4 Set the attenuation state to Auto (default):
Press {More 1 of 3} > {More 2 of 3} > {Attenuation Auto}
> {More 3 of 3}
5 Press {Y Scale} > {Auto Scale} > {Return} to set the Y
scale.
6 Set the FM deviation limit and turn on the limit
function:
Press {More 1 of 3} > {Limits} > {FreqDev UP} > [11] >
{%} > {FreqDev Low} > [9.9] > {%} > {Limits on} >
{Return}
The red value in the result indicates the demodulated fM deviation exceeds the limits set as
above.
Figure 4-26 FM demodulation analysis
N9340B User’s Guide
75
4
Making Measurements
ASK/FSK Demodulation Analysis
The ASK/FSK demodulation analysis function
supports four display modes:
• Symbol
• Waveform
• ASK/FSK Error
• Eye Diagram.
User definable limits provide Pass/Fail indicators
of four types:
• Maximum carrier power
• Maximum ASK modulation depth/FSK frequency
deviation
• Minimum ASK modulation depth/FSK frequency
deviation
• Maximum carrier frequency offset.
The metrics includes carrier power, ASK/FSK error,
ASK depth/FSK frequency deviation, and ASK
index etc. The waveform with metrics and setup
parameters can be saved for reports and future
Measurements.
In the following example, you can use any source
available (such as your remote key of the car) as
long as it has ASK/FSK generation capability. For
ASK/FSK signal, its Filter is Nyquist and Alpha is
0.35.
ASK Demodulation Analysis
Please refer to the procedures below to analysis
the ASK demodulation.
1 Connect the signal generator to RF IN connector
and turn on the signal generator’s ASK and RF
output.
2 Turn on the ASK demodulation analysis function.
Press [MODE], Rotating the knob to highlight
Demodulation Analysis, [ENTER], {ASK}.
76
N9340B User’s Guide
Making Measurements
4
3 Press {Carries Freq} > [100] > {MHz} to set the
carrier frequency.
4 Press {Symbol Rate} > [10] > {MHz} to set the
symbol rate.
5 Press {Filter Setup} > {Ref Filter} > {Nyquist} > {Return}
to set the filter type.
6 Set the attenuation state to Auto (default):
Press {More 1 of 3} > {More 2 of 3} > {Attenuation Auto}
> {More 3 of 3}
7 Press {Y Scale} > {Auto Scale} > {Return} to set the Y
scale.
8 Setting the ASK depth limit and turn on the
limit function:
Press {More 1 of 3} > {Limits} > {ASK Depth UP} > [71]
> {%} > {ASK Depth Low} > [70] > {%} > {Limits on} >
{Return}
9 Press {More} > {More} > {View} > {Eye Diagram} to
view the eye diagram.
The figure below indicates the ASK EYE Diagram
as a measurement result.
Figure 4-27 ASK Eye Diagram
N9340B User’s Guide
77
4
Making Measurements
FSK Demodulation Analysis
Please refer to the procedures below to analysis
the ASK demodulation.
1 Connect the signal generator to RF IN connector
and turn on the signal generator’s FSK and RF
output.
2 Turn on the ASK demodulation analysis function.
Press [MODE], Rotating the knob to highlight
Demodulation Analysis, [ENTER], {FSK}.
3 Press {Carries Freq} > [100] > {MHz} to set the
carrier frequency.
4 Press {Symbol Rate} > [10] > {ksps} to set the
symbol rate.
5 Press {Filter Setup} > {Ref Filter} > {Nyquist} > {Return}
to set the filter type.
6 Set the attenuation state to Auto (default):
Press {More} > {More} > {Attenuation Auto} > {More}
7 Press {Y Scale} > {Auto Scale} > {Return} to set the Y
scale.
8 Setting the FSK deviation limit and turn on the
limit function:
Press {More 1 of 3} > {Limits} > {FreqDev UP} > [41] >
{kHz} > {FreqDev Low} > [39] > {kHz} > {Limits on}
Figure 4-28 FSK Demodulation
78
N9340B User’s Guide
Making Measurements
4
Monitoring the ADSL Signal with Option XDM
xDSL (ADSL and VDSL) is widely used for
broadband internet connections at homes and
businesses. Service providers occasionally face
problems with interference on their xDSL lines.
The interference is mainly intermittent intrusion
from nearby external sources such as electric
motors, elevators, and appliances. In order to
monitor, capture and remove intermittent
interference, the engineer may need to work in the
field for extended periods of time.
The xDSL Measurement mode(Option XDM)
provides the capability to measure the ADSL,
ADSL2+ and VDSL network with a frequency range
of 3 kHz to 40 MHz.
NO TE
NO TE
An xDSL probe from Vierling is required to connect the
N9340B analyzer to xDSL networks in the field.
The option XDM is not available as an upgrade and must be
ordered at the time of instrument purchase. The option XDM
can be used for other applications which require improved
DANL and phase noise at frequencies from 9 kHz to 3 GHz.
Figure 4-29 xDSL Measurement
N9340B User’s Guide
79
4
Making Measurements
Please refer to the procedures below for monitoring
the ADSL network.
1 Press [SYS] > {Setting} > {PwrOn/Preset} > {Power On
Last}, {Preset Last}
2 Press [SYS] > {More} > {More} > {LowFreqChannel On}
to enable the low frequency channel.
3 Press [AMPTD] > {More} > {Grid Scale On}
4 Connect the N9340B and ADSL network with a
probe.
5 Insert a USB stick into N9340B
6 Set the start frequency as 3 kHz and stop
frequency as 2 MHz.
Press [FREQ] > {Start Freq} > [3] > {kHz}
Press {Stop Freq} > [2] > {MHz}.
7 Press [BW/SWP] > [1] > {kHz} to set the RBW.
8 Press [MODE], Rotating the knob to highlight
xDSL Measurement, [ENTER].
9 Press {Disp mode} > {Spctrg&Trace}
10Press {Save&Load} > {File Setup} > {File Path USB}
11 Press {Return} > {Start Save}
The analyzer begins to automatically save the
spectrogram (*.SPE) or CSV file. when this file
size is reach the file size set in the {File setup},
the file will be automatically saved, and the
spectrogram measurement will restart.
80
N9340B User’s Guide
Agilent N9340B
Handheld Spectrum Analyzer
5
Key Reference
This Chapter provides descriptions
of the Instrument hardkeys and
softkey menu functionality, key
access to softkey sub- menus, and
instrument parameter control
options.
Additional reference information is
provided in the Menu Maps
section.
Agilent Technologies
81
5
Key Reference
Amplitude
Key access: [AMPTD]
Activates the reference level function and access
the associated softkeys to set functions that affect
the way data on the vertical axis is displayed or
corrected.
Ref level
Key access: [AMPTD] > {Ref level}
Activates the reference level function.
The reference level is the amplitude power or
voltage represented by the top graticule on the
display. Changing the value of the reference level
changes the absolute amplitude level (in the
selected amplitude units) of the top graticule line.
To change the reference level, use the arrow keys,
the knob, or the numeric keypad. Pressing any
digit (0 through 9) on the numeric keypad brings
up the terminator menu.
Attenuation
Key access: [AMPTD] > {Attenuation}
Toggles the input attenuation between Auto or Man.
The input attenuation ranges from 1 dB to 51 dB
and allows you to set the attenuation level in 1 dB
increments when attenuation is set to Man.
The input attenuator, normally coupled to the
reference level control, reduces the power level of
the analyzer input signal at the input mixer. The
attenuator is recoupled when attenuation is set to
Auto.
CAU
CAU
TI O- N
82
To prevent damage to the input mixer, do not exceed a
power level of +33 dBm at the input. A granted power
level for stable sensitive measurement is less than 20dBm.
N9340B User’s Guide
Key Reference
5
Preamp
Key access: [AMPTD] > {Preamp}
Toggles the internal preamp between On and Off.
Preamp results in a correction being applied to
compensate for the gain of the preamp at 20 dBm
so that amplitude readings show the actual value
at the input connector.
NO TE
When the preamp is on, a PA indication appears on the left
side of the display.
The preamp is set to on in frequency bands from
1 MHz to 3 GHz, otherwise the correction is not
applied even though the PA indication still appears.
Scale/DIV
Key access: [AMPTD]
Sets the logarithmic units per vertical graticule
division on the display.
NO TE
The Scale/Div function is only available when the Scale Type
key is set to Log.
Scale Type
Key access: [AMPTD] > {Scale Type}
Toggles the scale type of vertical graticule divisions
between logarithmic and linear.
When Scale Type is set to Log, a logarithmic units
is activated ranging from 1 to 10 dB per division.
When Scale Type is set to Lin, the vertical divisions
are linearly scaled and the default amplitude units
are volts. The top of the display is set to the
reference- level value and the bottom graticule
becomes zero volts. (Each division of the graticule
is one- tenth of the reference level in volts.)
N9340B User’s Guide
83
5
Key Reference
HiSensitivity
Key access: [AMPTD] > {HiSensitivity}
Press this softkey On to set 0 dB attenuation, - 50
dBm reference level and turn the pre- amplifier on.
It’s very helpful to observe the low- level signals
with this settings.
Ref Offset
Key access: [AMPTD] > {Ref Offset}
Adds an offset value which ranges from - 327.6 dB
to +327.6 dB, to the displayed reference level.
NO TE
Reference-level offsets are only entered by using the numeric
keypad. Entering an offset does not affect the trace or the
attenuation value.
Reference- level offsets are used when gain or loss
occurs between a device under test and the
analyzer input. Thus, the signal level measured by
the analyzer may be referred to as the level at the
input of an external amplitude conversion device.
When an amplitude offset is entered, its value
appears in the lower left corner of the display.
Y Axis Units
Key access: [AMPTD] > {More} > {Y Axis Units}
Sets the amplitude units.
NO TE
84
Amplitude units are maintained for both logarithmic and linear
modes depending on the Scale Type setting.
N9340B User’s Guide
Key Reference
5
EMF Mode
Key access: [AMPTD] > {More}
EMF mode is available when the Y Axis Unit is
dBmV, dBμV or V. This mode is used to measure
the port voltage in open circuit.
Grid Scale
Key access: [AMPTD] > {More}
Press this softkey to turn on the amplitude scale
unit display on the left of the graticule. The unit
determined by the {Y Axis Unit} softkey.
N9340B User’s Guide
85
5
Key Reference
BW/SWP
Activates the bandwidth function and accesses the
associated softkeys to control resolution bandwidth,
video bandwidth and sweep time.
RBW
Key access: [BW/SWP] > {RBW}
Changes the 3 dB resolution bandwidth on the
analyzer from 30 Hz to 1 MHz in a 1, 3, 10
sequence using the knob, step keys or the numeric
keypad.
NO TE
If an unavailable bandwidth is entered using the numeric
keypad, the closest available bandwidth in the 1, 3, 10
sequence is used.
As the resolution bandwidth is decreased, the
sweep time is modified to maintain amplitude
calibration. Resolution bandwidth is also related to
span. As span is decreased, resolution bandwidth
decreases. As the resolution bandwidth changes,
the video bandwidth, if in auto couple mode,
changes to maintain the VBW/RBW ratio.
NO TE
In non-zero span mode, the value of RBW is determined by
whether the setting for RBW is Auto or Man (manual).
A “#”mark appears next to RBW on the display
when it is not coupled.
VBW
Key access: [BW/SWP] > {VBW}
Changes the analyzer post- detector filter from 3 Hz
to 1 MHz in a 1, 3, 10 sequence using the knob,
the step keys, or the numeric keypad.
86
N9340B User’s Guide
Key Reference
5
As the video bandwidth is decreased, the sweep
time is increased to maintain amplitude calibration.
NO TE
If an unavailable bandwidth entered using the numeric
keypad, the closest available bandwidth in the 1, 3, 10
sequence is used.
VBW/RBW
Key access: [BW/SWP] > {VBW/RBW}
Selects the ratio between the video and resolution
bandwidths.
If signal responses near the noise level are visually
masked by the noise, the ratio can be set to less
than 1 to lower the noise. The knob and step keys
change the ratio in a 1, 3, 10 sequence.
NO TE
When preset is set to default, or VBW/RBW is set to Auto,
the ratio is set to 1.
Avg Type
Key access: [BW/SWP] > {Avg Type}
Accesses the functions to automatically or
manually choose from one of the following
averaging type:
Log Pwr
Key access: [BW/SWP] > {Avg Type} > {Log Pwr}
Averages the data as appropriate for the
logarithmic scaled y- axis.
When average type is set to Log Pwr, “LgAv”
appears on the left side of the display.
N9340B User’s Guide
87
5
Key Reference
Pwr
Key access: [BW/SWP] > {Avg Type} > {Power}
Converts the scale from logarithmic to linear power
units, and then averages the power trace data.
With average type set to Pwr, “PAvg” appears on
the left side of the display.
Voltage
Key access: [BW/SWP] > {Avg Type} > {Voltage}
Averages the data as appropriate for the linearly
scaled y- axis scale.
With average type set to Voltage, “VAvg” appears on
the left side of the display.
There are actually four types of averaging
processes within an N9340B. All, except VBW
filtering, are affected by this setting. They are
listed as follows:
• Trace averaging
Averages signal amplitudes on a trace- to- trace
basis. (Press Log Pwr or Pwr)
• Average detector
Averages signal amplitudes during the time or
frequency interval and represents the result as a
single measurement point.
• Noise marker
Averages signal amplitudes across measurement
points to reduce variations for noisy signals.
• VBW filtering
Performs a form of averaging of video signal.
88
N9340B User’s Guide
Key Reference
5
Sweep Time
Key access: [BW/SWP] > {Sweep Time}
Selects the sweep time for the analyzer to tune
across the displayed frequency span (or, in zero
span, the time the analyzer take to sweep the full
screen).Inputs may be made using the knob, the
arrow keys, or numeric keypad.
NO TE
Reducing the sweep time increases the sweep rate.
In non-zero spans
When the sweep time is auto- coupled, the analyzer
selects the optimum (shortest) sweep time ranging
from 10 ms to 1000 s. The auto selection is
determined by three measurement settings:
• Frequency Span
• The selected Resolution Bandwidth
• The selected Video Bandwidth
Note that changing one of the three factors above
will change the sweep time. The sweep time is in
direct ratio to frequency span and is in reverse
ratio to the selected resolution bandwidth and
video bandwidth when auto- coupled.
CAU
CAU
TI O- N
With sweep time set to a value less than the minimum
auto-coupled value, an annotation “Data out of range”
appears in the active function block and the sweep time is
automatically converted to the minimum auto-coupled
value.
In zero span
Auto- coupled does not function when in a zero
span. The sweep time can only be set manually.
The sweep time is selectable from 6 s to 200 s in
zero span.
N9340B User’s Guide
89
5
Key Reference
In FFT Mode
In FFT mode, the sweep time default is
auto- coupled. The submenu, sweep time is invalid
in FFT mode.
Sweep
Key access: [BW/SWP] > {Sweep}
Activates the sweep mode function and accesses
associated softkeys to select the trace sweep
functions.
Sweep Type
Key access: [BW/SWP] > {Sweep}
Toggles the analyzer between the continuous sweep
mode and the single sweep mode.
• Sweep (Single)
Puts the analyzer in a single sweep mode. In this
mode, pressing [BW/SWP] > {Single Sweep} enables
a sweep.
• Sweep (Cont)
Performs one sweep after another as soon as it
is triggered. Pressing [Preset] (When Preset Type
is set to Default) or turning the power on, sets
the sweep mode to continuous sweep as default.
Sweep Mode
Key access: [BW/SWP] > {Sweep} > {Sweep Mode}
An N9340B provides two sweep modes to meet
different sweep time requirements:
• Normal
Activates the default sweep mode.
• Fast
Activates the fast sweep mode.
90
N9340B User’s Guide
Key Reference
5
Fast sweep mode provides a fast measurement
function that decreases the sweep time. Using Fast
Sweep will decrease the measurement accuracy.
NO TE
Fast sweep is valid only when span is no less than 50 MHz.
Measurement data is not ganruanteed in fast sweep mode.
TD Mode
Key access: [BW/SWP] > {Sweep} > {Sweep Mode}
The TD mode is used to analyze TDD or TDM
signal, for instance the GSM signal frame. When in
this mode, the sweep frequency analysis is enabled
at RBW of 1 kHz, 3 kHz and 10 kHz. When TD
mode is set to Off, the analyzer is sweeping in FFT
analysis mode below 30 kHz. In TD mode, you can
manually set the sweep time long enough to get a
stable measurement result of TDD signal. For
example, one time frame for GSM signal is
4.616ms, then the sweep time can be set no less
than 4.616ms*461 (points of one trace of N9340B)
to measure the signal.
Single Sweep
Key access: [BW/SWP] > {Sweep} > {Single Sweep}
When the analyzer is in continuous sweep mode
and not in a measurement mode ([MEAS] > Measure
Off), pressing [BW/SWP] > {Single Sweep} will change
the sweep setting to single sweep. It will then
begin a sweep after the trigger conditions are met.
If the analyzer is already in single sweep, pressing
[BW/SWP] > {Single Sweep} will execute a new
sweep as soon as the trigger condition is met.
If average is on ([TRACE] > {More} > {Average On}),
pressing [BW/SWP] > {Single Sweep} will halt
averaging of the current value, and then continue
averaging from the current count number when a
single sweep function triggers.
N9340B User’s Guide
91
5
Key Reference
Enter
Hardkey function:
• Terminates data entry and enters into the
analyzer numerical values keyed from numeric
keypad on the front panel.
• Terminate filename entries.
ESC/CLR
This hardkey provides mainly two types of
functions:
Clear
• Clears any numeric entry and cancels the active
function.
• Clears any title entry and cause the title to
revert to the previous name.
• Clears input or output overloads
• Clears error messages from the status line along
the bottom of the display.
Association with other functions
Provides a permitted setting for triggering other
functions such as:
• Activates LIMIT function for pass/fail judgements.
• Activates SAVE function for current trace saving.
CAU
CAU
TI O- N
92
When pressing [ESC/CLR], the current parameter
annotation in the lower left corner, which is an indicator of
available settings of LIMT and SAVE, disappears.
N9340B User’s Guide
Key Reference
5
Frequency
Activates the center frequency function, and
accesses the menu of frequency functions. The
center frequency, or start and stop frequency
values appear below the graticule on the display.
NO TE
When changing both the center frequency and the span,
change the frequency first since the span can be limited by
the frequency value.
Center Frequency
Key access: [FREQ] > {Center Freq}
Activates the center frequency function, which
allows you to set the horizontal center of the
display to a specified frequency.
Start Frequency
Key access: [FREQ] > {Start Freq}
Sets the frequency at the left side of the graticule.
The left and right sides of the graticule correspond
to the start and stop frequencies. When these
frequencies are activated, their values are
displayed below the graticule in place of center
frequency and span.
Stop Frequency
Key access: [FREQ] > {Stop Freq}
Sets the frequency at the right side of the
graticule. The left and right sides of the graticule
correspond to the start and stop frequencies. When
these frequencies are activated, their values are
displayed below the graticule in place of center
frequency and span.
N9340B User’s Guide
93
5
Key Reference
CF Step
Key access: [FREQ] > {CF Step}
Changes the step size for the center frequency
function. Once a step size has been selected and
the center frequency function is activated, the
arrow keys change the center frequency by the
step- size value. The step size function is useful for
finding harmonics and sidebands beyond the
current frequency span of the analyzer. When
auto- coupled, the center size is set to one division
(10 percent of the span).
Freq Offset
Key access: [FREQ] > {Freq Offset}
Allows you to input a frequency offset value that is
added to the frequency readout of the marker, to
account for frequency conversions external to the
analyzer. Offset entries are added to all frequency
readouts including marker, start frequency, and
stop frequency. Offsets are not added to the span
or frequency count readouts. Entering an offset
does not affect the trace display.
94
N9340B User’s Guide
Key Reference
5
Marker
Accesses the marker control softkeys to select the
type and number of markers. Markers are
diamond- shaped characters that identify points of
traces. Up to six pairs of markers may appear on
the display simultaneously; only one pair can be
controlled at a time. The marker that is controlled
is called the “active” marker. Pressing [MARKER]
activates the Normal menu key.
Marker
Key access: [MARKER] > {Marker}
Selects one of the six possible markers. A marker
that has already been selected will become active
when it is turned on. If a marker has been turned
on and assigned to a specific trace, it will become
active on that trace if that marker is selected.
Normal
Key access: [MARKER] > {Normal}
Activates a single frequency marker at the center
of the active trace if a marker is not already
displayed. If a marker is displayed before the
Normal function is enabled, the marker is enabled
at the position of the selected marker. The marker
number is indicated above the marker. The knob
and/or arrow keys move the marker left or right. If
a value is entered from the numeric keypad, the
marker is moved to the trace point nearest to that
value. Annotation in the active function block and
in the upper right corner indicates the frequency
and amplitude of the marker (time and amplitude,
if in zero span.) Pressing Normal turns off the Delta
function and moves the active marker to the delta
marker position.
N9340B User’s Guide
95
5
Key Reference
Delta
Key access: [MARKER] > {Delta}
Activates a second marker at the position of the
first marker. (If no marker is present, two markers
appear at the center of the display). The amplitude
and frequency (or time) of the first marker is
fixed. The marker number is indicated above the
delta marker, and the same number is indicated
with an R (for example, 1R) above the reference
marker. Use the data controls to position the delta
marker. Annotation in the active function block
and in the upper- right corner of the display
indicates the frequency (or time) and amplitude
differences between the two markers. The markers
will be turned off if the scale type is changed
between log and linear.
NO TE
NO TE
Pressing Delta again moves the reference marker to the active
marker position, so you are allowed to make delta
measurements from differing reference points without having
to turn off the makers and begin again.
The delta marker function permits signal-to-noise
measurements provided the signal is a single spectral
component (sinusoid). Place a normal marker on the signal,
press Delta, place the delta marker in the noise, and activate
Marker Noise. The indicated amplitude indicates
signal-to-noise/Hz.
Off
Key access: [MARKER] > {Off}
Turns off the active function markers.
96
N9340B User’s Guide
Key Reference
5
Peak Search
Place a marker on the highest peak based on the
setting of the Search Criteria as follows:
• Peak
Key access: [MARKER] > {Peak Search}
Place a marker on the highest peak.
• Next Left Peak
Key access: [MARKER] > {Peak Search} > {Next Left PK}
Moves the marker to the next peak to the left of
the current marker. The signal peak must exceed
the peak threshold value by the peak excursion
value. If there is no peak to the right, the marker
will not move and the No Peak Found error message
will appear on the display.
• Next Right Peak
Moves the marker to the next peak to the right of
the current marker. The signal peak must exceed
the peak threshold value by the peak excursion
value. If there is no peak to the right, the marker
will not move and the No Peak Found error message
will appear on the display.
Key access: [MARKER] > {Peak Search} > {Next Right
PK}
• 6 Peaks Search
In non- zero span, pressing 6 Peaks Search turns all
six markers on and puts them on the six highest
peak in the current frequency span.
In zero span, the function is not available.
Key access: [MARKER] > {Peak Search} > {Auto Search}
N9340B User’s Guide
97
5
Key Reference
Marker To
Accesses the following marker function menu keys:
• To Center
Key access: [MARKER] > {To Center}
Sets the center frequency of the analyzer to the
marker frequency. In Delta mode, pressing [Marker]
> {Marker To} > {To Center} sets the center frequency
to the marker delta value. The function is not
available in zero span.
NO TE
When the frequency scale is in log mode, the center
frequency is not at the center of the display.
• To Ref
Key access: [MARKER] > {Marker To}
Changes the reference level to the active marker
value, moving the marked point to the reference
level (top line of the graticule). In Delta mode,
pressing [Marker] > {Marker To} > {To Ref} sets the
reference level to the amplitude difference between
the markers.
Mode
Key access: [MARKER] > {More} > {Mode}
Accesses the following menu keys that allows you
to change the active marker readout mode.
• Normal
Activates the default readout mode.
• Freq Count
Activates a frequency counter mode.
• Noise
Activates a noise readout mode for evaluating
power density.
98
N9340B User’s Guide
Key Reference
NO TE
NO TE
5
Frequency counter is properly effective only on CW signals or
discrete peaks. For a valid reading, the marker must be greater
than 25 dB above the noise. Freq Count function is not
supported under Marker Delta condition.
Noise mode operates only on noise peaks and not supported
under Marker Delta condition.
Marker Trace
Key access: [MARKER] > {More} > {Marker Trace}
Activates a marker on the trace if there are no
markers turned on. If a marker is currently active,
press Marker Trace until 1, 2, 3, or 4 is underlined.
The active marker will be moved to the selected
trace.
Selecting Auto will move the marker to the
automatically selected trace. The selection order is
to look for the lowest numbered trace in the
following order of trace modes:
Clear write
Max hold
Min. hold
View
If there is no trace in any of these modes, it
selects trace 1 as default.
All Off
Key access: [MARKER] > {More} > {All Off}
Turns off all of the markers, including markers
used for signal track and demodulation. The
marker annotation is also removed.
Marker Table
Key access: [MARKER] > {More} > {Marker Table}
Compresses the graticule and displays the marker
number, trace number, marker type, X axis value,
and the amplitude in the table.
N9340B User’s Guide
99
5
Key Reference
MEAS
Hardkey menu access.
In spectrum analysis mode, pressing [MEAS] brings
up the menu for a suite of power measurements
such as adjacent channel power, occupied
bandwidth, and channel power.
OBW
Occupied Bandwidth (OBW) integrates the power
of the spectrum in the displayed green frame. The
measurement defaults to 99% of the occupied
bandwidth power.
Occupied bandwidth measurement are made in
either single or continuous sweep mode.
Selecting a Method
Press [MEAS] > {OBW} > {Method} to toggle the
occupied bandwidth measurement mode between
percentage (%) and dBc.
• Setting Percentage (%)
Press {OBW} > {Method} > {Percent} to edit the
percentage of signal power used when determining
the occupied bandwidth. Press {%} to set the
percentage ranging from 10.00% to 99.99%.
• Setting dBc
Press {OBW} > {Method} > {dBc} to specify the power
level used to determine the emission bandwidth as
the number of dB down from the highest signal
peak, within the occupied bandwidth span. This
function is an independent calculation from the
OBW calculation. The x dB bandwidth result is also
called the emissions bandwidth (EBW). This sets
the green frame (f1 and f2 are the two cross points
of the signal and the pair of vertical lines of the
displayed green frame) to your specified dB value
below the maximum power, and compute the total
power in the frame. The emission bandwidth is
then calculated ranging from 0.1 dB to 100 dB (the
default value is set to 26 dB).
100
N9340B User’s Guide
Key Reference
5
ACPR
The adjacent channel power ratio (ACPR) measures
the power ratio between the main channel power
and the adjacent channel power.
ACPR measures the total power (RMS voltage) in
the specified channel. The measurement result
reports the ratios of the two adjacent channel
powers to the main channel power.
Center Frequency
Key access: [MEAS] > {ACPR} > {Center Freq}
Sets the center frequency of the main channel
power.
Main Channel
Key access: [MEAS] > {ACPR} > {Main Channel}
Specifies the range of integration used in
calculating the power in the main channel. Use the
knob, the arrow keys, or the numeric keypad to set
the bandwidth.
Adjacent Channel
Key access: [MEAS] > {ACPR} > {Adj Channel}
Specifies the range of integration used in
calculating the power in the adjacent channel. Use
the knob, the arrow keys, or the numeric keypad to
set the bandwidth.
Channel Space
Key access: [MEAS] > {ACPR} > {Channel Space}
Sets the space value between the center frequency
of main channel power and that of the adjacent
channel power.
N9340B User’s Guide
101
5
Key Reference
Channel Power
Channel power function measures the power and
power spectral density in the channel bandwidth
specified. One pair of vertical lines of the displayed
green frame indicates the edges of the channel
bandwidth. The center frequency, reference level,
and channel bandwidth must be set by the user.
The power calculation method used to determine
the channel power is a traditional method known
as the integration bandwidth (IBW) method. A
swept spectrum is used as the basis for this
calculation. Therefore, it is important to set the
resolution bandwidth correctly before making this
measurement using the following formula:
Span
RBW = k × ------------n
Where k is a value between 1.2 and 4.0 and n is
the number of trace points.
Center Frequency
Key access: [MEAS] > {Channel Power} > {Center Freq}
Sets the center frequency of the display.
Integration Bandwidth
Key access: [MEAS] > {Channel Power} > {Int BW}
Specifies the bandwidth of integration bandwidth,
which can range from 100 Hz to 3 GHz to calculate
the power in a channel. For example, set the main
(center) channel bandwidth. The green frame
indicates the integration bandwidth.
Channel Bandwidth
Key access: [MEAS] > {Channel Power} > {Channel BW}
Sets the analyzer span for the channel power
measurement using the knob, the arrow keys or the
numeric keypad. Be sure the span is set between 1
and 10 times the integration bandwidth.
102
N9340B User’s Guide
Key Reference
5
Spectrum Emission Mask (SEM)
Spectrum Emission Mask measurement includes the
in- band and out- of- band spurious emissions. As it
applies to W- CDMA (3GPP), this is the power
contained in a specified frequency bandwidth at
certain offsets relative to the total carrier power. It
may also be expressed as a ratio of power spectral
densities between the carrier and the specified
offset frequency band. For WLAN, the reference
power is taken as the peak PSD in the signal, and
all offset results are also the peak PSD in that
offset as opposed to the integrated power.
Avg Number
Key access: [MEAS] > {More} > {SEM} > {Avg Number}
Press Avg Number (On) to specify the number of
measurement averages used when calculating the
measurement result. The average will be displayed
at the end of each sweep.
Meas Type
Key access: [MEAS] > {More} > {SEM} > {Meas Type}
Displays a menu where you can select a
measurement reference type, Total Pwr Ref or PSD
Ref. When Total Pwr Ref is selected, the power in the
carrier is used as the reference in computing the
relative power values for the offsets. When PSD Ref
is selected, the mean power spectral density of the
carrier is used in computing the relative power
spectral density values for the offsets.
Ref Channel
accesses the softkeys that enable you to change the
reference channel settings:
• Chan Integ BW
Key access: [MEAS] > {SEM} > {Ref Channel}
Specifies the integration bandwidth used in
calculating the power in the main channel.
N9340B User’s Guide
103
5
Key Reference
• Chan Span
Key access: [MEAS] > {SEM} > {Ref Channel}
Specifies the span used in measuring the power
in the main channel.
• Sweep Time
Key access: [MEAS] > {SEM} > {Ref Channel}
Specifies the sweep time used in measuring the
power in the main channel.
• Total Pwr Ref
Key access: [MEAS] > {SEM} > {Ref Channel}
Total Pwr Ref is the power in the carrier that is
used as the reference in computing the relative
power values for the offsets. When Man is
selected, this can be set by the user. When Auto
is selected, this is the measured power in the
reference carrier.
Offset/Limits
Key access: [MEAS] > {SEM}
Displays the menus where you can change the
following parameters for offset frequency settings
and pass/fail tests: Offset, Start Freq, Stop Freq, Sweep
Time, Res BW, and Limits. Refer to the tables below
for default settings of particular radio standards of
interest.
Table 1 Offsets & Limits Defaulted for W-CDMA (3GPP)
a
Base Station Measurements
Offset
Start
Stop
Freq
Freq
(MHz) (MHz)
Res
Abs
Abs
Abs
Rel
Rel Meas
BW
Start Stop Couple Start Stop BW
(kHz) (dBm) (dBm)
(dBc) (dBc)
A. On
2.515
2.715
30.00
-14.00 -14.00
B. On
2.715
3.515
30.00
-14.00 -26.00
30.00
Couple -30.00 -30.00
Man
-30.00 -30.00
1
1
C. On
3.515
4.000
-26.00 -26.00
Couple -30.00 -30.00
1
D. On
4.000
8.000 1000.00 -13.00 -13.00
Couple -30.00 -30.00
1
E. On
8.000
12.500 1000.00 -13.00 -13.00
Couple -30.00 -30.00
1
a. Fail Mask is set to Absolute and Rel Stop is set to Couple.
104
N9340B User’s Guide
Key Reference
5
Table 2 Offsets & Limits Defaulted for W-CDMA (3GPP)
a
Mobile Station Measurements
Offset
Start
Stop
Freq
Freq
(MHz) (MHz)
Res
Abs
Abs
Rel
Rel
Rel Meas
BW
Start Stop Couple Start Stop BW
(kHz) (dBm) (dBm)
(dBc) (dBc)
A. On
2.515
3.485
30.00
-71.07 -71.07
Man
-35.23 -49.78
1
B. On
4.000
7.500
1000.0 -55.84 -55.84
Man
-35.50 -39.00
1
Man
C. On
7.500
8.500 1000.00 -55.84 -55.84
-39.00 -49.00
1
D. On
8.500
12.000 1000.00 -55.84 -55.84
Couple -49.00 -49.00
1
E. Off
12.500 15.000 1000.00 -55.84 -55.84
Couple -49.00 -49.00
1
a. Abs Stop is set to Couple and Fail Mask is set to Abs AND Rel.
Table 3 Offsets & Limits Defaulted for 802.11a and
HiperLAN/2 Radio Standardsa
Offset
Start
Stop
Abs
Abs
Abs
Freq
Freq
Start Stop Couple
(MHz) (MHz) (dBm) (dBm)
A. On
9.00
11.00
16.00
-4.00
Man
B. On
11.00
20.00
-4.00
-12.00
Man
Man
Rel
Start
(dBc)
0.00
Rel
Rel Meas
Stop Couple BW
(dBc)
-20.00
Man
1
-20.00 -28.00
Man
1
-28.00 -40.00
Man
C. On
20.00
30.00
-12.00 -24.00
D. On
30.00
50.00
-24.00 -24.00 Couple
-40.00 -40.00 Couple
1
1
E. Off
50.00
100.00
-24.00 -24.00 Couple
-40.00 -40.00 Couple
1
a. Fail Res BW is set to 100 kHz and Fail Mask is set to Rel.
Table 4 Offsets & Limits Defaulted for 802.11b Radio
Standarda
Offset
Start
Stop
Abs
Abs
Rel
Rel Meas
Freq
Freq Start Stop Start Stop BW
(MHz) (MHz) (dBm) (dBm) (dBc) (dBc)
A. On
11.00
22.00
-10.00 -10.00 -30.00 -30.00
1
B. On
22.00
50.00
-30.00 -30.00 -50.00 -50.00
1
C. Off
50.00
70.00
-30.00 -30.00 -50.00 -50.00
1
D. Off
70.00
90.00
-30.00 -30.00 -50.00 -50.00
1
E. Off
90.00
100.00 -30.00 -30.00 -50.00 -50.00
1
a. Res BW is set to 100 kHz, Fail Mask is set to Rel, and
Abs Stop and Rel Stop are both set to Couple.
N9340B User’s Guide
105
5
Key Reference
Offset
Key access: [MEAS] > {SEM} > {Offset/Limits}
Selects the offset pairs (upper and lower) that the
softkeys affect, and displays the memory selection
menu from A to E (where you can store up to 5
sets of values for Start Freq, Stop Freq, Sweep Time,
Res BW, Meas BW, Abs Start, Abs Stop, and so forth).
Press Offset until the letter of the desired offset (A,
B, C, D, or E) is underlined. Only one selection at
a time is shown on this key label.
Start Freq
Key access: [MEAS] > {SEM} > {Offset/Limits}
Specifies the inner limit (frequency closest to the
carrier) for both segments of the specified offset
pair. When Start Freq (Off) is selected, the offset pair
is not measured.
Stop Freq
Key access: [MEAS] > {SEM} > {Offset/Limits}
Specifies the outer limit (frequency furthest from
the carrier) for both segments of the specified
offset pair. The minimum frequency difference
between Start Freq and Stop Freq is limited to 100 Hz.
Sweep Time
Key access: [MEAS] > {SEM} > {Offset/Limits}
Specifies the sweep time for the currently selected
offset, and toggles this function between Auto and
Manual for each offset.
Res BW
Key access: [MEAS] > {SEM} > {Offset/Limits}
106
N9340B User’s Guide
Key Reference
5
Specifies the resolution bandwidth used in
measuring the offset pair. When set to Auto, the
Res BW from the default tables for
“Offset/Limits" on page 104 are used. When set to
Man, the allowed range is 1 kHz to 1MHz.
Abs StartAmpt
Key access: [MEAS] > {SEM} > {Offset/Limits} > {More}
Enables you to enter an absolute level limit at Start
Freq for the currently selected offset ranging from
–200.00 to +50.00 dBm with 0.01 dB resolution.
Abs StopAmpt
Key access: [MEAS] > {SEM} > {Offset/Limits} > {More}
Enters an absolute level limit at Stop Freq for the
currently selected offset ranging from –200.00 to
+50.00 dBm with 0.01 dB resolution, and to toggle
this function between Couple and Man. If set to
Couple, this is coupled to Abs Start to make a flat
limit line. If set to Man, Abs Start and Abs Stop you
can enter different values to make a sloped limit
line.
Rel StartAmpt
Key access: [MEAS] > {SEM} > {Offset/Limits} > {More}
Enters a relative level limit at Start Freq ranging
from –150.00 to +50.00 dBc with 0.01 dB
resolution.
Rel StopAmpt
Key access: [MEAS] > {SEM} > {Offset/Limits} > {More}
Enters a relative level limit at Stop Freq ranging
from –150.00 to +50.00 dBc with 0.01 dB
resolution, and to toggle this function between
Couple and Man. If set to Couple, this is coupled to
Rel Start to make a flat limit line. If set to Man, Rel
Start and Rel Stop you can enter different values to
make a sloped limit line.
N9340B User’s Guide
107
5
Key Reference
Meas BW
Key access: [MEAS] > {SEM} > {Offset/Limits} > {More}
> {More}
Specifies the bandwidth to use when measuring the
offset. When using the front panel, only the
currently selected offset is affected. All the offsets
are affected when remote control. This is the
multiplier applied to the resolution bandwidth to
determine the bandwidth to integrate when
calculating the power. Meas BW is now restricted
to be 1 and not changeable.
Fail Mask
Key access: [MEAS] > {SEM} > {Offset/Limits} > {More}
> {More}
Displays the menu to select one of the following
logic keys for fail conditions between the
measurement results and the test limits:
• Absolute
Sets the limit test to show Fail if one offset is
larger than the corresponding limit for Abs Start
and/or Abs Stop. This is the default selection for
each offset for BTS measurements.
• Relative
Sets the limit test to show Fail if one offsets
spectrum emission mask measurement results is
larger than the corresponding limit for Rel Start
and/or Rel Stop.
• Abs AND Rel
Set the limit test to show fail if one offset’s
emission mask measurement results is larger than
both the corresponding limit for Abs Start and Stop
and the limit for Rel Start and Rel Stop.
• Abs or Rel
Set the limit test to show fail if one offset’s the
absolute emission mask measurement results is
larger than the corresponding limit for Abs Start
and Stop or the limit for Rel Start and Rel Stop.
108
N9340B User’s Guide
Key Reference
5
Spectrogram
Spectrogram Run/Pause
Key access: [MEAS] > {Spectrogram} > {Spectrogram}
Toggles the spectrogram monitoring between Run
and Pause.
Restart Meas
Key access: [MEAS] > {Spectrogram} > {Restart Meas}
Resets the spectrogram display.
Update Interval
Key access: [MEAS] > {Spectrogram} > {Update Int.}
Enables you to set the interval of time to update
data to 1 or more seconds. Or, you may set it to
automatically determine the Update Interval that
provides the maximum data collection speed.
A data sample is taken every time interval for
display on the spectrogram. Increasing the update
time allows data capturing over a longer period of
time in the spectrogram.
Spec View
Key access: [MEAS] > {Spectrogram} > {Spec View}
Enables you to view the details in the captured
spectrogram. when the Spectrogram is running,
Pressing {Spec View} pauses the running
spectrogram.
Press {Home}/{End} to view the first /last
spectrogram in cache.
Press {Playback} to playback the spectrogram
process. The direction and the Update interval is
changeable as your need.
N9340B User’s Guide
109
5
Key Reference
Palette
Key access: [MEAS]> {Spectrogram} > {Palette}
Toggles the spectrogram color mode between full
color and gray scale.
Disp Mode
Key access: [MEAS]> {Spectrogram} > {display}
Allows you to set the spectrogram display mode as
trace, spectrogram or both trace and spectrogram.
Save&Load
Key access: [MEAS]> {Spectrogram} > {Save&Load}
This softkey is only available with option INM
activated.
Start/Stop Save
Key access: [MEAS]> {Spectrogram} > {Save&Load} >
{Start/Stop Save}
This softkey allow you to start or stop the
automatic save function. Once the spectrogram
measurement frames reached the file size set in
the {File Setup}, a file (*.SPE or *.CSV) will be
automatically saved, and the spectrogram
measurement will restart.
NO TE
The save process takes a few seconds to read from cache.
During this period, the measurement is paused.
Timed Setting
Key access: [MEAS]> {Spectrogram} > {Save&Load} >
{Time Setting}
This submenu allows you to configure automatic
time save function. You can set start date, time,
stop date, time in this menu. Press {Timed Save On},
the N9340B will start the auto- saving function
from the Start Time.
110
N9340B User’s Guide
Key Reference
5
File Setup
Key access: [MEAS]> {Spectrogram} > {Save&Load} >
{File Setup}
This submenu allows you to set the File Type, File
name, File Path, and File Size (100- 1500 frames).
Save RAM
Key access: [MEAS]> {Spectrogram} > {Save&Load} >
{Save RAM}
Press this key to save the current spectrogram
measurement data into a file with default name.
Save RAM As
Key access: [MEAS]> {Spectrogram} > {Save&Load} >
{Save RAM As}
Press this key to save the current spectrogram
measurement data into a file with user- defined
name.
Load Spctrg
Key access: [MEAS]> {Spectrogram} > {Save&Load} >
{Load Spctrg}
Press this key to load a pre- saved .SPE
(Spectrogram) file from local memory or USB stick.
N9340B User’s Guide
111
5
Key Reference
MODE
Activates the softkey menus to select the
measurement mode of your analyzer. The
measurement modes are:
• Spectrum Analyzer
• Tracking Generator
• Power Meter
• Demodulation Analysis (Option)
• IBOC (In-Band On-Channel) Measurement (Option)
• xDSL Measurement (Option)
Spectrum Analyzer
Key access: [MODE] > {Tracking Generator}
Select the spectrum analyzer mode, and press
[ENTER] to make the spectrum analysis and
measurement.
Tracking Generator
Key access: [MODE] > {Tracking Generator}
Select this mode, and press [ENTER] to make
specified measurement with tracking generator.
When selected, the Meas softkey menu for the
tracking generator mode will appear.
Amplitude
Key access: [MODE] > {Tracking Generator } >
{Amplitude}
Activates (On) or deactivates (Off) the output power
of the tracking generator. The power level can then
be adjusted using the numeric keypad, arrow keys,
or knob. Pressing any digit, 0 through 9, on the
numeric keypad brings up the selected terminator
menu.
112
N9340B User’s Guide
Key Reference
CAU
CAU
TI O- N
NO TE
5
Power-level sensitive devices connected to the tracking
generator output may be accidentally damaged. This is
because the actual source amplitude will be greater than
the amplitude indicated on the analyzer, when the power
sweep function is being used. The source amplitude value
is used as the starting amplitude for a power sweep. The
ending amplitude for a power sweep is higher then the
source amplitude value and it may actually be set to values beyond specified output levels. Therefore, exercise
caution when connecting a power-level sensitive device to
the tracking generator output.
When Amplitude (Off) is selected, the output attenuation on
the N9340B is set to the maximum attenuation.
Amptd Step
Key access: [MODE] > {Tracking Generator } > { Amptd
Step}
Allows you to set the step size of the power level
range of the tracking generator. The default setting
is one vertical scale division when in a logarithmic
amplitude scale.
Amptd Offset
Key access: [MODE]>{Tracking Generator}> { Amptd
Offset}
Offsets the displayed power of the tracking
generator. Using the amplitude offset capability of
the tracking generator allows you to take system
losses or gains into account, thereby displaying the
actual power delivered to the device under test.
Normalize
Key access: [MODE]>{Tracking Generator } > {Normalize}
• Store Ref (1 → 4)
Copies trace 1 into trace 4. Store Ref (1→ 4) must
be pressed before pressing Normalize (On). If
Normalize (On) is pressed before Store Ref (1 → 4),
N9340B User’s Guide
113
5
Key Reference
the error message: Store reference trace before
turning on Normalize (On) is displayed in the
status line, however Normalize has been activate.
• Normalize
Normalize(On) activates the normalize function.
On each sweep, the normalized trace (Trace 4)
is subtracted from Trace 1 and the result is
added to the normalized reference level. The
display shows the result of the following
calculation:
Trace 1 - Normalized Trace + Normalized
Reference Level
The trace data is normalized with respect to the
normalized reference level, even if the value of
the normalized reference level is changed. This
function remains in effect on all subsequent
sweeps until it is turned off.
NO TE
Segmented sweep is not available when Normalize (On) is
selected. Trace 1 should be in clear write mode prior to setting
normalize to on.
The normalize function is useful for applying
correction data to a trace while making a stimulus
response measurement using a tracking generator.
Normalize will compensate for irregularities of the
components used in the test setup, isolating the
performance of the DUT. For example, connect the
cables and use a thru line in place of the device
(DUT) to be measured, between the tracking
generator and the analyzer input. Notice that the
frequency response is not perfectly flat, showing
the response of the cables, as well as the flatness
of both the tracking generator and the analyzer.
Now press Store Ref (1→ 4), Normalize On. Notice that
the displayed trace is now flat, or normalized. The
position of the normalized trace can now be moved
to a different position on the display by changing
the normalized reference position. This may be
useful if the device to be tested has positive gain,
114
N9340B User’s Guide
Key Reference
5
such as an amplifier. Now replace the thru line
with the device under test, and an accurate
measurement of the gain or loss can be made.
• Norm Ref Lvl
Sets the level (in dB) of the normalized
reference.
• Norm Ref Posn
Offsets the displayed trace without affecting the
instrument gain or attenuation settings. This
allows the displayed trace to be moved without
decreasing measurement accuracy.
• Ref Trace
Allows you to view or blank the reference trace
on the display.
Power Meter
Key access: [MODE] > {Power Meter}
Use the arrow keys to highlight the mode.
Select this mode, and press [ENTER] to make a
measurement using the power meter function.
When selected, the Power Meter softkey menu will
be displayed and many of the instrument hardkeys
will be disabled as they are not necessary for this
mode.
Zeroing
Key access: [MODE] > {Power Meter} > {Zeroing}
Access the associated Zeroing submenu.
• Zeroing
Make a Zero operation of the power sensor.
The U2000 Series USB Power Sensors have their
sensor calibration tables stored in non- volatile
memory which means that the reference
calibration factor is automatically loaded upon
power- up.
N9340B User’s Guide
115
5
Key Reference
• Zero Type
Toggles the zeroing type of the Power Sensor
between internal and external. When this type is
set to EXT, pressing Zeroing will bring up a
message which indicates the external signal
need be pulled out. This setting is not affected
by the preset in Power Meter menu.
Meas Disp
Key access: [MODE] > {Power Meter} > {Meas Disp}
Access the Meas Disp submenu for defining the
display range and resolution while in Power Meter
mode.
• Disp Range
Access the associated Disp Range submenu.
• Auto Range
Toggles the auto range function between On and
Off. When the Auto Range is set to On, the Top
and Bottom value of the power meter’s display
range will be set automatically according to the
measurement data:
Top = Max. data + 0.5
Bottom = Min. data - 0.5
The default setting is Off.
• Top
Set the top value of the power meter’ display
range.
Range from (Bottom + 0.01) to 200 dBm.
The default value is 20 dBm.
• Bottom
Set the bottom value of the power meter’ display
range.
Range from - 200 to (Top - 0.01) dBm.
The default value is - 70 dBm.
116
N9340B User’s Guide
Key Reference
5
• Resolution
Access the associated Resolution submenu.
When the measurement suffix is W or %, this
parameter represents the number of significant
digits. When the measurement suffix is dB or
dBm, 1 through 4 represents 1, 0.1, 0.01, and
0.001 dB respectively.
The default value is 3.
• Disp Mode
Change the display mode between Meter and
Chart.
The default mode is Meter.
• Chart View
Access the Chart View submenu. This soft key is
disabled when the measurement is in process or
if the display mode is set to Meter.
This submenu is used to view the measurement
chart.
• Home
View the first 21 points of current measurement
chart.
• End
View the lastest 21 points of current measurement chart.
• Prev
View the previous points of the chart.
• Next
View the next points of the chart.
• Continue/Pause
Continues or pauses the current measurement.
When the measurement is in process, this
softkey is displayed as “Pause”; when the
measurement is paused, the softkey is displayed
as “Continue”.
N9340B User’s Guide
117
5
Key Reference
Meas Setup
Key access: [MODE] > {Power Meter} > {Meas Setup}
Accesses the Meas Disp submenu which is used to
configure the mesurement settings.
• Freq
Sets a frequency between 1 kHz and 90.0 GHz
using the numeric keypad, arrow key or knob. If
the frequency does not correspond directly to a
frequency in the sensor calibration table, the
power sensor calculates the calibration factor
using linear interpolation.
• Power Range
Accesses the Power Range submenu.
• Auto Range
Enables and disable auto ranging. When auto
ranging is ON, the power sensor selects the best
measuring range for the measurement. When
auto ranging is OFF, the power sensor remains
in the current range and may be manually set
by the user.
• Range
Selects the Lower or Upper of power ranges
when the Auto Range is Off.
• Limits
Accesses the Limits submenu.
• Limits
Enables or disables the limit function.
• Upper Limit
Sets a value of the upper test limit for the
current measurement. The units used are
dependent on the current setting of power unit.
When the measured power is greater than the
value specified, a failure will be reported.
118
N9340B User’s Guide
Key Reference
5
• Lower Limit
Sets the lower test limit value for the current
measurement. The units used are dependent on
the current setting of power unit. When the
measured power is less than the value specified,
a failure will be reported.
• Limit Beep
Enables or disables the limit beep.
• Rel/Offset
Accesses the Rel/Offset submenu.
• Rel
Enables the comparison of a measurement result
to a reference value and sets a reference value
on the current measured data.
• Offset
Sets a value of the display offset on the current
measurement, and enable or disable the display
offset. The display offset is applied to the
measurement signal after any math calculation.
• Average
Accesses the Average submenu.
• Average
Enables or disables the Average function.
• Avg Count
Sets a value of the filter length and to set the
average count value to be Auto or Manual.
The power sensor automatically sets the number
of readings averaged together to satisfy most
power measurements averaging requirements.
The number of average readings depends on the
resolution and the power level settings the
power sensor is currently using.
• Step Detect
Enables or disables step detection. In AUTO
filter mode, the average of the last four values
entered into the filter is compared to the entire
filter average. If the difference between the two
N9340B User’s Guide
119
5
Key Reference
averages is greater than 12.5%, the digital filter
is cleared. The filter will then start storing new
measurement data. This feature shortens the
filter time required when the input power
changes substantially. Note that the result
appears to settle faster, although true settling to
the final value is unaffected.
• Meas Interval
Sets the interval time between two
measurements. The default value is 100 ms.
Preset
Key access: [MODE] > {Power Meter} > {Preset}
Sets the power meter softkey menu options to the
preset conditions. For example, the upper and
lower limits are set to their preset limit values.
IBOC Measurement
Key access: [MODE] > {IBOC Measurement}
Use the knob or arrow keys to highlight the mode,
and press [ENTER] to access the AM/FM IBOC
(In- Band On- Channel) measurement submenu.
AM/FM
Key access: [MODE] > {IBOC Measurement} > {AM}/{FM}
Use this two softkeys to select the AM or FM IBOC
measurement submenus.
Center Freq
Key access: [MODE] > {IBOC Measurement} > {AM}/{FM}
> {Center Freq}
Activates the center frequency function, which
allows you to set the horizontal center of the
display to a specified frequency.
Range: 530 - 1700 kHz for AM band;
87.9 - 107.9 MHz for FM band.
120
N9340B User’s Guide
Key Reference
5
Quick Span
Key access: [MODE] > {IBOC Measurement} > {AM}/{FM}
> {Quick Span}
Press this softkey to quick set the frequency span
with the below configurations:
• Quick Span in AM submenu:
Mask Span is a shortcut to set center frequency
to a standard carrier frequency near current
center frequency and set span to 160 kHz.
AM Band is a shortcut to set center frequency to
1115 kHz and set span to 1370 kHz.
AM Channel (Analog) is a shortcut to set center
frequency to a standard carrier frequency near
current center frequency and set span to 20
kHz.
AM Channel (IBOC) is a shortcut to set center Frequency to a standard carrier frequency near
current center frequency and set span to 50
kHz.
• Quick Span in FM submenu:
Mask Span is a shortcut to set center frequency
to a standard carrier frequency near current
center frequency and set Span to 1.3 MHz.
FM Band is a shortcut to set center frequency to
97.9 MHz and set Span to 21.3 MHz.
FM Channel Analog is a shortcut to set center
frequency to a standard carrier frequency near
current Center Frequency and set Span to 200
kHz.
FM Channel IBOC is a shortcut to set center
frequency to a standard carrier frequency near
current Center Frequency and set Span to 500
kHz.
NO TE
The SPAN hardkey in this mode has the same function in the
spectrum analyzer mode. When Mask is turned on, span will
be set according to mask standard automatically.
N9340B User’s Guide
121
5
Key Reference
Mask Fuction
Key access: [MODE] > {IBOC Measurement} > {AM}/{FM}
> {Mask Function}
Accesses the submenu to configure the mask
related settings.
• Mask Type
There are two types of mask in spectrum mask
measurement for IBOC standard: FCC spectral
emission mask and NRSC spectral emission
limits. NRSC spectral emission is leveraged from
the related specifications of iBiquity Digital
Corporation.
The mask types for IBOC- AM are listed as
below:
• FCC (AM- 73.44)
• NRSC- 5- B Hybrid 5k
• NRSC- 5- B Hybrid 8k
• NRSC- 5- B All Digital
Figure 5-30 IBOC (AM) spectral emission mask and limits
IB O C (A M ) spec tral em ission m a sk and lim it s
0
Level relative to unmodulated carrier(dBc)
-10
-20
-30
-40
-50
-60
-70
-80
-90
-1 00
-1 10
-80
-6 0
-4 0
-20
0
20
40
O ffse t fro m c arrier frequ enc y (k Hz)
60
80
Trace in red is FCC spectral emission mask.
Trace in blue is NRSC hybrid 5 kHz spectral emissions limits.
Trace in magenta is NRSC hybrid 8 kHz spectral emissions limits.
Trace in Black is NRSC all digital spectral emissions limits.
122
N9340B User’s Guide
Key Reference
5
The mak types for IBOC- FM are listed as below:
• FCC (FM- 73.317)
• NRSC- 5- B Hybrid
• NRSC- 5- B Hybrid
Figure 5-31 IBOC (FM) spectral emission mask and limits
IBOC (FM) spectral emission mask and limits
0
Level relative to unmodulated carrier(dBc)
-10
-20
-30
-40
-50
-60
-70
-80
-90
-100
-110
-600
-400
-200
0
200
Offset from carrier frequency (kHz)
400
600
Trace in red is FCC spectral emissions mask.
Trace in blue is NRSC hybrid spectral emissions limits.
Trace in Black is NRSC all digital spectral emissions limits.
• Mask On/Off
Mask On/Off is a switch to enable the mask
function.
• Set Span and RBW according to mask
standard automatically.
• Set Average Type to Power and Detector to
Average (RMS), and also set average on with
average times to meet the measurement
specification.
• Pass/Fail
Pass/Fail On/Off is a switch to enable/disable
PASS/FAIL verification.
N9340B User’s Guide
123
5
Key Reference
• Beep
Beep On/Off is a switch to enable/disable
Pass/Fail beep sound indication.
• Noise Cancel
This function is used to reduce the noise level
for any possible small signals. It is only available
in FM IBOC submenu, when Mask Type is set to
NRSC-5-B <Hybird>.
Channel
Key access: [MODE] > {IBOC Measurement} > {AM}/{FM}
> {Channel}
Press the Channel softkey to access a channel list
menu with customized channel setting files. The
channel file is easy to reload, delete and copy as
needed. The channel list function helps you more
quickly set up their instruments and complete the
measurements.
Auto Tune
Key access: [MODE] > {IBOC Measurement} > {AM}/{FM}
> {Auto Tune}
Press this softkey to automatically find out the
largest signal over specific broadcasting frequency
band. e measure its carrier frequency more
accurate and measure its unmodulated carrier
power or nominal power spectral density in a 1
kHz bandwidth of the digital Primary Main
sidebands for All Digital IBOC (FM) case. These
two parameters will be adopted as 0 Hz offset of
mask from carrier frequency and 0 dBc level
relative to unmodulated carrier or nominal power
spectral density in a 1 kHz bandwidth of the
digital Primary Main sidebands for All Digital IBOC
(FM) case.
The reference level estimation method is different
between IBOC (FM) all digital mode and other
modes. This function is correlative to Mask Type
selection.
124
N9340B User’s Guide
Key Reference
5
Tune Range
Key access: [MODE] > {IBOC Measurement} > {AM}/{FM}
> {Tune Range}
Toggles Tune Range between Band and Span. When it
is set to Band, auto tune is available in whole
AM/FM band frequency range. When it is set to
Span, Auto tune is available in current span
frequency range.
xDSL Measurement
Spectrogram Run/Pause
Key access: [MODE] > {xDSL Measurement} >
{Spectrogram}
Toggles the spectrogram between Run and Pause.
Restart Meas
Key access: [MEAS] > {xDSL Measurement} > {Restart
Meas}
Resets the spectrogram display.
Update Interval
Key access: [MEAS] > {xDSL Measurement} > {Update
Int.}
Enables you to set the interval of time to update
data to 1 or more seconds. Or, you may set it to
automatically determine the Update Interval that
provides the maximum data collection speed.
A data sample is taken every time interval for
display on the spectrogram. Increasing the update
time allows data capturing over a longer period of
time in the spectrogram.
Spec View
Key access: [MEAS] > {xDSL Measurement} > {Spec
View}
Enables you to view the details in the captured
N9340B User’s Guide
125
5
Key Reference
spectrogram. when the Spectrogram is running,
Pressing {Spec View}will pause the running
spectrogram.
Press {Home}/{End} to view the first /last
spectrogram in cache.
Press {Playback} to playback the spectrogram
process. The direction and the Update interval is
changable as your need.
Palette
Key access: [MEAS]> {xDSL Measurement} > {Palette}
Toggles the spectrogram color mode between full
color and gray scale.
Disp Mode
Key access: [MEAS]> {xDSL Measurement} > {Disp
Mode}
Allows you to set the spectrogram display mode as
trace, spectrogram or both trace and spectrogram.
Save&Load
Key access: [MEAS]> {xDSL Measurement} >
{Save&Load}
This softkey is only available with option INM
activated.
Start/Stop Save
Key access: [MEAS]> {Spectrogram} > {Save&Load} >
{Start/Stop Save}
This softkey allow you to start or stop the
automatic save function. Once the spectrogram
measurement frames reached the file size set in
the {File Setup}, a file (*.SPE or *.CSV) will be
automatically saved, and the spectrogram
measurement will restart. The save process takes a
few seconds to read from cache. During this
period, the measurement is paused.
126
N9340B User’s Guide
Key Reference
5
Timed Setting
Key access: [MEAS]> {Spectrogram} > {Save&Load} >
{Time Setting}
This submenu allows you to configure automatic
time save function. You can set start date, time,
stop date, time in this menu. Press {Timed Save On},
the N9340B will start the auto- saving function
from the Start Time.
File Setup
Key access: [MEAS]> {Spectrogram} > {Save&Load} >
{File Setup}
This submenu allows you to set the File Type, File
name, File Path, and File Size (100- 1500 frames).
Save RAM
Key access: [MEAS]> {Spectrogram} > {Save&Load} >
{Save RAM}
Press this key to save the current spectrogram
measurement data into a file with default name.
Save RAM As
Key access: [MEAS]> {Spectrogram} > {Save&Load} >
{Save RAM As}
Press to save the current spectrogram data into a
file with user- defined name.
Load Spctrg
Key access: [MEAS]> {Spectrogram} > {Save&Load} >
{Load Spctrg}
Press this key to load a pre- saved Spectrogram file
from local memory or USB stick.
N9340B User’s Guide
127
5
Key Reference
SPAN
This hardkey accesses the softkey submenu of span
functions. Pressing [SPAN] allows you to change the
frequency range. The frequency- span readout
describes the total displayed frequency range. To
determine frequency span per horizontal graticule
division (when in linear frequency scale type),
divide the frequency span by 10.
Span
Key access: [SPAN] > {Span}
Enter a frequency span range value.
Full
Key access: [SPAN] > {Full}
Changes the span to the full frequency range of the
analyzer.
Zero
Key access: [SPAN] > {Zero}
Changes the frequency span to zero. In this mode,
the current center frequency is displayed in the
time domain (the x axis is displayed in units of
time), like a conventional oscilloscope.
Last Span
Key access: [SPAN] > {Last Span}
Changes the span to the previous span setting.
Demod
Key access: [SPAN] > {Demod}
Accesses the menu keys to select AM demodulation,
FM demodulation or demodulation Off. It also
accesses the Speaker Vol, and Delay Time menu keys
described below.
128
N9340B User’s Guide
Key Reference
5
AM
Key access: [SPAN] > {Demod} > {AM}
Pressing {AM ON} activates the AM demodulation
and turns off FM demodulation (if it is on).
FM
Key access: [SPAN] > {Demod} > {FM}
Pressing {FM ON} activates the FM demodulation
and turns off AM demodulation (if it is on). For
non- zero spans, a 100 kHz resolution bandwidth is
used during the demodulation, regardless of the
screen annotation. When the span is set to zero
span, the displayed bandwidth is used. For best
results, move the signal to be demodulated to
within 3 divisions of the top of the display.
Speaker Vol
Key access: [SPAN] > {Demod} > {Speaker Vol}
Selecting AM or FM turns the speaker on. Press
this softkey and rotate the knob to adjust the
internal speaker volume.
Delay Time
Key access: [SPAN] > {Demod} > {Speaker Vol}
Allows you to set the time, in non- zero spans, to
pause and demodulate the signal after each sweep.
The demodulated signal can be heard during
demodulation. In zero span, demodulation is
performed (and can be heard) throughout the
sweep.
With non- zero spans, in AM the Video BW is set to
3 kHz and the Resolution BW is set to 10 kHz. In
FM, the Video BW is set to 30 kHz and the
Resolution BW is set to 100 kHz.
When AM or FM demod is enabled, the instrument
will tune to the marker frequency and wait for the
Demod to take place. Delay Time is not available
unless AM or FM demod is selected, and span is >0
N9340B User’s Guide
129
5
Key Reference
Hz. For long demodulation times, pressing Preset
when Preset Type is set to DFT will abort the Demod
function. The default value is 2 ms.
NO TE
It is normal to hear clicking sounds when the Auto Alignment
function is On. During retrace, a small portion of the analyzer
circuitry is realigned. Some of the switching of the analyzer
circuitry is done using relays. It is the rapid switching of these
relays during retrace that causes the clicking sounds. To
eliminate the clicking sounds, turn the auto alignment off by
pressing System, Alignments, Auto Align, Off.
When this is done, the Align Now, All function should be
performed periodically. Refer to the Specifications Guide for
your instrument to learn more information on how often to
perform Align Now, All when the auto alignment is off.
Trigger
Key access: [SPAN] > {Trigger}
Accesses the menu of keys that allow you to select
the trigger mode of the analyzer. This softkey is
only available in zero span.
Free Run
Key access: [SPAN] > {Trigger} > {Free Run}
New sweep starts as soon as possible after the
current sweep ends. This is the default state of
trigger mode.
Video
Key access: [SPAN] > {Trigger} > {Video}
Activates the trigger condition that starts the next
sweep if the detected RF envelope voltage rises to
a level set by the video trigger level.
130
N9340B User’s Guide
Key Reference
5
Ext Rise
Key access: [SPAN] > {Trigger} > {Ext Rise}
Activates the trigger condition that will start a
sweep when the external voltage (connected to EXT
TRG IN on the rear panel) passes through
approximately 2 volts. The external trigger signal
must be a 0 V to +5 V TTL signal. Sets the trigger
polarity to positive.
Ext Fall
Key access: [SPAN] > {Trigger} > {Ext Fall}
Sets the trigger polarity to negative.
Trig Delay
Key access: [SPAN] > {Trigger} > {Trig Delay}
Allows you to set and turn on or off a delay,
during which the analyzer will wait to begin a
sweep after receiving an external trigger signal.
N9340B User’s Guide
131
5
Key Reference
TRACE
Accesses the trace keys to store and manipulate
trace information. Each trace comprises a series of
data points in which amplitude information is
stored. The analyzer updates the data for any
active trace with each successive sweep.
Trace
Key access: [TRACE] > {Trace}
Selects the trace (1- 4) for current use.
Clear Write
Key access: [TRACE] > {Clear Write}
Erases any previously stored trace data and
continuously updates the display during following
sweeps of the analyzer. This function is activated
for trace 1 at power on and factory preset.
Max Hold
Key access: [TRACE] > {Max Hold}
Maintains the displayed maximum level for each
trace point of the selected trace. A trace point is
updated if a new maximum level is detected in
successive sweeps.
NO TE
132
Changing the vertical scale (Amplitude, Scale Type, Log or
Line), or pressing PRESET, or turning averaging on (TRACE,
Average (On)) or switching widow in Zone Span restarts the
held trace.
N9340B User’s Guide
Key Reference
5
Minimum Hold
Key access: [TRACE] > {Min Hold}
Maintains the minimum level for each trace point
of the selected trace, and updates each trace point
if a new minimum level is detected in successive
sweeps.
NO TE
Changing the vertical scale (Amplitude, Scale Type, Log or
Line), or pressing PRESET, or turning averaging on (TRACE,
Average (On) or switching widow in Zone Span restarts the
held trace.
View
Key access: [TRACE] > {View}
Holds and displays the amplitude data of the
selected trace. The trace register is not updated as
the analyzer sweeps. If a trace is deactivated by
pressing Blank, the stored trace data can be
retrieved by pressing View.
Blank
Key access: [TRACE] > { Blank}
Stores the amplitude data for the selected trace
and removes it from the display. The selected trace
register will not be updated as the analyzer
sweeps. This function is activated for traces 2, 3
and 4 at power- on and Factory Preset.
Detector
Key access: [TRACE] > {More} > {Detector}
Selects a specific detector type, or allows the
system to auto select the appropriate detector for a
measurement.
For every trace point displayed, there is a finite
time during which the data for that point is
collected. The analyzer has the ability to look at all
N9340B User’s Guide
133
5
Key Reference
of the data evaluated during that time and present
a single point of trace data based on the detector
mode. We call the interval during which data for
that trace point is being collected, the “bucket”.
Thus a trace is more than a series of single points.
It is actually a series of trace “buckets”. The data
may be sampled many times within each bucket.
• Normal
Selects the maximum and minimum video signal
values alternately. When selecting the normal
detector, “N” appears in the upper- left corner.
• Average
Measures the average value of the amplitude
across each trace interval (bucket). When Average is
selected, “A” appears on the upper- left corner.
• Pos Peak
Obtains the maximum video signal between the last
display point and the present display point and
stores this value in memory. It is used primarily
when measuring sinusoidal (spectral) components.
When Positive Peak is selected, “P” appears in the
upper- left corner.
• Sample
Primarily used to display noise (or noise- like)
signals. It should not be used to measure the
accurate amplitude of non noise- like signals.
In sample mode, the instantaneous signal value at
the present display point is placed in memory.
When Sample detector is selected, “S” appears in
the upper- left corner of the display.
• Neg Peak
Similar to peak detector, but selects the minimum
video signal value. Not to be used to measure the
most accurate amplitude. When in Negative Peak
mode, an “N” also appears in the upper- left corner.
134
N9340B User’s Guide
Key Reference
5
Average
Key access: [TRACE] > {More} > {Average}
Initiates a digital averaging routine that averages
the trace points in a number of successive sweeps
resulting in trace “smoothing”. Increasing the
average number will further smooth the trace. For
the information of the type of averaging please
refer to “Avg Type" on page 87.
The average is restarted when any of the following
occurs:
• A new average number is entered.
• Any related parameter (e.g., center frequency) is
changed.
Press Average (Off) to turn off averaging.
The number of sweeps can only be set using the
numeric keypad, not the knob or arrow keys.
Save Trace
Key access: [TRACE] > {More} > {Save trace}
Saves a current trace into a file (*.DAT).
The analyzer uses the filename of the preceding
file saved, but adds an integer in 1, 2, 3 sequence
to the end of the filename to differentiate it from
others.
If there is no record of saved trace in the analyzer,
the default file name of the current saved trace
will be “HYTRACE.DAT”.
Save As
Key access: [TRACE] > {More} > {Save as}
Saves a current trace to a file/directory, with a
user- defined filename.
The filename is entered using the numeric keypad
and terminated by pressing [ENTER].
N9340B User’s Guide
135
5
Key Reference
Numbers, alpha characters and underline are all
valid components of a filename.
Recall Trace
Key access: [TRACE] > {More} > {Recall trace}
The user may recalls a saved trace as the current
activated trace.
136
N9340B User’s Guide
Key Reference
5
LIMIT
Limit Line
Key access: [Limit] > {Limit Line}
Activates an adjustable horizontal line that is used
as a visual reference line.
The limit line, used for trace arithmetic, has
amplitude values that correspond to its vertical
position when compared to the reference level. The
value of the display line appears in both the active
function block and on the left side of the display.
The arrow keys, knob, or numeric keypad may be
used to adjust the display line. Pressing any digit,
0 through 9, on the numeric keypad brings up the
selected terminator menu. To deactivate the display
line, press Display Line (Off).
Limits
Key access: [Limit] > {Limits}
Turns on the limit pattern function and turns off
the limit line function simultaneously.
Edit Limits
Key access: [Limit] > {Edit Limits}
Allows you to set a limit pattern for measurements.
You can edit limit points, limit table and limit
offset for your limit pattern.
Pressing X Axis Unit to toggle the frequency domain
or time domain before you set the parameter of
limit point.
N9340B User’s Guide
137
5
Key Reference
Limit Type
Key access: [Limit] > {Limit Type}
Defines the limit you are editing as either an upper
or lower limit. An upper limit fails if trace 1
exceeds the limit. A lower limit fails if trace 1 falls
below the limit.
Beep
Key access: [Limit] > {Beep}
Turns the beep function on or off. When it set to
on, it sounds an alarm as an indicator of a
measurement limit failure.
Save Limits
Key access: [Limit] > {Save Limits}
Saves the parameters of the current limit pattern
in a file (*.LTM).
Enter the user defined filename using the numeric
keypad and press [ENTER] as a terminator.
Number, alpha characters and underline are all
valid components of a filename.
Load Limits
Key access: [Limit] > {Recall Limits}
Recalls files previously saved containing the limit
parameters that may be frequently used for test
purposes.
138
N9340B User’s Guide
Agilent N9340B
Handheld Spectrum Analyzer
6
Error Messages
This chapter contains Error
Message information and
definitions used by the analyzer.
Agilent Technologies
139
6
Error Messages
Overview
If an improper operation occurs during the
instrument configuration, a message will appear on
the status line indicating the incident and the how
the spectrum analyzer corrected the setting
automatically. press [SYS] > {More} > {Show errors} to
read the specific descriptions of those messages.
Example
In this example, a failure explanation is generally
included with each error to further define its
meaning. The instrument messages in this guide
are listed numerically.
<Time>
07.01 15:48
<Code>
[F] -330
<Message>
No matched module
This message indicates no matched
measurement or mode found.
<Explanation in manual>
NO TE
140
A symbol [F] at the beginning of an error message indicates
this is an error caused by manual front panel operation. A
symbol [R] at the beginning of an error message indicates this
is an error caused by remote control mode.
N9340B User’s Guide
Error Messages
6
Error Message List
Please refer to the error messages list table as
below to find the corresponding message
description:
Error Error Message
Code
0
Description
No error
–410 Query INTERRUPTED
Indicates that a condition causing an
INTERRUPTED query occurred (see IEEE
488.2, 6.3.2.7)
–350 Query overflow
Indicates the SCPI remote interface
error queue overflowed.
–321 Out of memory
Indicates an internal operation needed
more memory than that was available.
–224 Illegal parameter
value
Indicates you sent a parameter for this
command that is NOT allowed.
–223 Too much data
Indicates a legal program data element
of block, expression or string type was
received that contained more data than
the device could handle due to related
device-specific requirements or memory.
–222 Data out of range
Indicates a legal data was parsed but
could not be executed because of the
interpreted value was outside the legal
range defined by the analyzer. The
displayed results may be clipped.
–220 No matched module
Indicates no matched measurement or
mode found.
–200 Execution error
This is a generic execution error for
devices that cannot detect more specific
errors. The code indicates on those
execution errors defined in IEEE 488.2,
11.5.1.1.4 has occurred.
–171 Invalid expression Indicates the data element was invalid,
for example, unmatched parentheses, or
an illegal character.
N9340B User’s Guide
141
6
Error Messages
Error Error Message
Code
Description
–144 Character data too
long
Indicates the character data contained
more than 12 characters. (see IEEE
488.2, 7.7.1.4)
764
Unable to save
file
Indicates a failure occurred while saving
a file. The file was not saved.
762
Unable to load
file
Indicates a failure occurred while loading a file. The file was not loaded.
612
File NOT found
Indicates the analyzer could not find the
specified file.
173
Lame package,
please upgrade
firmware
Indicates the current firmware is not
mostly updated. The firmware needs
upgrading.
172
Option install
fail, invalid
option licence
Indicates the option could not be
installed, because of the invalid option
licence.
171
File loaded
Indicates the file loading succeeded.
170
The menu is
unavailable in
this case
Indicates the memo is invalid in this
case.
166
Marker counter
opened in fast
sweep
Indicates the counter’s accuracy
decreases when in fast sweep mode.
162
Cannot open fast
Indicates current settings do not allow
sweep in this case you to open fast sweep. For example,
currently in FFT, zero span, or any measurement in power suite does not allow
fast sweep.
156
Incorrect
alignment file on
flash
Indicates an invalid alignment file.
153
RF EEPROM operate
fail
Indicates an error when writing alignment file.
152
Alignment file
oversize
Indicates the alignment file has error or
invalid data.
151
DSP boot fail
Indicates the analyzer cannot process
measurement currently, wait the
analyzer to reboot. If analyzer froze, try
to restart the analyzer.
142
N9340B User’s Guide
Error Messages
Error Error Message
Code
6
Description
150
Mixer overload
Indicates the first mixer in danger. Either
increase input attenuation or decrease
the input signal level.
149
Mixer saturate
Indicates you need to either increase
the input attenuation or decrease the
input signal level.
147
Incorrect
alignment data in
EEPROM
Indicates invalid alignment data
occurred.
143
Final IF overload
Indicates you need to either increase
the input attenuation or decrease the
input signal level.
138
USB device NOT
ready
Indicates the USB device is not
detected.
136
RBW limit to
30 kHz when in
fast sweep
Indicates the analyzer automatically
couple the RBW to 30 kHz when in fast
sweep mode.
130
Meas uncal
Indicates the measurement is uncalibrated due to fast sweeping through a
narrow RBW filter. Check the sweep
time, span, and bandwidth settings, or
use auto coupling.
119
RF Board Changed
Indicates the RF board was changed,
the analyzer needs re-load the alignment data.
116
Cannot communicate
with RF
Indicates the MCU cannot find the RF
board.
N9340B User’s Guide
143
6
144
Error Messages
N9340B User’s Guide
Agilent N9340B
Handheld Spectrum Analyzer
7
Troubleshooting
This chapter includes information on
how to check for a problem with
your Agilent Technologies spectrum
analyzer, and how to return it for
service.
If you experience a problem or would
like additional information about
your analyzer, Agilent Technologies’
worldwide organization is ready to
provide the support you need.
Agilent Technologies
145
7
Troubleshooting
Check the basics
This section includes information on how to check
for a problem with your Agilent spectrum analyzer,
and how to return it for service.
If you experience a problem or would like
additional information about your analyzer, Agilent
Technologies’ worldwide organization is ready to
provide the support you need.
WA RN ING
No operator serviceable parts inside. Refer servicing to
qualified personnel. To prevent electrical shock, do not
remove covers.
• Before calling Agilent Technologies, or returning
an analyzer for service, perform the quick checks
listed below. This check may eliminate the problem.
• Is there power at the receptacle?
• Is the analyzer turned on? Listen for internal fan
noise to determine if the analyzer cooling fan is
running. Feel the rear side of the analyzer for
air flow.
• If other equipment, cables, and connectors are
being used with your spectrum analyzer, make
sure they are connected properly and operating
correctly.
• Review the measurement procedures being performed when the problem first appeared. Make
sure all of the settings are correct.
• If the analyzer is not functioning as expected,
return the analyzer to a known state by pressing
Preset (Default Preset Type).
• Is the measurement being performed, and the
results that are expected, within the specifications and capabilities of the analyzer? Refer to
the Technical Overview for your analyzer.
• Is the analyzer displaying an error message? If
so, refer to “Error Messages" on page 139.
146
N9340B User’s Guide
Troubleshooting
7
• To meet specifications, the analyzer must be
aligned. For more information on how to align
the analyzer, refer to “Running Internal
Alignments" on page 23.
NO TE
If the analyzer is still under warranty or is covered by a
maintenance contract, it will be repaired under the terms of
the warranty or plan (the warranty is located at the front of
this manual).
If the analyzer is no longer under warranty or is not covered by
an Agilent Technologies maintenance plan, Agilent
Technologies will notify you of the cost of the repair after
examining the analyzer.
If a problem persists, please contact the Agilent
Technologies office for further information and service.
Warranty and Service Options
Agilent N9340B handheld spectrum analyzer
provides 1- year return- to- Agilent warranty as
standard. Besides, we offers several optional
maintenance plans to service your analyzer after
the warranty has expired:
R- 51B- 001- 3C
extends this service to 3 years.
R- 50C- 011- 3 Agilent calibration upfront support
plan, 3- year coverage.
The calibration cycle of N9340B Handheld spectrum analyzer is one year.
N9340B User’s Guide
147
7
Troubleshooting
Contact Agilent Technologies
Agilent has Sales and Service Offices around the
world to provide you with complete support.
Go to http://www.agilent.com/find/assist for help with:
• product selection, configuration, and purchases.
• technical and application assistance, and
consulting.
• rental and leasing options, and refurbished
equipment.
• repair, calibration, education and training.
If you do not have access to the internet, call the
appropriate number shown below. Or contact your
local Agilent Technologies Sales and Service Office.
148
United States
(tel) 800 829 4444
(fax) 800 829 4433
Canada
(tel) 877 894 4414
(fax) 800 746 4866
Latin America
(tel) +1 (305) 269 7500
China
(tel) 800 810 0189
(fax) 800 820 2816
Korea
(tel) 080 769 0800
(fax) 080 769 0900
Japan
(tel) +81 426 56 7832
(fax) +81 426 56 7840
Taiwan
(tel) 0800 047 866
(fax) 0800 286 331
Europe
(tel) +31 20 547 2111
Australia
(tel) 1 800 629 485
(fax) +61 (3) 9210 5947
Other Asia Pacific
Countries
(tel) +65 6375 8100
(fax) +65 6755 0042
Email: [email protected]
N9340B User’s Guide
Agilent N9340B
Handheld Spectrum Analyzer
8
Menu Map
This chapter contains menu maps
that visually present the menus
and submenus that are accessed by
pressing the Hardkeys and Softkey
menu selections in the instrument.
This is a quick reference guide for
the experienced user.
Agilent Technologies
149
8
Menu Map
AMPTD
AMPTD
Ref level
Attenuation
Auto Man
Preamp
Off On
Scale/DIV >
1 dB/DIV
Scale Type
Log Lin
HiSensitivity
Off
On
2 dB/DIV
5 dB/DIV
10 dB/DIV
More
Ref Offset
Y Axis Unit
dBm
EMF Mode
Off On
dBmV
Grid Scale
Off On
150
dBuV
W
V
N9340B User’s Guide
Menu Map
8
BW/SWP
BW/SWP
RBW
Auto Man
VBW
Auto Man
VBW/RBW
Auto Man
Avg Type
Log Pwr
Sweep Time
Auto Man
Voltage
Power
Sweep
Single Sweep
Sweep
Single Cont
Sweep Mode
Normal Fast
TD Mode
Off
On
N9340B User’s Guide
151
8
Menu Map
FREQ
Freq
Center Freq
Start Freq
Stop Freq
CF Step
Auto Man
Channel STD>
Standard
Off On
Freq Offset
Load STD >
<Chan name>
STD Type
System User
Channel
Fwd Rev
Load Now
Channel Step
Copy
Delete
152
N9340B User’s Guide
Menu Map
8
MARKER
Marker
Marker
123456
Normal
Delta
Peak
Next Left PK
Next Right PK
6 Peaks Search
Off On
Off
Peak Search >
Marker To >
To Center
More
1 of 2
To Ref
Mode >
Marker Trace
All Ref Preset
Normal
Freq Count
Noise
Band Power
All Off
Marker Table
Off On
Trace 1
Trace 2
Trace 3
Trace 4
N9340B User’s Guide
153
8
Menu Map
MEAS
Center Freq
MEAS
Int BW
Measure Off
Channel Power
Channel BW
Center Freq
Main Channel
ACPR
OBW
Spectrogram
Run Pause
Restart Meas
Update Int.
Off
On
Spectrg View
Spectrogram
SEM
More
Palette
Color
Adj Channel
Channel Space
Method
Percent dBc
%
dBc
Avg Number
Meas Type
Gray
Display Mode
Ref Channel
Save&Load
Offset/Limit
Fail Setting
FieldStrength
154
AntennaTable
N9340B User’s Guide
Menu Map
8
MODE - IBOC Measurement
MODE
IBOC Measur ement
AM
Center Freq
AM >
<val ue>
FM >
FM
Mask Span
Mask Span
AM Band
F M Band
Quick Span >
AM Channel
Mask Function >
FM Channel
<Analog >
<Analog >
AM Channel
Channel
FM Channel
<IBOC >
<IBOC >
Aut o Tune
Tune Range
Ba nd
Spa n
Return
AM
Mask Type >
<Analog >
On
Off
Mask
Pass /Fail
On
On
On
Off
Beep
Off
Noise Cancel
Of f
Retur n
N9340B User’s Guide
Ret urn
Return
FM
AM-73.44
<Ana log >
NRSC - 5- B
<Hybrid 5 kHz >
NRSC -5- B
<Hybrid 8 kHz >
NRSC -5- B
<All Digital >
Limit
FM- 73.317
<Ana log >
NRSC - 5- B
<Hybrid >
System
AM or F M
Custom
User
Load Now
NRSC - 5- A
<All Digital >
Custom >
Custom >
Ret urn
Return
Return
155
8
Menu Map
MODE - Tracking Generator
MODE
Spectrum
Analyzer
Power Meter
Tracking
Generaotr
Amplitude
Off On
Source
Amptd Step
Demodulation
Analysis
Amptd Offset
IBOC
Measurement
Normalize
xDSL
Measurement
Store Ref
1->4
Normalize
Off On
Norm Ref Lvl
Norm Ref Posn
Ref Trace
Blank View
156
N9340B User’s Guide
Menu Map
8
MODE - Power Meter
M ODE
Zero ing
Power Meter
Zero Type
INT
EXT
Zeroing
Disp Ran ge
Meas Disp
Meas Setup
Preset
Resolution
1234
Disp Mode
M eter Chart
Auto Range
Ch art View
Range
Lower Upper
Con tinu e
Re tu rn
Freq
Limits
On Off
Upper Limit
Power Range
Lower Limit
Limits
Limit Beep
On Off
Rel/Offset
Average
M eas Inte rval
Return
Rel
On Off
Offset
On Off
Average
On Off
Avg count
On Off
Step Detect
On Off
N9340B User’s Guide
157
8
Menu Map
MODE - Demodulation Analysis (AM/FM)
MO DE
Demodula tion Ana lysis
AM
FM
C arrie r Freq
Auto S cal e
On
IF BW
EqLP F
Pe ak+
O ff
Re f Va lue
Pea k-
Ref P osi ti on
Pe ak+ -/2
L eft
De tec tor
Sca le /DIV
X Scal e
* Ext Gain
R MS
Pea k Hold
Y Sca le
On
Re turn
M ore
Ca rrFreq Ste p
Ave rage
On
O ff
C arrPow U pr
L imits
Auto Ca rrF req
A M D ep t h L ow /
Fr eqD ev Low
O ff
Sw e ep
Si ngl e
C ont
Atte nuation
O ff
A M D e pt h U p/
Fr e qD e v U p
On
Return
Limit
On
O ff
Prea mp
On
Of f
C arrFre Off U p
Single
More
More
* Ext Gain is only available in Y Scale submenu.
158
N9340B User’s Guide
Menu Map
8
MODE - Demodulation Analysis (ASK/FSK)
MO DE
Demodula tion Ana lysis
ASK
FSK
Ca rrier Freq
Auto S cal e
On
Sy mbol R ate
F ilter Setup
Symbol
Mea s F ilter
Re f Va lue
W aveform
Ref Fil ter
Ref P osi ti on
ASK/F SK Error
Alpha /BbT
O ff
L e ft
View
Sca le/DIV
X Scal e
* Ext Gain
Eye Dia gra m
Filter Symbols
Y Sca le
Return
More
Meas Length
Average
On
O ff
Trig ger
Limi ts
Sweep
Si ngl e
C ont
Return
Limit
On
Free Run
O ff
C arrPow Upr
RF Trigger
ASK Dep th U p/
Fr eqD ev U p
Ext Ris e
ASK D epth Lo w/
Fr eqD ev Lo w
Ext Fa ll
Ca rrFreOff Up
Trig Delay
On
CarrFre q Step
Auto C arrFreq
On
Of f
Attenuation
A uto
M an
Prea mp
On
Of f
O ff
Single
More
More
* Ext Gain is only available in Y Scale submenu.
N9340B User’s Guide
159
8
Menu Map
MODE - xDSL
MODE
xDSL
Measurement
Spectrogram
Run Pause
Restart Meas
Update Int.
Off On
Home
Play
Page Up
Stop
Page Down
Direction
Down Up
End
Update Int.
Off On
Playback
Spectrg View
Palette
Color Gray
Disp Mode
Save & Load
Spctrg
Trace
Spctrg & Trace
Time Save
Off On
Start Save
Timed Setting
File Type
Start Date
File Setup
File Name
Start Time
Save RAM
File Path
Local USB
Stop Date
Save RAM As
File Size
Stop Time
Load Spctrg
160
N9340B User’s Guide
Menu Map
8
SPAN
SPAN
Span
Full Span
Zero Span
Last Span
AM
Off On
FM
Off On
Speaker Vol
Delay Time
Demod
*Trigger
Free Run
Video
Ext Rise
Ext Fall
Trig Delay
Off
On
*The trigger menu is available when span is set to zero span.
N9340B User’s Guide
161
8
Menu Map
SYS
SYS
Brightness
View
Local USB
Copy
Delete
Save
File >
Load Now
Setting >
File Setup
Language>
Screen Save
Key Backlight
General
Power On
Switch Timer
Power Off
PwrOn/Preset
Option
Add Option
Show Option
Input/Output
Trig Ref
IP Admin
Show System
Show Error
Front Panel
Calibration
Time Base
Upgrade
Firmware
More
2 of 3
SaveSYS Setup
LoadSYS Setup
Time/Date
Color Mode
Power Manager
Language
Key Beep
Off On
More
1 of 3
Diagnostic
File Type
Save Path
Local USB
Shortcut Type
Trace Screen
Power On
DFT User Last
Preset Type
DFT User Last
Save User
Trace
State
Screen
CSV
Limit
Setup
Backlight
LCD
All
Timer
Off On
Repeat Mode
Once Everyday
Time
Date
Ext Input
Trig Ref
Input Z Corr
50ohm 75ohm
Sys Name
IP Address
Static DCHP
Gateway
Subnet Mask
Apply
Load default
User Setup
LowFreqChannel
Off On
162
N9340B User’s Guide
Menu Map
8
TRACE
TRACE
Trace
1234
Clear Write
Max Hold
Min Hold
View
Normal
Average
Pos Peak
Blank
Sample
More
1 of 2
Neg Peak
Detector
Auto Man
Average
Off On
Avg Restart
Save Trace
Save As
Recall Trace
More
2 of 2
N9340B User’s Guide
163
8
Menu Map
Limit
LIMIT
Limit Line
Off On
Limit
Off On
Edit Limits
Limits Points
Limit Type
Upper Lower
Limits Offset
Beep
Off On
Save Limits
Limits Table
Limit
Limit
Fixed Rel
X Axis Unit
Freq Time
Load Limits
Limit
System User
Load Now
Copy
Delete
164
N9340B User’s Guide
Index
A
P
Adding Option, 29
Amplitude, 82
Attenuation, 82
Avg Type, 87
Peak Search, 97
Power Manager, 26
Preamp, 83
B
Battery, 16
C
CF Step, 94
Checking SYS Info, 19
D
Display Adjustment, 26
E
ESC/CLR, 92
Ext Input, 28
F
File Type, 32
Firmware Upgrading, 28
Frequency, 2, 93
Front Panel, 5
I
Instrument Markings, 8
ISM1-A, 8
R
Reference Level, 82
Reference Offset, 84
Res BW, 86
S
Saving a file, 33
Saving a trace, 34
Scale Type, 83
Scale/Div, 83
Setting Key Beep, 26
Show Error, 30
Show SYS Info, 30
Single Sweep, 91
Span, 128
Sweep Mode, 90
Sweep Time, 89
T
Testing Buttons, 19
Time Base Calibration, 30
Top Panel, 7
Trace, 132
Tracking Generator, 55
V
Limit Line, 137
Limit Pattern, 137
Loading a file, 35
VBW, 86
View Multi-signals, 38
Viewing Close Signals, 39
Viewing Small Signal, 42
Viewing TOI Distortion, 52
M
W
Marker, 95
Marker Delta, 96
Marker To, 98
Measuring ACPR, 101
Measuring OBW, 100
WEEE, 8
L
Y
Y Axis Units, 84
165
166
DECLARATION OF CONFORMITY
According to EN ISO/IEC 17050-1:2004
Manufacturer’s Name:
Agilent Technologies (Chengdu) Co., Ltd.
Manufacturer’s Address:
No. 116, 1st Street Tuo Xin West
Chengdu Hi-Tech Industrial Development Zone (South),
Chengdu, 610041, China
Declares under sole responsibility that the product as originally delivered
Product Name:
Model Number:
Product Options:
Handheld Spectrum Analyzer
N9340B
This declaration covers all options of the above product(s)
complies with the essential requirements of the following applicable European Directives, and
carries the CE marking accordingly:
Low Voltage Directive 2006/95/EC
EMC Directive 2004/108/EC
and conforms with the following product standards:
EMC
Standard
Limit
IEC 61326-2-1:2005 / EN 61326-2-1:2006
Reference Standards
CISPR 11:2003 / EN 55011:2007
IEC 61000-4-2:2001 / EN 61000-4-2
IEC 61000-4-3:2002 / EN 61000-4-3
IEC 61000-4-4:2004 / EN 61000-4-4
IEC 61000-4-5:2001 / EN 61000-4-5
IEC 61000-4-6:2003 / EN 61000-4-6
IEC 61000-4-11:2004 / EN 61000-4-11
Class A Group 1
4 kV/4 kV contact/air
3 V/m, 80-2000 MHz, 1 V/m, 2-2.7 GHz
0.5 kV signal lines, 1 kV power lines
0.5 kV line-line, 1 kV line-ground
3 V, 0.15-80 MHz
1 cycle, >95%
Canada: ICES/NMB-001:2006
Australia/New Zealand: AS/NZS CISPR 11:2004
The product was tested in a typical configuration with Agilent Technologies test systems.
Safety
IEC 61010-1:2001 / EN 61010-1:2001
Canada: CAN/CSA-C22.2 No. 61010-1-04,
USA: ANSI/UL 61010-1:2004,
Supplementary Information:
This DoC applies to above-listed products placed on the EU market after:
Sep 28, 2009
Date
Shi Wen
Quality Manager
For further information, please contact your local Agilent Technologies sales office, agent or distributor,
or Agilent Technologies Deutschland GmbH, Herrenberger Straße 130, D 71034 Böblingen, Germany.
N9340B
Rev 3.0
www.agilent.com
© Agilent Technologies, Inc. 2008-2009
Printed in China
July 2009
*N9340-90008*
N9340-90008
!"