1
Red Hat CloudForms 3.0
Management Engine 5.2 Insight
Guide
Discovery, Reporting, Capacity and Utilization
Red Hat CloudForms Documentation Team
Red Hat CloudForms 3.0 Management Engine 5.2 Insight Guide
Discovery, Reporting, Capacity and Utilization
Red Hat Clo udFo rms Do cumentatio n Team
Legal Notice
Co pyright © 20 15 Red Hat.
This do cument is licensed by Red Hat under the Creative Co mmo ns Attributio n-ShareAlike 3.0
Unpo rted License. If yo u distribute this do cument, o r a mo dified versio n o f it, yo u must pro vide
attributio n to Red Hat, Inc. and pro vide a link to the o riginal. If the do cument is mo dified, all Red
Hat trademarks must be remo ved.
Red Hat, as the licenso r o f this do cument, waives the right to enfo rce, and agrees no t to assert,
Sectio n 4 d o f CC-BY-SA to the fullest extent permitted by applicable law.
Red Hat, Red Hat Enterprise Linux, the Shado wman lo go , JBo ss, MetaMatrix, Fedo ra, the Infinity
Lo go , and RHCE are trademarks o f Red Hat, Inc., registered in the United States and o ther
co untries.
Linux ® is the registered trademark o f Linus To rvalds in the United States and o ther co untries.
Java ® is a registered trademark o f Oracle and/o r its affiliates.
XFS ® is a trademark o f Silico n Graphics Internatio nal Co rp. o r its subsidiaries in the United
States and/o r o ther co untries.
MySQL ® is a registered trademark o f MySQL AB in the United States, the Euro pean Unio n and
o ther co untries.
No de.js ® is an o fficial trademark o f Jo yent. Red Hat So ftware Co llectio ns is no t fo rmally
related to o r endo rsed by the o fficial Jo yent No de.js o pen so urce o r co mmercial pro ject.
The OpenStack ® Wo rd Mark and OpenStack Lo go are either registered trademarks/service
marks o r trademarks/service marks o f the OpenStack Fo undatio n, in the United States and o ther
co untries and are used with the OpenStack Fo undatio n's permissio n. We are no t affiliated with,
endo rsed o r spo nso red by the OpenStack Fo undatio n, o r the OpenStack co mmunity.
All o ther trademarks are the pro perty o f their respective o wners.
Abstract
This guide pro vides instructio ns o n using disco very, analysis, repo rting, and capacity and
utilizatio n features in Clo udFo rms Management Engine. Info rmatio n and pro cedures in this
bo o k are relevant to Clo udFo rms Management Engine administrato rs.
T able of Cont ent s
T able of Contents
.Preface
. . . . . . . . . . . . . . . . . . . . . . . . . . . . . . . . . . . . . . . . . . . . . . . . . . . . . . . . . . . . . . . . . . . . . . . . . . . . . . . . . . . . 7. . . . . . . . . .
1. Do c ument Co nventio ns
7
1.1. Typ o g rap hic Co nventio ns
7
1.2. Pull-q uo te Co nventio ns
8
1.3. No tes and Warning s
9
2 . G etting Help and G iving Feed b ac k
9
. .hapt
C
. . . .er
. .1. .. Int
. . .roduct
. . . . . .ion
. . .t.o. Red
. . . . Hat
. . . . CloudForms
. . . . . . . . . . . . . . . . . . . . . . . . . . . . . . . . . . . . . . . . . . . . . . . . . . . .1. 1. . . . . . . . . .
1.1. Arc hitec ture
11
1.2. Req uirements
12
1.3. Termino lo g y
13
1.4. Ab o ut this G uid e
16
. .hapt
C
. . . .er
. .2. .. Common
. . . . . . . . Infrast
. . . . . . ruct
. . . .ure
. . . and
. . . .Cloud
. . . . . .Cont
. . . .rols
. . . . . . . . . . . . . . . . . . . . . . . . . . . . . . . . . . . . . . .1. 8. . . . . . . . . .
2 .1. Chang ing Views
2 .2. So rting Infras truc ture Items
2 .3. Creating an Infras truc ture Rep o rt
2 .4. Searc hing b y Name
2 .5. Ad vanc ed Searc hing
2 .5.1. Searc hing fo r Infras truc ture Items with Ad vanc ed Searc h
2 .5.2. Saving an Ad vanc ed Searc h
2 .5.3. Lo ad ing a Rep o rt Filter o r Searc h Exp res s io n
18
19
19
19
20
20
22
22
. .hapt
C
. . . .er
. .3.
. .Infrast
. . . . . .ruct
. . . ure
. . . . . . . . . . . . . . . . . . . . . . . . . . . . . . . . . . . . . . . . . . . . . . . . . . . . . . . . . . . . . . . . .2. 4. . . . . . . . . .
3 .1. Pro vid ers
24
3 .1.1. Ad d ing a Pro vid er
24
3 .1.2. Dis c o vering Pro vid ers
25
3 .1.3. Authentic ating VMware vCenter Ho s ts
25
3 .1.4. Refres hing Pro vid ers
26
3 .1.5. Tag g ing Multip le Pro vid ers
26
3 .1.6 . Viewing a Pro vid er
26
3 .1.7. Ed iting Pro vid er Info rmatio n
27
3 .1.8 . Remo ving Pro vid ers
28
3 .1.9 . Viewing the Pro vid er Timeline
28
3 .1.10 . Viewing Ho s ts and Clus ters
29
.1.11. Viewing Virtual Mac hines and Temp lates
3
3 .2. Clus ters
3 .2.1. Perfo rming SmartState Analys is o n Clus ters
3 .2.2. Co mp aring Clus ters
3 .2.2.1. Creating a Clus ter Co mp aris o n Rep o rt
3 .2.3. Viewing a Clus ter
3 .2.4. Tag g ing Clus ters
3 .2.5. Viewing Cap ac ity and Utiliz atio n Charts fo r a Clus ter
3 .2.6 . Viewing Clus ter Timeline
3 .2.7. Detec ting Drift o n Clus ters
3 .2.8 . Creating a Drift Rep o rt fo r Clus ters
3 .2.9 . Remo ving Clus ters
3 .3. Ho s ts
3 .3.1. Filtering Ho s ts
3 .3.1.1. Setting a Default Ho s t Filter
3 .3.1.2. Creating a Ho s t Filter
3 .3.2. Perfo rming SmartState Analys is o n Ho s ts
3 .3.3. Co mp aring Ho s ts
30
30
31
31
32
33
34
34
35
36
37
37
38
39
39
39
39
40
1
Red Hat CloudForms 3.0 Management Engine 5.2 Insight G uide
3 .3.3. Co mp aring Ho s ts
40
3 .3.3.1. Ho s t Co mp aris o n Sec tio ns
41
3 .3.3.2. Us ing the Ho s t Co mp aris o n Sec tio ns
41
3 .3.3.3. Creating a Ho s t Co mp aris o n Rep o rt
3 .3.4. Refres hing Multip le Ho s ts
42
42
3 .3.5. Dis c o vering Multip le Ho s ts
3 .3.6 . Ad d ing a Sing le Ho s t
3 .3.7. Ed iting Ho s ts
3 .3.8 . Viewing a Ho s t
3 .3.9 . Tag g ing Multip le Ho s ts
3 .3.10 . Remo ving Ho s ts
3 .3.11. Refres hing Relatio ns hip s and Po wer States fo r a Ho s t
3 .3.12. Viewing Cap ac ity and Utiliz atio n Charts fo r a Ho s t
3 .3.13. Viewing the Ho s t Timeline
3 .3.14. Ho s t Virtual Summary
3 .3.15. Viewing Ho s t Devic e Info rmatio n
3 .3.16 . Viewing Ho s t Netwo rk Info rmatio n
3 .3.17. Viewing Sto rag e Ad ap ters
42
43
44
45
46
47
47
47
49
49
51
51
52
3 .3.18 . Detec ting Drift o n Ho s ts
3 .3.19 . Creating a Drift Rep o rt fo r Ho s ts
3 .4. Virtual Mac hines
52
53
54
3 .4.1. Filtering Virtual Mac hines and Temp lates
3 .4.1.1. Creating a Virtual Mac hine o r Temp late Filter
56
56
3 .4.1.2. Lo ad ing a Rep o rt Filter o r Searc h Exp res s io n
3 .4.2. Chang ing Views fo r Virtual Mac hines and Temp lates
58
59
3 .4.3. So rting Virtual Mac hines and Temp lates
3 .4.4. Creating a Virtual Mac hine o r Temp late Rep o rt
59
60
3 .4.5. Searc hing fo r Virtual Mac hines o r Temp lates
3 .4.6 . Analyz ing Virtual Mac hines and Temp lates
3 .4.6 .1. Red Hat Enterp ris e Virtualiz atio n Prereq uis ites
60
61
61
3 .4.6 .1.1. SmartState Analys is o n Red Hat Enterp ris e Virtualiz atio n Manag er 3.1 and Ab o ve Sto rag e Sup p o rt No tes
61
3 .4.6 .1.2. SmartState Analys is o n Red Hat Enterp ris e Virtualiz atio n Manag er 3.0 - Sto rag e
Sup p o rt No tes
3 .4.6 .1.3. Up g rad es fro m Red Hat Enterp ris e Virtualiz atio n Manag er 3.0 to 3.1
3 .4.6 .2. VMware vSp here Prereq uis ites
3 .4.6 .2.1. Ins talling VMware VDDK o n Clo ud Fo rms Manag ement Eng ine
3 .4.7. Co mp aring Virtual Mac hines and Temp lates
3 .4.7.1. Virtual Mac hine and Temp lates Co mp aris o n Sec tio ns
3 .4.7.2. Us ing the Virtual Mac hine Co mp aris o n Sec tio ns
3 .4.7.3. Creating a Virtual Mac hine Co mp aris o n Rep o rt
2
62
63
64
64
65
66
67
67
3 .4.8 . Refres hing Virtual Mac hines and Temp lates
3 .4.9 . Extrac ting Running Pro c es s es fro m Virtual Mac hines and Temp lates
3 .4.10 . Setting O wners hip fo r Virtual Mac hines and Temp lates
68
68
68
3 .4.11. Remo ving Virtual Mac hines and Temp lates fro m the VMDB
3 .4.12. Tag g ing Virtual Mac hines and Temp lates
69
69
3 .4.13. Viewing Running Pro c es s es after Co llec tio n
3 .4.14. Ed iting Virtual Mac hine o r Temp late Pro p erties
70
70
3 .4.15. Setting O wners hip o f a Virtual Mac hine o r Temp late
3 .4.16 . Rig ht Siz ing a Virtual Mac hine
71
71
3 .4.17. Viewing Cap ac ity and Utiliz atio n Charts fo r a Virtual Mac hine
3 .4.18 . Viewing the Virtual Mac hine o r Temp late Timeline
3 .4.19 . Virtual Mac hine o r Temp late Summary
72
74
74
3 .4.20 . Viewing the O p erating Sys tem Pro p erties
78
T able of Cont ent s
3 .4.20 . Viewing the O p erating Sys tem Pro p erties
3 .4.21. Viewing Virtual Mac hine o r Temp late Snap s ho t Info rmatio n
78
78
3 .4.22. Viewing Us er Info rmatio n fo r a Virtual Mac hine o r Temp late
3 .4.23. Viewing G ro up Info rmatio n fo r a Virtual Mac hine o r Temp late
79
79
3 .4.24. Viewing G enealo g y o f a Virtual Mac hine o r Temp late
3 .4.25. Co mp aring G enealo g y o f a Virtual Mac hine o r Temp late
79
80
3 .4.26 . Tag g ing Virtual Mac hines o r Temp lates with a Co mmo n G enealo g y
3 .4.27. Detec ting Drift o n Virtual Mac hines o r Temp lates
80
80
3 .4.28 . Creating a Drift Rep o rt fo r a Virtual Mac hine o r Temp late
3 .4.29 . Viewing Analys is His to ry fo r a Virtual Mac hine o r Temp late
3 .4.30 . Viewing Dis k Info rmatio n fo r a Virtual Mac hine o r Temp late
82
82
83
.4.31. Viewing Event Lo g s fo r a Virtual Mac hine o r Temp late
3
3 .5. Res o urc e Po o ls
83
84
3 .5.1. Remo ving a Res o urc e Po o l
3 .5.2. Tag g ing a Res o urc e Po o l
84
84
3 .5.3. Viewing the Res o urc e Po o l Summary
3 .5.4. Res o urc e Po o ls Ac c o rd io n
84
85
3 .6 . Datas to res
3 .6 .1. Perfo rming SmartState Analys is o n Datas to res
3 .6 .2. Viewing a Datas to re
3 .6 .3. Tag g ing a Datas to re
3 .6 .4. Viewing Cap ac ity and Utiliz atio n Charts fo r a Datas to re
85
85
86
87
87
3 .6 .5. Remo ving a Datas to re
3 .7. Rep o s ito ries
88
88
3 .7.1. Ad d ing a Rep o s ito ry
3 .7.2. Ed iting a Rep o s ito ry
89
89
3 .7.3. Refres hing Multip le Rep o s ito ries
3 .7.4. Tag g ing Rep o s ito ries
90
90
3 .7.5. Viewing a Rep o s ito ry
3 .7.6 . Remo ving Rep o s ito ries
3 .7.7. PXE Servers
90
91
91
. .hapt
C
. . . .er
. .4. .. Clouds
. . . . . . . . . . . . . . . . . . . . . . . . . . . . . . . . . . . . . . . . . . . . . . . . . . . . . . . . . . . . . . . . . . . . . . . . . . 9. 3. . . . . . . . . .
4 .1. Pro vid ers
93
4 .1.1. Ad d ing O p enStac k Pro vid ers
4 .1.2. Ad d ing Amaz o n EC2 Pro vid ers
93
94
4 .1.3. Dis c o vering Amaz o n EC2 Clo ud Pro vid ers
94
4 .1.4. Refres hing Clo ud Pro vid ers
4 .1.5. Tag g ing Clo ud Pro vid ers
4 .1.6 . Remo ving Clo ud Pro vid ers
4 .1.7. Ed iting a Clo ud Pro vid er
4 .1.8 . Viewing a Clo ud Pro vid er' s Timeline
95
95
96
96
96
4 .2. Availab ility Zo nes
4 .2.1. Viewing an Availab ility Zo ne
4 .2.2. Viewing Availab ility Zo ne Relatio ns hip s
4 .3. Flavo rs
97
97
97
98
4 .3.1. Viewing a Flavo r
4 .3.2. Viewing Flavo r Relatio ns hip s
4 .4. Sec urity G ro up s
4 .4.1. Viewing Sec urity G ro up s
4 .4.2. Tag g ing Sec urity G ro up s
98
98
98
98
99
4 .5. Ins tanc es
4 .5.1. Filtering Ins tanc es and Imag es
4 .5.1.1. Us ing an Ins tanc e o r Imag e Filter
99
10 1
10 1
3
Red Hat CloudForms 3.0 Management Engine 5.2 Insight G uide
4 .5.1.1. Us ing an Ins tanc e o r Imag e Filter
4 .5.1.2. Creating an Ins tanc e o r Imag e Filter
10 1
10 2
4 .5.1.3. Lo ad ing a Rep o rt Filter o r Searc h Exp res s io n
4 .5.2. Chang ing Views fo r Ins tanc es and Imag es
4 .5.3. So rting Ins tanc es and Imag es
4 .5.4. Creating an Ins tanc e o r Imag e Rep o rt
4 .5.5. Searc hing fo r Ins tanc es o r Imag es
10 3
10 4
10 4
10 5
10 5
4 .5.6 . Analyz ing Ins tanc es and Imag es
4 .5.7. Co mp aring Ins tanc es and Imag es
4 .5.7.1. Creating an Ins tanc e Co mp aris o n Rep o rt
4 .5.8 . Refres hing Ins tanc es and Imag es
10 6
10 6
10 7
10 7
4 .5.9 . Extrac ting Running Pro c es s es fro m Ins tanc es and Imag es
4 .5.10 . Setting O wners hip fo r Ins tanc es and Imag es
4 .5.11. Remo ving Ins tanc es and Imag es fro m the VMDB
4 .5.12. Tag g ing Ins tanc es and Imag es
10 8
10 8
10 8
10 9
4 .5.13. Reviewing an Ins tanc e o r Imag e
4 .5.14. Ins tanc e and Imag e Tas kb ars
4 .5.15. Perfo rming SmartState Analys is o n an Ins tanc e o r Imag e
4 .5.16 . Viewing Running Pro c es s es after Co llec tio n
4 .5.17. Ed iting Ins tanc e o r Imag e Pro p erties
10 9
10 9
110
110
110
4 .5.18 . Rig ht Siz ing an Ins tanc e
4 .5.19 . Viewing Cap ac ity and Utiliz atio n Charts fo r an Ins tanc e
4 .5.20 . Viewing the Ins tanc e o r Imag e Timeline
4 .5.21. Ins tanc e o r Imag e Summary
111
111
112
113
4 .5.22. Chang ing the Summary View o f an Ins tanc e o r Imag e
4 .5.23. Viewing the O p erating Sys tem Pro p erties
4 .5.24. Viewing Us er Info rmatio n fo r an Ins tanc e o r Imag e
4 .5.25. Viewing G ro up Info rmatio n fo r an Ins tanc e o r Imag e
4 .5.26 . Viewing G enealo g y o f an Ins tanc e o r Imag e
113
114
115
115
115
4 .5.27. Detec ting Drift o n Ins tanc es o r Imag es
4 .5.28 . Creating a Drift Rep o rt fo r an Ins tanc e o r Imag e
4 .5.29 . Viewing Analys is His to ry fo r an Ins tanc e o r Imag e
4 .5.30 . Viewing Event Lo g s fo r an Ins tanc e o r Imag e
116
117
118
118
. .hapt
C
. . . .er
. .5.
. .Capacit
. . . . . . .y. Planning
. . . . . . . . . . . . . . . . . . . . . . . . . . . . . . . . . . . . . . . . . . . . . . . . . . . . . . . . . . . . . . . . .1.2. 0. . . . . . . . . .
5 .1. Cap ac ity and Utiliz atio n Co llec tio n
120
4
5 .1.1. As s ig ning the Cap ac ity and Utiliz atio n Server Ro les
5 .1.2. Data Co llec tio n fo r RHEVM 3.1
5 .1.3. Ad d ing Datab as e Cred entials fo r Data Co llec tio n
5 .1.4. Data Co llec tio n fo r Red Hat Enterp ris e Linux O p enStac k Platfo rm
5 .2. Data Co llec ted
120
120
121
122
122
5 .2.1. Cap ac ity and Utiliz atio n Charts fo r Ho s t, Clus ters , and Virtual Mac hines
5 .2.2. Cap ac ity and Utiliz atio n Charts fo r Datas to res
5 .3. Chart Features
5 .3.1. Zo o ming into a Chart
122
122
123
123
.3.2. Drilling into Chart Data
5
5 .4. O p timiz atio n
5 .5. Utiliz atio n Trend s
5 .5.1. Viewing Utiliz atio n Trend Summary
5 .5.2. Viewing Detail Lines o f a Utiliz atio n Trend
123
123
124
124
124
.5.3. Viewing a Rep o rt o f a Utiliz atio n Trend
5
5 .6 . Planning
5 .6 .1. Planning Where to Put a New Virtual Mac hine
5 .7. Bo ttlenec ks
125
125
125
127
T able of Cont ent s
5 .7.1. Viewing the Bo ttlenec k Summary
5 .7.2. Viewing a Rep o rt o f the Bo ttlenec ks Trend
127
128
. .hapt
C
. . . .er
. .6. .. Cloud
. . . . . .Int
. . elligence
. . . . . . . . . . . . . . . . . . . . . . . . . . . . . . . . . . . . . . . . . . . . . . . . . . . . . . . . . . . . . . . . .1.2. 9. . . . . . . . . .
6 .1. Das hb o ard
6 .1.1. Ad d ing a Wid g et
6 .1.2. Res etting to the Default Set o f Wid g ets
6 .1.3. Remo ving a Wid g et
6 .1.4. Zo o ming in to a Chart Wid g et
6 .1.5. O p ening a Chart o r Rep o rt Wid g et in Its O wn Wind o w
6 .1.6 . Minimiz ing o r Maximiz ing a Wid g et
6 .1.7. Do wnlo ad ing a Rep o rt Wid g et as a File
6 .2. Creating Das hb o ard Wid g ets
6 .2.1. Creating a Rep o rt Wid g et
6 .2.2. Creating a Chart Wid g et
6 .2.3. Creating an RSS Feed Wid g et
6 .2.4. Creating a Menu Wid g et
6 .2.5. Ed iting a Wid g et
6 .2.6 . Co p ying a Wid g et
6 .2.7. Deleting a Wid g et
6 .2.8 . G enerating Wid g et Co ntent Immed iately
6 .3. Rep o rts
6 .3.1. Running Rep o rts
6 .3.1.1. G enerating a Sing le Rep o rt
6 .3.1.2. Sc hed uling a Rep o rt
6 .3.1.3. Mo d ifying a Rep o rt Sc hed ule
129
129
129
129
130
130
130
130
130
131
132
133
134
135
135
135
135
136
136
137
137
139
.3.1.4. Running a Sc hed uled Rep o rt Immed iately
6
6 .3.2. Viewing Rep o rts
6 .3.2.1. Chang ing Rep o rt Views
6 .3.2.2. Rep o rt Do wnlo ad Butto ns
139
140
140
140
6 .3.2.3. Do wnlo ad ing a Rep o rt
6 .3.2.4. Sho wing a Rep o rt in Full Sc reen
6 .3.3. Ad d ing a Rep o rt
6 .3.4. Co p ying a Rep o rt
6 .3.5. Ed iting a Rep o rt
140
141
141
148
148
6 .3.6 . Deleting a Rep o rt
6 .3.7. Exp o rting a Rep o rt
6 .3.8 . Imp o rting a Rep o rt
6 .3.9 . Rep o rt Menus
148
149
149
149
6 .3.9 .1. Manag ing Rep o rt Menu Ac c o rd io ns
6 .3.9 .2. Manag ing Rep o rt Menu Fo ld ers
6 .3.9 .3. O rg aniz ing Rep o rts in Rep o rt Menus
.4. Us ag e
6
6 .4.1. Ac c es s ing Us ag e Data
150
151
152
153
153
6 .5. Charg eb ac k
6 .5.1. Charg eb ac k Rates
6 .5.2. Creating Charg eb ac k Rates
6 .5.3. As s ig ning Charg eb ac k Rates
153
154
154
154
6 .5.4. Creating a Charg eb ac k Rep o rt
6 .6 . Timelines
6 .6 .1. Ac c es s ing and Us ing a Timeline
6 .6 .2. Do wnlo ad ing a Timeline' s Data
155
156
156
157
6 .7. RSS
6 .7.1. RSS
157
157
5
Red Hat CloudForms 3.0 Management Engine 5.2 Insight G uide
6 .7.1. RSS
157
. . . . . . .able
Report
. . . .Fields
. . . . . in
. . .CloudForms
. . . . . . . . . . .Management
. . . . . . . . . . . Engine
. . . . . . . . . . . . . . . . . . . . . . . . . . . . . . . . . . . . . . . . . .1. 59
...........
. .hapt
C
. . . .er
. .7. .. Compiler
. . . . . . . .O
. .ut
. .put
. . . . . . . . . . . . . . . . . . . . . . . . . . . . . . . . . . . . . . . . . . . . . . . . . . . . . . . . . . . . .1.6. 4. . . . . . . . . .
. .ompiler
C
. . . . . . .G. lossary
. . . . . . . . . . . . . . . . . . . . . . . . . . . . . . . . . . . . . . . . . . . . . . . . . . . . . . . . . . . . . . . . . . . . . . . . .1.6. 9. . . . . . . . . .
. . . . . . . . .Hist
Revision
. . . ory
. . . . . . . . . . . . . . . . . . . . . . . . . . . . . . . . . . . . . . . . . . . . . . . . . . . . . . . . . . . . . . . . . . . . . . .1.7. 1. . . . . . . . . .
6
Preface
Preface
1. Document Convent ions
This manual uses several conventions to highlight certain words and phrases and draw attention to
specific pieces of information.
1.1. T ypographic Convent ions
Four typographic conventions are used to call attention to specific words and phrases. These
conventions, and the circumstances they apply to, are as follows.
Mo no -spaced Bo l d
Used to highlight system input, including shell commands, file names and paths. Also used to
highlight keys and key combinations. For example:
To see the contents of the file my_next_bestsel l i ng _no vel in your current
working directory, enter the cat my_next_bestsel l i ng _no vel command at the
shell prompt and press Enter to execute the command.
The above includes a file name, a shell command and a key, all presented in mono-spaced bold and
all distinguishable thanks to context.
Key combinations can be distinguished from an individual key by the plus sign that connects each
part of a key combination. For example:
Press Enter to execute the command.
Press C trl +Al t+F2 to switch to a virtual terminal.
The first example highlights a particular key to press. The second example highlights a key
combination: a set of three keys pressed simultaneously.
If source code is discussed, class names, methods, functions, variable names and returned values
mentioned within a paragraph will be presented as above, in mo no -spaced bo l d . For example:
File-related classes include fi l esystem for file systems, fi l e for files, and d i r for
directories. Each class has its own associated set of permissions.
Pro p o rt io n al B o ld
This denotes words or phrases encountered on a system, including application names; dialog-box
text; labeled buttons; check-box and radio-button labels; menu titles and submenu titles. For
example:
Choose Syst em → Pref eren ces → Mo u se from the main menu bar to launch
Mo u se Pref eren ces. In the Butto ns tab, select the Left-hand ed mo use check
box and click C l o se to switch the primary mouse button from the left to the right
(making the mouse suitable for use in the left hand).
To insert a special character into a g ed it file, choose Ap p licat io n s →
Accesso ries → C h aract er Map from the main menu bar. Next, choose Search →
Fin d … from the C h aract er Map menu bar, type the name of the character in the
Search field and click Next. The character you sought will be highlighted in the
7
Red Hat CloudForms 3.0 Management Engine 5.2 Insight G uide
C haracter T abl e. D ouble-click this highlighted character to place it in the T ext
to co py field and then click the C o py button. Now switch back to your document
and choose Ed it → Past e from the g ed it menu bar.
The above text includes application names; system-wide menu names and items; application-specific
menu names; and buttons and text found within a GUI interface, all presented in proportional bold
and all distinguishable by context.
Mono-spaced Bold Italic or Proportional Bold Italic
Whether mono-spaced bold or proportional bold, the addition of italics indicates replaceable or
variable text. Italics denotes text you do not input literally or displayed text that changes depending
on circumstance. For example:
To connect to a remote machine using ssh, type ssh username@ domain.name at a
shell prompt. If the remote machine is exampl e. co m and your username on that
machine is john, type ssh jo hn@ exampl e. co m.
The mo unt -o remo unt file-system command remounts the named file system.
For example, to remount the /ho me file system, the command is mo unt -o remo unt
/ho me.
To see the version of a currently installed package, use the rpm -q package
command. It will return a result as follows: package-version-release.
Note the words in bold italics above: username, domain.name, file-system, package, version and
release. Each word is a placeholder, either for text you enter when issuing a command or for text
displayed by the system.
Aside from standard usage for presenting the title of a work, italics denotes the first use of a new and
important term. For example:
Publican is a DocBook publishing system.
1.2. Pull-quot e Convent ions
Terminal output and source code listings are set off visually from the surrounding text.
Output sent to a terminal is set in mo no -spaced ro man and presented thus:
books
books_tests
Desktop
Desktop1
documentation drafts mss
downloads
images notes
photos
scripts
stuff
svgs
svn
Source-code listings are also set in mo no -spaced ro man but add syntax highlighting as follows:
static int kvm_vm_ioctl_deassign_device(struct kvm *kvm,
struct kvm_assigned_pci_dev *assigned_dev)
{
int r = 0;
struct kvm_assigned_dev_kernel *match;
mutex_lock(& kvm->lock);
match = kvm_find_assigned_dev(& kvm->arch.assigned_dev_head,
assigned_dev->assigned_dev_id);
if (!match) {
printk(KERN_INFO "%s: device hasn't been assigned
8
Preface
before, "
"so cannot be deassigned\n", __func__);
r = -EINVAL;
goto out;
}
kvm_deassign_device(kvm, match);
kvm_free_assigned_device(kvm, match);
o ut:
mutex_unlock(& kvm->lock);
return r;
}
1.3. Not es and Warnings
Finally, we use three visual styles to draw attention to information that might otherwise be overlooked.
Note
Notes are tips, shortcuts or alternative approaches to the task at hand. Ignoring a note should
have no negative consequences, but you might miss out on a trick that makes your life easier.
Important
Important boxes detail things that are easily missed: configuration changes that only apply to
the current session, or services that need restarting before an update will apply. Ignoring a
box labeled “ Important” will not cause data loss but may cause irritation and frustration.
Warning
Warnings should not be ignored. Ignoring warnings will most likely cause data loss.
2. Get t ing Help and Giving Feedback
If you experience difficulty with a procedure described in this documentation, visit the Red Hat
Customer Portal at http://access.redhat.com. Through the customer portal, you can:
search or browse through a knowledgebase of technical support articles about Red Hat products
submit a support case to Red Hat Global Support Services (GSS)
access other product documentation
9
Red Hat CloudForms 3.0 Management Engine 5.2 Insight G uide
Red Hat also hosts a large number of electronic mailing lists for discussion of Red Hat software and
technology. You can find a list of publicly available mailing lists at
https://www.redhat.com/mailman/listinfo. Click on the name of any mailing list to subscribe to that list
or to access the list archives.
D o cu men t at io n Feed b ack
If you find a typographical error in this manual, or if you have thought of a way to make this manual
better, please submit a report to GSS through the customer portal.
When submitting a report, be sure to mention the manual's identifier: Insight Guide
If you have a suggestion for improving the documentation, try to be as specific as possible when
describing it. If you have found an error, please include the section number and some of the
surrounding text so we can find it easily.
10
Chapt er 1 . Int roduct ion t o Red Hat CloudForms
Chapter 1. Introduction to Red Hat CloudForms
Red Hat CloudForms Management Engine delivers the insight, control, and automation enterprises
need to address the challenges of managing virtual environments. This technology enables
enterprises with existing virtual infrastructures to improve visibility and control, and those starting
virtualization deployments to build and operate a well-managed virtual infrastructure.
Red Hat CloudForms 3.0 is comprised of a single component, the CloudForms Management Engine.
It has the following feature sets:
Insight: D iscovery, Monitoring, Utilization, Performance, Reporting, Analytics, Chargeback, and
Trending.
Control: Security, Compliance, Alerting, and Policy-Based Resource, and Configuration
Enforcement.
Automate: IT Process, Task and Event, Provisioning, and Workload Management and
Orchestration.
Integrate: Systems Management, Tools and Processes, Event Consoles, Configuration
Management D atabase (CMD B), Role-based Administration (RBA), and Web Services.
1.1. Archit ect ure
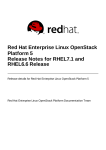
The diagram below describes the capabilities of Red Hat CloudForms Management Engine. Its
features are designed to work together to provide robust management and maintenance of your
virtual infrastructure.
Fig u re 1.1. Feat u res
The architecture comprises the following components:
11
Red Hat CloudForms 3.0 Management Engine 5.2 Insight G uide
The CloudForms Management Engine Appliance (Appliance) which is supplied as a secure, highperformance, preconfigured virtual machine. It provides support for Secure Socket Layer (SSL)
communications.
The CloudForms Management Engine Server (Server) resides on the Appliance. It is the software
layer that communicates between the SmartProxy and the Virtual Management D atabase. It
includes support for Secure Socket Layer (SSL) communications.
The Virtual Management D atabase (VMD B) resides either on the Appliance or another computer
accessible to the Appliance. It is the definitive source of intelligence collected about your Virtual
Infrastructure. It also holds status information regarding Appliance tasks.
The CloudForms Management Engine Console (Console) is the Web interface used to view and
control the Server and Appliance. It is consumed through Web 2.0 mash-ups and web services
(WS Management) interfaces.
The SmartProxy can reside on the Appliance or on an ESX Server. If not embedded in the Server,
the SmartProxy can be deployed from the Appliance. Each storage location must have a
SmartProxy with visibility to it. The SmartProxy acts on behalf of the Appliance communicating
with it over HTTPS (SSL) on standard port 443.
1.2. Requirement s
To use CloudForms Management Engine, the following requirements must be met:
One of the following web browsers:
Mozilla Firefox for versions supported under Mozilla's Extended Support Release (ESR) [1]
Internet Explorer 8 or higher
Google Chrome for Business
A monitor with minimum resolution of 1280x1024.
Adobe Flash Player 9 or above. At the time of publication, you can access it at
http://www.adobe.com/products/flashplayer/.
The CloudForms Management Engine Appliance must already be installed and activated in your
enterprise environment.
The SmartProxy must have visibility to the virtual machines and cloud instances that you want to
control.
The resources that you want to control must have a SmartProxy associated with them.
R eg io n s an d Z o n es
Use reg i o ns for centralizing data which is collected from public and private virtualization
environments. A region is ultimately represented as a single database for the VMD B. Regions are
particularly useful when multiple geographical locations need to be managed as they enable all the
data collection to happen at each particular location and avoids data collection traffic across slow
links between networks.
When multiple regions are being used, each with their own unique ID , a master region can be created
to centralize the data of all the children regions into a single master database. To do this, configure
each child region to replicate its data to the master region database (Red Hat recommends use of
region 99). This parent and child region is a one-to-many relationship.
12
Chapt er 1 . Int roduct ion t o Red Hat CloudForms
Regions can contain multiple zones, which in turn contain appliances. Z ones are used for further
segregating network traffic along with enabling failover configurations. Each appliance has the
capability to be configured for a number of specialized server roles. These roles are limited to the
zone containing the appliance they run on.
Only one failover type of each server role can run in a zone. If multiple appliances have the same
failover role, the extras are used as backups that activate only if the primary appliance fails. Nonfailover server roles can run on multiple appliances simultaenously in a zone, so resources can be
adjusted according to the workload those roles are responsible for.
Note
Replicating a parent region to a higher-level parent is not supported.
Parent region can be configured after the child regions are online.
Important
D ue to browser limitations, Red Hat supports logging in to only one tab for each multi-tabbed
browser. Console settings are saved for the active tab only. For the same reason, CloudForms
Management Engine does not guarantee that the browser's Back button will produce the
desired results. Red Hat recommends using the breadcrumbs provided in the Console.
1.3. T erminology
T h e f o llo win g t erms are u sed t h ro u g h o u t t h is d o cu men t . R eview t h em b ef o re
p ro ceed in g .
Acco u n t R o le
A designation assigned to a user allowing or restricting a user to parts and functions of the
CloudForms Management Engine console.
Act io n
An execution that is performed after a condition is evaluated.
Alert
CloudForms Management Engine alerts notify administrators and monitoring systems of
critical configuration changes and threshold limits in the virtual environment. The
notification can take the form of either an email or an SNMP trap.
An alysis Pro f ile
A customized scan of hosts, virtual machines, or instances. You can collect information
from categories, files, event logs, and registry entries.
C lo u d
A pool of on-demand and highly available computing resources. The usage of these
resources are scaled depending on the user requirements and metered for cost.
13
Red Hat CloudForms 3.0 Management Engine 5.2 Insight G uide
C lo u d Fo rms Man ag emen t En g in e Ap p lian ce
A virtual machine on which the virtual management database (VMD B) and CloudForms
Management Engine server reside.
C lo u d Fo rms Man ag emen t En g in e C o n so le
A web-based interface into the CloudForms Management Engine Appliance.
C lo u d Fo rms Man ag emen t En g in e R o le
A designation assigned to a CloudForms Management Engine server that defines what a
CloudForms Management Engine server can do.
C lo u d Fo rms Man ag emen t En g in e Server
The application that runs on the CloudForms Management Engine Appliance and
communicates with the SmartProxy and the VMD B.
C lu st er
Hosts that are grouped together to provide high availability and load balancing.
C o n d it io n
A test of criteria triggered by an event.
D isco very
Process run by the CloudForms Management Engine server which finds virtual machine
and cloud providers.
D rif t
The comparison of a virtual machine, instance, host, cluster to itself at different points in
time.
Even t
A trigger to check a condition.
Even t Mo n it o r
Software on the CloudForms Management Engine Appliance which monitors external
providers for events and sends them to the CloudForms Management Engine server.
H o st
A computer on which virtual machine monitor software is loaded.
In st an ce/C lo u d In st an ce
A on-demand virtual machine based upon a predefined image and uses a scalable set of
hardware resources such as CPU, memory, networking interfaces.
Man ag ed /R eg ist ered VM
A virtual machine that is connected to a host and exists in the VMD B. Also, a template that
is connected to a provider and exists in the VMD B. Note that templates cannot be
connected to a host.
Man ag ed /U n reg ist ered VM
14
Chapt er 1 . Int roduct ion t o Red Hat CloudForms
A virtual machine or template that resides on a repository or is no longer connected to a
provider or host and exists in the VMD B. A virtual machine that was previously considered
registered may become unregistered if the virtual machine was removed from provider
inventory.
Pro vid er
A computer on which software is loaded which manages multiple virtual machines that
reside on multiple hosts.
Po licy
A combination of an event, a condition, and an action used to manage a virtual machine.
Po licy Pro f ile
A set of policies.
R ef resh
A process run by the CloudForms Management Engine server which checks for
relationships of the provider or host to other resources, such as storage locations,
repositories, virtual machines, or instances. It also checks the power states of those
resources.
R eg io n s
Regions are used to create a central database for reporting and charting. Regions are used
primarily to consolidate multiple VMD Bs into one master VMD B for reporting.
R eso u rce
A host, provider, instance, virtual machine, repository, or datastore.
R eso u rce Po o l
A group of virtual machines across which CPU and memory resources are allocated.
R ep o sit o ry
A place on a datastore resource which contains virtual machines.
Smart Pro xy
The SmartProxy is a software agent that acts on behalf of the CloudForms Management
Engine Appliance to perform actions on hosts, providers, storage and virtual machines.
The SmartProxy can be configured to reside on the CloudForms Management Engine
Appliance or on an ESX server version. The SmartProxy can be deployed from the
CloudForms Management Engine Appliance, and provides visibility to the VMFS storage.
Each storage location must have a SmartProxy with visibility to it. The SmartProxy acts on
behalf of the CloudForms Management Engine Appliance. If the SmartProxy is not
embedded in the CloudForms Management Engine server, it communicates with the
CloudForms Management Engine Appliance over HTTPS (SSL) on standard port 443.
Smart St at e An alysis
Process run by the SmartProxy which collects the details of a virtual machine or instance.
Such details include accounts, drivers, network information, hardware, and security
patches. This process is also run by the CloudForms Management Engine server on hosts
and clusters. The data is stored in the VMD B.
15
Red Hat CloudForms 3.0 Management Engine 5.2 Insight G uide
Smart T ag s
D escriptors that allow you to create a customized, searchable index for the resources in
your clouds and infrastructure.
St o rag e Lo cat io n
A device, such as a VMware datastore, where digital information resides that is connected
to a resource.
T ag s
D escriptive terms defined by a CloudForms Management Engine user or the system used to
categorize a resource.
T emp lat e
A template is a copy of a preconfigured virtual machine, designed to capture installed
software and software configurations, as well as the hardware configuration, of the original
virtual machine.
U n man ag ed Virt u al Mach in e
Files discovered on a datastore that do not have a virtual machine associated with them in
the VMD B. These files may be registered to a provider that the CloudForms Management
Engine server does not have configuration information on. Possible causes may be that the
provider has not been discovered or that the provider has been discovered, but no security
credentials have been provided.
Virt u al Mach in e
A software implementation of a system that functions similar to a physical machine. Virtual
machines utilize the hardware infrastructure of a physical host, or a set of physical hosts, to
provide a scalable and on-demand method of system provisioning.
Virt u al Man ag emen t D at ab ase ( VMD B )
D atabase used by the CloudForms Management Engine Appliance to store information
about your resources, users, and anything else required to manage your virtual enterprise.
Virt u al T h u mb n ail
An icon divided into smaller areas that summarize the properties of a resource.
Z o n es
CloudForms Management Engine Infrastructure can be organized into zones to configure
failover and to isolate traffic. Z ones can be created based on your environment. Z ones can
be based on geographic location, network location, or function. When first started, new
servers are put into the default zone.
1.4 . About t his Guide
This guide includes the following sections:
Common Infrastructure and Cloud Controls describes the management of infrastructure items,
reporting, and the search functionality available with CloudForms Management Engine.
16
Chapt er 1 . Int roduct ion t o Red Hat CloudForms
Infrastructure describes how to analyze and manipulate the hosts, providers, clusters, resource
pools, datastores, and repositories in your environment.
Cloud describes how to add, discover, refresh, tag, review, and remove your chosen cloud
provider.
Capacity Planning describes how to use capacity, utilization, and optimization features. This
chapter describes how the CloudForms Management Engine appliance can collect and analyze
capacity and utilization data from your virtual infrastructure. Use this data to understand the
limitations of your current environment and plan for growth.
Cloud Intelligence describes how to view and analyze the information collected by the CloudForms
Management Engine appliance. This chapter provides information to support better information
technology decision making and to aid predictions for future virtual machine management.
[1] http ://www.mo z illa.o rg /en-US/firefo x/o rg aniz atio ns /faq /
17
Red Hat CloudForms 3.0 Management Engine 5.2 Insight G uide
Chapter 2. Common Infrastructure and Cloud Controls
The user views resources in multiple ways through the console. Each type of resource provides
different buttons in the main tool bar. For all infrastructure items, users can:
Change views
Sort
Create a report
Search by collected data
Fig u re 2.1. T h e In f rast ru ct u re U ser In t erf ace
1. Taskbar buttons
2. View buttons
3. Infrastructure Report outputs
4. Advanced Search button
5. Navigation bar
6. Sort dropdown
7. Main area
2.1. Changing Views
The C o nfi g urati o n page enables the user to set default views for different resources. However, the
view is also controlled from the Infrastructure or C l o ud items page. All Infrastructure or
C l o ud items have the same buttons for the different views available.
Pro ced u re 2.1. T o C h an g e t h e View o f an In f rast ru ct u re It em
1. Hover over In f rast ru ct u re or C lo u d s and click the page for the type of item to view.
2. Click the appropriate button for the view.
18
Chapt er 2 . Common Infrast ruct ure and Cloud Cont rols
Click
for Grid View.
Click
for Tile View.
Click
for List View.
2.2. Sort ing Infrast ruct ure It ems
Each item has different parameters to sort. For example, sort Ho sts by SmartProxy version, or sort a
D atasto re by free space.
Pro ced u re 2.2. T o So rt In f rast ru ct u re It ems
1. Hover over In f rast ru ct u re or C lo u d s and click the page for the type of item to sort.
2. Click the So rt by dropdown.
3. Click the attribute to sort. The options presented depend on the type of configuration item
selected.
2.3. Creat ing an Infrast ruct ure Report
Create a quick report of infrastructure items in CSV, TXT, or PD F formats.
Pro ced u re 2.3. T o C reat e an In f rast ru ct u re It em R ep o rt
1. Hover over In f rast ru ct u re or C lo u d s and click the page of the item for report generation.
2. Click the D o wnl o ad button for the type of report.
Click
(D o wnl o ad thi s repo rt i n T XT fo rmat) for a text file.
Click
(D o wnl o ad thi s repo rt i n C SV fo rmat) for a csv file.
Click
(D o wnl o ad thi s repo rt i n P D F fo rmat) for a PD F file.
2.4 . Searching by Name
A search bar to the right of the taskbar on the P ro vi d ers, C l usters, Ho sts, and R eso urce
P o o l s pages provide a method to enter names, or parts of names, for searching. Search for items in
the following ways:
1. Type characters that are included in the name. For example, if you type sp1, all names that
include sp1 appear such as Wi nd o ws20 0 3sp1 and Sp1cl o ne.
2. Use an asterisk (" *" ) after the desired search term to search for names that begin with specific
characters. For example, type v* to find all names that begin with the letter v.
3. Use an asterisk (" *" ) before the desired search term to search for names that end with specific
characters. For example, type *sp2 to find all names that end with sp2.
19
Red Hat CloudForms 3.0 Management Engine 5.2 Insight G uide
4. Erase all characters from the search box to go back to viewing all virtual machines.
Pro ced u re 2.4 . T o Search b y a N ame
1. Hover over In f rast ru ct u re or C lo u d s and navigate to either the P ro vi d ers, C l usters,
Ho sts, or R eso urce P o o l s page.
2. In the Name Fi l ter bar in the upper right corner of the window, type your criteria.
3. Click
(Search by Name wi thi n resul ts), or press Enter.
4. Type in another criterion to filter on what is currently displayed.
5. Click
(Search by Name wi thi n resul ts), or press Enter.
2.5. Advanced Searching
Use CloudForms Management Engine's advanced filtering capabilities to do the following.
Search by any information that has been discovered or collected using SmartState Analysis and
by Company and System Tags that you have assigned.
Import a filter used in a report.
Save a search to be used again.
2.5.1. Searching for Infrast ruct ure It ems wit h Advanced Search
Pro ced u re 2.5. T o Search f o r In f rast ru ct u re It ems wit h Ad van ced Search
1. Hover over In f rast ru ct u re or C lo u d s and click the page of the type of item to search.
2. Click
(Ad vanced Search) to open the expression editor.
3. Use the expression editor to choose the appropriate options for the search criteria. D ifferent
options appear based on the chosen criteria.
Click Fi el d to create criteria based on field values.
Click C o unt o f to create criteria based on the count of something, such as the number of
snapshots for a virtual machine, or the number of virtual machines on a host.
20
Chapt er 2 . Common Infrast ruct ure and Cloud Cont rols
Click T ag to create criteria based on tags assigned to your resources.
Click R eg i stry to create criteria based on registry values.
Click Fi nd to seek a particular value and check a property.
4. Make any edits for the current expression.
Click
(Und o the previ o us chang e) to remove a change.
Click
(R ed o the previ o us chang e) to redo the change.
Click
(AND wi th a new expressi o n el ement) to create a logical AND with a
new expression element.
Click
(O R wi th a new expressi o n el ement) to create a logical OR with a new
21
Red Hat CloudForms 3.0 Management Engine 5.2 Insight G uide
expression element.
Click
(Wrap thi s expressi o n el ement wi th a NO T ) to create a logical NOT
on an expression element or to exclude all the items that match the expression.
Click
element.
(R emo ve thi s expressi o n el ement) to take out the current expression
5. Click
(C o mmi t expressi o n el ement chang es) to add the expression or click
(D i scard expressi o n el ement chang es) to remove changes.
6. Click Appl y.
2.5.2. Saving an Advanced Search
Pro ced u re 2.6 . T o Save a Search
1. Create an Advanced Search expression.
2. Click Save.
3. Type the a name for the search expression in Save thi s search as.
Note
The default title depends on the configuration item you have chosen.
4. Click Save.
2.5.3. Loading a Report Filt er or Search Expression
Pro ced u re 2.7. T o Lo ad a R ep o rt Filt er o r Search Exp ressio n
1. Hover over Infrastructure or C l o ud and click the page of the type of item to search.
2. Click
(Ad vanced Search) to open the expression editor.
3. Click Lo ad .
4. Select either a saved virtual machine search or a virtual machine report filter.
Note
The items you can choose to select depend on the type of resource you are searching
for.
5. Click Lo ad .
22
Chapt er 2 . Common Infrast ruct ure and Cloud Cont rols
6. Click Appl y.
23
Red Hat CloudForms 3.0 Management Engine 5.2 Insight G uide
Chapter 3. Infrastructure
Use the Infrastructure pages to view and collect information from your providers, clusters, hosts,
and resource pools.
3.1. Providers
A provider is a server with software to manage multiple virtual machines that reside on multiple hosts.
In f rast ru ct u re → Pro vid ers displays the providers in your environment.
The web interface uses virtual thumbnails to represent providers. Each thumbnail contains four
quadrants by default, which display basic information about each provider.
1. Number of hosts
2. Management system software
3. Currently unused
4. Authentication status
Ico n
D escrip t io n
Validated: Valid authentication credentials have been added.
Invalid: Authentication credentials are invalid.
Unknown: Authentication status is unknown or no credentials have been
entered.
3.1.1. Adding a Provider
After initial installation and creation of a CloudForms Management Engine environment, you can add
providers to the appliance.
Pro ced u re 3.1. T o Ad d a Pro vid er
1. Navigate to In f rast ru ct u re → Pro vid ers.
2. Click
(C o nfi g urati o n), then click
P ro vi d er).
(Ad d a New Infrastructure
3. Type in the Name of the provider to add. The Name is how the device is labeled in the console.
4. Select the T ype of provider: R ed Hat Enterpri se Vi rtual i zati o n Manag er or
VMware vC enter.
5. Type in the Ho st Name, and IP Ad d ress of the provider to add.
24
Chapt er 3. Infrast ruct ure
6. For Red Hat Enterprise Virtualization providers, enter the AP I P o rt if your provider uses a
non-standard port for access.
7. If you have multiple zones, select the appropriate one from Zo ne.
8. Type in a User ID and P asswo rd with administrator privileges to the provider. To refresh a
provider, these credentials are required.
9. Click Val i d ate to confirm that the user and password connects.
10. Click Save.
R esu lt :
CloudForms Management Engine adds a new provider. Use this provider for virtual machine
provisioning.
Note
To obtain historical Capacity and Utilization (C & U) data for Red Hat Enterprise Virtualization
Manager, you will need to add credentials for the Red Hat C & U D atabase. Once discovered,
and set up for C & U in CloudForms Management Engine, you can use CloudForms
Management Engine to collect C & U from this point forward. For further information, refer to
Chapter 4. Data Collection Setup and Reports Installation in the Red Hat Enterprise Virtualization 3.1
Installation Guide.
3.1.2. Discovering Providers
Error
Topic 15227 failed Injection processing and is not included in this build.
Please review the compiler error for Topic ID 15227 for more detailed information.
3.1.3. Aut hent icat ing VMware vCent er Host s
After adding a VMware vCenter infrastructure provider, you must authenticate its hosts to enable full
functionality. The procedure below describes how to authenticate the VMware vCenter hosts.
Pro ced u re 3.2. T o Au t h en t icat e VMWare vC en t er H o st s
1. Navigate to In f rast ru ct u re → Pro vid ers.
2. Click on a provider to display its summary screen.
3. On the summary screen, click Ho sts in the R el ati o nshi ps information box to display the
hosts on that provider.
4. Select the hosts to authenticate. You can select all hosts using the C heck Al l option.
5. Click
(C o nfi g urati o n)
25
Red Hat CloudForms 3.0 Management Engine 5.2 Insight G uide
6. Click
(Ed i t Sel ected Ho sts).
7. On the C red enti al s screen, provide your VMware ESXi log on credentials.
8. If editing multiple hosts, select a host from the Sel ect Ho st to val i d ate ag ai nst drop
down.
9. Click Save.
R esu lt :
For all hosts selected, the authentication status in the bottom right quadrant changes from a
question mark into a tick mark indicating a successful validated connection.
3.1.4 . Refreshing Providers
Refresh a provider to find other resources related to it. Use R efresh after initial discovery to get the
latest data about the provider and the virtual machines it can access. Ensure the provider has
credentials to do this. If the providers were added using D i sco very, see Editing Provider Information.
Pro ced u re 3.3. T o R ef resh Mu lt ip le Pro vid ers
1. Navigate to In f rast ru ct u re → Pro vid ers.
2. Check the providers to refresh.
3. Click
(C o nfi g urati o n), and then
States).
(R efresh R el ati o nshi ps and P o wer
4. Click O K to confirm.
3.1.5. T agging Mult iple Providers
Apply tags to all providers to categorize them together at the same time. Before assigning tags, create
them using instructions in the CloudForms Management Engine Settings and Operations Guide.
Pro ced u re 3.4 . T o T ag Mu lt ip le Pro vid ers
1. Navigate to In f rast ru ct u re → Pro vid ers.
2. Check the providers to tag.
3. Click
(P o l i cy), and then
(Ed i t T ag s).
4. Select a customer tag from the first dropdown, and then a value for the tag.
5. Select more tags or click Save to save your changes.
3.1.6. Viewing a Provider
26
Chapt er 3. Infrast ruct ure
From a list of providers, you can review a specific provider by clicking on it. This displays various
options to access provider information.
Fig u re 3.1. Pro vid er Man ag emen t Screen
1. Provider Taskbar: Choose between Configuration, Policy and Monitoring options for the
selected provider
2. Provider Summary: D isplays provider summary such as Properties, Relationships, and Smart
Management
3. Provider Summary View: Choose between graphical or text view of the provider summary
4. Provider Summary PD F: Generates provider summary in PD F format
5. Provider Accordion: D isplays details about Properties and Relationships for the selected
provider
3.1.7. Edit ing Provider Informat ion
Edit information about a provider such as the name, IP address, and login credentials.
Pro ced u re 3.5. T o Ed it Pro vid er In f o rmat io n
1. Navigate to In f rast ru ct u re → Pro vid ers.
2. Click the provider to edit.
3. Click
(C o nfi g urati o n), and then
P ro vi d er).
(Ed i t Sel ected Infrastructure
4. In Basi c Info , edit the following:
Use Name to set an easily identifiable name for the provider.
Use Ho st Name to specify the hostname for the device.
27
Red Hat CloudForms 3.0 Management Engine 5.2 Insight G uide
Use IP Ad d ress to set the IP address for communication with the provider.
You cannot change the T ype of provider.
Edit the AP I P o rt if your provider uses a non-standard port for access.
Use Zo ne to isolate traffic and provide load balancing capabilities. Specify the Zo ne this
CloudForms Management Engine Appliance is a member. At startup, the zone is set to
D efaul t.
5. Use C red enti al s to provide login credentials required for the provider.
Use User ID to specify a login name.
Use P asswo rd to specify the password for the User ID .
Use Veri fy P asswo rd to confirm the password.
6. Click Val i d ate to confirm the user and password connects.
7. Click Save.
Note
To obtain historical Capacity and Utilization (C & U) data for Red Hat Enterprise Virtualization
Manager, you will need to add credentials for the Red Hat C & U D atabase. Once discovered,
and set up for C & U in CloudForms Management Engine, you can use CloudForms
Management Engine to collect C & U from this point forward. For further information, refer to
Chapter 4. Data Collection Setup and Reports Installation in the Red Hat Enterprise Virtualization 3.1
Installation Guide.
3.1.8. Removing Providers
If a provider has been decommissioned or requires some troubleshooting, it might require deletion
from the VMD B.
Pro ced u re 3.6 . T o R emo ve Pro vid ers
1. Navigate to In f rast ru ct u re → Pro vid ers.
2. Check the Providers to delete.
3. Click
(C o nfi g urati o n), and then
fro m the VMD B).
4. Click O K to confirm.
3.1.9. Viewing t he Provider T imeline
28
(R emo ve Infrastructure P ro vi d ers
Chapt er 3. Infrast ruct ure
3.1.9. Viewing t he Provider T imeline
View the timeline of events for the virtual machines registered to a provider.
Pro ced u re 3.7. T o View t h e T imelin e f o r a Pro vid er
1. Navigate to In f rast ru ct u re → Pro vid ers.
2. Click a provider.
3. Click
(Mo ni to ri ng ), and then
(Sho w T i mel i nes fo r thi s P ro vi d er) from
the taskbar, or from the provider accordion, click Pro p ert ies → T imelin e.
4. From O pti o ns, customize the period of time to display and the types of events to see.
Use Sho w to select regular Management Events or Policy Events.
Use the Interval dropdown to select hourly or daily data points.
Use D ate to type the date for the timeline to display.
If you select to view a daily timeline, use Sho w to set how many days back to go. The
maximum history is 31 days.
The three Event G ro up dropdowns allow you to select different groups of events to
display. Each has its own color.
From the Level dropdown, select a Summary event, or a D etai l list of events. For
example, the detail level of a P o wer O n event might include the power on request, the
starting event, and the actual P o wer O n event. If you select Summary, only the Power On
event displays in the timeline.
R esu lt :
The timeline is displayed. To see more details about an item in the timeline, click on it. A balloon
appears with a link to the resource.
3.1.10. Viewing Host s and Clust ers
Access a tree view of the hosts and clusters for a provider from the P ro vi d er Summary.
Pro ced u re 3.8. T o View H o st s an d C lu st ers f o r a Pro vid er
1. Navigate to In f rast ru ct u re → Pro vid ers.
2. Click the provider to view the hosts and clusters.
3. Click on the R elat io n sh ip s accordion, then click Ho sts & C l usters.
29
Red Hat CloudForms 3.0 Management Engine 5.2 Insight G uide
R esu lt :
The hosts and clusters are displayed in a tree view. Hover over a host or virtual machines and its
virtual thumbnail displays on the screen.
3.1.11. Viewing Virt ual Machines and T emplat es
Access a tree view of the virtual machines and templates for a provider from the P ro vi d er
Summary.
Pro ced u re 3.9 . T o View Virt u al Mach in es an d T emp lat es f o r a Pro vid er
1. Navigate to In f rast ru ct u re → Pro vid ers.
2. Click the provider to view the virtual machines and templates.
3. From accordion menu, click R elat io n sh ip s, then click VMs & T empl ates.
R esu lt :
The virtual machines and templates are displayed in a tree view. Hover over a virtual machine or
template and its virtual thumbnail displays on the screen.
3.2. Clust ers
Clusters provide high availability and load balancing for a group of hosts. The C l usters page
under Infrastructure displays the clusters discovered in your enterprise environment.
Note
Any filter applied will be in effect here.
30
Chapt er 3. Infrast ruct ure
Use the C l usters T askbar to manage the analysis and tagging of your clusters. These buttons
manage multiple clusters at one time. To manage one cluster, click on that cluster in the main area of
the screen.
3.2.1. Performing Smart St at e Analysis on Clust ers
Analyze a cluster to gather historical data to compare with previous points in time.
Pro ced u re 3.10. T o An alyz e Mu lt ip le C lu st ers
1. Navigate to In f rast ru ct u re → C lu st ers.
2. Check the clusters to analyze.
3. Click
(C o nfi g urati o n), and then
(P erfo rm SmartState Anal ysi s).
4. Click O K to confirm.
R esu lt :
The SmartState Analysis begins and returns the current data.
3.2.2. Comparing Clust ers
CloudForms Management Engine provides features to compare properties of clusters.
Pro ced u re 3.11. T o C o mp are C lu st ers
1. Navigate to In f rast ru ct u re → C lu st ers.
2. Check the clusters to compare.
3. Click
(C o nfi g urati o n), and then
(C o mpare sel ected C l usters). The
comparison displays in a default expanded view and lists a limited set of properties.
31
Red Hat CloudForms 3.0 Management Engine 5.2 Insight G uide
4. To delete a cluster from the comparison, click
C o mpari so n).
5. To go to a compressed view, click
view, click
(R emo ve thi s C l uster fro m the
(C o mpressed Vi ew). To return to an expanded
(Expand ed Vi ew).
6. To change the base cluster that all other clusters compare to, click its label at the top of its
column.
7. To go to the cluster summary screen, click its virtual thumbnail or icon.
8. There are three buttons in the taskbar to limit the type of views:
Click
(Al l attri butes) to see all attributes.
Click
(Attri butes wi th d i fferent val ues) to see only the attributes that are
different across clusters.
Click
(Attri butes wi th the same val ues) to see only the attributes that are the
same across clusters.
9. To limit the mode of the view, there are two taskbar buttons.
Click
(D etai l s Mo d e) to see all details for an attribute.
Click
(Exi sts Mo d e) to only see if an attribute exists compared to the base or not.
This only applies to attributes that can have a Boolean property. For example, a user
account exists or does not exist, or a piece of hardware that does or does not exist.
R esu lt :
This creates a comparison between clusters. Export this data or create a report from your comparison
for analysis using external tools.
3.2 .2 .1 . Cre at ing a Clust e r Co m pariso n Re po rt
Create a quick report of to compare clusters in CSV, TXT, or PD F formats.
32
Chapt er 3. Infrast ruct ure
Pro ced u re 3.12. T o C reat e a C o mp ariso n R ep o rt
1. Create the comparison to analyze.
2. Click
(D o wnl o ad ).
3. Click the output button for the type of report.
Click
(D o wnl o ad co mpari so n repo rt i n T XT fo rmat) for a text file.
Click
(D o wnl o ad co mpari so n repo rt i n C SV fo rmat) for a commaseparated file.
Click
(D o wnl o ad co mpari so n repo rt i n P D F fo rmat) for a PD F file.
3.2.3. Viewing a Clust er
You can click on a specific Cluster to view its details. The screen provides you with a Cluster
Taskbar, a Cluster Accordion, and a Cluster Summary.
Fig u re 3.2. C lu st er Man ag emen t Screen
1. Cluster Taskbar: Choose between Configuration, Policy and Monitoring options for the
selected Cluster
2. Cluster Summary: See Cluster summary such as Relationships, Totals for Hosts, Totals for
VMs
3. Cluster Summary Views: Choose between graphical or text view of the cluster summary
4. Cluster Summary PD F: Generates Cluster summary in PD F format
33
Red Hat CloudForms 3.0 Management Engine 5.2 Insight G uide
5. Cluster Accordion: See details about Properties, Relationships, Storage Relationships for the
selected Cluster
3.2.4 . T agging Clust ers
Use tags to categorize clusters. Before assigning tags, create them using the instructions in the
CloudForms Management Engine Settings and Operations Guide.
Pro ced u re 3.13. T o T ag C lu st ers
1. Navigate to In f rast ru ct u re → C lu st ers.
2. Check the Clusters to tag.
3. Click
(P o l i cy), and then
(Ed i t T ag s).
4. Select a customer tag from the first dropdown, and then a value for the tag.
5. Select more tags or click Save to save your changes.
3.2.5. Viewing Capacit y and Ut iliz at ion Chart s for a Clust er
View capacity and utilization for a cluster.
Pro ced u re 3.14 . T o View C ap acit y an d U t iliz at io n C h art s f o r a C lu st er
1. Navigate to In f rast ru ct u re → C lu st ers.
2. Click the Cluster to view Capacity and Utilization data.
3. Click
(Mo ni to ri ng ), and then
(Uti l i zati o n) or from the accordion menu,
click P ro perti es, then C apaci ty & Uti l i zati o n.
4. From Interval , select to view hourly or daily data points and the dates to view data. Use
G ro up by to group the lines by SmartTags. Use T i me P ro fi l es to select a time range for
the data.
34
Chapt er 3. Infrast ruct ure
R esu lt :
The C apaci ty & Uti l i zati o n charts display.
Note
D aily charts only include full days of data. If a day does not include all the 24 data points for
a day, the data does not show for that day.
3.2.6. Viewing Clust er T imeline
Use the cluster timeline to see a graphical depiction of operational and configuration events over
time.
Pro ced u re 3.15. T o View t h e C lu st er T imelin e
1. Navigate to In f rast ru ct u re → C lu st ers.
2. Click the cluster to view the timeline.
3. Click
(Mo ni to ri ng ), and then
Pro p ert ies → T imelin e.
(T i mel i nes) or from the Cluster Accordion, click
4. From O pti o ns, customize the period of time to display, and the types of events to see.
35
Red Hat CloudForms 3.0 Management Engine 5.2 Insight G uide
Use the Interval dropdown to select hourly or daily data points.
Use D ate to type the date for the timeline to display.
If you select to view a daily timeline, use Sho w to set how many days back to go. The
maximum history is 31 days.
The three Event G ro up dropdowns allow the selection of different groups of events to
display. Each has its own color.
From the Level dropdown, select a Summary event if needed, or a D etai l list of events.
For example, the detail level of a P o wer O n event might include the power on request, the
starting event, and the actual P o wer O n event. If you select Summary, the timeline only
displays the Power On event.
5. To see more detail on an item in the timeline, click on it. A balloon appears with a clickable
link to the resource.
3.2.7. Det ect ing Drift on Clust ers
Over time, a cluster's configuration might change. D rift is the comparison of a cluster to itself at
different points in time. The cluster requires analysis at least twice to collect information. D etecting
drift provides users with the following benefits:
See the difference between the last known state of a cluster and its current state
Review the configuration changes that happen to a particular cluster between multiple points in
time.
Capture the configuration drifts for a single cluster across a time period.
Pro ced u re 3.16 . T o View C lu st er D rif t
1. Navigate to In f rast ru ct u re → C lu st ers.
2. Click on the cluster to view drift.
3. Click R el ati o nshi ps in the Cluster Accordion.
4. Click D ri ft Hi sto ry.
5. Check the analyses to compare.
6. Click
(D ri ft Anal ysi s) at the top of the screen. The results are displayed.
7. Check the C o mpari so n sections on the left to view in your comparison.
8. Click the plus sign next to the section name to expand it.
An item displayed on red text shows a change from the base analysis. An item displayed
in black text shows no change from the base analysis.
A
(C hang ed fro m previ o us) shows there has been a change since the last
analysis.
A
36
(Same as previ o us) means there has been no change since the last analysis.
Chapt er 3. Infrast ruct ure
Click
(R emo ve fro m d ri ft) at the bottom of a column to remove a specific
analysis. The drift is then recalculated and the new results display.
9. Click
(Expand ed Vi ew) to see the expanded view. Click
to compress the information.
(C o mpressed Vi ew)
10. Click the minus sign next to the section name to collapse it.
11. To limit the type of views, there are three buttons in the Taskbar.
Click
(Al l attri butes) to see all attributes of the sections selected.
Click
(Attri butes wi th d i fferent val ues) to see only the attributes different
across drifts.
Click
(Attri butes wi th the same val ues) to see only the attributes the same
across drifts.
R esu lt :
The drift displays for your cluster. D ownload the data or create a report from the drift for analysis
using external tools.
3.2.8. Creat ing a Drift Report for Clust ers
Use the drift report feature to export information about your cluster's drift.
Pro ced u re 3.17. T o C reat e a D rif t R ep o rt f o r C lu st ers
1. Create a drift of a cluster.
2. Click
(D o wnl o ad ).
3. Click the output button for the type of report you want.
Click
(D o wnl o ad d ri ft repo rt i n T XT fo rmat) for a text file.
Click
(D o wnl o ad d ri ft repo rt i n C SV fo rmat) for a comma-separated file.
Click
(D o wnl o ad d ri ft repo rt i n P D F fo rmat) for a PD F file.
3.2.9. Removing Clust ers
If a cluster has been decommissioned or requires troubleshooting, it might require removal from the
VMD B.
Pro ced u re 3.18. T o R emo ve C lu st ers
1. Navigate to In f rast ru ct u re → C lu st ers.
37
Red Hat CloudForms 3.0 Management Engine 5.2 Insight G uide
2. Check the clusters to remove.
3. Click
(C o nfi g urati o n), and then
(R emo ve C l usters fro m the VMD B).
4. Click O K to confirm the removal of the clusters.
R esu lt :
The clusters are deleted. Any virtual machines or hosts associated with these clusters remain, but are
no longer associated with them.
3.3. Host s
The Ho sts page under Infrastructure displays the hosts discovered in your enterprise
environment.
Note
Any applied filters will be in effect here.
After adding or sorting your hosts, click on one to examine it more closely and see its virtual
machines, SmartProxy settings, and properties.
1. Top left quadrant: Number of virtual machines on this host
2. Bottom left quadrant: Virtual machine software
3. Top right quadrant: Power state of host
4. Bottom right quadrant: Authentication status
Ico n
D escrip t io n
Validated: Valid authentication credentials have been added.
38
Chapt er 3. Infrast ruct ure
Ico n
D escrip t io n
Invalid: Authentication credentials are invalid
Unknown: Authentication status is unknown or no credentials have been
entered.
3.3.1. Filt ering Host s
The Host Filter accordion is provided to easily navigate through the hosts. Use the ones provided or
create your own. In addition, you can set a default filter.
3.3.1 .1 . Se t t ing a De fault Ho st Filt e r
Set the default filter for viewing your hosts.
Pro ced u re 3.19 . T o Set t h e D ef au lt H o st Filt er
1. From the Fi l ters accordion on the left, click on the filter to use.
2. Click Set D efaul t at the top of the filters list.
R esu lt :
The default filter is set and marked by a green star next to its name.
3.3.1 .2 . Cre at ing a Ho st Filt e r
Create a filter for viewing you hosts.
Pro ced u re 3.20. T o C reat e a H o st Filt er
1. Navigate to In f rast ru ct u re → H o st s.
2. Click
(Ad vanced Search) to open the expression editor.
3. Use the expression editor to choose the appropriate options for your criteria.
4. Click Save.
5. Type in a name for the search expression in Save thi s search as.
Note
This title depends on the type of resource you are searching.
6. Click Save.
R esu lt :
The filter is saved and displays in the My Fi l ters area of the Fi l ter accordion.
39
Red Hat CloudForms 3.0 Management Engine 5.2 Insight G uide
3.3.2. Performing Smart St at e Analysis on Host s
Perform a SmartState Analysis on a host to collect additional information about it, such as patches,
CPU, and memory.
Note
ro o t or administrator credentials are required to get patch information.
Pro ced u re 3.21. T o An alyz e Mu lt ip le H o st s
1. Navigate to In f rast ru ct u re → H o st s.
2. Check the hosts to analyze.
3. Click
(C o nfi g urati o n), and then
(P erfo rm SmartState Anal ysi s).
4. Click O K to confirm.
3.3.3. Comparing Host s
CloudForms Management Engine allows you to compare hosts and check operating systems, host
software and version information, and hardware.
Pro ced u re 3.22. T o C o mp are H o st s
1. Navigate to In f rast ru ct u re → H o st s.
2. Check the hosts to compare.
3. Click
(C o nfi g urati o n), and then
(C o mpare sel ected Ho sts). The
comparison displays in a default expanded view, which lists a limited set of properties.
4. To remove a host from the comparison, click
co mpari so n) at the bottom of the column.
5. To go to a compressed view, click
view, click
(R emo ve thi s Ho st fro m the
(C o mpressed Vi ew). To return to an expanded
(Expand ed Vi ew).
6. To limit the mode of the view, there are two buttons in the Taskbar.
Click
(D etai l s Mo d e) to see all details for an attribute.
Click
(Exi sts Mo d e) to limit the view to if an attribute exists compared to the base
or not. This only applies to attributes that can have a Boolean property. For example, a
user account exists or does not exist, or a piece of hardware that does or does not exist.
7. To change the base host that compare to the other hosts, click its label at the top of its
column.
40
Chapt er 3. Infrast ruct ure
8. To go to the summary screen for a host, click its Virtual Thumbnail or icon.
R esu lt :
CloudForms Management Engine allows you to fine tune your comparison by selecting categories to
compare.
3.3.3.1 . Ho st Co m pariso n Se ct io ns
Sect io n
D escrip t io n
Host Properties
Use this section to see basic information of the
host, such as hostname, product, build number,
hardware, and network adapters.
Use this to see users and groups for the host,
and firewall rules.
Use this to see the operating system,
applications, services, patches, vSwitches,
vLANS, and advanced settings.
Use this to see all tags.
Security
Configuration
My Company Tags
3.3.3.2 . Using t he Ho st Co m pariso n Se ct io ns
The following procedure describes how to use the host comparison sections.
Pro ced u re 3.23. T o U se H o st C o mp ariso n Sect io n s
1. On the left of a comparison screen, select what categories of properties to display.
2. Click the plus sign next to the sections name to expand it.
3. The following descriptions pertain to the Expand ed Vi ew
. Either the value of a
property or an icon representing the property displays depending on the properties type.
A property displayed in the same color as the base means that the compared host
matches the base for that property.
A property displayed in a different color from the base means that the compared host does
not match the base for that property.
4. If you are in the C o mpressed Vi ew
, the values of the properties do not display. All
items are described by the icons shown below.
A
(checkmark) means the compared host matches the base for that property. Hover
over it and the value of the property displays.
A
(x) means the compared host does not match the base for that property. Hover
over it and the value of the property displays.
5. Click the plus sign next to the section name to collapse it.
R esu lt :
41
Red Hat CloudForms 3.0 Management Engine 5.2 Insight G uide
This comparison is viewable in multiple ways. Export the data or create a report from your
comparison for analysis using external tools.
3.3.3.3. Cre at ing a Ho st Co m pariso n Re po rt
Create a quick report to compare clusters in CSV, TXT, or PD F formats.
Pro ced u re 3.24 . T o C reat e a C o mp ariso n R ep o rt
1. Create the comparison to analyze.
2. Click
(D o wnl o ad ).
3. Click the output button for the type of report.
Click
(D o wnl o ad co mpari so n repo rt i n T XT fo rmat) for a text file.
Click
(D o wnl o ad co mpari so n repo rt i n C SV fo rmat) for a commaseparated file.
Click
(D o wnl o ad co mpari so n repo rt i n P D F fo rmat) for a PD F file.
3.3.4 . Refreshing Mult iple Host s
Manually refresh a host for its properties and related infrastructure components.
Pro ced u re 3.25. T o R ef resh Mu lt ip le H o st s
1. Navigate to In f rast ru ct u re → H o st s.
2. Check the hosts to refresh.
3. Click
(C o nfi g urati o n), and then
States).
(R efresh R el ati o nshi ps and P o wer
4. Click O K to confirm.
R esu lt :
When a host is refreshed and a new virtual machine is discovered on that host, CloudForms
Management Engine checks to see if the virtual machine is already registered with another host. If
this is the case, the host that the virtual machine is associated with switches to the new host. If the
SmartProxy is monitoring a provider, this happens automatically. If not, the next refresh of the host
addresses this.
3.3.5. Discovering Mult iple Host s
If not using a provider, use CloudForms Management Engine's D iscovery to find hosts in your
environment within a range of IP addresses.
Pro ced u re 3.26 . T o D isco ver H o st s b y a Su b n et R an g e
42
Chapt er 3. Infrast ruct ure
1. Navigate to In f rast ru ct u re → H o st s.
2. Click
(C o nfi g urati o n), then click
(D i sco ver Ho sts).
3. Check the types of hosts to discover, ESX or IPMI.
4. Type in a range of IP Ad d resses.
5. Click Start.
R esu lt :
CloudForms Management Engine searches for the supported hosts. When available, the new hosts
display. They are named by hostname and IP address. To make them identifiable, edit the basic
information for each host.
3.3.6. Adding a Single Host
To analyze a host for more detailed information, add it to the VMD B first. If the host has not been
found during Ho st D i sco very or P ro vi d er R efresh, and the host's IP address is known, use
the Ad d a New Ho st button.
Pro ced u re 3.27. T o Ad d a Sin g le H o st
1. Navigate to In f rast ru ct u re → H o st s.
2. Click
(C o nfi g urati o n), then click
(Ad d a new Ho st).
3. Type the Name, Ho st Name, and IP Ad d ress of the host to add. Name is how the device is
labeled in the console. Select the type of operating system from the Ho st P l atfo rm
dropdown. If the Host has been found during D i sco very or R efresh and the host's
operating system has been identified, the Ho st P l atfo rm selector remains disabled. If
adding an IPMI server for provisioning, add in the IP address of that host.
43
Red Hat CloudForms 3.0 Management Engine 5.2 Insight G uide
4. In the C red enti al s box, the D efaul t tab provides fields to type a user name with elevated
security credentials and the user's password. If using domain credentials, the format for User
ID is in the format of [domainname]\[username]. On ESX hosts, if the SSH login is disabled for
the D efaul t user, type in a user with remote login access on the R emo te Lo g i n tab.
5. Click Val i d ate to check the credentials.
6. Click Save.
3.3.7. Edit ing Host s
If multiple hosts have the same settings or credentials, edit them at the same time.
Pro ced u re 3.28. T o Ed it Set t in g s An d C red en t ials f o r Mu lt ip le H o st s
1. Navigate to In f rast ru ct u re → H o st s.
2. Click
44
(C o nfi g urati o n).
Chapt er 3. Infrast ruct ure
3. Check the Hosts to edit.
4. Click
(Ed i t Sel ected Ho sts).
5. Use C red enti al s to provide login credentials required for this host.
On the D efaul t tab, type a user name with elevated security credentials and the users
password. If you are using domain credentials, the format for User ID must be in the format
of [domainname]\[username].
On ESX hosts, if SSH login is disabled for the D efaul t user, type in a user with remote
login access on the R emo te Lo g i n tab. If this is not supplied, D efaul t credentials will
be used.
Use Web Servi ces to supply credentials for any web service calls made directly to the
host system. If this is not supplied, D efaul t credentials are used.
Note
Login credentials are required for performing SmartState Analysis on the host's
virtual machines and templates.
For each type of credential used, the following information is required:
Use User ID to specify a login ID .
Use P asswo rd to specify the password for the User ID .
Use Veri fy P asswo rd to confirm the password.
6. Test the credentials by using the Sel ect Ho st to val i d ate ag ai nst drop down and
click Val i d ate.
7. Click Save.
3.3.8. Viewing a Host
45
Red Hat CloudForms 3.0 Management Engine 5.2 Insight G uide
You can click on a specific host to review it. The screen shows a Host Virtual Thumbnail, a Host
Taskbar, a Host Accordion, and a Host Summary.
Fig u re 3.3. H o st Man ag emen t Screen
1. Host Task Bar: Use the Host Taskbar to take actions on the selected host
2. Host Summary: Use the Host Summary to see the properties of a host, drill down to a hosts
information, and, view its installed virtual machines.
3. Host Summary Views: Choose between graphical or text view of the provider summary
4. Host PD F: Generates Host summary in PD F format
5. Host Accordion: See details about Properties, Relationships, Security and Configuration for
the selected Host
3.3.9. T agging Mult iple Host s
To categorize hosts together, apply tags to multiple hosts at the same time. Before assigning tags,
create them using the instructions in the CloudForms Management Engine Settings and Operations Guide.
Pro ced u re 3.29 . T o T ag Mu lt ip le H o st s
1. Navigate to In f rast ru ct u re → H o st s.
2. Check the hosts to tag.
3. Click
(P o l i cy), and then
(Ed i t T ag s).
4. Select a customer tag from the first dropdown, and then a value for the tag.
46
Chapt er 3. Infrast ruct ure
5. Select more tags or click Save to save your changes.
3.3.10. Removing Host s
If a host is decommissioned or requires troubleshooting, it might require removal from the VMD B.
Pro ced u re 3.30. T o R emo ve H o st s
1. Navigate to In f rast ru ct u re → H o st s.
2. Check the hosts to remove.
3. Click
(C o nfi g urati o n), and then
(R emo ve Ho sts fro m the VMD B).
4. Click O K to confirm the host deletion.
R esu lt :
The hosts are removed. The virtual machines remain in the VMD B, but are no longer associated with
their respective hosts.
3.3.11. Refreshing Relat ionships and Power St at es for a Host
Refresh the relationships and power states of the items associated with your hosts from the Host
Taskbar.
Note
ro o t or administrator credentials are required to get patch information.
Pro ced u re 3.31. T o R ef resh R elat io n sh ip s o f a H o st
1. Navigate to In f rast ru ct u re → H o st s.
2. Click on the host to refresh.
3. Click
(C o nfi g urati o n), and then
States) on the Host Taskbar.
(R efresh R el ati o nshi ps and P o wer
R esu lt :
CloudForms Management Engine determines the state (running, stopped, or paused) of all virtual
machines registered to the host.
3.3.12. Viewing Capacit y and Ut iliz at ion Chart s for a Host
47
Red Hat CloudForms 3.0 Management Engine 5.2 Insight G uide
View Capacity & Utilization data for hosts that are part of a cluster.
Note
Your CloudForms Management Engine server requires network visibility to the provider
assigned the Server R o l e of C apaci ty & Uti l i zati o n C o l l ecto r to enable this
feature. Refer to the CloudForms Management Engine Settings and Operations Guide for more
information.
Pro ced u re 3.32. T o View C ap acit y an d U t iliz at io n C h art s f o r a H o st
1. Navigate to In f rast ru ct u re → H o st s.
2. Click the Host to view capacity data.
3. Click
(Mo ni to ri ng ), and then
(Uti l i zati o n) or from the Host accordion, click
Pro p ert ies → C ap acit y & U t iliz at io n .
4. From Interval , select to view hourly or daily data points and the dates to view data. Use
G ro up by to group the lines by SmartTags. Use T i me P ro fi l es to select a time range for
the data.
R esu lt :
The charts are displayed for CPU, memory, disk, network, and running virtual machines.
48
Chapt er 3. Infrast ruct ure
Note
D aily charts only include full days of data. If a day does not include all the 24 data points for
a day, the data does not show for that day.
3.3.13. Viewing t he Host T imeline
View the timeline of events for the virtual machines registered to a host.
Pro ced u re 3.33. T o View t h e T imelin e f o r a H o st
1. Navigate to In f rast ru ct u re → H o st s.
2. Click the Host to view the timeline.
3. Click
(Mo ni to ri ng ), and then
Pro p ert ies → T imelin es.
(T i mel i nes) or from the Host Accordion, click
4. From O pti o ns, customize the period of time to display and the types of events to see.
Use Sho w to select types of events to show on the timeline.
Use the Interval dropdown to select hourly or daily data points.
Use D ate to type the date the timeline displays.
If you select to view a daily timeline, use Sho w to set how many days back to go. The
maximum history is 31 days. If selecting Ho url y, select the interval to see.
From the Level dropdown, select either a Summary event or a D etai l list of events. For
example, the detail level of a P o wer O n event might include the power on request, the
starting event, and the actual P o wer O n event. If you select Summary, only the Power On
event appears in the timeline.
The three Event G ro up dropdowns allow selection of different groups of events to
display. Each group has its own color.
5. To see more detail on an item in the timeline, click on it. A balloon appears with a clickable
link to the resource.
3.3.14 . Host Virt ual Summary
Clicking on a specific host shows the Hosts Virtual Thumbnail and an operating system-sensitive
screen of host information, called the Host Summary. Where applicable, click on a subcategory of the
Host Summary to see more detail on that section.
A R efresh provides some basic information on the Host. To get more detail, enter credentials for the
host and perform a SmartState Analysis.
The Summary divides into the following categories.
P ro perti es include information such as base operating system, hostname, IP addresses,
devices attached to the system, and storage adapters. Some categories can be clicked on for
additional detail. For example, click Netwo rk to view the network adapters connected to the host.
49
Red Hat CloudForms 3.0 Management Engine 5.2 Insight G uide
R el ati o nshi ps include information on the provider, cluster, datastores, resource pools, and
installed virtual machines.
Securi ty shows the number of users, groups, patches installed, and firewall rules on the host.
Click on any of these items to see further details.
50
Chapt er 3. Infrast ruct ure
Note
Run a SmartState Analysis on the host to retrieve this information.
Sto rag e R el ati o nshi ps shows the relationship the host has to LUNs, volumes, and file
shares. The Sto rag e Invento ry R o l e must be enabled in the zone for these items to be
populated.
C o nfi g urati o n shows the number of packages and services installed. Click on any of these
items to see more details.
Note
Run a SmartState Analysis on the host to retrieve this information.
Smart Manag ement shows all tags assigned to this host.
Authenti cati o n Status shows all the types of credentials entered for this host and the
whether those credentials are valid.
3.3.15. Viewing Host Device Informat ion
Access information on the hardware devices including processor, CPU type and speed, and memory
for each host.
Pro ced u re 3.34 . T o View D evice In f o rmat io n f o r a H o st
1. Navigate to In f rast ru ct u re → H o st s.
2. Click the host to view the network information.
3. From the Host Accordion, click Pro p ert ies → D evices.
3.3.16. Viewing Host Net work Informat ion
Access information on networking including switches, network interfaces, and local area networks for
each host.
Pro ced u re 3.35. T o View N et wo rk In f o rmat io n f o r a H o st
1. Navigate to In f rast ru ct u re → H o st s.
51
Red Hat CloudForms 3.0 Management Engine 5.2 Insight G uide
2. Click the host to view the network information.
3. From the Host Accordion, click Pro p ert ies → N et wo rk.
3.3.17. Viewing St orage Adapt ers
Access information on the storage adapters including storage type for each host.
Pro ced u re 3.36 . T o View St o rag e Ad ap t ers f o r a H o st
1. Navigate to In f rast ru ct u re → H o st s.
2. Click the host to view the network information.
3. From the Host Accordion, click Pro p ert ies → St o rag e Ad ap t ers.
3.3.18. Det ect ing Drift on Host s
Over time, the configuration of a Host might change. D rift is the comparison of a host to itself at
different points in time. The host requires analysis at least twice to collect information. D etecting drift
provides you the following benefits:
See the difference between the last known state of a host and its current state.
Review the configuration changes that happen to a particular host between multiple points in
time.
Capture the configuration drifts for a single host across a time period.
52
Chapt er 3. Infrast ruct ure
Pro ced u re 3.37. T o View H o st D rif t
1. Navigate to In f rast ru ct u re → H o st s.
2. Click on the host to view drift.
3. Click R el ati o nshi ps in the Host Accordion.
4. Click D ri ft Hi sto ry.
5. Check the analyses to compare.
6. Click
(D ri ft) at the top of the screen. The results display.
7. Check the C o mpari so n sections on the left to view in your comparison.
8. Click Appl y.
9. Click the plus sign next to the sections name to expand it.
An item displayed on red text shows a change from the base analysis. An item displayed
in black text shows no change from the base analysis.
A
(C hang ed fro m previ o us) shows a change since the last analysis.
A
(Same as previ o us) means no change since the last analysis.
Click
(R emo ve fro m d ri ft) at the bottom of a column to remove a specific
analysis. The drift recalculates and the new results display.
10. Click
(Expand ed Vi ew) to see the expanded view. Click
to compress the information.
(C o mpressed Vi ew)
11. Click the minus sign next to the sections name to collapse it.
12. To limit the type of views, you have three buttons in the Taskbar.
Click
(Al l attri butes) to see all attributes of the sections you selected.
Click
(Attri butes wi th d i fferent val ues) to see only the attributes that are
different across the drifts.
Click
(Attri butes wi th the same val ues) to see only the attributes that are the
same across drifts.
R esu lt :
The drift comparison displays. D ownload the data or create a report from your drift for analysis using
external tools.
3.3.19. Creat ing a Drift Report for Host s
Use the drift report feature to export information about your host's drift.
53
Red Hat CloudForms 3.0 Management Engine 5.2 Insight G uide
Pro ced u re 3.38. T o C reat e a D rif t R ep o rt
1. Create the comparison to analyze.
2. Click
(D o wnl o ad ).
3. Click the output button for the type of report.
Click
(D o wnl o ad d ri ft repo rt i n T XT fo rmat) for a text file.
Click
(D o wnl o ad d ri ft repo rt i n C SV fo rmat) for a comma-separated file.
Click
(D o wnl o ad d ri ft repo rt i n P D F fo rmat) for a PD F file.
3.4 . Virt ual Machines
The heterogeneous virtual machine container and guest support combined with the ability to analyze
information inside the virtual machine - such as disk space, patch level or installed applications provides in-depth information across the virtual environment. This rich set of information enables
CloudForms Management Engine users to improve problem resolution times and effectively manage
virtual machines.
The Vi rtual Machi nes pages display all virtual machines that were discovered by your Server.
Note that if you have applied a filter to a user, it will be in effect here. The Vi rtual Machi nes
taskbar is a menu driven set of buttons that provide access to functions related to virtual machines.
1. History button
2. Refresh screen button
3. Taskbar
4. Name search bar/Advanced Search button
5. View buttons
6. D ownload buttons
54
Chapt er 3. Infrast ruct ure
7. Navigation bar
8. Sort dropdown
9. Main area in Grid View
10. Provider/Filter Navigation
The console uses Vi rtual T humbnai l s to describe virtual machines and templates. Each
thumbnail contains four quadrants by default. This allows you to glance at a virtual machine for a
quick view of its contents.
1. Top left quadrant: Operating system of the Virtual Machine
2. Bottom left quadrant: Virtual Machine Hosts software
3. Top right quadrant: Power state of Virtual Machine or Status icon
4. Bottom right quadrant: Number of Snapshots for this Virtual Machine
Ico n
D escrip t io n
Template: Virtual Template
Retired: Virtual Machine has been retired
Archived: Virtual Machine has no Host or D atastore associated with it.
Orphaned: Virtual Machine has no Host but does have a D atastore
associated with it.
D isconnected: Virtual Machine is disconnected.
On: Virtual Machine is powered on.
Off: Virtual Machine is powered off.
Suspended: Virtual Machine has been suspended.
The Vi rtual Machi nes page has three accordions organizing your virtual machines and
templates in different ways. All of these accordions share a set of common controls
Use VMs and T empl ates to view your virtual machines and templates organized by Provider. In
addition, you can see archived and orphaned items here.
Use the VMs to view, apply filters, and collect information about all of your virtual machines.
Use T empl ates to view, apply filters, and collect information about all of your templates.
Through the console, you are able to view your virtual machines in multiple ways. For your virtual
machines, you can:
55
Red Hat CloudForms 3.0 Management Engine 5.2 Insight G uide
Filter virtual machines
Change views
Sort
Create a report
Search by MyTags
Search by collected data
3.4 .1. Filt ering Virt ual Machines and T emplat es
The Vi rtual Machi ne Fi l ter accordion is provided so that you can easily navigate through
groups of virtual machines. You can use the ones provided or create your own through Ad vanced
Fi l teri ng capabilities.
Pro ced u re 3.39 . T o U se a Virt u al Mach in e O r T emp lat e Filt er
1. Navigate to In f rast ru ct u re → Virt u al Mach in es.
2. Go to the VMs or T empl ates accordion.
3. Click on the desired filter from the left pane.
3.4 .1 .1 . Cre at ing a Virt ual Machine o r T e m plat e Filt e r
Pro ced u re 3.4 0. T o C reat e a Virt u al Mach in e O r T emp lat e Filt er
1. Navigate to In f rast ru ct u re → Virt u al Mach in es.
2. Go to the VMs or T emp lat es accordion.
3. Click Al l VMs or Al l T empl ates, then click
expression editor.
(Ad vanced Search) to open the
4. Use the expression editor to choose the appropriate options for your criteria. Based on what
you choose, different options will show.
For all of the types of searches, you have the options of creating an alias and requested
user input. Select Use Al i as to create a user friendly name for the search. If you are
requested user input for the search, this text will show in the dialog box where the input is
requested.
Click Fi el d to create criteria based on field values.
56
Chapt er 3. Infrast ruct ure
Click C o unt o f to create criteria based on the count of something, such as the number of
snapshots for a virtual machine, or the number of virtual machines on a host.
Click T ag to create criteria based on tags assigned to your virtual infrastructure, such as
for power states or production tagging.
Click R eg i stry to create criteria based on registry values, such as the D COM status of a
Windows system. Note this criteria applies only to Windows operating systems.
Click Fi nd to seek a particular value, and then check a property.
57
Red Hat CloudForms 3.0 Management Engine 5.2 Insight G uide
5. Click
(C o mmi t Expressi o n El ement C hang es) to add the expression.
6. Click Save.
7. Type in a name for the search expression in Save thi s VM search as. (Note that this title
depends on the type of resource you are searching.) To set the filter to show globally, check
G l o bal Fi l ter.
8. Click Save.
R esu lt :
The filter is saved and will show in the My Fi l ters area of the Fi l ter accordion. If you checked
G l o bal Fi l ter, the filter will show there.
3.4 .1 .2 . Lo ading a Re po rt Filt e r o r Se arch Expre ssio n
Pro ced u re 3.4 1. T o Lo ad a R ep o rt Filt er O r Search Exp ressio n
1. Navigate to In f rast ru ct u re → Virt u al Mach in es.
2. Click the accordion for the items to search either VMs or T empl ates.
3. Click
(Ad vanced Search) to open the expression editor.
4. Click Lo ad .
5. Select either a saved virtual machine search or a virtual machine report filter. (Note that the
set of items to select will depend on the type of resource you are searching.)
6. Click Lo ad to load the search expression.
7. If you want to edit the expression, click on it and make any edits for the current expression.
58
Click
(C o mmi t expressi o n el ement chang es) to add the changes.
Click
(Und o the previ o us chang e) to remove the change you just made.
Chapt er 3. Infrast ruct ure
Click
(R ed o the previ o us chang e) to put the change that you just made back.
Click
(AND wi th a new expressi o n el ement) to create a logical AND with a
new expression element.
Click
(O R wi th a new expressi o n el ement) to create a logical OR with a new
expression element.
Click
(Wrap thi s expressi o n el ement wi th a NO T ) to create a logical NOT
on an expression element or to exclude all the items that match the expression.
Click
element.
(R emo ve thi s expressi o n el ement) to take out the current expression
8. Click Lo ad .
9. Click Appl y.
3.4 .2. Changing Views for Virt ual Machines and T emplat es
While you can set the default view for different pages in C o n f ig u re → My Set t in g s → D ef au lt
Views, the current view can also be controlled from the Virtual Machines pages.
Pro ced u re 3.4 2. T o C h an g e t h e View o f t h e Virt u al Mach in e Pag es
1. Navigate to In f rast ru ct u re → Virt u al Mach in es.
2. Click the accordion for the items to view.
3. Click the appropriate button for the desired view.
Click
for Grid View.
Click
for Tile View.
Click
for List View.
3.4 .3. Sort ing Virt ual Machines and T emplat es
Virtual machines and templates can be sorted by Name, Cluster, Host, D atastore, Compliance, Last
Analysis Time, Total Snapshots, or Region.
Pro ced u re 3.4 3. T o So rt Virt u al Mach in es o r T emp lat es
1. Navigate to In f rast ru ct u re → Virt u al Mach in es.
2. Click the accordion for the items to sort.
3. To sort virtual machines or templates when in grid or tile view:
a. From the So rt by dropdown, click the attribute to sort.
59
Red Hat CloudForms 3.0 Management Engine 5.2 Insight G uide
4. To sort virtual machines or templates when in list view:
a. Select the Li st Vi ew.
b. Click on the C o l umn Name to sort. For example, click on C l uster to sort by the
name of the cluster.
3.4 .4 . Creat ing a Virt ual Machine or T emplat e Report
For a listing of virtual machines and templates, you can create a quick report in CSV, TXT, or PD F
formats.
Pro ced u re 3.4 4 . T o C reat e a R eso u rce R ep o rt
1. Navigate to In f rast ru ct u re → Virt u al Mach in es.
2. Click the accordion for the items for report creation.
3. Click
(D o wnl o ad ).
Click
for a TXT file.
Click
for a CSV file.
Click
for a PD F file.
3.4 .5. Searching for Virt ual Machines or T emplat es
To the right of the taskbar on the Vi rtual Machi nes page, you can enter names or parts of names
for searching. You can search in the following ways.
Type characters that are included in the name. For example, if you type sp1, all Virtual Machines
whose names include sp1 appear, such as Wi nd o ws20 0 3sp1 and Sp1cl o ne.
Use * at the end of a term to search for names that begin with specific characters. For example,
type v* to find all virtual machines whose names begin with the letter v.
Use * at the beginning of a term to search for names that end with specific characters. For
example, type *sp2 to find all virtual machines whose names end with sp2.
Erase all characters from the search box to go back to viewing all virtual machines.
Pro ced u re 3.4 5. T o Search b y Virt u al Mach in e o r T emp lat e N ame
1. Navigate to In f rast ru ct u re → Virt u al Mach in es.
2. Click the accordion for the items to search.
3. In the Name Fi l ter bar in the upper right corner of the window, type your criteria.
4. Click
60
(Search by Name wi thi n resul ts) or press Enter.
Chapt er 3. Infrast ruct ure
5. Type in other criteria to filter on what is currently displayed.
6. Click
(Search by Name wi thi n resul ts) or press Enter.
3.4 .6. Analyz ing Virt ual Machines and T emplat es
Analyze a virtual machine to collect metadata such as user accounts, applications, software patches,
and other internal information. If CloudForms Management Engine is not set up for automatic
analysis, perform a manual analysis of a virtual machine. To perform a SmartState analysis,
CloudForms Management Engine requires a running SmartProxy with visibility to the virtual
machine's storage location. If the virtual machine is associated with a host or provider, ensure the
virtual machine is registered with that system to be properly analyzed; the server requires this
information since a snapshot might be created.
Note
SmartState Analysis of a virtual machine requires access to its host. To perform a successful
analysis, edit the virtual machine's host and enter the host's authentication credentials.
Pro ced u re 3.4 6 . T o An alyz e Mu lt ip le Virt u al Mach in es o r T emp lat es
1. Navigate to In f rast ru ct u re → Virt u al Mach in es.
2. Click the accordion for the items to analyze.
3. Check the Vi rtual Machi nes and T empl ates to analyze.
4. Click
(C o nfi g urati o n), and then
taskbar.
(P erfo rm SmartState Anal ysi s) on the
5. Click O K to confirm.
3.4 .6 .1 . Re d Hat Ent e rprise Virt ualizat io n Pre re quisit e s
3.4 .6 .1.1. Smart St at e An alysis o n R ed H at En t erp rise Virt u aliz at io n Man ag er 3.1 an d
Ab o ve - St o rag e Su p p o rt N o t es
Note the following requirements when performing SmartState Analysis on Red Hat Enterprise
Virtualization Manager 3.1 and above.
N FS
The CloudForms Management Engine appliance requires a mount to the NFS datastore.
iSC SI / FC P
For Red Hat Enterprise Virtualization 3.1 and 3.2, clusters must use full Red Hat Enterprise Linux
hosts and not Red Hat Enterprise Virtualization Hypervisor hosts. You can use either type of host
in Red Hat Enterprise Virtualization 3.3 and above.
Each CloudForms Management Engine Appliance performing SmartState Analysis requires
sharable, non-bootable D irectLUN access to each attached iSCSI/FCP storage domain. In order
to perform smart analysis, the appliance must mount the data storage as a D irectLUN disk.
61
Red Hat CloudForms 3.0 Management Engine 5.2 Insight G uide
A CloudForms Management Engine Appliance must reside in each datacenter with the iSCSI / FCP
storage type.
O t h er N o t es
The Set Server R el ati o nshi p option enables the VM SmartState Analysis job to determine
the datacenter where a CloudForms Management Engine Appliance is running and thus to
identify what storage it has access to in a RHEV environment.
After setting up a CloudForms Management Engine Appliance and performing a refresh of
the provider, find the CloudForms Management Engine Appliance in the Vi rtual
Machi ne accordion list and view its summary screen.
Click C o n f ig u rat io n → Ed it Server R elat io n sh ip .
Select the server that relates to this instance of the CloudForms Management Engine
Appliance.
Important
If you attach a D irectLUN disk after configuring the CloudForms Management Engine
database, access the Appliance in a terminal and run pvscan to detect the D irectLUN disk.
Alternatively, in CloudForms Management Engine 5.2.1 and above, you can restart the
Appliance to detect the disk automatically.
3.4 .6 .1.2. Smart St at e An alysis o n R ed H at En t erp rise Virt u aliz at io n Man ag er 3.0 St o rag e Su p p o rt N o t es
There are two additional steps required to perform a SmartState Analysis on Red Hat Enterprise
Virtualization Manager 3.0 using iSCSI or FCP storage. NFS storage does not have these
requirements.
1. Enable D irectLUN support for the host and CloudForms Management Engine Appliance that
performs the analysis.
Enable D irectLUN on host.
Enable D irectLUN on the CloudForms Management Engine Appliance. To do this, edit the
desired Red Hat Enterprise Virtualization storage and get the LUNID value. Then, on the
CloudForms Management Engine Appliance virtual machine in the Red Hat Enterprise
Virtualization user interface, right-click and select Ed i t+C usto m P ro perti es and enter
the following in the C usto m P ro perti es edit box:
directlun=<LUN ID>:readonly
If you have multiple storage domains separate them by a comma, similar to:
directlun=<LUN ID 1>:readonly,<LUN ID 2>:readonly,<LUN ID
N>:readonly
62
Chapt er 3. Infrast ruct ure
Note
The CloudForms Management Engine Appliance must reside in the same data
center as the storage you are trying to connect. If you have multiple data centers
with iSCSI or FCP storage, you need a CloudForms Management Engine Appliance
in each data center to support virtual machine scanning.
2. Set Server Relationship - This is required to allow the virtual machine SmartState analysis
job to determine which data center a CloudForms Management Engine Appliance is running
and therefore identify what storage it has access to in a Red Hat Enterprise Virtualization
environment.
a. After setting up a CloudForms Management Engine Appliance and performing a
refresh of the Provider, find the CloudForms Management Engine Appliance in the
Vi rtual Machi ne accordion list and view its summary screen.
b. Click
(C o nfi g urati o n), and then
(Ed i t Server R el ati o nshi p)
c. Select the server that relates to this instance of the CloudForms Management Engine
Appliance.
3.4 .6 .1.3. U p g rad es f ro m R ed H at En t erp rise Virt u aliz at io n Man ag er 3.0 t o 3.1
Environments upgrading from Red Hat Enterprise Virtualization Manager 3.0 to 3.1 might encounter
issues regarding SSL communications with CloudForms Management Engine. This issue occurs
from version 3.1 due to Apache being used as a front end to handle the SSL requests. The upgrade
to 3.1 does not reconfigure the Management System for this. [2]
A change to the Red Hat Enterprise Virtualization Manager configuration allows CloudForms
Management Engine to use SSL to connect rather than the current TLS.
1. Log into the Red Hat Enterprise Virtualization Manager server's terminal as the ro o t user.
2. Modify the /usr/share/o vi rt-eng i ne/servi ce/eng i ne-servi ce. xml . i n file.
3. Scroll to pro to co l s inside the ssl tag. The current value of the protocols attribute is
T LSv1.
<ssl>
<protocols>TLSv1</protocols>
</ssl>
4. Replace the value of the pro to co l s attribute with SSLv3,T LSv1.
<ssl>
<protocols>SSLv3,TLSv1</protocols>
</ssl>
5. Save the file.
6. Restart the Red Hat Enterprise Virtualization Manager server.
In addition, set the Server R el ati o nshi p for CloudForms Management Engine.
1. Select the CloudForms Management Server's virtual machine from Services → Virt u al
63
Red Hat CloudForms 3.0 Management Engine 5.2 Insight G uide
Mach in es.
2. Go to C o n f ig u rat io n → Ed it Server R elat io n sh ip and select the appropriate
CloudForms Management Engine Server.
3.4 .6 .2 . VMware vSphe re Pre re quisit e s
3.4 .6 .2.1. In st allin g VMware VD D K o n C lo u d Fo rms Man ag emen t En g in e
Execution of SmartState Analysis on virtual machines within a VMware environment requires the
Virtual D isk D evelopment Kit (VD D K). CloudForms Management Engine supports VD D K 5.5.
Pro ced u re 3.4 7. T o In st all t h e VD D K o n a C lo u d Fo rms Man ag emen t En g in e Ap p lian ce
1. D ownload VD D K 5.5 (VMware-vi x-d i skl i b-5. 5. 0 -1284 54 2. x86 _6 4 . tar. g z at the
time of this writing) from the VMware website.
Note
If you do not already have a login ID to VMware, then you will need to create one. At
the time of this writing, the file can be found by navigating to D o wn lo ad s → All
D o wn lo ad s, D rivers & T o o ls → VMware vSp h ere → D rivers & T o o ls. Expand
Auto mati o n T o o l s and SD Ks, and select vSphere Vi rtual D i sk
D evel o pment Ki t 5. 5. Alternatively, find the file by searching for it using the
Search on the VMware site.
2. D ownload and copy the VMware-vi x-d i skl i b-5. 5. 0 -1284 54 2. x86 _6 4 . tar. g z file
to the /ro o t directory of the appliance.
3. Start an SSH session into the appliance.
4. Extract and install VD D K 5.5. using the following commands:
#
#
#
#
cd /root
tar -xvf VMware-vix-disklib-5.5.0-1284542.x86_64.tar.gz
cd vmware-vix-disklib-distrib
./vmware-install.pl
5. Accept the defaults during the installation
Installing VMware VIX DiskLib API.
You must read and accept the VMware VIX DiskLib API End User
License Agreement to continue.
Press enter to display it.
Do you accept? (yes/no) yes
Thank you.
What prefix do you want to use to install VMware VIX DiskLib API?
The prefix is the root directory where the other folders such as
man, bin, doc, lib, etc. will be placed.
[/usr]
(P ress Enter)
64
Chapt er 3. Infrast ruct ure
The installation of VMware VIX DiskLib API 5.5.0 build-1284542 for
Linux completed successfully. You can decide to remove this
software from your system at any time by invoking the following
command: "/usr/bin/vmware-uninstall-vix-disklib.pl".
Enjoy,
--the VMware team
6. Run l d co nfi g in order for CloudForms Management Engine to find the newly installed
VD D K library.
Note
Use the following command to verify the VD D K files are listed and accessible to the
appliance:
# ldconfig -p | grep vix
7. Restart the CloudForms Management Engine Appliance.
R esu lt :
The VD D K is now installed on the CloudForms Management Engine Appliance. This enables use of
the SmartState Analysis Server Role on the appliance.
3.4 .7. Comparing Virt ual Machines and T emplat es
The CloudForms Management Engine Server allows you to compare multiple virtual machines. This
allows you to see how different virtual machines are from their original template. This helps detect
missing patches, unmanaged user accounts, or unauthorized services.
Use the comparison feature to:
Compare multiple virtual machines from different hosts.
Compare multiple virtual machines side-by-side.
Quickly see similarities and differences among multiple virtual machines and a base.
Narrow the comparison display to categories of properties.
Print or export in the comparison results to a PD F or CSV file.
Pro ced u re 3.4 8. T o C o mp are Virt u al Mach in es an d T emp lat es
1. Navigate to In f rast ru ct u re → Virt u al Mach in es.
2. Click the accordion for the items to analyze.
3. Check the items to compare
4. Click
(C o nfi g urati o n), and then
(C o mpare Sel ected ). The comparison
displays in a compressed view with a limited set of properties listed.
65
Red Hat CloudForms 3.0 Management Engine 5.2 Insight G uide
5. To delete an item from the comparison, click
(R emo ve thi s fro m the co mpari so n)
at the bottom of the items column. This option is only available when comparing more than
two virtual machines.
6. To view many items on one screen, go to a compressed view by clicking
Vi ew). To return to an expanded view, click
(C o mpressed
(Expand ed Vi ew).
7. To limit the mode of the view, there are two buttons in the task bar.
a. Click
(D etai l s Mo d e) to see all details for an attribute.
b. Click
(Exi sts Mo d e) to limit the view to if an attribute exists compared to the
base or not. This only applies to attributes that can have a boolean property. For
example, a user account exists or does not exist, or a piece of hardware that does or
does not exist.
8. To change the base virtual machine that all the others are compared to, click its label at the
top of its column.
9. To go to the summary screen for a virtual machine, click its Vi rtual T humbnai l or icon.
3.4 .7 .1 . Virt ual Machine and T e m plat e s Co m pariso n Se ct io ns
The following table describes the different sections for comparison information.
Sect io n
D escrip t io n
Properties
Use this section to see basic information on the
file location of the virtual machine, its name, and
the virtual machine monitor vendor. Hardware,
disk, CD /D VD drives, floppy drive, network
adapter, and volume information is also
included.
Use this to see users and groups for the virtual
machine, including those which may be
unauthorized compared to a template.
Use this to see Guest Applications, Win32
services, Linux Init Processes, Kernel D rivers,
File System D rivers, and Patches.
Security
Configuration
66
Chapt er 3. Infrast ruct ure
Sect io n
D escrip t io n
My Company Tags
Use this to see all tags.
3.4 .7 .2 . Using t he Virt ual Machine Co m pariso n Se ct io ns
Use the comparison sections to view various comparison data and display the data in different ways.
Pro ced u re 3.4 9 . T o U se C o mp ariso n Sect io n s
1. On the left of a comparison screen, select what categories of properties to display.
2. Click Appl y.
3. Click the plus sign next to the sections name to expand it.
4. The following descriptions pertain to the Expand ed Vi ew
. Whether you see the value
of a property or an icon representing the property depends on the properties type.
A property displayed in the same color as the base means that the compared virtual
machine matches the base for that property.
A property displayed in a different color from the base means that the compared virtual
machine does not match the base for that property.
5. If you are in the C o mpressed Vi ew
, the values of the properties will not be displayed.
The icons shown below will describe all items.
A
(checkmark) means that the compared virtual machine matches the base for that
property. If you hover over it, the value of the property will display.
A
(x) means that the compared virtual machine does not match the base for that
property. If you hover over it, the value of the property will display.
6. Click the minus sign next to the sections name to collapse it.
R esu lt :
Your comparison can be viewed in multiple ways. Export the data or create a report from your
comparison for analysis using external tools.
3.4 .7 .3. Cre at ing a Virt ual Machine Co m pariso n Re po rt
Output a the data from a comparison report in TXT, CSV or PD F formats.
Pro ced u re 3.50. T o C reat e a C o mp ariso n R ep o rt
1. Create the comparison for the report.
2. Click the output button for the chosen report type.
67
Red Hat CloudForms 3.0 Management Engine 5.2 Insight G uide
Click
(D o wnl o ad co mpari so n repo rt i n T XT fo rmat) for a text file.
Click
(D o wnl o ad co mpari so n repo rt i n C SV fo rmat) for a csv file.
Click
(D o wnl o ad co mpari so n repo rt i n P D F fo rmat) for a PD F file.
3.4 .8. Refreshing Virt ual Machines and T emplat es
Refresh your virtual machines to get the latest data the provider or host can access. This includes
information such as the power state, container, and hardware devices attached to the virtual
machine.
Pro ced u re 3.51. T o R ef resh Mu lt ip le Virt u al Mach in es
1. Navigate to In f rast ru ct u re → Virt u al Mach in es.
2. Click the accordion for the items to analyze.
3. Check the items to refresh.
4. Click
(C o nfi g urati o n), and then
(R efresh R el ati o nshi ps and P o wer
States) on the Vi rtual Machi ne T askbar.
R esu lt :
The console returns a refreshed list of the data associated with the selected virtual machines.
3.4 .9. Ext ract ing Running Processes from Virt ual Machines and T emplat es
CloudForms Management Engine can collect processes running on Windows virtual machines. To
do this, enter domain credentials for the zone where the virtual machine is located. For more
information, refer to the CloudForms Management Engine Settings and Operations Guide. The virtual
machine must be running and must have an IP address in the VMD B, usually obtained from a
SmartState Analysis.
Pro ced u re 3.52. T o C o llect R u n n in g Pro cesses
1. Navigate to In f rast ru ct u re → Virt u al Mach in es.
2. Check the Virtual Machines to collect the processes.
3. Click
(C o nfi g urati o n), and then
Taskbar.
(Extract R unni ng P ro cesses) on the
4. Click O K to confirm.
R esu lt :
The server returns the running processes. View the summary of the virtual machine to see the details.
3.4 .10. Set t ing Ownership for Virt ual Machines and T emplat es
68
Chapt er 3. Infrast ruct ure
You can set the owner of a group of virtual machines and templates by either individual user or
group. This allows you an additional way to filter and can be used to enforce quotas.
Pro ced u re 3.53. T o Set O wn ersh ip
1. Navigate to In f rast ru ct u re → Virt u al Mach in es.
2. Click the accordion for the items to change.
3. Check the items to set ownership.
4. Click
(C o nfi g urati o n), and then
(Set O wnershi p) on the Vi rtual
Machi ne T askbar.
5. From the Sel ect an O wner dropdown, select a user, and from the Sel ect a G ro up
dropdown, select a group
6. Click Save.
3.4 .11. Removing Virt ual Machines and T emplat es from t he VMDB
If a virtual machine has been decommissioned or you need to perform some troubleshooting, you
might need to remove a specific virtual machine from the VMD B. This does not however remove the
virtual machine or template from its D atastore or Provider.
Pro ced u re 3.54 . T o R emo ve Virt u al Mach in es an d T emp lat es
1. Navigate to In f rast ru ct u re → Virt u al Mach in es.
2. Click the accordion for the items to remove.
3. Check the items to remove.
4. Click
(C o nfi g urati o n), and then
(R emo ve fro m the VMD B) button.
5. Click O K to confirm the deletion of chosen virtual machines.
3.4 .12. T agging Virt ual Machines and T emplat es
Pro ced u re 3.55. T o T ag Virt u al Mach in es an d T emp lat es
1. Navigate to In f rast ru ct u re → Virt u al Mach in es.
2. Click the accordion for the items to tag.
3. Check the items to tag.
69
Red Hat CloudForms 3.0 Management Engine 5.2 Insight G uide
4. Click
(P o l i cy), and then
(Ed i t T ag s).
5. Select a customer tag from the first dropdown, and then a value for the tag.
3.4 .13. Viewing Running Processes aft er Collect ion
Pro ced u re 3.56 . T o View R u n n in g Pro cesses af t er C o llect io n
1. Click a virtual machine with collected processes.
2. From the D i ag no sti cs area, click R unni ng P ro cesses.
R esu lt :
The most recent collection of running processes is displayed. Sort this list by clicking on the column
headers.
3.4 .14 . Edit ing Virt ual Machine or T emplat e Propert ies
Edit the properties of a virtual machine or template to set parent and child virtual machines.
SmartState Analysis also can detect this.
Pro ced u re 3.57. T o Ed it Virt u al Mach in e o r T emp lat e Pro p ert ies
1. Navigate to In f rast ru ct u re → Virt u al Mach in es.
2. Click the accordion for the items to edit.
70
Chapt er 3. Infrast ruct ure
3. Click the item to edit properties.
4. Click
(C o nfi g urati o n), and then
T empl ate) on the Taskbar.
(Ed i t thi s VM o r Ed i t thi s
5. From the P arent VM dropdown, select the parent virtual machine.
6. From C hi l d VM selection, select virtual machines that are based on the current virtual
machine from the list of Avai l abl e VMs.
7. Click Save.
3.4 .15. Set t ing Ownership of a Virt ual Machine or T emplat e
Set the owner of a virtual machine or template by either individual user or group. This allows you an
additional way to filter configuration items.
Pro ced u re 3.58. T o Set O wn ersh ip
1. Navigate to In f rast ru ct u re → Virt u al Mach in es.
2. Click the accordion for the items to analyze.
3. Click the item to set ownership.
4. Click
(C o nfi g urati o n), and then
(Set O wnershi p) on the taskbar.
5. From the Sel ect an O wner dropdown, select a user.
6. From the Sel ect a G ro up dropdown, select a group.
7. Click Save.
3.4 .16. Right Siz ing a Virt ual Machine
CloudForms Management Engine uses collected statistics to recommend the best size for a virtual
machine. CloudForms Management Engine uses the information from the No rmal O perati ng
R ang e to calculate the recommendations.
Pro ced u re 3.59 . T o R ig h t - siz e a Virt u al Mach in e
1. Navigate to In f rast ru ct u re → Virt u al Mach in es.
2. Click a virtual machine for right-sizing.
3. Click
(C o nfi g urati o n), and then
(R i g ht-Si ze R eco mmend ati o ns) button.
71
Red Hat CloudForms 3.0 Management Engine 5.2 Insight G uide
R esu lt :
A new page appears with three levels of Memory and CPU recommendations, Conservative,
Moderate, and Aggressive, next to the Normal Operating Range statistics.
3.4 .17. Viewing Capacit y and Ut iliz at ion Chart s for a Virt ual Machine
You can view capacity and utilization data for virtual machines that are part of a cluster. Note that
daily charts only include full days of data. If all 24 data points for a day are not available, daily
charts are not displayed. For some capacity and utilization data, CloudForms Management Engine
calculates and shows trend lines in the charts which are created using linear regression. The
calculation uses the capacity and utilization data collected by CloudForms Management Engine
during the interval you specify.
Note
You must have a server with network visibility to your provider assigned the server role of
C apaci ty & Uti l i zati o n C o l l ecto r to use this feature. For more information, refer to
the CloudForms Management Engine Settings and Operations Guide.
The virtual machine must be powered on to collect the data.
Pro ced u re 3.6 0. T o View C ap acit y an d U t iliz at io n C h art s f o r a Virt u al Mach in e
1. From In f rast ru ct u re → Virt u al Mach in es, click the accordion that you want to view
capacity data for.
2. Click the item you want to view.
3. Click
(Mo ni to ri ng ), and then
(Uti l i zati o n).
4. From Interval , select to view D aily, H o u rly, or Mo st R ecen t H o u r data points. When
choosing D aily, you can also select the D at e, and how far back you want to go from that
date. When selecting H o u rly, you can select the date for which you want to view hourly data.
If you are using T ime Pro f iles, you will be able to select that as an option, also.
72
Chapt er 3. Infrast ruct ure
5. From C o mpare to , select Paren t H o st or Paren t C lu st er. The capacity and utilization
charts for both items will show simultaneously.
Note
D aily charts only include full days of data. This means CloudForms Management Engine does
not show daily data for a day without a complete 24 data point range for a day.
73
Red Hat CloudForms 3.0 Management Engine 5.2 Insight G uide
3.4 .18. Viewing t he Virt ual Machine or T emplat e T imeline
View the timeline of events for a virtual machine or template if registered to a Host.
Pro ced u re 3.6 1. T o View t h e T imelin e f o r a Virt u al Mach in e O r T emp lat e
1. Navigate to In f rast ru ct u re → Virt u al Mach in es.
2. Click the virtual machine to view the timeline.
3. Click
(Mo ni to ri ng ), and then
(T i mel i nes) on the taskbar.
4. From O pti o ns, customize the period of time to display, and the types of events to view.
Use the Interval dropdown to select hourly or daily data points.
Use D ate to type the date of the timeline to display.
If viewing a daily timeline, use Sho w to set how many days back to go. The maximum
history is 31 days.
The three Event G ro up dropdowns allow selection of different event groups to display.
Each has its own color.
From the Level dropdown, select either a Summary event or a D etai l list of events. For
example, the detail level of a P o wer O n event might include the power on request, the
starting event, and the actual Power On event. If you select Summary, you only see the
P o wer O n event in the timeline.
5. To see more detail on an item in the timeline, click on it. A balloon appears with a clickable
link to the resource.
3.4 .19. Virt ual Machine or T emplat e Summary
When you click on a specific virtual machine or template, you will see the Vi rtual T humbnai l ,
and an operating system-specific screen of the item, called the Summary. Where applicable, click on a
subcategory of the Summary to see more detail on that section.
Note
When you perform a SmartState Analysis on a virtual machine or template, you get more
detailed information in these categories.
P ro perti es include information such as the base operating system, hostname, IP addresses,
Virtual Machine vendor, CPU Affinity, devices attached to the system, and snapshots. This
includes the ability to analyze multiple partitions, multiple disks, Linux logical volumes, extended
partitions, and Windows drives. Some categories can be clicked on for additional detail. For
example, click C o ntai ner to view notes associated with a virtual machine.
74
Chapt er 3. Infrast ruct ure
Li fecycl e shows the date of discovery and the last analysis. If a retirement date or owner has
been set, these display as well.
R el ati o nshi ps include information on the parent host, genealogy such as parent and child
virtual machines, and drift.
75
Red Hat CloudForms 3.0 Management Engine 5.2 Insight G uide
Sto rag e R el ati o nshi ps shows relationships to Filers, LUNs, Volumes and File Shares.
VMsafe shows properties of the VMsafe agent if it is enabled.
No rmal O perati ng R ang es shows the values the normal operating range for this virtual
machine. These statistics are used in calculating right sizing recommendations.
76
Chapt er 3. Infrast ruct ure
P o wer Manag ement displays the current power state, last boot time, and last power state
change. State C hang ed O n is the date that the virtual machine last changed its power state.
This is a container view of the power state, therefore a restart of the operating system does not
cause the container power state to change and will not update this value.
Securi ty includes information on users, groups, and security patches. Recall that the items
shown on the Summary screen change based on the guest operating system.
C o nfi g urati o n includes information on applications, services, packages, and init processes.
This section changes depending on the base operating system.
77
Red Hat CloudForms 3.0 Management Engine 5.2 Insight G uide
D atasto re Al l o cati o n Summary shows how many and how much disk space has been
allocated to this virtual machine as well as disk alignment and thin provisioning information.
D atasto re Actual Usag e Summary shows how much disk and memory the virtual machine is
actually using.
D i ag no sti cs provides a link to viewing running processes and the information from the latest
collected event logs.
Smart Manag ement shows all tags assigned to this virtual machine.
3.4 .20. Viewing t he Operat ing Syst em Propert ies
View details of the operating system from the Vi rtual Machi ne Summary or the accordion. For
Windows systems, see Acco unt P o l i ci es for the virtual machine.
Pro ced u re 3.6 2. T o View O p erat in g Syst em Pro p ert ies an d Acco u n t Po licies
1. From In f rast ru ct u re → Virt u al Mach in es, click on the item to view its Summary.
2. From the P ro perti es section, click O perati ng System.
R esu lt :
An expanded view of the operating systems properties and Acco unt P o l i ci es displays. This
varies based on the operating system.
3.4 .21. Viewing Virt ual Machine or T emplat e Snapshot Informat ion
78
Chapt er 3. Infrast ruct ure
View the list of snapshots to see a history of their creation and size. CloudForms Management Engine
provides the description, size, and creation time of the snapshot as well as a view of the genealogy of
the snapshots.
Note
Snapshot size is only available after the successful completion of a SmartState Anal ysi s.
Pro ced u re 3.6 3. T o View Sn ap sh o t In f o rmat io n
1. Navigate to In f rast ru ct u re → Virt u al Mach in es.
2. Click the appropriate accordion containing the item you wish to view the snapshots of.
3. Click on the item to view its Summary.
4. From the Summary, click Snapsho ts in the P ro perti es area.
5. The list of snapshots show in a tree format and captures their genealogy.
3.4 .22. Viewing User Informat ion for a Virt ual Machine or T emplat e
CloudForms Management Engine's SmartState Anal ysi s feature returns user information. D rill
into the user to get details on the users account, including group memberships.
Pro ced u re 3.6 4 . T o View U ser G ro u p Memb ersh ip s
1. Navigate to In f rast ru ct u re → Virt u al Mach in es.
2. Click the accordion for the item to view user information.
3. Click on the item to view its Summary.
4. From the Securi ty section of the Vi rtual Machi ne Summary, click Users.
5. Click the user to view details.
3.4 .23. Viewing Group Informat ion for a Virt ual Machine or T emplat e
CloudForms Management Engine's SmartState Anal ysi s feature returns group information.
Explore a group to get a list of its users.
Pro ced u re 3.6 5. T o View G ro u p Memb ers
1. Navigate to In f rast ru ct u re → Virt u al Mach in es.
2. Click the accordion for the item to view user information.
3. Click on the item to view its Summary.
4. From the Securi ty section of the Vi rtual Machi ne Summary, click G ro ups.
5. Click the group to view users.
3.4 .24 . Viewing Genealogy of a Virt ual Machine or T emplat e
79
Red Hat CloudForms 3.0 Management Engine 5.2 Insight G uide
CloudForms Management Engine detects the lineage of a virtual machine. View a virtual machine's
lineage and compare the virtual machines that are part of its tree. This also allows tagging of virtual
machines that share genealogy.
Pro ced u re 3.6 6 . T o View G en ealo g y
1. Navigate to In f rast ru ct u re → Virt u al Mach in es.
2. Click the accordion for the item to view genealogy.
3. Click on the item to view its Summary.
4. From the R el ati o nshi ps area in the Summary, click G eneal o g y.
3.4 .25. Comparing Genealogy of a Virt ual Machine or T emplat e
Pro ced u re 3.6 7. T o View an d C o mp are G en ealo g y
1. Navigate to In f rast ru ct u re → Virt u al Mach in es.
2. Click the accordion for the item to view genealogy.
3. Click on the item to view its Summary.
4. From the R el ati o nshi ps area in the Summary, click G eneal o g y.
5. Check the items to compare.
6. Click
(C o mpare Sel ected VMs).
7. For more information on the C o mpare feature, see C o mpari ng Vi rtual Machi nes.
3.4 .26. T agging Virt ual Machines or T emplat es wit h a Common Genealogy
Pro ced u re 3.6 8. T o T ag Virt u al Mach in es o r T emp lat es wit h a C o mmo n G en ealo g y
1. Navigate to In f rast ru ct u re → Virt u al Mach in es.
2. Click the accordion for the item to view genealogy.
3. Check the items to tag.
4. Click
(P o l i cy), and then
(Ed i t T ag s).
5. Select a customer tag from the first dropdown, and then a value for the tag.
3.4 .27. Det ect ing Drift on Virt ual Machines or T emplat es
80
Chapt er 3. Infrast ruct ure
The configuration of a virtual machine might change over time. D ri ft is the comparison of a virtual
machine to itself at different points in time. The virtual machine need analysis at least twice to collect
this information. D etecting drift provides you the following benefits:
See the difference between the last known state of a machine and its current state
Review the configuration changes that happen to a particular virtual machine between multiple
points in time.
Review the host and datastore association changes that happen to a particular virtual machine
between multiple points in time.
Review the classification changes that happen to a virtual machine between 2 time checks.
Capture the configuration drifts for a single virtual machine across a time period.
Pro ced u re 3.6 9 . T o View D rif t o n a Virt u al Mach in e o r T emp lat e
1. Navigate to In f rast ru ct u re → Virt u al Mach in es.
2. Click on the item to view its Summary.
3. From the R el ati o nshi ps area in the Summary, click D ri ft Hi sto ry.
4. Check the analyses to compare.
5. Click
(Sel ect up to 10 ti mestamps fo r D ri ft Anal ysi s) at the top of the
screen. The results display.
6. Check the D ri ft sections on the left to view in your comparison.
7. Click Appl y.
8. The following descriptions pertain to the Expand ed Vi ew
. Whether you see the value
of a property or an icon representing the property depends on the properties type.
A property displayed in the same color as the base means the compared analysis matches
the base for that property.
A property displayed in a different color from the base means the compared analysis does
not match the base for that property.
9. If you are in the C o mpressed Vi ew
, the values of the properties are not displayed. All
items are described by the icons shown below.
A
(checkmark) means that the compared analysis matches the base for that
property. If you hover over it, the value of the property will display.
A
(tri ang l e) means the compared analysis does not match the base for that
property. If you hover over it, the value of the property displays. Click the minus sign next
to the sections name to collapse it.
10. To limit the scope of the view, you have three buttons in the R eso urce button area.
81
Red Hat CloudForms 3.0 Management Engine 5.2 Insight G uide
Click
(Al l attri butes) to see all attributes of the sections you selected.
Click
(Attri butes wi th d i fferent val ues) to see only the attributes that are
different across the drifts.
Click
(Attri butes wi th the same val ues) to see only the attributes that are the
same across drifts.
11. To limit the mode of the view, there are two buttons in the R eso urce button area.
Click
(D etai l s Mo d e) to see all details for an attribute.
Click
(Exi sts Mo d e) to only see if an attribute exists compared to the base or not.
This only applies to attributes that can have a Boolean property. For example, a user
account exists or does not exist, or a piece of hardware that does or does not exist.
R esu lt :
This creates a drift analysis. D ownload the data or create a report from your drift for analysis using
external tools.
3.4 .28. Creat ing a Drift Report for a Virt ual Machine or T emplat e
Pro ced u re 3.70. T o C reat e a D rif t R ep o rt
1. Create the comparison to analyze.
2. Click
(D o wnl o ad ).
3. Click the output button for the type of report you want.
Click
(D o wnl o ad d ri ft repo rt i n text fo rmat) for a text file.
Click
(D o wnl o ad d ri ft repo rt i n C SV fo rmat) for a csv file.
Click
(D o wnl o ad d ri ft repo rt i n P D F fo rmat) for a PD F file.
3.4 .29. Viewing Analysis Hist ory for a Virt ual Machine or T emplat e
Each time a SmartState Analysis is performed on a virtual machine, a record is created of the task.
This information is accessed either from the Vi rtual Machi ne Acco rd i o n or the Vi rtual
Machi ne Summary. Use this detail to find when the last analysis was completed and if it completed
successfully. If the analysis resulted in an error, the error is shown here.
Pro ced u re 3.71. T o View An alysis H ist o ry
1. Navigate to In f rast ru ct u re → Virt u al Mach in es.
2. Click the accordion for the item to view genealogy.
82
Chapt er 3. Infrast ruct ure
3. Click on the item to view its Summary.
4. From the R el ati o nshi ps area in the Summary, click Anal ysi s Hi sto ry. A history of up
to the last 10 analyses is displayed.
5. Click on a specific analysis to see its details.
3.4 .30. Viewing Disk Informat ion for a Virt ual Machine or T emplat e
Each time a SmartState Analysis is performed on a virtual machine or template, information on the
disks associated with the item is collected. This includes free and used space information as well as
the type of disk and file system.
Pro ced u re 3.72. T o View D isk In f o rmat io n
1. Navigate to In f rast ru ct u re → Virt u al Mach in es.
2. Click on the item to view its Summary.
3. From D atasto re Al l o cati o n Summary, click D i sks.
R esu lt :
A list of the disks for the item with type, file system, size, and usage information is displayed.
3.4 .31. Viewing Event Logs for a Virt ual Machine or T emplat e
Using an Anal ysi s P ro fi l e, collect event log information from your virtual machines. See the
CloudForms Management Engine Settings and Operations Guide, C reati ng a D efaul t Anal ysi s
P ro fi l e.
Note
This feature is only available for Windows.
Pro ced u re 3.73. T o View Even t Lo g s
1. Navigate to In f rast ru ct u re → Virt u al Mach in es.
2. Click the accordion for the item to view event logs.
3. Click on the item to view its Summary.
4. From D i ag no sti cs click Event Lo g s.
83
Red Hat CloudForms 3.0 Management Engine 5.2 Insight G uide
R esu lt :
The collected event log entries are displayed. Sort this list by clicking on the column headers.
3.5. Resource Pools
Resource pools are used to allocate CPU and memory across a group of virtual machines.
3.5.1. Removing a Resource Pool
If a resource pool is decommissioned or requires troubleshooting, it might require removal from the
VMD B.
Pro ced u re 3.74 . T o R emo ve a R eso u rce Po o l
1. Navigate to In f rast ru ct u re → R eso u rce Po o ls.
2. Click on the resource pool to remove.
3. Click
(C o nfi g urati o n), and then
(R emo ve fro m the VMD B).
4. Click O K to confirm the resource pool removal.
R esu lt :
The resource pool is removed. The virtual machines remain in the VMD B, but are no longer
associated with this resource pool.
3.5.2. T agging a Resource Pool
Use tags to categorize a resource pool. Before assigning tags, create them using the instructions in
the CloudForms Management Engine Settings and Operations Guide.
Pro ced u re 3.75. T o T ag a R eso u rce Po o l
1. Navigate to In f rast ru ct u re → R eso u rce Po o ls.
2. Click the resource pool to tag.
3. Click
(P o l i cy), and then
(Ed i t T ag s).
4. Select a customer tag from the first dropdown, and then a value for the tag.
3.5.3. Viewing t he Resource Pool Summary
Use the Resource Pool Summary to see the number of discovered virtual machines, the parent host,
and the parent cluster. It is the default view when you click on one resource pool.
3.5.4 . Resource Pools Accordion
84
Chapt er 3. Infrast ruct ure
3.5.4 . Resource Pools Accordion
Use the Resource Pools Accordion to access the properties of and objects associated with the
resource pool.
Click P ro perti es to view the Resource Pools Summary screen.
Click R el ati o nshi ps to see the clusters, virtual machines, and hosts related to this resource
pool.
3.6. Dat ast ores
A storage location is considered a device where digital information resides and is connected to a
resource. CloudForms Management Engine detects, analyzes, and collects capacity and utilization
data for both VMFS and NFS datastores. D atastores connected to a provider are automatically
created on discovery. On creation of a repository, a datastore is automatically created.
After detecting datastores, you might want to examine them more closely to see virtual machines,
hosts, and available space.
1. Top left quadrant: File system type
2. Bottom left quadrant: Number of hosts
3. Top right quadrant: Number of virtual machines
4. Bottom right quadrant: Available space
3.6.1. Performing Smart St at e Analysis on Dat ast ores
85
Red Hat CloudForms 3.0 Management Engine 5.2 Insight G uide
Analyze a datastore to collect information on the types of files on a datastore, and to see the number
of managed/registered, managed/unregistered, and unmanaged virtual machines. To perform a
SmartState analysis, the datastore is accessible from a running host and valid security credentials
are supplied for that host.
Note
Be aware that executing a SmartState Analysis on a datastore from the console takes a while
to return data on the content. If Capacity and Utilization roles are enabled, CloudForms
Management Engine performs the analysis automatically on a scheduled basis approximately
every 24 hours.
Pro ced u re 3.76 . T o An alyz e Mu lt ip le D at ast o res
1. Navigate to In f rast ru ct u re → D at ast o res.
2. Check the datastores to analyze.
3. Click
(C o nfi g urati o n), and then
(P erfo rm SmartState Anal ysi s).
4. Click O K to confirm the analysis of the D atastores.
3.6.2. Viewing a Dat ast ore
You can click on a specific D atastore to view its details. The screen provides you with a D atastore
Taskbar, Virtual Thumbnail, Accordion, and Summary.
Fig u re 3.4 . D at ast o re Man ag emen t Screen
1. D atastore Taskbar: Choose between Configuration, Policy and Monitoring options for the
selected D atastore
2. D atastore Summary: See summary such as datastore properties, storage, VM information.
86
Chapt er 3. Infrast ruct ure
3. D atastore Summary Views: Choose between graphical or text view of the datastore summary
4. D atastore PD F: Generates datastore summary in PD F format
5. D atastore Accordion: See details about Properties, Relationships, Storage Relationships and
Content for the chosen datastore
3.6.3. T agging a Dat ast ore
Use tags to categorize a datastore. Before assigning tags, create them with instructions in the
CloudForms Management Engine Settings and Operations Guide.
Pro ced u re 3.77. T o T ag a D at ast o re
1. Navigate to In f rast ru ct u re → D at ast o res.
2. Click the datastore to tag.
3. Click
(P o l i cy), and then
(Ed i t T ag s).
4. Select a customer tag from the first dropdown, and then a value for the tag.
5. Select more tags or click Save to save your changes.
3.6.4 . Viewing Capacit y and Ut iliz at ion Chart s for a Dat ast ore
You can view capacity and utilization data for a datastore.
Note
CloudForms Management Engine requires network visibility to your provider assigned the
server role of C apaci ty & Uti l i zati o n C o l l ecto r to enable this feature. Refer to the
CloudForms Management Engine Settings and Operations Guide for more information.
Pro ced u re 3.78. T o View C ap acit y an d U t iliz at io n C h art s f o r a D at ast o re
1. Navigate to In f rast ru ct u re → D at ast o res, then click the D atastore that you want to view
Capacity and Utilization data for.
2. Click
(Mo ni to ri ng ), and then
(Uti l i zati o n) or from the D atastore Accordion,
click Pro p ert ies → C ap acit y & U t iliz at io n .
3. From Interval , select to view hourly or daily data points and the dates to view data. Use VM
T ypes to Incl ud e to include only managed/registered, managed/unregistered, or
unmanaged virtual machines. The following definitions will be helpful.
87
Red Hat CloudForms 3.0 Management Engine 5.2 Insight G uide
Managed/Registered VM - A virtual machine connected to a host and exists in the VMD B.
Also, a template connected to a management system and exists in the VMD B.
Note
Templates cannot be connected to a Host.
Managed/Unregistered VM - A virtual machine or template that resides on a repository or is
no longer connected to a management system or host and exists in the VMD B. A virtual
machine previously considered registered might become unregistered if the virtual
machine is removed from management system inventory.
Not Managed - Files discovered on a datastore that do not have a virtual machine
associated with them in the VMD B. These files might be registered to a management
system that CloudForms Management Engine does not have configuration information.
Possible causes might be the management system has not been discovered or the
management system has been discovered but no security credentials are provided.
Use T i me P ro fi l es to select a time range for the data.
The Capacity & Utilization Collector charts are displayed.
Note
D aily charts only include full days of data. If a day does not include all the 24 data points for
a day, the data does not show for that day.
3.6.5. Removing a Dat ast ore
If a datastore no longer contains any files associated with the virtual environment, remove it from the
VMD B. This button is enabled only if a datastore is completely empty.
Pro ced u re 3.79 . T o R emo ve a D at ast o re
1. Navigate to In f rast ru ct u re → D at ast o res.
2. Click on the D atastore to remove.
3. Click
(C o nfi g urati o n), and then
4. Click O K to confirm.
3.7. Reposit ories
88
(R emo ve D atasto re fro m the VMD B).
Chapt er 3. Infrast ruct ure
Repositories are directories where virtual machines not associated with a host are stored.
CloudForms Management Engine allows discovery and refresh of virtual machines in repositories
without any additional software loaded on the computer where the repository is located. A
SmartProxy is required for analyzing virtual machines in a repository.
Note
Any applied filters will be in effect here.
Use the Repository Taskbar to manage the existence and refreshing of your repositories. These
buttons are used to manage multiple items at one time. To manage a repository, click on that
repository in the main area of the screen.
3.7.1. Adding a Reposit ory
To refresh a repository for more detailed information, add it to your VMD B first. The VMD B requires a
network path to the repository.
Pro ced u re 3.80. T o Ad d a R ep o sit o ry
1. Navigate to In f rast ru ct u re → R ep o sit o ries.
2. Click
(C o nfi g urati o n), then click
(Ad d a new R epo si to ry).
3. In Basi c Info rmati o n, type in a Name and P ath to the location.
4. Click Save.
3.7.2. Edit ing a Reposit ory
Use the following procedure to edit information about the repository, such as the name and path.
Pro ced u re 3.81. T o Ed it R ep o sit o ry In f o rmat io n
1. Navigate to In f rast ru ct u re → R ep o sit o ries.
2. Click the repository to edit.
3. Click
(C o nfi g urati o n), and then
(Ed i t the Sel ected R epo si to ry).
4. In Basi c Info , edit the name and path to connect to the repository.
5. Click Save.
3.7.3. Refreshing Mult iple Reposit ories
89
Red Hat CloudForms 3.0 Management Engine 5.2 Insight G uide
3.7.3. Refreshing Mult iple Reposit ories
Refresh a repository for its properties and virtual machines.
Pro ced u re 3.82. T o R ef resh Mu lt ip le R ep o sit o ries
1. Navigate to In f rast ru ct u re → R ep o sit o ries.
2. Check the repositories to refresh.
3. Click
(C o nfi g urati o n), and then
States).
(R efresh R el ati o nshi ps and P o wer
4. Click O K to confirm the refresh.
R esu lt :
Identify a SmartProxy that has access to the repository to refresh it. Refer to the CloudForms
Management Engine Settings and Operations Guide for more information about the D efaul t
R epo si to ry SmartProxy parameter.
Note
If you are using more than one CloudForms Management Engine Appliance, be sure to set the
D efaul t R epo si to ry SmartProxy on all of the appliances.
3.7.4 . T agging Reposit ories
Apply tags to categorize certain repositories together at the same time. Before assigning tags, create
them using the instructions in the CloudForms Management Engine Settings and Operations Guide.
Pro ced u re 3.83. T o T ag R ep o sit o ries
1. Navigate to In f rast ru ct u re → R ep o sit o ries.
2. Check the repositories to tag.
3. Click
(P o l i cy), and then
(Ed i t T ag s).
4. Select a customer tag from the first dropdown, and then a value for the tag.
5. Select more tags or click Save to save your changes.
3.7.5. Viewing a Reposit ory
You can click on a specific repository to view its details. The screen provides you with a Repository
Taskbar, a Repository Accordion, and a Repository Summary.
90
Chapt er 3. Infrast ruct ure
Fig u re 3.5. R ep o sit o ry Man ag emen t Screen
1. Repository Taskbar: Perform actions on the selected repository using Configuration and
Policy
2. Repository Summary: See details about the virtual machines related to the selected repository
3. Repository Views: Choose between graphical or text view of the Repository summary
4. Repository PD F: Generates repository summary in PD F format
5. Repository Accordion: See details such as Properties and Relationships of the virtual
machine related to the selected repository
3.7.6. Removing Reposit ories
If a repository is decommissioned or requires troubleshooting, it might require removal.
Pro ced u re 3.84 . T o R emo ve R ep o sit o ries
1. Navigate to In f rast ru ct u re → R ep o sit o ries.
2. Check the repositories to remove.
3. Click
(C o nfi g urati o n), and then
(R emo ve fro m the VMD B).
4. Click O K to confirm.
R esu lt :
The repositories are removed. Any virtual machines associated with the repositories remain, but are
no longer associated with their respective repository. When removing a repository, the associated
datastore instance is not deleted.
3.7.7. PXE Servers
PXE servers are used by CloudForms Management Engine to bootstrap virtual machines for the
purpose of provisioning. They include images for different operating systems that can be customized
using customization templates and are used in conjunction with IPMI Servers. Refer to the
CloudForms Management Engine Lifecycle and Automation Guide for more information.
91
Red Hat CloudForms 3.0 Management Engine 5.2 Insight G uide
[2] This is d o c umented in the fo llo wing link o n Red Hat Bug z illa:
http s ://b ug z illa.red hat.c o m/s ho w_b ug .c g i?id =8 9 39 79
92
Chapt er 4 . Clouds
Chapter 4. Clouds
Cloud computing provides a set of pooled resources used to create a set of scalable virtual machine
instances. Resources includes CPUs, memory, storage, and networking. While users of virtualization
infrastructure environments provision whole virtual machines, users of cloud computing
environments provision only the necessary resources to build their instances. This means the
customer can easily scale their instances by provisioning more resources. Metric usage is focused
on the hardware layer, and results in the user paying only the necessary resources.
For example, a user might use an instance to store a web server. D uring peak times of use, the user
provisions more cloud resources to maintain the performance of the server. D uring quiet times, the
user reduces the consumption of cloud resources. As a result, the user only uses and pays for the
resources used.
CloudForms Management Engine offers a set of tools for viewing and maintaining cloud providers
and their associated resources. Supported cloud providers include:
Amaz o n EC 2 ( p u b lic clo u d ) : is a central part of Amazon.com's cloud computing platform that
allows users to rent virtual computers on which to run their own computer applications. It allows
scalable deployment of applications by providing a Web service through which a user can boot
an Amazon Machine Image to create a virtual machine, which Amazon calls an " instance" ,
containing any software desired.
O p en St ack ( p rivat e clo u d ) : Red Hat Enterprise Linux OpenStack Platform provides the
foundation to build a private or public Infrastructure-as-a-Service (IaaS) cloud on top of Red Hat
Enterprise Linux. It offers a massively scalable, fault-tolerant platform for the development of
cloud-enabled workloads. To learn more about OpenStack, see the Red Hat Enterprise Linux
OpenStack Platform Getting Started Guide.
4 .1. Providers
A cloud provider is a service that manages cloud resources. The P ro vi d ers page displays all
discovered or added cloud providers.
4 .1.1. Adding OpenSt ack Providers
CloudForms Management Engine supports operating with the OpenStack " admin" tenant. When
creating an OpenStack provider in CloudForms Management Engine, select the OpenStack
provider's admin user because it is the default administrator of the OpenStack admin tenant. When
using the admin credentials, a user in CloudForms Management Engine provisions into the admin
tenant, and sees images, networks, and instances that are associated with the admin tenant.
Pro ced u re 4 .1. T o Ad d an O p en St ack Pro vid er
1. Navigate to C lo u d s → Pro vid ers.
2. Click
(C o nfi g urati o n), then click
(Ad d a New C l o ud P ro vi d er).
3. Enter a Name for the provider.
4. From the T ype drop down menu select O penStack.
5. Enter the Ho st Name of the provider.
6. Enter IP Ad d ress of the provider.
93
Red Hat CloudForms 3.0 Management Engine 5.2 Insight G uide
7. Enter the AP I P o rt of your Keystone service.
8. Select the appropriate Zo ne if you have more than one available.
9. If QPID credentials were changed during the OpenStack provider install, use the AMQ P
subtab to provide credentials required for the Advanced Message Queuing Protocol service
on your OpenStack Nova component.
10. Fill out the C red enti al s by typing in a User ID , P asswo rd , and a verification of this
password (Veri fy P asswo rd ). Use the Keystone User ID and Password for your login
credentials.
Important
To enable discovery of OpenStack cloud providers, ensure that the i ptabl es for the
OpenStack host providing Keystone services allows port 5000 access to all hosts on
the same network.
11. Click Val i d ate to validate the credentials.
12. Click Ad d .
4 .1.2. Adding Amaz on EC2 Providers
After initial installation and creation of a CloudForms Management Engine environment, add an
Amazon EC2 cloud provider by following this procedure:
Pro ced u re 4 .2. T o Ad d Amaz o n EC 2 Pro vid er
1. Navigate to C lo u d s → Pro vid ers.
2. Click
(C o nfi g urati o n), then click
(Ad d a New C l o ud P ro vi d er).
3. Enter a Name for the provider.
4. From the T ype drop down menu select Amazo n EC 2.
5. Select an Amazo n R eg i o n.
6. Select the appropriate Zo ne if you have more than one available.
7. Generate an Access Key in the Securi ty C red enti al s of your Amazon AWS account.
The Access Key ID acts as your User ID , and your Secret Access Key acts as your
P asswo rd .
8. Click Val i d ate to validate the credentials.
9. Click Ad d .
4 .1.3. Discovering Amaz on EC2 Cloud Providers
CloudForms Management Engine provides the ability to discover cloud providers associated with a
particular set of Amazon EC2 account details.
Pro ced u re 4 .3. T o D isco ver an Amaz o n EC 2 C lo u d Pro vid er
94
Chapt er 4 . Clouds
1. Navigate to C lo u d s → Pro vid ers.
2. Click
(C o nfi g urati o n), then click
(D i sco ver C l o ud P ro vi d ers).
3. Enter your Amazon EC2 User ID and P asswo rd . Reenter your password in the Veri fy
P asswo rd field.
4. Click Start.
R esu lt :
The Amazon EC2 providers discovery begins. CloudForms Management Engine adds all cloud
providers associated with the chosen account.
4 .1.4 . Refreshing Cloud Providers
Refresh a cloud provider to find other resources related to it. Ensure the chosen cloud providers have
the correct credentials before refreshing.
Pro ced u re 4 .4 . T o R ef resh C lo u d Pro vid ers
1. Navigate to C lo u d s → Pro vid ers.
2. Select the checkboxes for the cloud providers to refresh.
3. Click
(C o nfi g urati o n), and then
States).
(R efresh R el ati o nshi ps and P o wer
4. Click O K to confirm.
4 .1.5. T agging Cloud Providers
Apply tags to all cloud providers to categorize them together at the same time. Before assigning tags,
create them using instructions in the CloudForms Management Engine Settings and Operations Guide.
Pro ced u re 4 .5. T o T ag C lo u d Pro vid ers
1. Navigate to C lo u d s → Pro vid ers.
2. Select the checkboxes for the Cloud Providers to tag.
3. Click
(P o l i cy), and then
(Ed i t T ag s).
4. Select a customer tag to assign from the dropdown menu.
5. Select a value to assign.
6. Click Save.
95
Red Hat CloudForms 3.0 Management Engine 5.2 Insight G uide
4 .1.6. Removing Cloud Providers
A cloud provider might require removal from the VMD B if it is no longer in use.
Pro ced u re 4 .6 . T o R emo ve C lo u d Pro vid ers
1. Navigate to C lo u d s → Pro vid ers.
2. Check the cloud providers to remove.
3. Click
VMD B).
(C o nfi g urati o n), and then
(R emo ve C l o ud P ro vi d ers fro m the
4. Click O K to confirm the removal of the chosen cloud providers.
4 .1.7. Edit ing a Cloud Provider
Edit information about a provider such as the name, IP address, and login credentials.
Note
The T ype value is unchangeable. To use a different cloud provider, create a new one.
Pro ced u re 4 .7. T o Ed it a C lo u d Pro vid er
1. Navigate to C lo u d s → Pro vid ers.
2. Click the cloud provider to edit.
3. Click
(C o nfi g urati o n), and then
(Ed i t Sel ected C l o ud P ro vi d er).
4. Edit the Basi c Info rmati o n. This varies depending on the T ype of provider.
5. Fill out the C red enti al s by typing in a User ID , P asswo rd , and a verification of this
password (Veri fy P asswo rd ).
If selecting an Amazo n EC 2, generate an Access Key in the Securi ty C red enti al s
of your Amazon AWS account. The Access Key ID acts as your User ID , and your
Secret Access Key acts as your P asswo rd .
If selecting O penStack, use the Keystone User ID and Password for your login
credentials.
6. If editing an OpenStack provider, use the AMQ P subtab to provide credentials required for the
Advanced Message Queuing Protocol service on your OpenStack Nova component.
7. Click Val i d ate and wait for notification of successful validation.
8. Click Save.
4 .1.8. Viewing a Cloud Provider's T imeline
View the timeline of events for instances registered to a cloud provider.
Pro ced u re 4 .8. T o View a C lo u d Pro vid er' s T imelin e
96
Chapt er 4 . Clouds
Pro ced u re 4 .8. T o View a C lo u d Pro vid er' s T imelin e
1. Navigate to C lo u d s → Pro vid ers.
2. Click the desired cloud provider for viewing the timeline.
3. Click
(Mo ni to ri ng ), and then
(T i mel i nes).
4. From O pti o ns, customize the period of time to display and the types of events to see.
Use Sho w to select regular Management Events or Policy Events.
Use the T ype dropdown to select hourly or daily data points.
Use D ate to type the date for the timeline to display.
If you select to view a daily timeline, use Sho w to set how many days back to go. The
maximum history is 31 days.
The three Event G ro up dropdowns allow you to select different groups of events to
display. Each has its own color.
From the Level dropdown, select a Summary event, or a D etai l list of events.
R esu lt :
The timeline displays. To see more detail on an item in the timeline, click on it. A balloon appears with
a link to the resource.
4 .2. Availabilit y Zones
An availability zone is a provider-specific method of grouping cloud instances and services.
CloudForms Management Engine uses Amazon EC2 regions and Openstack Nova zones as
availability zones.
4 .2.1. Viewing an Availabilit y Zone
You can click on an Availability Z one to view its details. The screen provides you with an Availability
Z one Accordion and an Availability Z one Summary page.
You can choose between graphical or text view of the datastore summary.
Use the Availability Z one Accordion to view the P ro perti es of the zone and its
R el ati o nshi ps to other cloud resources.
Use the Availability Z one Summary to see details on R el ati o nshi ps (C l o ud P ro vi d er,
Instances) and Smart Manag ement (C o mpany T ag s).
4 .2.2. Viewing Availabilit y Zone Relat ionships
Use the Availability Z one Accordion's R el ati o nshi p section to see items related to an availability
zone.
Pro ced u re 4 .9 . T o View Availab ilit y Z o n e R elat io n sh ip s
1. Navigate to C lo u d s → Availab ilit y Z o n es.
97
Red Hat CloudForms 3.0 Management Engine 5.2 Insight G uide
2. Click the availability zone to view the configuration.
3. From the Availability Z one Accordion, click R el ati o nshi ps.
4. Click the type of resource relationship to view as a list.
4 .3. Flavors
Flavors indicate the resource profiles available for instances. Each Flavor contains a value set for
CPUs, CPU Cores and memory. CloudForms Management Engine provides the ability to view
individual flavor information and instances currently using the flavor.
4 .3.1. Viewing a Flavor
You can click on a specific flavor to view its details. The screen provides you with a Flavor Accordion
and a Flavor Summary.
Use Flavor Summary Views to change how you are looking at the Summary.
Use the Flavor Accordion to view the P ro perti es of the flavor and its R el ati o nshi ps.
Use the Flavor Summary to see details on P ro perti es (C P Us, C P U C o res, Memo ry),
R el ati o nshi ps (C l o ud P ro vi d er, Instances), and Smart Manag ement (C o mpany
T ag s).
4 .3.2. Viewing Flavor Relat ionships
Use the Flavor Accordion's R el ati o nshi p section to see items related to the Flavor.
1. Navigate to C lo u d s → Flavo rs.
2. Click a flavor to view the configuration.
3. From the Flavor Accordion, click R el ati o nshi ps.
4. Click the type of R eso urce to see the flavor's relationships.
4 .4 . Securit y Groups
You can group instances using security groups to restrict port or IP address accessibility. Security
groups are to be created from the cloud provider side and can be assigned to instances using
CloudForms Management Engine instance provisioning.
Cloud providers that currently support this function include: Amazon EC2, OpenStack, and Red Hat
Enterprise Virtualization.
4 .4 .1. Viewing Securit y Groups
This procedure describes how to view security groups.
1. Navigate to C lo u d s → Secu rit y G ro u p s.
2. Click the desired security groups for viewing the details.
In P ro perti es, you can view the basic information of the security group.
98
Chapt er 4 . Clouds
In R el ati o nshi ps, you can view the cloud provider and the instances associated with
the security group.
In Fi rewal l R ul es, you can view a list of ports and IP ranges that are accessible.
Note
This box is not available if you have not set any rules for your security group.
4 .4 .2. T agging Securit y Groups
Apply tags to security groups to categorize them. Before assigning tags, create them using
instructions in the CloudForms Management Engine Settings and Operations Guide.
Pro ced u re 4 .10. T o T ag Secu rit y G ro u p s
1. Navigate to C lo u d s → Secu rit y G ro u p s.
2. Select the security group to tag.
3. Click
(P o l i cy), and then
(Ed i t T ag s).
4. Select a customer tag to assign from the dropdown menu.
5. Select a value to assign.
6. Click Save.
4 .5. Inst ances
The Instance container combined with the ability to analyze information inside each instance
provides in-depth information across the cloud environment. This rich set of information enables
CloudForms Management Engine users to improve problem resolution times and effectively manage
instances in their cloud environment.
The Instances pages display all instances the server discovered from your cloud providers. The
Instances taskbar is a menu driven set of buttons that provide access to functions related to
instances.
99
Red Hat CloudForms 3.0 Management Engine 5.2 Insight G uide
1. History button
2. Refresh screen button
3. Taskbar
4. Name search bar/Advanced Search button
5. View buttons
6. D ownload buttons
7. Navigation bar
8. Sort dropdown
9. Main area in Grid View
10. Cloud/Filter Navigation
Console uses Vi rtual T humbnai l s to describe instances and images. Each thumbnail contains
four quadrants by default. This allows you to glance at an instance for a quick view of its contents.
1. Top left quadrant: Operating system of the Instance
2. Bottom left quadrant: Instance Cloud Provider
3. Top right quadrant: Power state of Instance or Status icon
4. Bottom right quadrant: Number of Snapshots for this Instance
100
Chapt er 4 . Clouds
Ico n
D escrip t io n
Template: Cloud Image
Retired: Instance has been retired
Archived: Instance has no provider or availability zone associated with it.
Orphaned: Instance has no availability zone but does have a provider
associated with it.
D isconnected: Instance is disconnected.
On: Instance is powered on.
Off: Instance is powered off.
Suspended: Instance has been suspended.
The Instances page has four accordions organizing your instances and images in different ways.
All of these accordions share a set of common controls
Use Instances by P ro vi d er and Imag es by P ro vi d er to view your instances and images
organized by Provider. In addition, you can see archived and orphaned items here.
Use the Instances to view, apply filters, and collect information about all of your instances.
Use Imag es to view, apply filters, and collect information about all of your images.
Through the console, you are able to view your instances in multiple ways. For your instances, you
can:
Filter instances
Change views
Sort
Create a report
Search by Tags
Search by collected data
4 .5.1. Filt ering Inst ances and Images
The Instance Fi l ter accordion is provided so that you can easily navigate through groups of
instances. You can use the ones provided or create your own through Ad vanced Fi l teri ng
capabilities.
4 .5 .1 .1 . Using an Inst ance o r Im age Filt e r
Pro ced u re 4 .11. T o U se an In st an ce o r Imag e Filt er
1. Navigate to C lo u d s → In st an ces.
101
Red Hat CloudForms 3.0 Management Engine 5.2 Insight G uide
2. Click on the Instances or Imag es accordion.
3. Click on the desired filter from the left pane.
4 .5 .1 .2 . Cre at ing an Inst ance o r Im age Filt e r
Pro ced u re 4 .12. T o C reat e an In st an ce o r Imag e Filt er
1. Navigate to C lo u d s → In st an ces.
2. Go to the Instances or Imag es accordion.
3. Click Al l Instances or Al l Imag es, then click
expression editor.
(Ad vanced Search) to open the
4. Use the expression editor to choose the appropriate options for your criteria. Based on what
you choose, different options will show.
For all of the types of searches, you have the options of creating an alias and requested
user input. Select Use Al i as to create a user friendly name for the search. If you are
requested user input for the search, this text will show in the dialog box where the input is
requested.
Click Fi el d to create criteria based on field values.
Click C o unt o f to create criteria based on the count of something, such as the number of
snapshots for an instance, or the number of instances on a host.
Click T ag to create criteria based on tags assigned to your virtual infrastructure, such as
for power states or production tagging.
102
Chapt er 4 . Clouds
Click Fi nd to seek a particular value, and then check a property.
5. Click
(C o mmi t Expressi o n El ement C hang es) to add the expression.
6. Click Save.
7. Type in a name for the search expression in Save thi s Instance search as. To set the
filter to show globally, check G l o bal Search.
8. Click Save.
R esu lt :
The filter is saved and shows in the My Fi l ters area of the Fi l ter accordion. If you checked
G l o bal Search, the filter shows there.
4 .5 .1 .3. Lo ading a Re po rt Filt e r o r Se arch Expre ssio n
Pro ced u re 4 .13. T o Lo ad a R ep o rt Filt er o r Search Exp ressio n
1. Navigate to C lo u d s → In st an ces.
2. Click the accordion for the items to search (either Instances or Imag es).
3. Click
(Ad vanced Search) to open the expression editor.
4. Click Lo ad .
5. Select either a saved instance search or an instance report filter. (Note that the set of items to
select will depend on the type of resource you are searching.)
6. Click Lo ad to load the search expression.
7. If you want to edit the expression, click on it and make any edits for the current expression.
Click
(C o mmi t expressi o n el ement chang es) to add the changes.
103
Red Hat CloudForms 3.0 Management Engine 5.2 Insight G uide
Click
(Und o the previ o us chang e) to remove the change you just made.
Click
(R ed o the previ o us chang e) to put the change that you just made back.
Click
(AND wi th a new expressi o n el ement) to create a logical AND with a
new expression element.
Click
(O R wi th a new expressi o n el ement) to create a logical OR with a new
expression element.
Click
(Wrap thi s expressi o n el ement wi th a NO T ) to create a logical NOT
on an expression element or to exclude all the items that match the expression.
Click
element.
(R emo ve thi s expressi o n el ement) to take out the current expression
8. Click Lo ad .
9. Click Appl y.
4 .5.2. Changing Views for Inst ances and Images
While you can set the default view for different pages in C o n f ig u rat io n +My Set t in g s+D ef au lt
Views, the current view can also be controlled from the Instances pages.
Pro ced u re 4 .14 . T o C h an g e t h e View o f t h e In st an ce Pag es
1. Navigate to C lo u d s → In st an ces.
2. Click the accordion for the items to view.
3. Click the appropriate button for the desired view.
Click
for Grid View.
Click
for Tile View.
Click
for List View.
4 .5.3. Sort ing Inst ances and Images
Virtual machines and images can be sorted by Name, Availability Z one, Flavor, Cloud Provider,
Compliant, Last Analysis Time, and Region.
Pro ced u re 4 .15. T o So rt In st an ces o r Imag es
1. Navigate to C lo u d s → In st an ces.
2. Click the accordion for the desired items to sort.
104
Chapt er 4 . Clouds
3. To sort instances or images when in grid or tile view:
a. From the So rt by d ro pd o wn, click the attribute to sort.
4. To sort instances or images when in list view:
a. Select the Li st Vi ew.
b. Click on the C o l umn Name to sort. For example, click on Avai l abi l i ty Zo ne to
sort by the name of the availability zone.
4 .5.4 . Creat ing an Inst ance or Image Report
For a listing of instances and images, you can create a quick report in CSV, TXT, or PD F formats.
Pro ced u re 4 .16 . T o C reat e a R eso u rce R ep o rt
1. Navigate to C lo u d s → In st an ces.
2. Click the accordion for the desired items for report creation.
3. Click
(D o wnl o ad ).
Click
for a TXT file.
Click
for a CSV file.
Click
for a PD F file.
4 .5.5. Searching for Inst ances or Images
To the right of the taskbar on the Instances page, you can enter names or parts of names for
searching. You can search in the following ways.
Type characters that are included in the name. For example, if you type sp1, all Instances whose
names include sp1 appear, such as Wi nd o ws20 0 3sp1 and Sp1cl o ne.
Use * at the end of a term to search for names that begin with specific characters. For example,
type v* to find all instances whose names begin with the letter v.
Use * at the beginning of a term to search for names that end with specific characters. For
example, type *sp2 to find all instances whose names end with sp2.
Erase all characters from the search box to go back to viewing all instances.
Pro ced u re 4 .17. T o Search b y In st an ce o r Imag e N ame
1. Navigate to C lo u d s → In st an ces.
2. Click the accordion for the desired items to search.
3. In the Name Fi l ter bar in the upper right corner of the window, type your criteria.
105
Red Hat CloudForms 3.0 Management Engine 5.2 Insight G uide
4. Click
(Search by Name wi thi n resul ts) or press Enter.
5. Type in other criteria to filter on what is currently displayed.
6. Click
(Search by Name wi thi n resul ts) or press Enter.
4 .5.6. Analyz ing Inst ances and Images
Analyze an instance to collect metadata such as user accounts, applications, software patches, and
other internal information. If CloudForms Management Engine is not set up for automatic analysis,
perform a manual analysis of an instance. To perform a SmartState Analysis, CloudForms
Management Engine requires a running SmartProxy with visibility to the instance's storage location.
Pro ced u re 4 .18. T o An alyz e Mu lt ip le In st an ces o r Imag es
1. Navigate to C lo u d s → In st an ces.
2. Click the accordion for the items to analyze.
3. Check the instances and images to analyze.
4. Click
(C o nfi g urati o n), and then
taskbar.
(P erfo rm SmartState Anal ysi s) on the
5. Click O K to confirm.
4 .5.7. Comparing Inst ances and Images
You can compare multiple instances in CloudForms Management Engine server. This allows you to
see how different instances are from their original image. This helps detect missing patches,
unmanaged user accounts, or unauthorized services.
Use the comparison feature to:
Compare multiple instances from different hosts
Compare multiple instances side-by-side
Quickly see similarities and differences among multiple instances and a base
Narrow the comparison display to categories of properties
Print or export in the comparison results to a PD F or CSV file
Pro ced u re 4 .19 . T o C o mp are In st an ces an d Imag es
1. Navigate to C lo u d s → In st an ces
2. Click the accordion for the items to analyze
3. Click the checkboxes for the items to compare
4. Click
(C o nfi g urati o n), and then
(C o mpare Sel ected i tems). The
comparison displays in a compressed view with a limited set of properties listed.
106
Chapt er 4 . Clouds
5. To delete an item from the comparison, click
(R emo ve thi s VM fro m the
co mpari so n) at the bottom of the items column.
6. To view many items on one screen, go to a compressed view by clicking
Vi ew). To return to an expanded view, click
(C o mpressed
(Expand ed Vi ew).
7. To limit the mode of the view, there are two buttons in the task bar.
a. Click
(D etai l s Mo d e) to see all details for an attribute.
b. Click
(Exi sts Mo d e) to limit the view to if an attribute exists compared to the
base or not. This only applies to attributes that can have a boolean property. For
example, a user account exists or does not exist, or a piece of hardware that does or
does not exist.
8. To change the base instance that all the others are compared to, click its label at the top of its
column.
9. To go to the summary screen for an instance, click its Vi rtual T humbnai l or icon.
4 .5 .7 .1 . Cre at ing an Inst ance Co m pariso n Re po rt
Output a the data from a comparison report in TXT, CSV or PD F formats.
Pro ced u re 4 .20. T o C reat e a C o mp ariso n R ep o rt
1. Create the comparison for the report.
2. Click
(D o wnl o ad ).
Click
for a TXT file.
Click
for a CSV file.
Click
for a PD F file.
4 .5.8. Refreshing Inst ances and Images
Refresh your instances to get the latest data the provider can access. This includes information such
as the power state, container, and hardware devices attached to the instance.
Pro ced u re 4 .21. T o R ef resh Mu lt ip le In st an ces
1. Navigate to C lo u d s → In st an ces.
2. Click the accordion for the desired items to analyze.
3. Click the checkboxes for the items to refresh.
107
Red Hat CloudForms 3.0 Management Engine 5.2 Insight G uide
4. Click
(C o nfi g urati o n), and then
States) on the Instance T askbar.
(R efresh R el ati o nshi ps and P o wer
4 .5.9. Ext ract ing Running Processes from Inst ances and Images
CloudForms Management Engine can collect processes running on Windows instances. To do this,
enter domain credentials for the zone where the instance is located. For more information, refer to the
CloudForms Management Engine Settings and Operations Guide. The instance must be running and must
have an IP address in the VMD B, usually obtained from a SmartState Analysis.
Pro ced u re 4 .22. T o C o llect R u n n in g Pro cesses
1. Navigate to C lo u d s → In st an ces.
2. Click the checkboxes for the instances to collect processes.
3. Click
(C o nfi g urati o n), and then
Taskbar.
(Extract R unni ng P ro cesses) on the
4. Click O K to confirm.
4 .5.10. Set t ing Ownership for Inst ances and Images
You can set the owner of a group of instances and images by either individual user or group. This
allows you an additional way to filter and can be used to enforce quotas.
Pro ced u re 4 .23. T o Set O wn ersh ip
1. Navigate to C lo u d s → In st an ces.
2. Click the accordion for the items to change.
3. Click the checkboxes for the items to set ownership.
4. Click
(C o nfi g urati o n), and then
(Set O wnershi p) on the Instance
T askbar.
5. From the Sel ect an O wner dropdown, select a user.
6. From the Sel ect a G ro up dropdown, select a group
7. Click Save.
4 .5.11. Removing Inst ances and Images from t he VMDB
108
Chapt er 4 . Clouds
If an instance has been decommissioned or you need to perform some troubleshooting, you might
need to remove a specific instance from the VMD B. This does not however remove the instance or
image from its Provider.
Pro ced u re 4 .24 . T o R emo ve In st an ces an d Imag es
1. Navigate to C lo u d s → In st an ces.
2. Click the accordion for the items to remove.
3. Click the checkboxes for the items to remove.
4. Click
(C o nfi g urati o n), and then
(R emo ve fro m the VMD B) button.
5. Click O K to confirm the deletion of chosen instances.
4 .5.12. T agging Inst ances and Images
Pro ced u re 4 .25. T o T ag In st an ces an d Imag es
1. Navigate to C lo u d s → In st an ces.
2. Click the accordion for the items to tag.
3. Click the checkboxes for the items to tag.
4. Click
(P o l i cy), and then
(Ed i t T ag s).
5. Select a customer tag from the first dropdown, and then a value for the tag.
6. Click Save.
4 .5.13. Reviewing an Inst ance or Image
After viewing your list of instances and images, click on a specific item to review a Summary screen of
it. The Summary screen provides you with a Vi rtual T humbnai l and a T askbar.
Use the T askbar to perform actions on the selected item.
Use Summary Vi ews to change the view type of the summary screen.
Use Vi rtual T humbnai l s for a quick glance at the item.
Use the Summary screen to see a quick summary of the attributes of the item.
4 .5.14 . Inst ance and Image T askbars
Use the Instance T askbar to analyze, edit, classify, and change the retirement date, or view
utilization and timelines.
109
Red Hat CloudForms 3.0 Management Engine 5.2 Insight G uide
4 .5.15. Performing Smart St at e Analysis on an Inst ance or Image
Perform a SmartState Analysis of a configuration item to get updated information. To analyze, a
SmartProxy is required to have visibility to the instance's storage location and a provider so that a
snapshot can be created.
Pro ced u re 4 .26 . T o Perf o rm a Smart St at e An alysis o n an In st an ce o r Imag e
1. Navigate to C lo u d s → In st an ces.
2. Click the accordion for the items to analyze.
3. Click the Instance or Imag e to analyze.
4. Click
(C o nfi g urati o n), and then
Taskbar.
(P erfo rm SmartState Anal ysi s) on the
5. Click O K to confirm the analysis.
Important
SmartState Analysis for instances runs as a process independent from providers. For
example, a successful SmartState Analysis of a host does not mean SmartState Analysis for
instances will be successful. Ensure to enter credentials for the provider that contains the
instance for the SmartState Analysis to work.
4 .5.16. Viewing Running Processes aft er Collect ion
Pro ced u re 4 .27. T o View R u n n in g Pro cesses af t er C o llect io n
1. Click an instance with collected processes.
2. From the D i ag no sti cs area, click R unni ng P ro cesses.
R esu lt :
The most recent collection of running processes is displayed. Sort this list by clicking on the column
headers.
4 .5.17. Edit ing Inst ance or Image Propert ies
Edit the properties of an instance or image to set parent and child instances. SmartState Analysis
also can detect this.
Pro ced u re 4 .28. T o Ed it In st an ce o r Imag e Pro p ert ies
1. From C lo u d s → In st an ces.
2. Click the accordion for the items to edit.
3. Click the item to edit properties.
110
Chapt er 4 . Clouds
4. Click
(C o nfi g urati o n), and then
Imag e) on the Taskbar.
(Ed i t thi s Instance o r Ed i t thi s
5. From the P arent Instance dropdown, select the parent instance.
6. From C hi l d Instance selection, select instances that are based on the current instance
from the list of Avai l abl e Instances.
7. Click Save.
4 .5.18. Right Siz ing an Inst ance
CloudForms Management Engine uses collected statistics to recommend the best size for an
instance. CloudForms Management Engine uses the information from the No rmal O perati ng
R ang e to calculate the recommendations.
Pro ced u re 4 .29 . T o R ig h t - siz e an In st an ce
1. Navigate to C lo u d s → In st an ces.
2. Click an instance for right-sizing.
3. Click
(C o nfi g urati o n), and then
(R i g ht-Si ze R eco mmend ati o ns) button.
R esu lt :
A new page appears with three levels of Memory and CPU recommendations, Conservative,
Moderate, and Aggressive, next to the Normal Operating Range statistics.
4 .5.19. Viewing Capacit y and Ut iliz at ion Chart s for an Inst ance
View capacity and utilization data for instances that are part of a cluster.
Note
You must have a server with network visibility to your provider assigned the server role of
C apaci ty & Uti l i zati o n C o l l ecto r to use this feature. For more information, refer to
the CloudForms Management Engine Settings and Operations Guide
Pro ced u re 4 .30. T o View C ap acit y an d U t iliz at io n C h art s f o r an In st an ce
1. Navigate to C lo u d s → In st an ces.
2. Click the accordion to view capacity data.
3. Click the item to view.
4. Click
(Mo ni to ri ng ), and then
(Uti l i zati o n) on the taskbar.
5. Select to view hourly, most recent hour, or daily data points for the dates to view data.
111
Red Hat CloudForms 3.0 Management Engine 5.2 Insight G uide
6. Select a T i me P ro fi l e.
Note
D aily charts only include full days of data. This means CloudForms Management Engine does
not show daily data for a day without a complete 24 data point range for a day.
4 .5.20. Viewing t he Inst ance or Image T imeline
View the timeline of events for an instance or image if registered to a Host.
Pro ced u re 4 .31. T o View t h e T imelin e f o r an In st an ce o r Imag e
1. Navigate to C lo u d s → In st an ces.
2. Click the instance to view the timeline.
3. Click
(Mo ni to ri ng ), and then
(T i mel i nes) on the taskbar.
4. From O pti o ns, customize the period of time to display, and the types of events to view.
Use the Interval dropdown to select hourly or daily data points.
Use D ate to type the date of the timeline to display.
If viewing a daily timeline, use Sho w to set how many days back to go. The maximum
history is 31 days.
The three Event G ro up dropdowns allow selection of different event groups to display.
112
Chapt er 4 . Clouds
Each has its own color.
From the Level dropdown, select either a Summary event or a D etai l list of events. For
example, the detail level of a P o wer O n event might include the power on request, the
starting event, and the actual Power On event. If you select Summary, you only see the
P o wer O n event in the timeline.
5. To see more detail on an item in the timeline, click on it. A balloon appears with a clickable
link to the resource.
4 .5.21. Inst ance or Image Summary
When you click on a specific instance or image, you will see the Vi rtual T humbnai l , and an
operating system-specific screen of the item, called the Summary. Where applicable, click on a
subcategory of the Summary to see more detail on that section.
Note
When you perform a SmartState Analysis on an instance or image, you get more detailed
information in these categories:
P ro perti es include information such as the base operating system, hostname, IP addresses,
instance vendor, cloud resources, and snapshots. This includes the ability to analyze multiple
partitions, multiple disks, Linux logical volumes, extended partitions, and Windows drives. Some
categories can be clicked on for additional detail. For example, click C o ntai ner to view notes
associated with an instance.
Li fecycl e shows the date of discovery and the last analysis. If a retirement date or owner has
been set, these display as well.
R el ati o nshi ps include information on the instance's cloud provider, genealogy such as
parent and child instances, and drift.
VMsafe shows properties of the VMsafe agent if it is enabled.
C o mpl i ance shows the status of system compliance checks and history of past checks.
P o wer Manag ement displays the current power state, last boot time, and last power state
change. State C hang ed O n is the date that the instance last changed its power state. This is a
container view of the power state, therefore a restart of the operating system does not cause the
container power state to change and does not update this value.
Securi ty includes information on users and groups.
C o nfi g urati o n includes information on applications, services, packages, init processes, and
files. This section changes depending on the base operating system.
D i ag no sti cs provides a link to viewing running processes and the information from the latest
collected event logs.
Smart Manag ement shows all tags assigned to this instance.
4 .5.22. Changing t he Summary View of an Inst ance or Image
View the timeline of events for an instance or image if registered to a Host.
113
Red Hat CloudForms 3.0 Management Engine 5.2 Insight G uide
Pro ced u re 4 .32. T o View t h e T imelin e f o r an In st an ce o r Imag e
1. Navigate to C lo u d s → In st an ces.
2. Click the instance to view the timeline.
3. Click
(Mo ni to ri ng ), and then
(T i mel i nes) on the taskbar.
4. From O pti o ns, customize the period of time to display, and the types of events to view.
Use the T ype dropdown to select hourly or daily data points.
Use D ate to type the date of the timeline to display.
If viewing a daily timeline, use Sho w to set how many days back to go. The maximum
history is 31 days.
The three Event G ro up dropdowns allow selection of different event groups to display.
Each has its own color.
From the Level dropdown, select either a Summary event or a D etai l list of events. For
example, the detail level of a P o wer O n event might include the power on request, the
starting event, and the actual Power On event. If you select Summary, you only see the
P o wer O n event in the timeline.
5. To see more detail on an item in the timeline, click on it. A balloon appears with a clickable
link to the resource.
4 .5.23. Viewing t he Operat ing Syst em Propert ies
When you click on a specific instance or image, you will see the Vi rtual T humbnai l , and an
operating system-specific screen of the item, called the Summary. Where applicable, click on a
subcategory of the Summary to see more detail on that section.
Note
When you perform a SmartState Analysis on an instance or image, you get more detailed
information in these categories:
P ro perti es include information such as the base operating system, hostname, IP addresses,
instance vendor, cloud resources, and snapshots. This includes the ability to analyze multiple
partitions, multiple disks, Linux logical volumes, extended partitions, and Windows drives. Some
categories can be clicked on for additional detail. For example, click C o ntai ner to view notes
associated with an instance.
Li fecycl e shows the date of discovery and the last analysis. If a retirement date or owner has
been set, these display as well.
114
Chapt er 4 . Clouds
R el ati o nshi ps include information on the instance's cloud provider, genealogy such as
parent and child instances, and drift.
VMsafe shows properties of the VMsafe agent if it is enabled.
C o mpl i ance shows the status of system compliance checks and history of past checks.
P o wer Manag ement displays the current power state, last boot time, and last power state
change. State C hang ed O n is the date that the instance last changed its power state. This is a
container view of the power state, therefore a restart of the operating system does not cause the
container power state to change and does not update this value.
Securi ty includes information on users and groups.
C o nfi g urati o n includes information on applications, services, packages, init processes, and
files. This section changes depending on the base operating system.
D i ag no sti cs provides a link to viewing running processes and the information from the latest
collected event logs.
Smart Manag ement shows all tags assigned to this instance.
4 .5.24 . Viewing User Informat ion for an Inst ance or Image
CloudForms Management Engine's SmartState Anal ysi s feature returns user information.
Explore the user to get details on the users account, including group memberships.
Pro ced u re 4 .33. T o View U ser G ro u p Memb ersh ip s
1. Navigate to C lo u d s → In st an ces.
2. Click the accordion for the item to view user information.
3. Click on the item to view its Summary.
4. From the Securi ty section of the Instance Summary, click Users.
5. Click the user to view details.
4 .5.25. Viewing Group Informat ion for an Inst ance or Image
CloudForms Management Engine's SmartState Anal ysi s feature returns group information.
Explore the group to get a list of its users.
Pro ced u re 4 .34 . T o View G ro u p Memb ers
1. Navigate to C lo u d s → In st an ces.
2. Click the accordion for the item to view user information.
3. Click on the item to view its Summary.
4. From the Securi ty section of the Instance Summary, click G ro ups.
5. Click the group to view users.
4 .5.26. Viewing Genealogy of an Inst ance or Image
115
Red Hat CloudForms 3.0 Management Engine 5.2 Insight G uide
CloudForms Management Engine detects the lineage of an instance. View an instance's lineage and
compare the instances that are part of its tree. This also allows tagging of instances that share
genealogy.
Pro ced u re 4 .35. T o View G en ealo g y
1. Navigate to C lo u d s → In st an ces.
2. Click the accordion for the item to view genealogy.
3. Click on the item to view its Summary.
4. From the R el ati o nshi ps area in the Summary, click G eneal o g y.
4 .5.27. Det ect ing Drift on Inst ances or Images
The configuration of an instance might change over time. D ri ft is the comparison of an instance to
itself at different points in time. The instance need analysis at least twice to collect this information.
D etecting drift provides you the following benefits:
See the difference between the last known state of a machine and its current state
Review the configuration changes that happen to a particular instance between multiple points in
time.
Review the association changes that happen to a particular instance between multiple points in
time.
Review the classification changes that happen to an instance between 2 time checks.
Capture the configuration drifts for a single instance across a time period.
Pro ced u re 4 .36 . T o View D rif t o n an In st an ce O r Imag e
1. Navigate to C lo u d s → In st an ces.
2. Click the accordion for the item to view drift.
3. Click on the item to view its Summary.
4. From the R el ati o nshi ps area in the Summary, click D ri ft Hi sto ry.
5. Click the checkboxes for the analyses to compare.
6. Click
(Sel ect up to 10 ti mestamps fo r D ri ft Anal ysi s) at the top of the
screen. The results display.
7. Check the D ri ft sections on the left to view in your comparison.
8. Click Appl y.
9. The following descriptions pertain to the Expand ed Vi ew
. Whether you see the value
of a property or an icon representing the property depends on the properties type.
A property displayed in the same color as the base means the compared analysis matches
the base for that property.
116
Chapt er 4 . Clouds
A property displayed in a different color from the base means the compared analysis does
not match the base for that property.
10. If you are in the C o mpressed Vi ew
, the values of the properties are not displayed. All
items are described by the icons shown below.
A
(checkmark) means that the compared analysis matches the base for that
property. If you hover over it, the value of the property will display.
A
(tri ang l e) means the compared analysis does not match the base for that
property. If you hover over it, the value of the property displays. Click the minus sign next
to the sections name to collapse it.
11. To limit the scope of the view, you have three buttons in the R eso urce button area.
Click
(Al l attri butes) to see all attributes of the sections you selected.
Click
(Attri butes wi th d i fferent val ues) to see only the attributes that are
different across the drifts.
Click
(Attri butes wi th the same val ues) to see only the attributes that are the
same across drifts.
12. To limit the mode of the view, there are two buttons in the R eso urce button area.
Click
(D etai l s Mo d e) to see all details for an attribute.
Click
(Exi sts Mo d e) to only see if an attribute exists compared to the base or not.
This only applies to attributes that can have a Boolean property. For example, a user
account exists or does not exist, or a piece of hardware that does or does not exist.
R esu lt :
This creates a drift analysis. D ownload the data or create a report from your drift for analysis using
external tools.
4 .5.28. Creat ing a Drift Report for an Inst ance or Image
Pro ced u re 4 .37. T o C reat e a D rif t R ep o rt
1. Create the comparison to analyze.
2. Click
(D o wnl o ad ).
3. Click the output button for the type of report you want.
Click
(D o wnl o ad d ri ft repo rt i n text fo rmat) for a text file.
Click
(D o wnl o ad d ri ft repo rt i n C SV fo rmat) for a csv file.
117
Red Hat CloudForms 3.0 Management Engine 5.2 Insight G uide
Click
(D o wnl o ad d ri ft repo rt i n P D F fo rmat) for a PD F file.
4 .5.29. Viewing Analysis Hist ory for an Inst ance or Image
Each time a SmartState Analysis is performed on an instance, a record is created of the task. This
information is accessed either from the Instance Acco rd i o n or the Instance Summary. Use this
detail to find when the last analysis was completed and if it completed successfully. If the analysis
resulted in an error, the error is shown here.
Pro ced u re 4 .38. T o View An alysis H ist o ry
1. Navigate to C lo u d s → In st an ces.
2. Click the accordion for the desired item to view analysis history.
3. Click on the item to view its Summary.
4. From the R el ati o nshi ps area in the Summary, click Anal ysi s Hi sto ry. A history of up
to the last 10 analyses is displayed.
5. Click on a specific analysis to see its details.
4 .5.30. Viewing Event Logs for an Inst ance or Image
Using an Anal ysi s P ro fi l e, collect event log information from your instances. See the
CloudForms Management Engine Settings and Operations Guide, C reati ng a D efaul t Anal ysi s
P ro fi l e.
Note
This feature is only available for Windows.
Pro ced u re 4 .39 . T o View Even t Lo g s
1. Navigate to C lo u d s → In st an ces.
2. Click the accordion for the item to view event logs.
3. Click on the item to view its Summary.
4. From D i ag no sti cs click Event Lo g s.
R esu lt :
118
Chapt er 4 . Clouds
The collected event log entries are displayed. Sort this list by clicking on the column headers.
119
Red Hat CloudForms 3.0 Management Engine 5.2 Insight G uide
Chapter 5. Capacity Planning
5.1. Capacit y and Ut iliz at ion Collect ion
CloudForms Management Engine server can collect and analyze capacity and utilization data from
your virtual infrastructure. Use this data to understand the limitations of your current environment
and plan for growth.
For some capacity and utilization data, CloudForms Management Engine calculates and shows
trend lines in the charts. Trend lines are created using linear regression. The calculation uses the
capacity and utilization data collected by CloudForms Management Engine during the interval you
specify for the chart. The more data you have the better the predictive value of the trend line.
There are three server roles associated with the collection and metric creation of capacity and
utilization.
The Capacity & Utilization Coordinator role checks to see if it is time to collect data, somewhat like a
scheduler. If it is time, a job is queued for the capacity and utilization data collector. The
coordinator role is required to complete capacity and utilization data collection. If more than one
Server in a specific zone has this role, only one will be active at a time.
The Capacity & Utilization Data Collector performs the actual collection of capacity and utilization
data. This role has a dedicated worker, and there can be more than one server with this role in a
zone.
The Capacity & Utilization Data Processor processes all of the data collected, allowing CloudForms
Management Engine to create charts. This role has a dedicated worker, and there can be more
than one server with this role in a zone.
5.1.1. Assigning t he Capacit y and Ut iliz at ion Server Roles
Pro ced u re 5.1. T o Assig n t h e C ap acit y an d U t iliz at io n Server R o les
1. Navigate to C o n f ig u re → C o n f ig u rat io n .
2. Navigate to Server → Server C o n t ro l area, click the checkboxes for the appropriate
capacity & utilization roles based on your enterprise's configuration.
3. Click Save.
D ata collection begins immediately. However, the first collection begins 5 minutes after the server is
started, and every 10 minutes after that. Therefore, the longest the collection takes after enabling the
capacity & utilization collector server role is 10 minutes. The first collection from a particular provider
may take a few minutes since CloudForms Management Engine is gathering data points going one
month back in time.
Note
In addition to setting the server role, you must also select which clusters and datastores to
collect data for. See Settings and Operations Guide, Capacity & Utilization Collection Settings. You
must have super administrator rights to edit these settings
5.1.2. Dat a Collect ion for RHEVM 3.1
120
Chapt er 5. Capacit y Planning
To collect capacity and utilization D ata for R H EV- M 3.1, CloudForms Management Engine needs its
own user with access to the Red Hat C & U D atabase. You can create this user either by command
line or using Po st g reSQ L Ad min . The instructions below show how to do this from a command
line.
Perform the following steps on the Po st g reSQ L server where the history database is located.
Usually, this is the R H EV- M server.
Pro ced u re 5.2. T o C o llect D at a f o r R ed H at En t erp rise Virt u aliz at io n Man ag er 3.1
1. SSH into the history database server. Use the following commands substituting a user name
of your choice for newuser and the user's password for newuserpassword. Press enter after
each line.
psql -U postgres
CREATE ROLE newuser LOGIN UNENCRYPTED PASSWORD 'newuserpassword'
SUPERUSER VALID UNTIL 'infinity';
\q
2. Execute the following command on the Red Hat Enterprise Virtualization Manager History
D atabase server and save the changes:
# iptables -I INPUT -p tcp -m tcp --dport 5432 -j ACCEPT
# service iptables save
3. Enable for external md5 Authentication by editing /var/l i b/pg sq l /d ata/pg _hba. co nf
and changing the following line to look like:
host
all
all
0.0.0.0/0
md5
4. Enable Po st g reSQ L to listen for remote connections by editing
/var/l i b/pg sq l /d ata/po stg resq l . co nf and modifying the following line to look like:
listen_addresses
=
'*'
5. Reload Po st g reSQ L configuration by typing:
service
postgresql
reload
5.1.3. Adding Dat abase Credent ials for Dat a Collect ion
After creating the new user, add its credentials to the settings for the provider.
Pro ced u re 5.3. T o Ad d D at ab ase C red en t ials f o r D at a C o llect io n
1. From In f rast ru ct u re → Pro vid ers, click a provider to update its settings.
2. Click
(C o nfi g urati o n), and then
(Ed i t thi s P ro vi d er).
3. In the C red enti al s area, click C & U D at ab ase.
4. Type in the credentials for the new database user you created.
5. Click Save.
121
Red Hat CloudForms 3.0 Management Engine 5.2 Insight G uide
6. Finally, restart the capacity and utilization data collector. See the Settings and Operations
Guide for more information.
5.1.4 . Dat a Collect ion for Red Hat Ent erprise Linux OpenSt ack Plat form
Error
Topic 25811 failed Injection processing and is not included in this build.
Please review the compiler error for Topic ID 25811 for more detailed information.
5.2. Dat a Collect ed
CloudForms Management Engine generates charts from the collected data which can be used to plan
your hardware and virtual machine needs. D epending on the type of data, these charts may include
lines for averages, maximums, minimums, and trends.
Note
For reporting of daily capacity and utilization data, incomplete days (days with less than 24
hourly data points from midnight to midnight) that are at the beginning or end of the requested
interval are excluded. D ays with less than 24 hourly data points would be inaccurate and
including them would skew trend lines. Therefore, at least one full day of hourly data from
midnight to midnight is necessary for displaying the capacity and utilization charts under the
infrastructure tab
5.2.1. Capacit y and Ut iliz at ion Chart s for Host , Clust ers, and Virt ual Machines
R eso u rc
e T yp e
C PU
U sag e
C PU
St at es
D isk I/O
Memo ry
U sag e
N et wo rk
I/O
R u n n in g
VMS
R u n n in g
H o st s
Host
Cluster
Virtual
Machine
Y
Y
Y
Y
Y
Y
Y
Y
Y
Y
Y
Y
Y
Y
Y
Y
Y
NA
NA
Y
NA
For the procedure to view Capacity and Utilization Charts for a Host, see Section 3.3.12, “ Viewing
Capacity and Utilization Charts for a Host” .
For the procedure to view Capacity and Utilization Charts for a Cluster, see Section 3.2.5, “ Viewing
Capacity and Utilization Charts for a Cluster” .
For the procedure to view Capacity and Utilization Charts for a Virtual Machine, see Section 3.4.17,
“ Viewing Capacity and Utilization Charts for a Virtual Machine” .
5.2.2. Capacit y and Ut iliz at ion Chart s for Dat ast ores
Charts created include:
122
Chapt er 5. Capacit y Planning
Sp ace b y VM T yp e
Virt u al Mach in es an d H o st s
Used Space
D isk files Space
Snapshot Files Space
Memory Files Space
Non-VM Files
Used D isk Space
Number of VMs by Type
Hosts
Virtual Machines
For the procedure to view Capacity and Utilization Charts for a D atastore see Section 3.6.4, “ Viewing
Capacity and Utilization Charts for a D atastore”
5.3. Chart Feat ures
Each chart provides its own set of special features including zooming in on a chart and shortcut
menus.
5.3.1. Zooming int o a Chart
Pro ced u re 5.4 . T o Z o o m In t o a C h art
1. Navigate to the chart you want to zoom. If you hover anywhere on the chart, two dashed lines
will appear to target a coordinate of the chart.
2. Click
(C l i ck to zo o m i n) in the lower left corner of the chart to zoom into it.
3. To go back to the regular view click
(C l i ck to zo o m o ut) on the enlarged chart.
5.3.2. Drilling int o Chart Dat a
Pro ced u re 5.5. T o D rill in t o C h art D at a
1. Navigate to the chart you want to get more detail from.
2. Hover over a data point to see the coordinates.
3. Click on a data point to open a shortcut menu for the chart. In this example, we can use the
shortcut menu to go to the hourly chart or display the virtual machines that were running at
the time the data was captured.
If you are viewing the CPU, D isk, Memory, or Network charts, selecting from the C h art
option will change all of the charts on the page to the new interval selected.
If you are viewing the CPU, D isk, Memory, or Network charts, selecting from the D isp lay
option will allow you to drill into the virtual machines or Hosts that were running at the
time.
If you are viewing the VM or Hosts chart, the D isp lay menu will allow you to view running
or stopped virtual machines. The time of the data point will be displayed in addition to the
virtual machines that apply. From here, click on a virtual machine to go its details.
R esu lt :
5.4 . Opt imiz at ion
123
Red Hat CloudForms 3.0 Management Engine 5.2 Insight G uide
5.4 . Opt imiz at ion
CloudForms Management Engines optimization functions allow you to view utilization trends, and
identify and project bottlenecks in your environment. In addition, you can predict where you have
capacity for additional virtual machines.
Note
For reporting of daily optimization data, incomplete days (days with less than 24 hourly data
points from midnight to midnight) that are at the beginning or end of the requested interval are
excluded. D ays with less than 24 hourly data points would be inaccurate and including them
would skew trend lines. Therefore, the optimize page requires at least two full days of daily
data because all the charted values are derived from trend calculations and that requires at
least two data points
5.5. Ut iliz at ion T rends
CloudForms Management Engine allows you to view the resource utilization of your clusters,
providers, and datastores. You can choose from summary, details, or report view.
5.5.1. Viewing Ut iliz at ion T rend Summary
This procedure shows you how to view utilization trend summary.
Pro ced u re 5.6 . T o View U t iliz at io n T ren d Su mmary
1. Navigate to O p t imiz e → U t iliz at io n page.
2. Click Summary if it is not already selected.
3. Expand the tree on the left side, until you can see the desired providers, clusters, or
datastores.
4. Click on the item.
5. Use the Options section in the Summary tab to change the characteristics of the data.
Use T rend s fo r past to select how far back you want to calculate the trend.
Use Sel ected D ay for the date you want to see percent utilization for in the chart on the
Summary tab.
Use C l assi fi cati o n to only see trends for a specific applied tag.
Use T i me P ro fi l e to select an existing time profile. If the logged on user does not have
any time profiles available, this option will not show.
Select a T i me Zo ne.
5.5.2. Viewing Det ail Lines of a Ut iliz at ion T rend
This procedure shows you how to view detail lines of a utilization trend.
Pro ced u re 5.7. T o View D et ail Lin es o f a U t iliz at io n T ren d
124
Chapt er 5. Capacit y Planning
1. Navigate to O p t imiz e → U t iliz at io n .
2. Expand the tree on the left side, until you can see the desired providers, clusters, or
datastores.
3. Click on the item.
4. Click D etai l s if it is not already selected.
5. From the O pti o ns area, select how far back you want to view the trends for and any
classifications you want to use.
5.5.3. Viewing a Report of a Ut iliz at ion T rend
To find out more about resource utilization, view utilization trend reports.
Pro ced u re 5.8. T o View a R ep o rt o f a U t iliz at io n T ren d
1. Navigate to O p t imiz e → U t iliz at io n .
2. Expand the tree on the left side, until you can see the desired providers, clusters, or
datastores.
3. Click on the item.
4. Click R epo rt if it is not already selected.
5. From the O pti o ns area, select how far back you want to view the trends for and any
classifications you want to use.
5.6. Planning
You can use the data collected in the VMD B to plan where you can put additional virtual machines.
CloudForms Management Engine allows you to use a reference virtual machine as an example to
plan on which hosts and clusters you can place a new virtual machine.
5.6.1. Planning Where t o Put a New Virt ual Machine
Use the CloudForms Management Engine planning feature to help you plan for a virtual machine
placement.
Pro ced u re 5.9 . T o Plan Wh ere T o Pu t a N ew Virt u al Mach in e
1. Navigate to O p t imiz e → Plan n in g .
2. From R eference VM Sel ecti o n, use the dropdowns to select the virtual machine that is
most like the one that you want to add.
125
Red Hat CloudForms 3.0 Management Engine 5.2 Insight G uide
3. Select the required VM O pti o ns, for what you want to base the calculations on.
From the So urce dropdown, select the type of data to use as the source for your projections.
For example, select Allo cat io n to calculate based on the current allocation values of each
resource (CPU, memory, or disk space) for the reference virtual machine. Use R eservat io n if
you want to project based on the current guaranteed value of the specific resource (CPU
Speed, CPU count, memory, or disk space) although that amount may not be allocated to the
virtual machine at a specific moment in time. Select U sag e if you want to calculate based on
usage history of the reference virtual machine. Use Manual Input, to enter your own set of
parameters for each resource.
4. From T arg et O pti o ns, select if you want to use clusters or hosts as your targets.
Also, select the limit of how high the projection can go for CPU, memory, and datastore space.
If you are targeting hosts, you will be able to select a filter for which hosts can be targets.
126
Chapt er 5. Capacit y Planning
5. From T rend O pti o ns, select how far back you want to use the trend data for, a T i me
P ro fi l e and T i me Zo ne if applicable. Note that T i me P ro fi l e will only show if the
logged on user has a Time Profile available.
6. Click Submi t.
R esu lt :
The Summary tab shows the best clusters or hosts on which to place the virtual machines. The
R epo rt tab shows the best fit and statistics on the reference virtual machine in a tabular format.
From the R epo rt tab, you can also create a PD F of the report or download the data in txt or csv
format.
5.7. Bot t lenecks
CloudForms Management Engine can show where bottlenecks occur in your virtual infrastructure.
You can view them either on a timeline or as a report which can be downloaded for further analysis.
5.7.1. Viewing t he Bot t leneck Summary
To find out more about bottleneck capacity or utilization, view a bottleneck summary.
Pro ced u re 5.10. T o View t h e B o t t len eck Su mmary
1. Navigate to O p t imiz e → B o t t len ecks.
2. Click Summary if it is not already selected.
3. Expand the tree on the left side, until you can see the desired providers, clusters, or
datastores.
4. Click on the item.
5. Use the O pti o ns section to change the characteristics of the data.
Use Event G ro ups to select if you want to see bottlenecks based on capacity, utilization
or both.
Select a T i me Zo ne.
R esu lt :
D ata is processed, and a timeline appears. Click on an icon in the timeline to see specific information
on the bottleneck.
127
Red Hat CloudForms 3.0 Management Engine 5.2 Insight G uide
5.7.2. Viewing a Report of t he Bot t lenecks T rend
Pro ced u re 5.11. T o View a R ep o rt o f t h e B o t t len ecks T ren d
1. Navigate to O p t imiz e → B o t t len ecks.
2. Click R epo rt.
3. Expand the tree on the left side, until you can see the desired providers, clusters, or
datastores.
4. Click on the item.
5. Use the O pti o ns section to change the characteristics of the data.
Use Event G ro ups to select if you want to see bottlenecks based on capacity, utilization
or both.
Select a T i me Zo ne.
6. Expand the tree on the left side, until you can see the enterprise, provider, or datastore that
you want to see the trend for.
128
Chapt er 6 . Cloud Int elligence
Chapter 6. Cloud Intelligence
Cloud Intelligence shows your virtual environments events, reports, and configurable alerts. This
information supports better information technology decision making and predictions for future virtual
machine management.
6.1. Dashboard
When you log in to the console, it brings you directly to the C l o ud Intel l i g ence D ashbo ard
page by default. The console uses widgets to organize this page, providing you with a default set of
commonly used widgets. The configuration items on these widgets are clickable allowing you to drill
down directly to a referenced item.
Customize this page to include the charts, reports, and RSS feeds you specifically want to see as
soon as you log in to the console. You can add, remove, move, minimize, zoom into, and maximize
widgets. Only users with the proper access can create widgets.
6.1.1. Adding a Widget
You can add widgets to the dashboard to accommodate what information you want to see upon
login.
Pro ced u re 6 .1. T o Ad d a Wid g et
1. Navigate to C lo u d In t ellig en ce → D ash b o ard .
2. Click
(Ad d a Wi d g et).
3. Select the widget you want to add from the list. Note that only widgets that are not currently
showing on the dashboard will appear in this list.
6.1.2. Reset t ing t o t he Default Set of Widget s
You can reset to default set of widgets according to your need.
Pro ced u re 6 .2. T o R eset t o t h e D ef au lt Set o f Wid g et s
1. Navigate to C lo u d In t ellig en ce → D ash b o ard .
2. Click
(R eset D ashbo ard Wi d g ets to the d efaul ts).
6.1.3. Removing a Widget
You can remove a widget when you no longer need the widget to be displayed in the dashboard.
Pro ced u re 6 .3. T o R emo ve a Wid g et
1. Navigate to C lo u d In t ellig en ce → D ash b o ard .
2. From the widget that you want to remove, click
upper right corner of the widget.
(R emo ve fro m D ashbo ard ) in the
129
Red Hat CloudForms 3.0 Management Engine 5.2 Insight G uide
3. Click O K to confirm that you want to remove this widget.
R esu lt :
The widget is removed from the dashboard, but it is not deleted. It can be added again if needed.
6.1.4 . Zooming in t o a Chart Widget
Pro ced u re 6 .4 . T o Z o o m in t o a C h art Wid g et
1. Navigate to C lo u d In t ellig en ce → D ash b o ard .
2. From the chart widget that you want to enlarge, click
upper right corner of the widget.
(Zo o m i n o n thi s chart) in the
R esu lt :
The enlarged chart is opened in its own pop-up window. To close this window, click
the upper right corner.
(C l o se) in
6.1.5. Opening a Chart or Report Widget in It s Own Window
Pro ced u re 6 .5. T o O p en a C h art o r R ep o rt Wid g et in It s O wn Win d o w
1. Navigate to C lo u d In t ellig en ce → D ash b o ard .
2. From the chart or report widget that you want to enlarge, click
(O pen the chart and
ful l repo rt i n new wi nd o w) in the upper right corner of the widget.
3. Click O K to confirm that you want to open this in a new window and show all the rows of data.
6.1.6. Minimiz ing or Maximiz ing a Widget
Pro ced u re 6 .6 . T o Min imiz e o r Maximiz e a Wid g et
1. Navigate to C lo u d In t ellig en ce → D ash b o ard .
2. From the chart or report widget that you want to maximize, click
(Maxi mi ze) in the upper right corner of the widget.
(Mi ni mi ze) or
6.1.7. Downloading a Report Widget as a File
Pro ced u re 6 .7. T o D o wn lo ad a R ep o rt Wid g et as a File
1. Navigate to C lo u d In t ellig en ce → D ash b o ard .
2. From the chart or report widget that you want to download as a PD F, click
(D o wnl o ad
the ful l repo rt (al l ro ws) as a P D F fi l e) in the upper right corner of the
widget.
3. Click O K to confirm that you want to complete the download.
6.2. Creat ing Dashboard Widget s
130
Chapt er 6 . Cloud Int elligence
6.2.1. Creat ing a Report Widget
Pro ced u re 6 .8. T o C reat e a R ep o rt Wid g et
1. Navigate to C lo u d In t ellig en ce → R ep o rt s.
2. Click on the D ash b o ard Wid g et s accordion, then choose the R ep o rt s folder.
3. Click
(C o nfi g urati o n), then click
(Ad d a new Wi d g et).
4. Click C o n f ig u rat io n → Ad d a n ew Wid g et .
5. In the Basi c Info rmati o n area, type in a T i tl e and D escri pti o n. By default the
widget will be active as soon as you create it. To make it inactive, uncheck the Acti ve box.
6. From the R epo rt O pti o ns area, select the filters until you are at the report you want for this
widget. Select up to four columns from that report. Finally, for R o w C o unt, select the number
of rows that you want displayed.
7. In the T i mer area, click the R un drop down to specify how often you want the widget data to
get updated. The options displayed will depend on which R un option you choose. Select
H o u rly, D aily, Weekly, or Mo n t h ly.
131
Red Hat CloudForms 3.0 Management Engine 5.2 Insight G uide
8. Select a T i me Zo ne. Note that if you change the time zone, you will need to reset the starting
date and time. Type or select a date to begin the schedule in Starti ng D ate. Select a
Starti ng T i me based on a 24 hour clock in the selected time zone.
9. In the Vi si bi l i ty area, select <T o All U sers>, so that all users can use this widget no
matter what user role they are assigned. Select <B y R o le> to assign this widget to specific
user roles. Select <B y G ro u p > to assign this widget to specific groups.
10. Click Ad d .
6.2.2. Creat ing a Chart Widget
Pro ced u re 6 .9 . T o C reat e a C h art Wid g et
1. Navigate to C lo u d In t ellig en ce → R ep o rt s.
2. Click the D ash b o ard Wid g et s accordion and click the C h art s folder.
3. Click
(C o nfi g urati o n), then click
(Ad d a new Wi d g et).
4. In the Basi c Info rmati o n area, type in a T i tl e and D escri pti o n. By default the
widget will be active as soon as you create it. To make it inactive, uncheck the Acti ve box.
5. From the C hart R epo rt area, select a chart to display in the widget.
6. In the T i mer area, click the R un drop down to specify how often you want the widget data to
get updated. The options displayed will depend on which R un option you choose. Select
H o u rly, D aily, Weekly, or Mo n t h ly.
132
Chapt er 6 . Cloud Int elligence
7. Select a T i me Zo ne. Note that if you change the time zone, you will need to reset the starting
date and time. Type or select a date to begin the schedule in Starti ng D ate. Select a
Starti ng T i me (UT C ) based on a 24 hour clock in the selected time zone.
8. In the Vi si bi l i ty area, select <T o All U sers>, so that all users can use this widget no
matter what user role they are assigned. Select <B y R o le> to assign this widget to specific
user roles. Select <B y G ro u p > to assign this widget to specific groups.
9. Click Ad d .
6.2.3. Creat ing an RSS Feed Widget
Pro ced u re 6 .10. T o C reat e an R SS Feed Wid g et
1. Navigate to C lo u d In t ellig en ce → R ep o rt s.
2. Click the D ash b o ard Wid g et s accordion, and click the R SS Feed s folder.
3. Click
(C o nfi g urati o n), then click
(Ad d a new Wi d g et).
4. In the Basi c Info rmati o n area, type in a T i tl e and D escri pti o n. By default the
widget will be active as soon as you create it. To make it inactive, uncheck the Acti ve box.
5. In the R SS Feed O pti o ns area, you have the following choices.
From T ype, select In t ern al to use feed from CloudForms Management Engine. Then
select the RSS feed, from the Internal R SS Feed dropdown.
From T ype, select Ext ern al to use a feed outside of CloudForms Management Engine.
Then, either select the RSS feed or type your own.
From R o w C o unt, select the number of rows you want returned from the RSS feed.
6. Select the Filters until you are at the report you want for this widget. Select up to three
columns from that report. Finally, for Row Count, select the number of rows that you want
displayed.
7. In the T i mer area, click the R un drop down to specify how often you want the widget data to
get updated. The options displayed will depend on which R un option you choose. Select
H o u rly, D aily, Weekly, or Mo n t h ly.
133
Red Hat CloudForms 3.0 Management Engine 5.2 Insight G uide
8. Select a T i me Zo ne. Note that if you change the T i me Zo ne, you will need to reset the
starting date and time.
9. Type or select a date to begin the schedule in Starti ng D ate.
10. Select a Starti ng T i me (UT C ) based on a 24 hour clock in the selected T i me Zo ne.
11. In the Vi si bi l i ty area, select <T o All U sers>, so that all users can use this widget no
matter what user role they are assigned. Select <B y R o le> to assign this widget to specific
user roles. Select <B y G ro u p > to assign this widget to specific groups.
12. Click Ad d .
6.2.4 . Creat ing a Menu Widget
Pro ced u re 6 .11. T o C reat e a Men u Wid g et
1. Navigate to C lo u d In t ellig en ce → R ep o rt s.
2. Click the D ash b o ard Wid g et accordion and click the Men u s folder.
3. Click
(C o nfi g urati o n), then click
(Ad d a new Wi d g et).
4. In the Basi c Info rmati o n area, type in a T i tl e and D escri pti o n. By default the
widget will be active as soon as you create it. To make it inactive, uncheck the Acti ve box.
5. In the Menu Sho rtcuts area, use the Ad d a Sh o rt cu t dropdown to select all the places in
the console that you want to add to this widget.
6. In the Vi si bi l i ty area, select <T o All U sers>, so that all users can use this widget no
matter what user role they are assigned. Select <B y R o le> to assign this widget to specific
user roles. Select <B y G ro u p > to assign this widget to specific groups.
134
Chapt er 6 . Cloud Int elligence
7. Click Ad d .
6.2.5. Edit ing a Widget
Pro ced u re 6 .12. T o Ed it a Wid g et
1. Navigate to C lo u d In t ellig en ce → R ep o rt s.
2. Click the D ash b o ard Wid g et s accordion and select the widget you want to edit.
3. Click
(C o nfi g urati o n), and then
(Ed i t thi s Wi d g et).
4. Make the required changes.
5. Click Save.
6.2.6. Copying a Widget
Pro ced u re 6 .13. T o C o p y a Wid g et
1. Navigate to C lo u d In t ellig en ce → R ep o rt s.
2. Click the D ash b o ard Wid g et accordion, and select the widget you want to copy.
3. Click
(C o nfi g urati o n), and then
(C o py thi s Wi d g et).
4. Type a unique name for the widget and edit its properties.
5. Click Save.
6.2.7. Delet ing a Widget
Note
D efault widgets cannot be deleted, but they can be copied.
Pro ced u re 6 .14 . T o D elet e a Wid g et
1. Navigate to C lo u d In t ellig en ce → R ep o rt s.
2. Click the D ash b o ard Wid g et accordion and select the widget you want to delete.
3. Click
(C o nfi g urati o n), and then
D atabase).
(D el ete thi s Wi d g et fro m the
4. Click O K to confirm.
6.2.8. Generat ing Widget Cont ent Immediat ely
Pro ced u re 6 .15. T o G en erat e Wid g et C o n t en t Immed iat ely
1. Navigate to C lo u d In t ellig en ce → R ep o rt s.
135
Red Hat CloudForms 3.0 Management Engine 5.2 Insight G uide
2. Click the D ash b o ard Wid g et s accordion and select the widget you want to generate.
3. Click
(C o nfi g urati o n), and then
(G enerate Wi d g et C o ntent no w).
4. Click O K to confirm.
R esu lt :
The content is generated immediately instead of waiting for the next scheduled update. Generation of
widget content is shown under the T asks page of
(Setti ng s & O perati o ns).
6.3. Report s
Click the R ep o rt s accordion under C lo u d In t ellig en ce → R ep o rt s to see a list of reports
available. These reports have been constructed to help you view the most commonly requested and
significant data. From here, you can also create reports if you have appropriate access. CloudForms
Management Engine provides a large group of default reports organized into categories. Each
category has its own set of subfolders.
Use C o nfi g urati o n Manag ement to see hardware, application, network, service, user
account, operating system, and snapshot information for all of your items.
Use Mi g rati o n R ead i ness to see information specifically related to items required to migrate a
virtual machine.
Use O perati o ns to look at free space on registered and unregistered virtual machines, to see
power states for virtual machines, and see which offline virtual machines have snapshots or have
never been analyzed. You are also provided with reports specifically related to the operation of
CloudForms Management Engine, such as user ids and snapshots taken by CloudForms
Management Engine.
Use VM Sprawl to check on usage information and disk waste.
Use R el ati o nshi ps to see virtual machine, folder, and cluster relationships.
Use Events to view operations and configuration management events.
Use P erfo rmance by Asset T ype to see a report on the performance of your virtual
infrastructure. You must be capturing capacity and utilization data to get this information.
Use R unni ng P ro cesses to view the information on processes running on a virtual machine.
You must have domain credentials entered for the zone to collect the info for these reports, and
the virtual machine must have been analyzed at least once.
T rend i ng shows projections of datastore capacity and host CPU and memory use.
P ro vi si o ni ng shows provisioning activity based on the approver, datastore, requester, and
virtual machine.
For a complete list of Reportable Fields in CloudForms Management Engine see Appendix A,
Reportable Fields in CloudForms Management Engine
6.3.1. Running Report s
There are two different ways to generate a report: either scheduling the report, or manually by clicking
the report generation button on the R ep o rt s page. CloudForms Management Engine uses
136
Chapt er 6 . Cloud Int elligence
interactive report generation so that reports are placed on a queue. A visual indicator of the reports
status is shown. All reports are automatically saved so that they can be downloaded and analyzed
later.
6 .3.1 .1 . Ge ne rat ing a Single Re po rt
Pro ced u re 6 .16 . T o G en erat e a Sin g le R ep o rt
1. Navigate to C lo u d In t ellig en ce → R ep o rt s
2. Click the R ep o rt s accordion and select the report you want to view.
3. Click
(Q ueue),
4. The report generation is placed on the queue and its status shows in the reports page.
5. Click
(R el o ad current d i spl ay) to update the status.
6. When a report has finished generating, click on its row to view it.
6 .3.1 .2 . Sche duling a Re po rt
Pro ced u re 6 .17. T o Sch ed u le a R ep o rt
You may want to create reports on a scheduled basis so that you can look at historical data. In
addition, scheduled reports can be e-mailed directly to users.
1. There are two ways to schedule a report. You can either navigate to the report from the
R ep o rt s accordion and click
Sch ed u les accordion and click
(C o nfi g urati o n),
(C o nfi g urati o n),
(Ad d a repo rt), or click the
(Ad d a New Sched ul e).
In the Basi c Info rmati o n area, type in a Name and D escri pti o n for the schedule.
By default. Acti ve is checked to enable the scan.
Check E-Mai l after R unni ng to send an e-mail after the report has been generated.
The e-mail will be sent to the users e-mail address as show in the Acco unts area in
C o n f ig u rat io n . The e-mail will include a link to the report. See the Settings and Operations
Guide to learn how to verify the address, and to validate outgoing e-mail settings.
137
Red Hat CloudForms 3.0 Management Engine 5.2 Insight G uide
2. The R epo rt Sel ecti o n area is pre-populated if you added the schedule directly from the
report. If you are adding from the schedule according, use the Fi l ter dropdowns to select
the report that you want to schedule.
3. In the T i mer area, click the R un drop down to specify how often you want the analysis to run.
Your options after that will depend on which run option you choose.
4.
Click O n ce to have the analysis run just one time.
Click D aily to run the analysis on a daily basis. You will be prompted to select how many
days you want between each analysis.
Click H o u rly to run the analysis hourly. You will be prompted to select how many hours
you want between each analysis.
Type or select a date to begin the schedule in Starti ng D ate.
Select a Starti ng T i me based on a 24 hour clock in the CloudForms Management
Engine Appliances Time Z one.
5.
To send an e-mail that includes an attachment with the report contents, check Sen d an Email. Parameters required for sending an e-mail are displayed.
In Fro m (l eave bl ank fo r d efaul t), type in the sending e-mail.
138
Chapt er 6 . Cloud Int elligence
Use Ad d a User, to select a specific user. The user must have a valid e-mail address
entered under accounts.
Use Ad d (enter manual l y) to type in the address not registered to a User. Then, click
(Ad d ).
6. If you are sending an e-mail after the report runs, then you can select further options under Email Options.
Check Send i f R epo rt i s Empty if you want an e-mail even if no records exist in the
report.
Next to Attachments, check if you would like the report attached as a T ext , C SV, or PD F
file.
7. Click Ad d when you are finished.
Note
You may need to disable, change the report filter, or change the frequency of a schedule. To
do this, you will need to edit the schedule.
6 .3.1 .3. Mo difying a Re po rt Sche dule
Pro ced u re 6 .18. T o Mo d if y a R ep o rt Sch ed u le
1. Navigate to C lo u d In t ellig en ce → R ep o rt s
2. Click the Sch ed u les accordion and select the schedule you want to edit.
3. Click
(C o nfi g urati o n), then click
(Ed i t thi s Sched ul e).
4. Make the required changes.
5. Click Save.
6 .3.1 .4 . Running a Sche dule d Re po rt Im m e diat e ly
Pro ced u re 6 .19 . T o R u n a Sch ed u led R ep o rt Immed iat ely
1. Navigate to C lo u d In t ellig en ce → R ep o rt s.
2. Click the Sch ed u les accordion and select the schedule you want to run.
139
Red Hat CloudForms 3.0 Management Engine 5.2 Insight G uide
3. Click
(C o nfi g urati o n), then click
(Q ueue).
6.3.2. Viewing Report s
Once you have created a schedule for a report, you can view it at any time after the first scheduled
time has occurred.
Pro ced u re 6 .20. T o View a R ep o rt
1. Navigate to C lo u d In t ellig en ce → R ep o rt s.
2. Click the Saved R ep o rt s accordion or the R ep o rt s accordion.
3. Click on the instance of the report you want to view.
6 .3.2 .1 . Changing Re po rt Vie ws
Some reports can be viewed as charts as well as lists. Note that this will depend on the type of data
and on how the report has been created. Where applicable, you will see these additional buttons.
Pro ced u re 6 .21. T o C h an g e t h e View o f a R ep o rt
1. Navigate to C lo u d In t ellig en ce → R ep o rt s.
2. Click the report to view. Click one of the following buttons for the view you want.
Click
for Graph View.
Click
for Hybrid View.
Click
for Tabular View.
6 .3.2 .2 . Re po rt Do wnlo ad But t o ns
When you click on one of the supplied reports, you are presented with a group of buttons to
download the report in one of three formats or to view the report in a full screen.
Note
Edit and delete buttons are only visible to administrators and super administrators. Edit and
delete functions are only available to customer-created reports. The CloudForms Management
Engine pre-configured reports cannot be edited or deleted, but they can be copied.
6 .3.2 .3. Do wnlo ading a Re po rt
D ownload reports to analyze the data using other tools or to print the report.
Pro ced u re 6 .22. T o D o wn lo ad R ep o rt s
1. Navigate to C lo u d In t ellig en ce → R ep o rt s.
14 0
Chapt er 6 . Cloud Int elligence
2. Click the report you want to view.
3. Click on the row for the instance of the report you want to download. If the report needs to be
generated, see Running Reports.
4. Click on the report download buttons for the type of export you want.
Click
(D o wnl o ad thi s repo rt i n text fo rmat) to download as text.
Click
(D o wnl o ad thi s repo rt i n csv fo rmat) to download as a comma
separated file.
Click
(D o wnl o ad thi s repo rt i n P D F fo rmat) to download as PD F.
The report is automatically named with the type of report and date.
6 .3.2 .4 . Sho wing a Re po rt in Full Scre e n
View the report in full screen to zoom into the report screen. From full screen, you can also print the
chart that accompanies a report
6.3.3. Adding a Report
Add reports if the default reports do not include what you need or you want to narrow the scope of a
report. For example, you may want a report that shows only Windows virtual machines.
Pro ced u re 6 .23. T o Ad d a R ep o rt
1. Navigate to C lo u d In t ellig en ce → R ep o rt s.
2. Click the R ep o rt s accordion.
3. Click
(C o nfi g urati o n), then click
(Ad d a New R epo rt).
4. In the C o lu mn s tab, edit the Basi c R epo rt Info area.
Type a unique name in Menu Name for how you want the report described in the menu list.
Type the T i tl e you want displayed on the report in title.
5. Add fields in the C o nfi g ure R epo rt C o l umns area.
14 1
Red Hat CloudForms 3.0 Management Engine 5.2 Insight G uide
Use the Base the repo rt o n table dropdown to choose a table to get fields from.
Note
If you change the report base or the interval, all selections below will be reset.
Select fields that you want in the report from Avai l abl e Fi el d s, and then click
(Mo ve sel ected fi el d s d o wn). In addition to the fields, you can also select any
tags that you have created and assigned.
Change the order of the fields in the report by clicking
up) or
(Mo ve sel ected fi el d s
(Mo ve sel ected fi el d s d o wn).
6. Click on the C o n so lid at io n tab to consolidate and aggregate data points into maximum,
minimum, average, and total. Specifically, this would be useful for analyzing performance
data over a specific period of time. Note that if you do this, you will not see individual records,
but rather the calculation as a column header.
14 2
Chapt er 6 . Cloud Int elligence
Select the columns to group by.
For each numeric field selected in the report, you can click the dropdown under
C al cul ati o ns. Check the calculations you want to use.
7. Click on the Fo rmat t in g tab to set the size of paper for a PD F and column header format.
From the P D F O utput area, select the page size from the dropdown.
From Speci fy C o l umn Head ers and Fo rmats, type the text you want displayed for
each field. For each numeric field, you can also set the numeric format.
14 3
Red Hat CloudForms 3.0 Management Engine 5.2 Insight G uide
8. Click on the Styl i ng tab to change the color of the text or the background for a row based
on a condition.
Use Style to select the format for the value, you can choose to change the text color or the
background.
Use If to create a conditional statement for the style.
9. Click on the Filt er tab to set filters for the data displayed in the report. There are two types of
filters: the first is the R eco rd Fi l ter which is the primary filter of the main tables records,
the second is also a D i spl ay Fi l ter, which is a secondary filter of rows based on the
fields of the child table. Click
in the appropriate area to use the expression editor to
choose the appropriate options for your criteria. Based on what you choose, different options
will show.
Click Fi el d to create criteria based on field values.
Click C o unt o f to create criteria based on the count of something, such as the number of
snapshots for a Virtual Machine, or the number of Virtual Machines on a Host.
14 4
Chapt er 6 . Cloud Int elligence
Click T ag to create criteria based on tags assigned to your resources. For example, you
may want to check the power state of a virtual machine or see if it is tagged as production.
Click R eg i stry to create criteria based on registry values. For example, you may want to
check if D COM is enabled on a Windows System. Note that this applies only to Windows
operating systems.
Click Fi nd to seek a particular value, and then check a property. For example, finding the
Admin account and checking that it is enabled.
Click
(C o mmi t Expressi o n El ement C hang es) to add the expression.
14 5
Red Hat CloudForms 3.0 Management Engine 5.2 Insight G uide
Note
The filters that you apply will show at the bottom of the report so that you know which
filters have been applied.
10. Click on the Su mmary tab to select sort order, sort type, groupings, and group calculations
for the report. Summary groups rows of data based on the sort breaks. You can only sort by
fields that display in the report.
Set the primary sort in So rt the R epo rt by.
Set the next sorts in Wi thi n Abo ve Fi el d , So rt By.
Select the type of sort, ascending or descending, in So rt o rd er.
In Sho w So rt breaks, select Yes to show the sort breaks, C o u n t s to show sort breaks
with the count, or N o for no sort breaks.
For any numeric field, you can select to show minimum, average, maximum, and total in
the sort break.
11. Click on the C h art s tab to create a chart for the report. This is not required.
14 6
Chapt er 6 . Cloud Int elligence
Use C ho o se a chart type to select a type of chart. Note that some charts may not
produce the result you are looking for based on the types of fields in the report and its sort
order.
If you only want to see the top values, select the number of top values from T o p val ues
to sho w.
If you want to see the total number of values that are not categorize and evaluate to other,
check Sum ' O ther' val ues.
12. Click on the T imelin e tab to select a timeline for the report. You must have a field of time or
date format to use this feature.
Use Base T i mel i ne o n to select a column in date or time format for the report.
Select a unit of time for the first band in Fi rst band uni t.
Select a unit of time for the second band in Seco nd band uni t.
Select a unit of time for the third band in T hi rd band uni t.
Select an Event to po si ti o n at.
Select the range for the event to position from Sho w events fro m l ast.
Note
If you select a timeline for a report, that timeline will also show on the timelines page of
C l o ud Intel l i g ence. The filters that you apply will show on a timeline report so
that you know which filters have been applied.
13. Click the P revi ews tab to see a sample of your report.
14. When you have the report that you want, click Ad d to create the new report.
14 7
Red Hat CloudForms 3.0 Management Engine 5.2 Insight G uide
R esu lt :
The new report is created. To make the report accessible from the report menu, you must add it to a
report menu. See Customizing Report Menus.
6.3.4 . Copying a Report
Use this feature to copy a report that is similar to one that you want to create. Then, you only need to
make minor edits instead of creating an entirely new report.
1. Navigate to C lo u d In t ellig en ce → R ep o rt s.
2. Click the R ep o rt s accordion and select the report that you want to copy.
3. Click
(C o nfi g urati o n), then click
(C o py thi s repo rt).
4. On the Columns tab, edit the Basi c R epo rt Info area to include a new Menu Name. Each
Menu Name must be unique.
5. Make any other changes you need. See Adding a Report for details on the changes you can
make.
6. Click Ad d to create the new report.
6.3.5. Edit ing a Report
If you find that a report is not giving you the data that you need, you can edit it after it has been
created. Note that only reports that you have created can be modified. Only administrators and super
administrators of CloudForms Management Engine can add, copy, edit, and delete reports.
Pro ced u re 6 .24 . T o Ed it a R ep o rt
1. Navigate to C lo u d In t ellig en ce → R ep o rt .
2. Click the R ep o rt s accordion and select the report you want to edit.
3. Click
(C o nfi g urati o n),
(Ed i t thi s R epo rt).
4. Make any changes you need.
5. Click Save to commit the changes.
6.3.6. Delet ing a Report
D elete reports when you find that they are no longer useful. Only administrators and super
administrators of CloudForms Management Engine can add, copy, edit, and delete reports. Note that
only customer created reports can be deleted.
Pro ced u re 6 .25. T o D elet e a R ep o rt
1. Navigate to C lo u d In t ellig en ce → R ep o rt s.
2. Click the R ep o rt s accordion and select the report you want to delete.
3. Click
14 8
(C o nfi g urati o n),
(D el ete thi s R epo rt fro m the D atabase).
Chapt er 6 . Cloud Int elligence
Note
The D el ete thi s repo rt fro m the D atabase option will only appear on reports
you have created. D efault reports cannot be deleted.
4. Click O K to confirm.
6.3.7. Export ing a Report
Reports are stored in the VMD B; however, you may want to share customized reports among VMD Bs.
To do this use the export and import feature of reports.
Pro ced u re 6 .26 . T o Exp o rt a R ep o rt
1. Navigate to C lo u d In t ellig en ce → R ep o rt s.
2. Click the Exp o rt /Imp o rt accordion.
3. In the Expo rt area, select the reports that you want to export.
4. Click O K to confirm.
R esu lt :
The report is exported and is ready to be imported into another VMD B.
6.3.8. Import ing a Report
Reports are stored in the VMD B; however, you may want to share customized reports among VMD Bs.
To do this use the export and import feature of reports.
Pro ced u re 6 .27. T o Imp o rt a R ep o rt
1. Navigate to C lo u d In t ellig en ce → R ep o rt s.
2. Click the Exp o rt /Imp o rt accordion.
3. In the Impo rt area, click Bro wse to find the file to import.
4. If you want to overwrite an existing report with the same menu name, check the O verwri te
exi sti ng repo rts box.
5. Click Upl o ad .
R esu lt :
The report is importing into the C o mpany-C usto m folder and can be moved to another menu.
6.3.9. Report Menus
By default, all account roles have the same reports available. If you have the super administrator or
administrator role, you can customize the accordions, the folders within them, and the locations of
your reports.
14 9
Red Hat CloudForms 3.0 Management Engine 5.2 Insight G uide
Note
When you create your own report, the report is not automatically available. You must add it to
a report menu.
The report menu is a hierarchical structure that consists of the following components:
The T o p Level under which the accordions are shown. (T o p Level is only displayed when
you are in the report menu editor.)
Accordions that are general categories for the reports. The defaults supplied are
C o nfi g urati o n Manag ement, Mi g rati o n R ead i ness, O perati o ns, VM Sprawl ,
R el ati o nshi ps, and Events.
Folders that are used to further organize reports within an accordion. For example, under the
C o nfi g urati o n Manag ement, you would see folders for virtual machines, hosts, and other
virtual infrastructure components.
Reports that are stored directly in the folders.
6 .3.9 .1 . Managing Re po rt Me nu Acco rdio ns
Pro ced u re 6 .28. T o Man ag e R ep o rt Men u Acco rd io n s
1. Navigate to C lo u d In t ellig en ce → R ep o rt s.
2. Click the Ed it R ep o rt Men u s accordion.
3. Click the role whose menus you want to customize.
4. Click on T o p Level to organize, add, and delete accordions.
Click
of the list.
(Mo ve sel ected Acco rd i o n to to p) to move the accordion to the top
Click
(Mo ve sel ected Acco rd i o n up) to move the accordion up.
Click
(Mo ve sel ected Acco rd i o n d o wn) to move the accordion down.
Click
(Mo ve sel ected Acco rd i o n to bo tto m) to move the accordion to the
bottom of the list.
Click
(D el ete sel ected Acco rd i o n and i ts co ntents) to delete an
accordion.
150
Chapt er 6 . Cloud Int elligence
Click
(Ad d fo l d er to sel ected Acco rd i o n) to add an accordion. Note that if
you are creating a new accordion, T o p Level must have been selected under R epo rts.
Be sure to select the folder you want to create a subfolder for on the left pane. To name the
accordion, double-click on New Fo l d er. Click on T o p Level in the R epo rts area.
5. When you are finished adding accordions, click
chang es). To revert, click
(C o mmi t fo l d er manag ement
(D i scard fo l d er manag ement chang es).
6. Click Save.
R esu lt :
The new accordion is added, and you can add folders in which to store reports to it. You can also
organize the reports into folder that are meaningful to you.
6 .3.9 .2 . Managing Re po rt Me nu Fo lde rs
Pro ced u re 6 .29 . T o Man ag e R ep o rt Men u Fo ld ers
1. Log in to the console as a user who is assigned either the super administrator or
administrator account role.
2. Navigate to C lo u d In t ellig en ce → R ep o rt s.
3. Click the Ed it R ep o rt Men u s accordion.
4. Click the role whose menus you want to customize.
5. Click on the accordion name you want to organize or add folders to.
Click
list.
(Mo ve sel ected fo l d er to to p) to move the folder to the top of the
Click
(Mo ve sel ected fo l d er up) to move the folder up.
Click
(Mo ve sel ected fo l d er d o wn) to move the folder down.
Click
of the list.
(Mo ve sel ected fo l d er to bo tto m) to move the folder to the bottom
Click
(D el ete sel ected fo l d er and i ts co ntents) to delete an accordion.
Click
(Ad d subfo l d er to sel ected fo l d er) to add a folder. When creating a
new folder, be sure to select the Accordion that you want the folder to show under. To
name the folder, double-click on New Fo l d er.
151
Red Hat CloudForms 3.0 Management Engine 5.2 Insight G uide
6. When you are finished making changes click
chang es). To revert, click
(C o mmi t fo l d er manag ement
(D i scard fo l d er manag ement chang es).
7. Click Save.
Note
Only reports that are not already in another folder can be assigned.
Reports are stored in folders under accordions. Only reports that are not already in another folder for
that user role can be assigned.
6 .3.9 .3. Organizing Re po rt s in Re po rt Me nus
Pro ced u re 6 .30. T o O rg an iz e R ep o rt s in R ep o rt Men u s
1. Log in to the console as a user who is assigned either the Super Administrator or
Administrator Account Role.
2. Navigate to C lo u d In t ellig en ce → R ep o rt s.
3. Click the Ed it R ep o rt Men u s accordion.
4. Click the role whose menus you want to customize.
5. Expand the R ep o rt accordion and menus using the triangles to the left of the item name until
you are able to select the subfolder where you want to put reports.
6. Choose one of the following actions.
To add a report, select a report from the Avai l abl e R epo rts area on the right and click
(Mo ve sel ected repo rts l eft).
To remove a report from a folder, select the report from the Sel ected R epo rts area and
click
(Mo ve sel ected repo rts ri g ht).
To move a report to the top of the folder, select the report and click
sel ected repo rts to to p).
To move a report up one place in the folder, select the report and click
sel ected repo rts up).
To move a report down one place in the folder, select the report and click
sel ected repo rts d o wn).
152
(Mo ve
(Mo ve
(Mo ve
Chapt er 6 . Cloud Int elligence
To move a report to the bottom of the folder, select the report and click
sel ected repo rts to bo tto m).
7. When you are finished making changes click
chang es).
(Mo ve
(C o mmi t repo rt manag ement
8. Click Save.
R esu lt :
The changes are made. The next time a user with this Account Role logs in, the new report and menu
structure will be displayed.
6.4 . Usage
Usage provides a targeted view of CPU, RAM, disk space, disk I/O, and network I/O for tagged virtual
machines. This allows you to find which virtual machines are using or overusing resources.
There are two requirements to use this feature:
You must assign tags to the virtual machines that you want to collect usage data for. See Tagging
a Virtual Machine.
Capacity and utilization collection must be enabled. See Server Control Settings.
6.4 .1. Accessing Usage Dat a
Pro ced u re 6 .31. T o Access U sag e D at a
1. Navigate to C lo u d In t ellig en ce → U sag e.
2. In the O pti o ns area, select a D ate. More choices will display.
3.
From P eri o d , select either D ay or H o u r. If you select H o u r, you will be prompted for
which hour in UTC time.
From C ateg o ry, select the category for the tag.
From Entry, select the tag from within the category that you want usage data for.
6.5. Chargeback
The chargeback feature allows you to calculate monetary virtual machine charges based on owner
or company tag. To use this feature you must be collecting capacity and utilization data. See Settings
and Operations Guide, Server Control Settings and Capacity & Utilization Collection Settings.
153
Red Hat CloudForms 3.0 Management Engine 5.2 Insight G uide
6.5.1. Chargeback Rat es
CloudForms Management Engine provides a default set of rates for calculating chargeback costs,
but you can create your own set of computing and storage costs by navigating to C lo u d
In t ellig en ce → C h arg eb ack and clicking the R at es accordion.
Chargeback costs are computed using a set formula based on hourly cost per unit and hourly
usage. For example, calculating the Memory Used Cost in dollars ($) for a day can be expressed in
the following ways:
Memory allocation per hour (in MB) * Hourly Allocation cost per megabyte * Number of Memory
Allocation metrics available for the day
Sum of Memory allocation for the day (in MB) * Hourly Allocation cost per megabyte
Sum of Memory allocation for the day (in MB) * D aily Allocation cost per megabyte / 24
Examp le 6 .1. Memo ry U sed C o st
In a scenario where 9.29 GB of memory is used in a day with the chargeback rate set at one dollar
($1) per megabyte per day, the Memory Used Cost would be $396.42.
9.29 GB = 9514.08 MB
9514.08 MB * $1 (per MB per day) = $9514.08
$9514.08 / 24 = $396.42 Memory Used Cost
6.5.2. Creat ing Chargeback Rat es
CloudForms Management Engine allows you to create your own set of computing and storage costs.
Pro ced u re 6 .32. T o C reat e C h arg eb ack R at es
1. Navigate to C lo u d In t ellig en ce → C h arg eb ack.
2. Click the R at es accordion and select either C o mpute or Sto rag e.
3.
Use C o mpute to set chargeback rates for CPU, disk I/O, memory, network I/O, and fixed
items.
Use Sto rag e to set chargeback rates for fixed and storage items.
4. Click
(C o nfi g urati o n),
chargeback rate.
(Ad d a new C harg eback R ate) to create a new
5. Type in a D escri pti o n for the chargeback rate.
6. For each item that you want to set, type in a rate and select a time option.
7. Click Ad d .
6.5.3. Assigning Chargeback Rat es
CloudForms Management Engine allows you to assign chargeback rates by choosing from C o mpute
and Sto rag e.
154
Chapt er 6 . Cloud Int elligence
Pro ced u re 6 .33. T o Assig n C h arg eb ack R at es
1. Navigate to C lo u d In t ellig en ce → C h arg eb ack.
2. Click the Assig n men t s accordion, and click either C o mpute or Sto rag e.
Use C o mpute to assign a compute chargeback rate. You can assign chargeback rates to
T h e En t erp rise, Select ed C lu st ers, Select ed In f rast ru ct u re Pro vid ers, or
T ag g ed VMs an d In st an ces.
Use Sto rag e to assign a storage chargeback rate. You can assign chargeback rates to
T h e En t erp rise, Select ed D at ast o res, or T ag g ed D at ast o res
3. From the Basi c Info area, use the Assi g n T o dropdown to select a type of assignee to
assign the rate set to. The options displayed will vary based on the type you selected.
4. For each item that you want to set, select the chargeback rate that you want to use.
5. Click Save.
R esu lt :
The rate is assigned. The next time you generate a chargeback report, these values will be used.
Note
Note that when viewing chargeback, there is a rate for a virtual machine for the number of the
CPUs. The chargeback for this parameter is calculated based on when the virtual machine is
running. If the virtual machine is not running, then it is not charged for CPU allocation. .
6.5.4 . Creat ing a Chargeback Report
CloudForms Management Engine allows you to create chargeback reports to monitor costs you
charged.
Pro ced u re 6 .34 . T o C reat e a C h arg eb ack R ep o rt
1. Navigate to C lo u d In t ellig en ce → R ep o rt s.
2. Click the R epo rts accordion.
3. Click
(C o nfi g urati o n),
(Ad d a new R epo rt).
4. On the C o lu mn s tab, fill out the Basi c R epo rt Info area.
Type a unique name in Menu Name for how you want the report described in the menu list.
Type the T i tl e you want displayed on the report.
5. Add fields in the C o nfi g ure R epo rt C o l umns area.
From Base the repo rt o n table dropdown, select C h arg eb acks.
155
Red Hat CloudForms 3.0 Management Engine 5.2 Insight G uide
Select fields that you want in the report from Avai l abl e Fi el d s, then click
(Mo ve sel ected fi el d s d o wn). In addition to the fields, you can also select any
tags that you have created and assigned.
Change the order of the fields in the report by clicking
up) or
(Mo ve sel ected fi el d s
(Mo ve sel ected fi el d s d o wn).
6. Click the Fo rmat t in g tab to set the size of paper for a PD F and column header format.
From the P D F O utput area, select the page size from the dropdown.
From Speci fy C o l umn Head ers and Fo rmats, type the text you want displayed for
each field. For each numeric field, you can also set the numeric format.
7. Click the Filt er tab to set filters for the data displayed in the report.
From C harg eback Fi l ters, select how you want the costs to show, the tag category,
the tag, and how you want the items grouped.
From C harg eback Interval , select the time interval. You must have a full interval worth
of data in order to select an option other than P arti al in the D ai l y End i ng Wi th
dropdown.
8. Click the Preview tab, and then Load to see what the report will look like.
9. When you are satisfied that you have the report that you want, click Ad d to create the new
report.
R esu lt :
The new report is created. To make the report accessible from the R ep o rt menu, you must add it to a
report menu. See Customizing Report Menus.
6.6. T imelines
6.6.1. Accessing and Using a T imeline
You can use timelines to view the history record for virtual machines.
Note
Amazon does not provide events, so CloudForms Management Engine does not support
timelines for virtual machines hosted by Amazon.
Pro ced u re 6 .35. T o Access an d U se a T imelin e
1. Navigate to C lo u d In t ellig en ce → T imelin es.
2. From the accordion on the left, click a category of T i mel i ne.
156
Chapt er 6 . Cloud Int elligence
Select C o nfi g urati o n Manag ement to see when items were brought under
management.
Select Events to view timelines related to operations and changes in configuration.
3. D rag the relevant time band, such as hour, day, or month to go to the time you want to see.
Note that some timelines, such as Events O perati o ns: Al l Events, use minutes,
hours, and days instead going back only 30 days.
4. To see more detail for a resource in the timeline, click on it. A balloon appears with a clickable
link to the resource.
6.6.2. Downloading a T imeline's Dat a
You can download timeline data for further analysis or printing.
Pro ced u re 6 .36 . T o D o wn lo ad a T imelin e' s D at a
1. Navigate to C lo u d In t ellig en ce → T imelin es, and click the timeline you want to download.
2. Click on the download button for the format you want.
Click
text.
(D o wnl o ad thi s T i mel i ne d ata i n text fo rmat) to download as
Click
(D o wnl o ad thi s T i mel i ne d ata i n csv fo rmat) to download as a
comma separated file.
Click
PD F.
(D o wnl o ad thi s T i mel i ne d ata i n P D F fo rmat) to download as
6.7. RSS
6.7.1. RSS
Use RSS to view RSS feeds based on administrative roles. You can subscribe to the RSS feeds and
have them delivered to an RSS reader.
157
Red Hat CloudForms 3.0 Management Engine 5.2 Insight G uide
You can filter the list of RSS feeds by administrative role using the Ad mi n R o l e Fi l ter drop
down.
158
Report able Fields in CloudForms Management Engine
Reportable Fields in CloudForms Management Engine
CloudForms Management Engine (CFME) provides a set of out of the box reports covering a variety
of areas. These fields are collected by CFME from the different parts of the infrastructure. Most of the
fields are named directly as the vendor would name them. However, there are some fields that CFME
calculates given this data. Note that this list may vary by Provider and may change as new Providers
are added to CFME. Also, note that the value returned by each reportable field below is in megabytes
(MB).
T ab le A.1. C lu st ers
R ep o rt ab le Field
Memory - Aggregate Used for Child VMs for Collected Intervals 30 D ay Avg
Memory - Aggregate Used for Child VMs for Collected Intervals 30 D ay High Avg
Memory - Aggregate Used for Child VMs for Collected Intervals 30 D ay Low Avg
D atastores : Memory - Aggregate Used for Child VMs for Collected Intervals 30 D ay Avg
D atastores : Memory - Aggregate Used for Child VMs for Collected Intervals 30 D ay High Avg
D atastores : Memory - Aggregate Used for Child VMs for Collected Intervals 30 D ay Low Avg
Hosts : Memory - Aggregate Used for Child VMs for Collected Intervals 30 D ay Avg
Hosts : Memory - Aggregate Used for Child VMs for Collected Intervals 30 D ay High Avg
Hosts : Memory - Aggregate Used for Child VMs for Collected Intervals 30 D ay Low Avg
Miq Templates : Memory - Aggregate Used for Child VMs for Collected Intervals 30 D ay Avg
Miq Templates : Memory - Aggregate Used for Child VMs for Collected Intervals 30 D ay High Avg
Miq Templates : Memory - Aggregate Used for Child VMs for Collected Intervals 30 D ay Low Avg
Miq Templates : Memory - Aggregate Used for Child VMs for Collected Intervals 30 D ay Max
Provider : Memory - Aggregate Used for Child VMs for Collected Intervals 30 D ay Avg
Provider : Memory - Aggregate Used for Child VMs for Collected Intervals 30 D ay High Avg
Provider : Memory - Aggregate Used for Child VMs for Collected Intervals 30 D ay Low Avg
VMs : Memory - Aggregate Used for Child VMs for Collected Intervals 30 D ay Max
VMs : Memory - Avg Used for Collected Intervals 30 D ay Avg
VMs : Memory - Avg Used for Collected Intervals 30 D ay High Avg
T ab le A.2. D at ast o re Files
R ep o rt ab le Field
D atastore : Memory - Aggregate Used for Child VMs for Collected Intervals 30 D ay Avg
D atastore : Memory - Aggregate Used for Child VMs for Collected Intervals 30 D ay High Avg
D atastore : Memory - Aggregate Used for Child VMs for Collected Intervals 30 D ay Low Avg
VM Template : Memory - Aggregate Used for Child VMs for Collected Intervals 30 D ay Avg
VM Template : Memory - Aggregate Used for Child VMs for Collected Intervals 30 D ay High Avg
VM Template : Memory - Aggregate Used for Child VMs for Collected Intervals 30 D ay Low Avg
VM Template : Memory - Aggregate Used for Child VMs for Collected Intervals 30 D ay Max
VM and Instance : Memory - Aggregate Used for Child VMs for Collected Intervals 30 D ay Max
VM and Instance : Memory - Avg Used for Collected Intervals 30 D ay Avg
VM and Instance : Memory - Avg Used for Collected Intervals 30 D ay High Avg
VM and Instance : Memory - Avg Used for Collected Intervals 30 D ay Low Avg
Memory - Aggregate Used for Child VMs for Collected Intervals 30 D ay Avg
Memory - Aggregate Used for Child VMs for Collected Intervals 30 D ay High Avg
Memory - Aggregate Used for Child VMs for Collected Intervals 30 D ay Low Avg
159
Red Hat CloudForms 3.0 Management Engine 5.2 Insight G uide
R ep o rt ab le Field
File Share.File System.Hosts : Memory - Aggregate Used for Child VMs for Collected Intervals 30
D ay Avg
File Share.File System.Hosts : Memory - Aggregate Used for Child VMs for Collected Intervals 30
D ay High Avg
File Share.File System.Hosts : Memory - Aggregate Used for Child VMs for Collected Intervals 30
D ay Low Avg
File Share.File System.Logical D isk.Hosts : Memory - Aggregate Used for Child VMs for Collected
Intervals 30 D ay Avg
File Share.File System.Logical D isk.Hosts : Memory - Aggregate Used for Child VMs for Collected
Intervals 30 D ay High Avg
File Share.File System.Logical D isk.Hosts : Memory - Aggregate Used for Child VMs for Collected
Intervals 30 D ay Low Avg
File Share.File System.Logical D isk.VMs : Memory - Aggregate Used for Child VMs for Collected
Intervals 30 D ay Max
File Share.File System.Logical D isk.VMs : Memory - Avg Used for Collected Intervals 30 D ay Avg
File Share.File System.Logical D isk.VMs : Memory - Avg Used for Collected Intervals 30 D ay High
Avg
File Share.File System.Logical D isk.VMs : Memory - Avg Used for Collected Intervals 30 D ay Low
Avg
File Share.File System.VMs : Memory - Aggregate Used for Child VMs for Collected Intervals 30 D ay
Max
File Share.File System.VMs : Memory - Avg Used for Collected Intervals 30 D ay Avg
File Share.File System.VMs : Memory - Avg Used for Collected Intervals 30 D ay High Avg
File Share.VMs : Memory - Avg Used for Collected Intervals 30 D ay Low Avg
Hosts : Memory - Aggregate Used for Child VMs for Collected Intervals 30 D ay Avg
Hosts : Memory - Aggregate Used for Child VMs for Collected Intervals 30 D ay High Avg
Hosts : Memory - Aggregate Used for Child VMs for Collected Intervals 30 D ay Low Avg
Miq Templates : Memory - Aggregate Used for Child VMs for Collected Intervals 30 D ay Avg
Miq Templates : Memory - Aggregate Used for Child VMs for Collected Intervals 30 D ay High Avg
Miq Templates : Memory - Aggregate Used for Child VMs for Collected Intervals 30 D ay Low Avg
Miq Templates : Memory - Aggregate Used for Child VMs for Collected Intervals 30 D ay Max
VMs : Memory - Aggregate Used for Child VMs for Collected Intervals 30 D ay Max
VMs : Memory - Avg Used for Collected Intervals 30 D ay Avg
VMs : Memory - Avg Used for Collected Intervals 30 D ay High Avg
VMs : Memory - Avg Used for Collected Intervals 30 D ay Low Avg
T ab le A.3. D at ast o res
R ep o rt ab le Field
Memory - Aggregate Used for Child VMs for Collected Intervals 30
Memory - Aggregate Used for Child VMs for Collected Intervals 30
Memory - Aggregate Used for Child VMs for Collected Intervals 30
File Share.File System.Hosts : Memory - Aggregate Used for Child
D ay Avg
160
D ay
D ay
D ay
VMs
Avg
High Avg
Low Avg
for Collected Intervals 30
Report able Fields in CloudForms Management Engine
R ep o rt ab le Field
File Share.File System.Hosts : Memory - Aggregate Used for Child VMs for Collected Intervals 30
D ay High Avg
File Share.File System.Hosts : Memory - Aggregate Used for Child VMs for Collected Intervals 30
D ay Low Avg
File Share.File System.Logical D isk.Hosts : Memory - Aggregate Used for Child VMs for Collected
Intervals 30 D ay Avg
File Share.File System.Logical D isk.Hosts : Memory - Aggregate Used for Child VMs for Collected
Intervals 30 D ay High Avg
File Share.File System.Logical D isk.Hosts : Memory - Aggregate Used for Child VMs for Collected
Intervals 30 D ay Low Avg
File Share.File System.Logical D isk.VMs : Memory - Aggregate Used for Child VMs for Collected
Intervals 30 D ay Max
File Share.File System.Logical D isk.VMs : Memory - Avg Used for Collected Intervals 30 D ay Avg
File Share.File System.Logical D isk.VMs : Memory - Avg Used for Collected Intervals 30 D ay High
Avg
File Share.File System.Logical D isk.VMs : Memory - Avg Used for Collected Intervals 30 D ay Low
Avg
File Share.File System.VMs : Memory - Aggregate Used for Child VMs for Collected Intervals 30 D ay
Max
File Share.File System.VMs : Memory - Avg Used for Collected Intervals 30 D ay Avg
File Share.File System.VMs : Memory - Avg Used for Collected Intervals 30 D ay High Avg
File Share.File System.VMs : Memory - Avg Used for Collected Intervals 30 D ay Low Avg
File Share.Hosts : Memory - Aggregate Used for Child VMs for Collected Intervals 30 D ay Avg
File Share.Hosts : Memory - Aggregate Used for Child VMs for Collected Intervals 30 D ay High Avg
File Share.Hosts : Memory - Aggregate Used for Child VMs for Collected Intervals 30 D ay Low Avg
File Share.VMs : Memory - Aggregate Used for Child VMs for Collected Intervals 30 D ay Max
File Share.VMs : Memory - Avg Used for Collected Intervals 30 D ay Avg
File Share.VMs : Memory - Avg Used for Collected Intervals 30 D ay High Avg
File Share.VMs : Memory - Avg Used for Collected Intervals 30 D ay Low Avg
Hosts : Memory - Aggregate Used for Child VMs for Collected Intervals 30 D ay Avg
Hosts : Memory - Aggregate Used for Child VMs for Collected Intervals 30 D ay High Avg
Hosts : Memory - Aggregate Used for Child VMs for Collected Intervals 30 D ay Low Avg
Miq Templates : Memory - Aggregate Used for Child VMs for Collected Intervals 30 D ay Avg
Miq Templates : Memory - Aggregate Used for Child VMs for Collected Intervals 30 D ay High Avg
Miq Templates : Memory - Aggregate Used for Child VMs for Collected Intervals 30 D ay Low Avg
Miq Templates : Memory - Aggregate Used for Child VMs for Collected Intervals 30 D ay Max
VMs : Memory - Aggregate Used for Child VMs for Collected Intervals 30 D ay Max
VMs : Memory - Avg Used for Collected Intervals 30 D ay Avg
VMs : Memory - Avg Used for Collected Intervals 30 D ay High Avg
VMs : Memory - Avg Used for Collected Intervals 30 D ay Low Avg
T ab le A.4 . EVM G ro u p s
161
Red Hat CloudForms 3.0 Management Engine 5.2 Insight G uide
R ep o rt ab le Field
Miq Templates : Memory - Aggregate Used for Child VMs for Collected Intervals 30
Miq Templates : Memory - Aggregate Used for Child VMs for Collected Intervals 30
Miq Templates : Memory - Aggregate Used for Child VMs for Collected Intervals 30
Miq Templates : Memory - Aggregate Used for Child VMs for Collected Intervals 30
VMs : Memory - Aggregate Used for Child VMs for Collected Intervals 30 D ay Max
VMs : Memory - Avg Used for Collected Intervals 30 D ay Avg
VMs : Memory - Avg Used for Collected Intervals 30 D ay High Avg
VMs : Memory - Avg Used for Collected Intervals 30 D ay Low Avg
Miq Templates : Memory - Aggregate Used for Child VMs for Collected Intervals 30
Miq Templates : Memory - Aggregate Used for Child VMs for Collected Intervals 30
Miq Templates : Memory - Aggregate Used for Child VMs for Collected Intervals 30
Miq Templates : Memory - Aggregate Used for Child VMs for Collected Intervals 30
VMs : Memory - Aggregate Used for Child VMs for Collected Intervals 30 D ay Max
VMs : Memory - Avg Used for Collected Intervals 30 D ay Avg
VMs : Memory - Avg Used for Collected Intervals 30 D ay High Avg
VMs : Memory - Avg Used for Collected Intervals 30 D ay Low Avg
D ay
D ay
D ay
D ay
Avg
High Avg
Low Avg
Max
D ay
D ay
D ay
D ay
Avg
High Avg
Low Avg
Max
T ab le A.5. H o st s
R ep o rt ab le Field
Memory - Aggregate Used for Child VMs for Collected Intervals 30 D ay Avg
Memory - Aggregate Used for Child VMs for Collected Intervals 30 D ay High Avg
Memory - Aggregate Used for Child VMs for Collected Intervals 30 D ay Low Avg
Cluster : Memory - Aggregate Used for Child VMs for Collected Intervals 30 D ay Avg
Cluster : Memory - Aggregate Used for Child VMs for Collected Intervals 30 D ay High Avg
Cluster : Memory - Aggregate Used for Child VMs for Collected Intervals 30 D ay Low Avg
D atastores : Memory - Aggregate Used for Child VMs for Collected Intervals 30 D ay Avg
D atastores : Memory - Aggregate Used for Child VMs for Collected Intervals 30 D ay High Avg
D atastores : Memory - Aggregate Used for Child VMs for Collected Intervals 30 D ay Low Avg
Miq Templates : Memory - Aggregate Used for Child VMs for Collected Intervals 30 D ay Avg
Miq Templates : Memory - Aggregate Used for Child VMs for Collected Intervals 30 D ay High Avg
Miq Templates : Memory - Aggregate Used for Child VMs for Collected Intervals 30 D ay Low Avg
Miq Templates : Memory - Aggregate Used for Child VMs for Collected Intervals 30 D ay Max
Provider : Memory - Aggregate Used for Child VMs for Collected Intervals 30 D ay Avg
Provider : Memory - Aggregate Used for Child VMs for Collected Intervals 30 D ay High Avg
Provider : Memory - Aggregate Used for Child VMs for Collected Intervals 30 D ay Low Avg
VMs : Memory - Aggregate Used for Child VMs for Collected Intervals 30 D ay Max
VMs : Memory - Avg Used for Collected Intervals 30 D ay Avg
VMs : Memory - Avg Used for Collected Intervals 30 D ay High Avg
VMs : Memory - Avg Used for Collected Intervals 30 D ay Low Avg
T ab le A.6 . Imag es
R ep o rt ab le Field
Memory
Memory
Memory
Memory
162
-
Aggregate Used
Aggregate Used
Aggregate Used
Aggregate Used
for
for
for
for
Child
Child
Child
Child
VMs
VMs
VMs
VMs
for
for
for
for
Collected
Collected
Collected
Collected
Intervals
Intervals
Intervals
Intervals
30
30
30
30
D ay
D ay
D ay
D ay
Avg
High Avg
Low Avg
Max
Report able Fields in CloudForms Management Engine
R ep o rt ab le Field
Cluster : Memory - Aggregate Used for Child VMs for Collected Intervals 30 D ay Avg
Cluster : Memory - Aggregate Used for Child VMs for Collected Intervals 30 D ay High Avg
Cluster : Memory - Aggregate Used for Child VMs for Collected Intervals 30 D ay Low Avg
D atastore : Memory - Aggregate Used for Child VMs for Collected Intervals 30 D ay Avg
D atastore : Memory - Aggregate Used for Child VMs for Collected Intervals 30 D ay High Avg
D atastore : Memory - Aggregate Used for Child VMs for Collected Intervals 30 D ay Low Avg
D atastores : Memory - Aggregate Used for Child VMs for Collected Intervals 30 D ay Avg
D atastores : Memory - Aggregate Used for Child VMs for Collected Intervals 30 D ay High Avg
D atastores : Memory - Aggregate Used for Child VMs for Collected Intervals 30 D ay Low Avg
Host : Memory - Aggregate Used for Child VMs for Collected Intervals 30 D ay Avg
Host : Memory - Aggregate Used for Child VMs for Collected Intervals 30 D ay High Avg
Host : Memory - Aggregate Used for Child VMs for Collected Intervals 30 D ay Low Avg
Provider : Memory - Aggregate Used for Child VMs for Collected Intervals 30 D ay Avg
Provider : Memory - Aggregate Used for Child VMs for Collected Intervals 30 D ay High Avg
Provider : Memory - Aggregate Used for Child VMs for Collected Intervals 30 D ay Low Avg
Provisioned From Template : Memory - Aggregate Used for Child VMs for Collected Intervals 30
D ay Avg
Provisioned From Template : Memory - Aggregate Used for Child VMs for Collected Intervals 30
D ay High Avg
Provisioned From Template : Memory - Aggregate Used for Child VMs for Collected Intervals 30
D ay Low Avg
Provisioned From Template : Memory - Aggregate Used for Child VMs for Collected Intervals 30
D ay Max
Provisioned VMs : Memory - Aggregate Used for Child VMs for Collected Intervals 30 D ay Avg
Provisioned VMs : Memory - Aggregate Used for Child VMs for Collected Intervals 30 D ay High Avg
Provisioned VMs : Memory - Aggregate Used for Child VMs for Collected Intervals 30 D ay Low Avg
Provisioned VMs : Memory - Aggregate Used for Child VMs for Collected Intervals 30 D ay Max
Service.VMs : Memory - Aggregate Used for Child VMs for Collected Intervals 30 D ay Max
Service.VMs : Memory - Avg Used for Collected Intervals 30 D ay Avg
Service.VMs : Memory - Avg Used for Collected Intervals 30 D ay High Avg
Service.VMs : Memory - Avg Used for Collected Intervals 30 D ay Low Avg
163
Red Hat CloudForms 3.0 Management Engine 5.2 Insight G uide
Chapter 7. Compiler Output
T o p ic ID 25811
INFO: D ata Collection for Red Hat Enterprise Linux OpenStack Platform
INFO: Topic URL
ERROR: This topic has invalid Injection Points. The processed XML is
<section
id="Data_Collection_for_Red_Hat_Enterprise_Linux_OpenStack_Platform"
remap="TID_25811">
<title>Data Collection for Red Hat Enterprise Linux OpenStack
Platform</title>
<para>
Before you can collect data from a Red Hat Enterprise Linux
OpenStack Platform (RHELOSP) provider, you must install Ceilometer and
configure it to accept queries from external systems.
</para>
<para>
These instructions require a Red Hat Enterprise Linux 6.4 @ base
installation of RHELOSP and registration to a satellite that has access
to both the RHELOSP and RHEL Server Optional channels.
</para>
<procedure>
<title>To Install and Configure Ceilometer for Data
Collection</title>
<note>
<para>
Perform all steps on your RHELOSP system.
</para>
</note>
<step>
<para>
Add the required channels and update your system:
<screen># rhn-channel --add -c rhel-x86_64-server-6-ost-3 -c rhelx86_64-server-optional-6
# yum update -y
# reboot</screen>
</para>
</step>
<step>
<para>
Install Ceilometer:
<screen># yum install *ceilometer*</screen>
</para>
</step>
<step>
<para>
Install and start the MongoDB store:
<screen># yum install mongodb-server
# sed -i '/--smallfiles/!s/OPTIONS=\"/OPTIONS=\"--smallfiles /'
/etc/sysconfig/mongod
164
Chapt er 7 . Compiler O ut put
# service mongod start</screen>
</para>
</step>
<step>
<para>
Create the following users and roles:
<screen># SERVICE_TENANT=$(keystone tenant-list | grep services |
awk '{print $2}')
# ADMIN_ROLE=$(keystone role-list | grep ' admin ' | awk '{print $2}')
# SERVICE_PASSWORD=servicepass
# CEILOMETER_USER=$(keystone user-create --name=ceilometer \
--pass="$SERVICE_PASSWORD" \
--tenant_id $SERVICE_TENANT \
--email=ceilometer@ example.com | awk '/ id / {print $4}')
# RESELLER_ROLE=$(keystone role-create --name=ResellerAdmin | awk '/ id
/ {print $4}')
# ADMIN_ROLE=$(keystone role-list | awk '/ admin / {print $2}')
# for role in $RESELLER_ROLE $ADMIN_ROLE ; do
keystone user-role-add --tenant_id $SERVICE_TENANT \
--user_id $CEILOMETER_USER --role_id $role
done</screen>
</para>
</step>
<step>
<para>
Configure the authtoken in <filename>ceilometer.conf</filename>:
<screen># openstack-config --set /etc/ceilometer/ceilometer.conf
keystone_authtoken auth_host 127.0.0.1
# openstack-config --set /etc/ceilometer/ceilometer.conf
keystone_authtoken auth_port 35357
# openstack-config --set /etc/ceilometer/ceilometer.conf
keystone_authtoken auth_protocol http
# openstack-config --set /etc/ceilometer/ceilometer.conf
keystone_authtoken admin_tenant_name services
# openstack-config --set /etc/ceilometer/ceilometer.conf
keystone_authtoken admin_user ceilometer
# openstack-config --set /etc/ceilometer/ceilometer.conf
keystone_authtoken admin_password $SERVICE_PASSWORD</screen>
</para>
</step>
<step>
<para>
Configure the user credentials in
<filename>ceilometer.conf</filename>:
<screen># openstack-config --set /etc/ceilometer/ceilometer.conf
DEFAULT os_auth_url http://127.0.0.1:35357/v2.0
# openstack-config --set /etc/ceilometer/ceilometer.conf DEFAULT
os_tenant_name services
# openstack-config --set /etc/ceilometer/ceilometer.conf DEFAULT
os_password $SERVICE_PASSWORD
# openstack-config --set /etc/ceilometer/ceilometer.conf DEFAULT
os_username ceilometer</screen>
</para>
</step>
<step>
<para>
165
Red Hat CloudForms 3.0 Management Engine 5.2 Insight G uide
Start the Ceilometer services:
<screen># for svc in compute central collector api ; do
service openstack-ceilometer-$svc start
done</screen>
</para>
</step>
<step>
<para>
Register an endpoint with the service catalog. Replace
<replaceable>$EXTERNALIFACE</replaceable> with the IP address of your
external interface:
<screen># keystone service-create --name=ceilometer \
--type=metering --description="Ceilometer Service"
# CEILOMETER_SERVICE=$(keystone service-list | awk '/ceilometer/
{print $2}')
# keystone endpoint-create \
--region RegionOne \
--service_id $CEILOMETER_SERVICE \
--publicurl "http://$EXTERNALIFACE:8777/" \
--adminurl "http://$EXTERNALIFACE:8777/" \
--internalurl "http://localhost:8777/"</screen>
</para>
</step>
<step>
<para>
Enable access to Ceilometer from external systems:
<screen># iptables -I INPUT -p tcp -m multiport --dports 8777 -m
comment --comment "001 ceilometer incoming" -j ACCEPT
# iptables save</screen>
</para>
</step>
<step>
<para>
Confirm the status of OpenStack and the Ceilometer services:
<screen># openstack-status
# for svc in compute central collector api ; do
service openstack-ceilometer-$svc status
done</screen>
</para>
</step>
<step>
<para>
Verify Ceilometer is working correctly by authenticating as a user
with instances running, for example <literal>admin</literal>. Pipe the
sample for the cpu meter to count lines and confirm that the value
changes according to the interval specified in
<filename>/etc/ceilometer/pipeline.yaml</filename>. The default
interval is 600 seconds.
</para>
<screen># . ~/keystonerc_admin
# ceilometer sample-list -m cpu |wc -l</screen>
</step>
<step>
<para>
Add the configured OpenStack provider to CloudForms Management
Engine. See <!-- Inject: 21494 -->. After adding the provider,
166
Chapt er 7 . Compiler O ut put
capacity and utilization data for your instances populate in a few
minutes.
</para>
</step>
</procedure>
</section>
ERROR: Topic has referenced Topic/Level(s) 21494 in a custom injection point that was not
included this book.
T o p ic ID 15227
INFO: D iscovering Providers
INFO: Topic URL
ERROR: Topic has referenced Topic/Level(s) 42002,41931 in a custom injection point that was
not included this book.
ERROR: This topic has invalid Injection Points. The processed XML is
<section id="Discovering_Multiple_Management_Systems"
remap="TID_15227">
<title>Discovering Providers</title>
<para>
Add providers to the CloudForms Management Engine environment by
discovering them based on their IP addresses. This procedure
demonstrates discovering Red Hat Enterprise Virtualization Manager
providers. Providers must be running in order for the appliance to
discover them.
</para>
<procedure>
<title>To Discover Providers by Subnet Range</title>
<step>
<para>
Navigate to <menuchoice><guimenu>Infrastructure</guimenu>
<guisubmenu>Providers</guisubmenu></menuchoice>.
</para>
</step>
<step>
<para>
Click
<inlinemediaobject>
<imageobject>
<imagedata fileref="images/1847.png" />
</imageobject>
</inlinemediaobject> <guibutton>Configuration</guibutton>, then
click
<inlinemediaobject>
<imageobject>
<imagedata fileref="images/2119.png" />
</imageobject>
</inlinemediaobject> <guibutton>Discover Infrastructure
Providers</guibutton>.
</para>
167
Red Hat CloudForms 3.0 Management Engine 5.2 Insight G uide
</step>
<step>
<para>
Select the types of provider to discover.
</para>
<mediaobject>
<imageobject>
<imagedata align="center" fileref="images/2195.png" />
</imageobject>
</mediaobject>
<itemizedlist>
<listitem>
<para>
To authenticate to Red Hat Enterprise Virtualization hosts see
<!-- Inject: 42002 -->.
</para>
</listitem>
<listitem>
<para>
To authenticate to VMware vCenter hosts see <!-- Inject: 34453 ->.
</para>
</listitem>
<listitem>
<para>
To authenticate to Microsoft SCVMM see <!-- Inject: 41931 -->.
<footnote>
<para>
Support for Microsoft SCVMM is in Technical Preview. See
<ulink
url="https://access.redhat.com/support/offerings/techpreview/">Technolo
gy Preview Features Support Scope</ulink>.
</para>
</footnote>
</para>
</listitem>
</itemizedlist>
</step>
<step>
<para>
Enter a <guilabel>Subnet Range</guilabel> of IP addresses starting
with a <guilabel>From Address</guilabel> and ending with a
<guilabel>To Address</guilabel>. The cursor automatically advances as
you complete each octet.
</para>
<mediaobject>
<imageobject>
<imagedata align="center" fileref="images/2196.png" />
</imageobject>
</mediaobject>
</step>
<step>
<para>
Click <guilabel>Start</guilabel> to begin the discovery process.
</para>
</step>
168
Compiler G lossary
</procedure>
<formalpara>
<title>Result:</title>
<para>
The server searches for computers running supported providers. When
available, the new providers display. These providers are named using
a Hostname and IP address. To make them identifiable, edit the basic
information for each provider.
</para>
</formalpara>
</section>
Compiler Glossary
"... is p o ssib ly an in valid cu st o m In ject io n Po in t ."
The XML comment mentioned has been identified as a possible custom Injection Point,
that is incorrectly referenced.
To fix this error please ensure that the type is valid, a colon is used to separate the ID s
from the type and only topic ID s are used in the ID list.
"T h is t o p ic co n t ain s an in valid elemen t t h at can ' t b e co n vert ed in t o a D O M
Elemen t ."
The topic XML contains invalid elements that cannot be successfully converted in D OM
elements.
To fix this error please remove or correct any invalid XML elements or entities.
"T h is t o p ic d o esn ' t h ave well- f o rmed xml."
The topic XML is not well-formed XML and maybe missing opening or closing element
statements.
To fix this error please ensure that all XML elements having an opening and closing
statement and all XML reserved characters are represented as XML entities.
"T h is t o p ic h as in valid D o cB o o k XML."
The topic XML is not valid against the D ocBook specification.
To fix this error please ensure that all XML elements are valid D ocBook elements . Also
check to ensure all XML sub elements are valid for the root XML element.
"T h is t o p ic h as in valid In ject io n Po in t s."
The topic XML contains Injection Points that cannot be resolved into links.
To fix this error please ensure that all the topics referred to by Injection Points are
included in the build and/or have adequate relationships.
"T h is t o p ic h as n o XML d at a"
The topic doesn't have any XML Content to display.
169
Red Hat CloudForms 3.0 Management Engine 5.2 Insight G uide
To fix this warning, open the topic URL and add some content.
170
Revision Hist ory
Revision History
R evisio n 1.4 - 0
Wed Feb 4 2015
C lo u d Fo rms D o cs T eam
Update product name to Red Hat CloudForms
BZ # 1128944 - Move " Adding D atabase Credentials for D ata Collection" section
R evisio n 1.3- 0
Fri Ju ly 25 2014
B rian Mo ss
BZ # 1049843 - Update SmartState Analysis requirements for RHEV 3.x
BZ # 1095338- Added note in section 4.1.1 about Pre-reqs for OpenStack provider.
BZ #1077438 - Modified heading style for consistency
BZ #1084069 - Created new topic 3.1.3. Authenticating VMware vCenter Hosts
Made QE changes as per Bug 1030778 - Add About this Guide sections
BZ #1067250 - Corrected C and U charts for cloud instances
BZ #1078939 - Provider icons updated as they appear in the CFME UI
BZ #1012750 - Restructured topics and eliminated duplication
BZ #1062003 - Updated Reportable Fields in CFME
R evisio n 1.2- 0
T h u May 1 2014
B rian Mo ss
CloudForms 3.0.2 (CFME 5.2.2) release
BZ #1050951 - Update description of SmartProxy in Terminology section
BZ #1064915 - Update chargeback report creation procedure
BZ 1051600 - Add note to run pvscan or restart appliance to detect D irectLUN disk
BZ 1048363 - Update VMware VD D K to version 5.5
BZ 1033236 - D ocument Ceilometer configuration for use with CloudForms
BZ 1034971 - Add warning to configure iptables for CloudForms access to OpenStack hosts
BZ 1025929 - Amazon does not provide events hence no support for timelines
Adding new Author Group file
R evisio n 1.1- 0
Mo n O ct 14 2013
D an Macp h erso n
Rogue instance of Virtual Intelligence found
Implemented QE Review for BZ #1009624, BZ #1012081, BZ #1012229, BZ #1012749, BZ #1005847,
BZ #1016051, BZ #1016030, BZ #1014504, BZ #1014541, BZ #1014539, BZ #1014538, BZ #1014536,
BZ #1014551, BZ #1012236
Updating Product and Component for Feedback page
New methods added to the Settings and Ops Guide
D efault password added to Quick Start Guide
Revision of some provisioning sections
R evisio n 1.0- 0
Creation of first draft
Fri Au g 23 2013
D an Macp h erso n
171