1
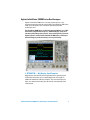
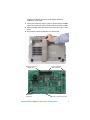
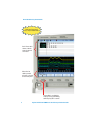
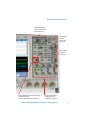
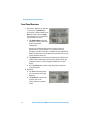
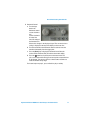
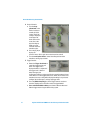
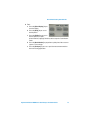
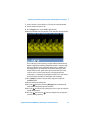
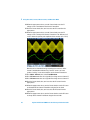
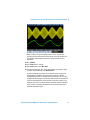
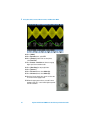
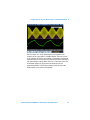
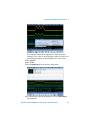
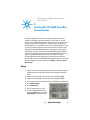
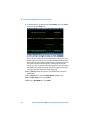
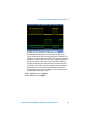
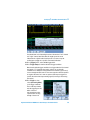
Agilent InfiniiVision 7000B Series Oscilloscopes Evaluation Guide Notices © Agilent Technologies, Inc. 2008-2009 No part of this manual may be reproduced in any form or by any means (including electronic storage and retrieval or translation into a foreign language) without prior agreement and written consent from Agilent Technologies, Inc. as governed by United States and international copyright laws. Manual Part Number N2918-97004 Edition First edition, November 2009 Printed in U.S.A. Agilent Technologies, Inc. 1900 Garden of the Gods Rd. Colorado Springs, CO 80907 USA Warranty The material contained in this document is provided “as is,” and is subject to being changed, without notice, in future editions. Further, to the maximum extent permitted by applicable law, Agilent disclaims all warranties, either express or implied, with regard to this manual and any information contained herein, including but not limited to the implied warranties of merchantability and fitness for a particular purpose. Agilent shall not be liable for errors or for incidental or consequential damages in connection with the furnishing, use, or performance of this document or of any information contained herein. Should Agilent and the user have a separate written agreement with warranty terms covering the material in this document that conflict with these terms, the warranty terms in the separate agreement shall control. ject to Agilent Technologies’ standard commercial license terms, and non-DOD Departments and Agencies of the U.S. Government will receive no greater than Restricted Rights as defined in FAR 52.227-19(c)(1-2) (June 1987). U.S. Government users will receive no greater than Limited Rights as defined in FAR 52.227-14 (June 1987) or DFAR 252.227-7015 (b)(2) (November 1995), as applicable in any technical data. Safety Notices CAU TI O N A CAUTION notice denotes a hazard. It calls attention to an operating procedure, practice, or the like that, if not correctly performed or adhered to, could result in damage to the product or loss of important data. Do not proceed beyond a CAUTION notice until the indicated conditions are fully understood and met. Technology Licenses The hardware and/or software described in this document are furnished under a license and may be used or copied only in accordance with the terms of such license. Restricted Rights Legend If software is for use in the performance of a U.S. Government prime contract or subcontract, Software is delivered and licensed as “Commercial computer software” as defined in DFAR 252.227-7014 (June 1995), or as a “commercial item” as defined in FAR 2.101(a) or as “Restricted computer software” as defined in FAR 52.227-19 (June 1987) or any equivalent agency regulation or contract clause. Use, duplication or disclosure of Software is sub- 2 WA RN ING A WARNING notice denotes a hazard. It calls attention to an operating procedure, practice, or the like that, if not correctly performed or adhered to, could result in personal injury or death. Do not proceed beyond a WARNING notice until the indicated conditions are fully understood and met. Agilent InfiniiVision 7000B Series Oscilloscopes Agilent’s InfiniiVision 7000 Series is the only oscilloscope in its class engineered to provide maximum signal visibility. The InfiniiVision 7000 Series shows jitter, infrequent events, and subtle signal detail that other oscilloscopes miss. The InfiniiVision 7000B Series oscilloscopes offer bandwidths up to 1 GHz. Each model, equipped with a large 12.1’’ XGA LCD display, comes in an extremely quiet package that is just 6.5’’ deep and weighs only 13 pounds. Agilent engineers architected the InfiniiVision 7000 Series oscilloscopes with technology to provide the industry’s best signal visibility. 1. ATTRACTIVE — Big Display. Small Footprint. Bigger displays have become increasingly important as general purpose oscilloscopes need more space to display digital and serial signals in addition to traditional oscilloscope channels. The increased display size helps users who need to display up to 20 channels simultaneously with serial protocol. Agilent InfiniiVision 7000B Series Oscilloscopes Evaluation Guide 3 2. FAST — 100,000 Waveforms Per Second. Have you turned your oscilloscope’s deep memory on only to have the controls become sluggish and unresponsive? If so, you’ve experienced the impact of architecture on performance. While it may be annoying to wait for new settings to take effect on your oscilloscope, this same architecture limitation has a more significant impact. While processing and drawing waveforms the oscilloscope is blind to target signal changes. Infrequent anomalies and critical signal detail are likely to be missed. Patented MegaZoom III technology provides up to 100,000 waveforms (acquisitions) per second with responsive deep memory always available. See a display more representative of the actual signals under test than with any other oscilloscope. Turn knobs and the instrument responds instantly and effortlessly. Decoding serial packets? Unlike other oscilloscopes that become less responsive and are blind to target signal changes while employing software-based serial decode, Agilent’s hardware-accelerated decode allows the product to stay responsive and does not compromise update rate. 3. SMART — Insightful Applications. Upgrade your general purpose oscilloscope with a wide range of application packages provide meaningful insight into application-specific problems. These include: • Mask Testing. • Segmented memory. • Serial triggering with hardware-accelerated decode for: I2C, SPI, RS-232/UART, CAN, LIN, FlexRay , I2S, and MIL-STD 1553. • Core-assisted FPGA debug for Altera and Xilinx devices. • PC-based offline analysis of previously acquired DSO/MSO data. • Power measurements. Demo Equipment and Set Up Required Equipment • Agilent InfiniiVison 7000B Series oscilloscope. • Two passive probes. • Demo kit with demo board, USB cable, and MSO Demo board cable. Demo Board Set Up 1 To power the demo board, connect the oscilloscope’s MSO cable to the demo board’s 40-pin connector. You can also power the demo board by 4 Agilent InfiniiVision 7000B Series Oscilloscopes Evaluation Guide connecting a USB cable between it and the Agilent InfiniiVison 7000B Series oscilloscope. 2 Connect the oscilloscope channel 1 probe to demo board CH1 and GND. Connect the oscilloscope channel 2 probe to demo board CH2 and GND. 3 Connect the MSO ribbon cable to the back of the oscilloscope as shown below. 4 Plug the other end into the demo board as shown below. MSO Cable Connection (Digital Inputs) MODE Action Select Knob Power is provided via MSO or USB cable. Oscilloscope Probe Connections Agilent InfiniiVision 7000B Series Oscilloscopes Evaluation Guide 5 In This Guide If you are experiencing the InfiniiVision 7000 Series oscilloscope for the first time, begin with Demo Board Getting Started Guide. If you have a basic knowledge of the InfiniiVision 7000 Series oscilloscope’s front-panel controls, begin with Lab 1. Topic Page Time Allowance Demo Board Getting Started Guide 7 10 min. Lab 1: Capturing and Viewing Complex Signals with MegaZoom Technology 14 10 min. Lab 2: Using Auto Scale, Cursors, Measurements, and Waveform Math 18 10 min. Lab 3: Discovering an Infrequent Glitch with Fast Waveform Update Rates 24 10 min. Lab 4: Using Pass/Fail Mask Testing to Discover a Signal Violation 27 10 min. Lab 5: Viewing Multiple Signals in an MCU-based Design with an MSO 30 10 min. Lab 6: Verifying I2C Serial Bus Communication 34 10 min. Lab 7: Verifying SPI Serial Bus Communication 39 10 min. Lab 8: Verifying RS-232/UART Serial Bus Communication 43 10 min. Lab 9: Verifying CAN Serial Bus Communication 48 10 min. Lab 10: Verifying LIN Serial Bus Communication 54 10 min. Lab 11: Verifying I2S Serial Bus Communication 58 10 min. Lab 12: Using Segmented Memory Acquisition to Capture More Data 61 10 min. Lab 13: Using Serial Search and Navigation 67 10 min. Appendix A: Using Trigger Holdoff to Synchronize Acquisitions/Display on Complex Signals 71 10 min. Conventions In this guide’s desscriptions: 6 • Front panel keys are in brackets and bold, for example [Run/Stop]. • Softkeys and selected values are in bold, for example Settings and D15. • Knobs are described by name/function, for example “Trigger Level knob”. Agilent InfiniiVision 7000B Series Oscilloscopes Evaluation Guide Agilent InfiniiVision 7000B Series Oscilloscopes Evaluation Guide Demo Board Getting Started Guide If you are not familiar with the Agilent InfiniiVision 7000B Series oscilloscopes, please first look over the main sections of the front panel as illustrated in this guide. 7 Demo Board Getting Started Guide Dedicated front panel keys and pushable knobs Serial Lister table shows a tabular view of captured serial data Menu line for softkey control of menus selected on the front panel Instant Help is available by simply pressing and holding down any key for 2 seconds 8 Agilent InfiniiVision 7000B Series Oscilloscopes Evaluation Guide Demo Board Getting Started Guide Horizontal controls Search and Navigate data record keys Run control, default setup, and autoscale Serial, digital, and math menu keys Selection knob, immediate action keys, and special menus Push the knob to make a selection Vertical color-coded controls for each oscilloscope channel Agilent InfiniiVision 7000B Series Oscilloscopes Evaluation Guide 9 Demo Board Getting Started Guide Front Panel Overview 1 Run Control - When the oscilloscope is turned on, or if [AutoScale] is pressed, the acquisition will be set to [Run]. At any time you may [Stop] the acquisition process to examine a signal in detail or to save it. a The [Default Setup] key on the front panel sets the oscilloscope to the factory default configuration. Because the oscilloscope may have been used in a variety of applications by a variety of people, it is a good measurement procedure to put the oscilloscope in a known starting mode (Default Setup). This will make it easy to duplicate measurements because no special conditions will be set. b The [Autoscale] key on the front panel automatically configures the oscilloscope by analyzing all active channels, turning them on and setting the time base, V/div, and trigger conditions for an initial display. c Press the [Single] key to make a single acquisition and stop the acquisition process 2 Waveform: a The Waveform Intensity knob lets you set the desired signal brightness. b The [Acquire] key on the front panel lets you set the oscilloscope data acquisition modes. 10 Agilent InfiniiVision 7000B Series Oscilloscopes Evaluation Guide Demo Board Getting Started Guide 3 Horizontal Control: a Turn the large knob in the Horizontal control section clockwise and counter-clockwise to control the time/div setting of the horizontal axis. Observe the changes in the displayed signal. The current time base setting is displayed at the top of the display on the status line. b Turn the small knob in the horizontal control section to move the waveform horizontally from the trigger point. c Press the [Horiz] key to display the Horizontal menu. Note the various modes of Normal, Roll, XY and the zoom mode softkey. d Press the zoom key to quickly turn on the zoom mode. This split-screen mode shows the big picture on top and an expanded view on the bottom. Turn the large time base knob counter clockwise to make the window on top larger. For instant help on any topic, press and hold any key or softkey. Agilent InfiniiVision 7000B Series Oscilloscopes Evaluation Guide 11 Demo Board Getting Started Guide 4 Vertical Controls: a Turn the large yellow knob in the Vertical section to control the V/div setting. The V/div setting is displayed in the upper left hand corner of the status line at the top of the display. Knobs are color coded to match the waveform color. b Press the [1] key to display the channel 1 menu. Press again to turn the channel on and off. c Turn the small yellow knob to control the offset position of the waveform, moving it up or down. 5 Trigger Controls: a Rotate the Trigger Level knob to move the trigger level up and down. The trigger level is displayed while it is adjusted. If the trigger level is above or below the signal, the oscilloscope will force a trigger and display a waveform when in Auto mode. Auto is a useful trigger mode to use, when unsure of the exact waveform, because activity will be displayed making it easy to better configure the oscilloscope’s settings and trigger level. b Press the [Mode/Coupling] key in the Trigger controls section to view the coupling menu selections and to set trigger holdoff. c Press and hold the Mode softkey to read more about the Auto and Normal trigger mode using the built-in help system. 12 Agilent InfiniiVision 7000B Series Oscilloscopes Evaluation Guide Demo Board Getting Started Guide 6 Tools: a Press the [Clear Display] key to clear the display. b Press the [Help] key to access the help menu. c Press the [Utility] key to access the file explorer, I/O ports, printer interface, language selection, and to set up the “Quick Action” mode. d Press the [Quick Action] key to perform a quick print of the screen or capture a screen image. e Press the [Analyze] key to access precision measurement mode or the mask testing application. Agilent InfiniiVision 7000B Series Oscilloscopes Evaluation Guide 13 Agilent InfiniiVision 7000B Series Oscilloscopes Evaluation Guide 1 Capturing and Viewing Complex Signals with MegaZoom Technology Viewing deep memory acquisitions on oscilloscopes often result in slow waveform update rates. Agilent’s MegaZoom technology automatically turns on deep memory when needed to maximize resolution, while also maintaining responsive waveform update rates. In addition, Agilent’s MegaZoom technology provides the highest waveform display resolution in the industry with up to 256 levels of intensity to show subtle waveform details. In this lab, we will capture a complex video waveform. We will then use various techniques to zoom-in and analyze the deep memory acquisition results. Setup 1 Connect the demo kit’s 40-pin ribbon cable from the back of the Agilent InfiniiVision Series oscilloscope to the 40-pin connector on the demo board. 2 Connect channel 1 probe to the CH1 test point and ground (GND). 3 Connect channel 2 probe to the CH2 test point and ground (GND). 4 Set the rotary switch on the demo board for the Video signal (Mode #0). 5 Press [Default Setup]. The oscilloscope is now set in the factory default configuration – just as it left the factory. Because the oscilloscope may have been used in a variety of applications by a variety of people, it is a good practice to put the oscilloscope in a known beginning setup state (Default Setup). This will make it easier to duplicate measurements for our labs because no special conditions will be set. 6 Set the channel 1 vertical scale to 500 mV/div using the large yellow knob. 14 Capturing and Viewing Complex Signals with MegaZoom Technology 1 7 Set the channel 1 vertical offset to 1.5 V using the small yellow knob. 8 Set the timebase to 10.0 ms/div. 9 Press [Trigger]; then, select the TV triggering mode. 10 Push the Waveform Intensity knob to set the waveform intensity at 50%. The oscilloscope is now capturing a complex video waveform utilizing Agilent’s MegaZoom technology. MegaZoom provides responsive deep memory acquisitions for fast waveform update rates. In addition, this technology provides up to 256 levels of waveform intensity to show complex details of your signals. Wave your hand in front of the video camera’s lens to see the responsiveness of the display while the oscilloscope’s is repetitively capturing deep memory. Let’s now zoom-in on this waveform and analyze it with higher visual resolution. 11 Press [Single] to perform a deep memory, single-shot acquisition (8,000,000 points). 12 Set the timebase to 100.0 µs/div. 13 Press the forward key (near the [Navigate] key) to automatically scroll forward through the captured waveform. 14 Press the back key to stop scrolling; then, press it again to scroll back through the waveform. 15 Press the forward or the speed of scrolling/panning. back keys multiple times to adjust the Agilent InfiniiVision 7000B Series Oscilloscopes Evaluation Guide 15 1 Capturing and Viewing Complex Signals with MegaZoom Technology Note that, in addition to using the oscilloscope’s automatic navigation capability to scroll through a deep memory acquisition, you can also manually use the horizontal controls (time/div, delay, and “zoom mode”) to zoom-in on and scroll to particular parts of the captured waveform. Let’s now use the “Zoom” function to view the waveform while using two different timebase settings. 16 Press the stop key. 17 Push the horizontal delay/position knob to set the delay back to 0.0 sec. 18 Set the timebase back to 10.0 ms/div. 19 Press [Run/Stop] to begin repetitive acquisitions again. 20 Press the zoom key to view our waveform using two different timebase settings. 21 Set the “zoom” timebase to 1.0 ms/div using the large timebase control knob. 16 Agilent InfiniiVision 7000B Series Oscilloscopes Evaluation Guide Capturing and Viewing Complex Signals with MegaZoom Technology 1 22 Adjust the horizontal position/delay knob to view different parts of our waveform with higher resolution. Agilent InfiniiVision 7000B Series Oscilloscopes Evaluation Guide 17 Agilent InfiniiVision 7000B Series Oscilloscopes Evaluation Guide 2 Using Auto Scale, Cursors, Measurements, and Waveform Math In this lab, we use some of the automatic set up and measurement capabilities of the Agilent InfiniiVision Series oscilloscope including Auto Scale, cursor measurements, automatic parametric measurements, and waveform math functions. Setup 1 Connect the demo kit’s 40-pin ribbon cable from the back of the Agilent InfiniiVision Series oscilloscope to the 40-pin connector on the demo board. 2 Connect channel 1 probe to the CH1 test point and ground (GND). 3 Connect channel 2 probe to the CH2 test point and ground (GND). 4 Set the rotary switch on the demo board for the AM signal (Mode #1). 5 Press [Default Setup]. 6 Press [Auto Scale]. 7 Push the Waveform Intensity knob to set the waveform intensity at 50%. 18 2 Using Auto Scale, Cursors, Measurements, and Waveform Math When [Auto Scale] is pressed, the oscilloscope automatically turns on and optimally scales (V/div) for all channels that have signal activity… including digital channels. Triggering is set to the standard “edge” mode on the highest analog channel number, which is channel 2 in this demo example. The timebase is set to display at least two cycles of the trigger source channel, which is based on channel 2 in this demo example. Let’s now manually rescale the channel 1 waveform, and then perform manual cursor measurements. 8 Set the channel 1 vertical scale to 500 mV/div and the vertical offset to 1.5 V (yellow knobs). 9 Push the Cursors knob; then, turn it to select the X1 cursor from the popup menu. 10 When the popup menu closes, turn the Cursors knob to set the X1 timing cursor near one of the peaks of the channel 1 modulated waveform. 11 Push the Cursors knob; then, turn it to select the X2 cursor from the popup menu. 12 When the popup menu closes, turn the Cursors knob to set the X2 timing cursor near the next peak of the channel 1 modulated waveform. The difference in X cursors shows the time between peaks of the envelope (X = 220.0 µs). 13 Push the Cursors knob; then, turn it to select the Y1 cursor from the popup menu. Agilent InfiniiVision 7000B Series Oscilloscopes Evaluation Guide 19 2 Using Auto Scale, Cursors, Measurements, and Waveform Math 14 When the popup menu closes, turn the Cursors knob to set the Y1 voltage cursor at the bottom of the channel 1 waveform. 15 Push the Cursors knob; then, turn it to select the Y2 cursor from the popup menu. 16 When the popup menu closes, turn the Cursors knob to set the Y2 voltage cursor at the top of the channel 1 waveform. The difference in Y cursors shows the peak-to-peak amplitude of the envelope (Y = 2.0 V). Now that we’ve determined timing and voltage characteristics of the channel 1 modulated waveform using “manual” cursors, let’s now perform “tracking” cursor measurements on the channel 2 waveform. 17 Press Mode – Manual; then, select Track Waveform. 18 Press X1 Source two times to assign the X1 tracking cursor to channel 2. 19 Press X2 Source two times to assign the X2 tracking cursor to channel 2. 20 Push the Cursors knob; then, turn it to select the X1 cursor from the popup menu. 21 When the popup menu closes, turn the Cursors knob to set the X1 cursor at the bottom of the channel 2 waveform using the Cursors knob. 22 Push the Cursors knob; then, turn it to select the X2 cursor from the popup menu. 23 When the popup menu closes, turn the Cursors knob to set the X2 cursor at the top of the channel 2 waveform using the Cursors knob. 20 Agilent InfiniiVision 7000B Series Oscilloscopes Evaluation Guide Using Auto Scale, Cursors, Measurements, and Waveform Math 2 With “tracking” cursors, the voltage cursors “track” the selected waveform based on the position of the timing cursor (X1 and X2). Let’s now perform some automatic parametric measurements on these waveforms. 24 Press [Meas]. 25 Press Source; then, select 2. 26 Press Select; then, select Rise Time. 27 To begin executing the “Rise Time” measurement on channel 2, either push the selection knob or press Measure Rise. Up to four automatic parametric measurements can be selected and displayed with a complete set of measurement statistics. Default threshold levels for the rise and fall time measurements are set at 10% and 90%. All other timing measurements utilize the 50% threshold levels. If desired, threshold levels can be manually set to other relative (%) or absolute values (V). Let’s now perform a waveform math function (FFT) on the channel 1 waveform to determine the carrier frequency of this amplitude-modulated signal. Agilent InfiniiVision 7000B Series Oscilloscopes Evaluation Guide 21 2 Using Auto Scale, Cursors, Measurements, and Waveform Math 28 Press [Math]. 29 Press Operator; then, select FFT. 30 Press [Analyze] (in the Tools section); then, select Precision. 31 Press Feature – Precision two times to engage higher precision waveform math. 32 Press [Run/Stop] to stop acquisitions. 33 Press [Cursors]. 34 Press X1 Source; then, select Math: f(t). 35 Press X2 Source; then, select Math: f(t). 36 Push the Cursors knob; then, turn it to select the X1 cursor from the popup menu. 37 When the popup menu closes, turn the Cursors knob to set the “X1” cursor on the highest peak of the FFT waveform. 22 Agilent InfiniiVision 7000B Series Oscilloscopes Evaluation Guide Using Auto Scale, Cursors, Measurements, and Waveform Math 2 The value of the “X1” cursor should now be measuring the carrier frequency of this signal, which is 2.0 MHz. Without “Precision” turned on, all automatic parametric measurements and waveform math provide approximately 0.1% measurement resolution based on the oscilloscope’s full-screen timebase setting. When “Precision” is turned on, at the cost of waveform update rate, measurement resolution increases to approximately 0.001%. The FFT measurement, which we used in this demonstration, is the slowest math function. Agilent InfiniiVision 7000B Series Oscilloscopes Evaluation Guide 23 Agilent InfiniiVision 7000B Series Oscilloscopes Evaluation Guide 3 Discovering an Infrequent Glitch with Fast Waveform Update Rates Capturing infrequent anomalies such as random glitches requires oscilloscopes with extremely fast update rates. Fast update rates improve the probability of capturing random events. This lab demonstrates capturing a glitch that occurs approximately one time every 30,000 cycles of a digital data stream. With up to 100,000 waveforms/sec update rate, we will be able to view this glitch multiple times a second. Oscilloscopes with longer dead times will have difficulty capturing and displaying this glitch. Setup 1 Connect the demo kit’s 40-pin ribbon cable from the back of the Agilent InfiniiVision Series oscilloscope to the 40-pin connector on the demo board. 2 Connect channel 1 probe to the CH1 test point and ground (GND). 3 Connect channel 2 probe to the CH2 test point and ground (GND). 4 Set the rotary switch on the demo board for the Data w/ Glitch signal (Mode #2). 5 Press [Default Setup]. 6 Press [Auto Scale]. 7 Change the timebase to 100 ns/div. 8 Adjust the Waveform Intensity knob to 100% to more clearly see the infrequent glitch on channel 1 (yellow trace). Note that the glitch is captured multiple times per second, thanks to Agilent’s MegaZoom technology which minimizes dead time between acquisitions. Fast waveform update rates can even be achieved when digital channels are turned as demonstrated in this example. 9 To permanently capture the infrequent glitch, press [Display]; then, press Persist. 24 Discovering an Infrequent Glitch with Fast Waveform Update Rates 3 With the infinite persistence mode, all repetitive and “historical” acquisitions are accumulated and displayed on screen. This can be very useful when setting up an overnight measurement to capture an elusive event. Let’s now set up a glitch trigger condition that will trigger exclusively on the anomaly. 10 Press [Display]; then, press Persist to turn off the infinite persistence display mode. 11 Press Clear Display to clear previous acquisitions. 12 Press [Trigger]; then, select the Pulse Width trigger mode. Agilent InfiniiVision 7000B Series Oscilloscopes Evaluation Guide 25 3 Discovering an Infrequent Glitch with Fast Waveform Update Rates 13 Next, press Source; then, select channel 1 as the input trigger source. 26 Agilent InfiniiVision 7000B Series Oscilloscopes Evaluation Guide Agilent InfiniiVision 7000B Series Oscilloscopes Evaluation Guide 4 Using Pass/Fail Mask Testing to Discover a Signal Violation With mask testing you can set up a pass/fail test criteria for automatically testing waveforms to see if they conform to specific wave shapes. In this lab we will test a digital signal that includes an infrequent glitch. With InfiniiVision’s hardware-based mask testing capability, we will be able to test up to 100,000 waveforms per second and gain insight into the statistical occurrences of this particular glitch. To enable Mask Testing, your oscilloscope must have the mask test option (Option LMT) installed. You can verify the installed options on your oscilloscope at [Utility] > Service > About Oscilloscope. Setup 1 Connect the demo kit’s 40-pin ribbon cable from the back of the Agilent InfiniiVision Series oscilloscope to the 40-pin connector on the demo board. 2 Connect channel 1 probe to the CH1 test point and ground (GND). 3 Connect channel 2 probe to the CH2 test point and ground (GND). 4 Set the rotary switch on the demo board for the Data w/ Glitch signal (Mode #2). 5 Press [Default Setup]. 6 Set the channel 1 vertical scale to 500 mV/div and the vertical offset to 1.0 V. 7 Push the Trigger Level knob to set the trigger level at 50%. 8 Set the timebase to 20 ns/div. 9 Set the waveform intensity to 100% using the Waveform Intensity knob (full clockwise). 10 Press [Analyze]. 11 Press Features Mask two times to turn on mask testing. 12 Press Automask. 27 4 Using Pass/Fail Mask Testing to Discover a Signal Violation 13 Press Create Mask to automatically create a pass/fail mask around this waveform. Because the InfiniiVision oscilloscope’s mask testing capability is hardware-based, it can test up to 100,000 waveforms/sec and provide detailed pass/fail statistics including failure rate in terms of both percent and a Sigma quality factor. A Sigma quality factor of 6 relates to approximately three or fewer defects per million tested. Let’s now set up the oscilloscope to stop on the first failure. 14 Press [Run/Stop] to stop acquisitions. 15 Press the Back back/up key. 16 Press Statistics. 17 Press Reset Statistics to clear the statistics from the previous test. 18 Press the Back back/up key. 19 Press Setup. 20 Press On Error – Stop two times. 21 Press [Clear Display]. 22 Press [Run/Stop] to begin a new “Stop-on-Error” test. 28 Agilent InfiniiVision 7000B Series Oscilloscopes Evaluation Guide Using Pass/Fail Mask Testing to Discover a Signal Violation 4 In addition to stopping acquisitions when an error is detected, you can also save a waveform, save an image, print, or perform a specific measure when an error is detected. Using the “Run Until” selection, you can also set up mask testing to run for a specific number of tests, minimum time, or minimum Sigma test criteria. Note that in addition to creating a pass/fail mask using the auto-mask creation feature as demonstrated in this lab, you can also import a mask based on industry specifications, such as an eye-diagram mask, from a USB memory device. These types of imported masks can be easily created within a standard text editor, such as NotePad, on your PC. Agilent InfiniiVision 7000B Series Oscilloscopes Evaluation Guide 29 Agilent InfiniiVision 7000B Series Oscilloscopes Evaluation Guide 5 Viewing Multiple Signals in an MCU-based Design with an MSO In mixed analog and digital designs, it is often important to view multiple analog and digital channels, which is significantly beyond the capability of a typical 2- or 4-channel oscilloscope. With 2 or 4 oscilloscope channels plus 16 logic timing channels, the unique Mixed Signal Oscilloscope (MSO) affords the opportunity to view more signals and to make time-correlated measurements across all channels. Setup 1 Connect the demo kit’s 40-pin ribbon cable from the back of the Agilent InfiniiVision Series oscilloscope to the 40-pin connector on the demo board. 2 Connect channel 1 probe to the CH1 test point and ground (GND). 3 Connect channel 2 probe to the CH2 test point and ground (GND). 4 Set the rotary switch on the demo board for the DAC signal (Mode #4). 5 Press [Default Setup]. 6 Press [Auto Scale]. 7 Push the Waveform Intensity knob to automatically set the waveform intensity to 50%. 30 Viewing Multiple Signals in an MCU-based Design with an MSO 5 The channel 2 signal (green trace) shows the stair-step sine wave output of microcontroller-based Digital-to-Analog Converter (DAC). The channel 1 signal (yellow trace) is a low-pass filtered version of the DAC output. Channels D0 – D7 (blue, red) are the digital inputs to the DAC. Using Auto Scale, the oscilloscope triggers on channel 2, which in this example is a repetitive sine wave. However, what if we wanted to trigger on a specific DAC input value using pattern trigger? 8 Press [Digital]. 9 Press Bus. 10 Press Bus-Bus1 two times to turn on the bus display mode. This will display an overlay of digital channels D0 through D7. 11 Set the timebase to 20 µs/div in order to read the state of this 8-bit bus. Note that when the DAC output, which is the channel 2 waveform (green trace), is at its highest level, Bus1 has a hex value of E6. Let’s now set up the oscilloscope to trigger on this condition. 12 Press [Trigger]. 13 Change the trigger mode to Pattern. 14 Press Channel; then, select Bus1. 15 Press Hex; then, select “E”. 16 Press Digit; then, select the “0” digit. 17 Press Hex ; then, select “6”. Agilent InfiniiVision 7000B Series Oscilloscopes Evaluation Guide 31 5 Viewing Multiple Signals in an MCU-based Design with an MSO The oscilloscope should now be triggering (trigger point at center-screen) on pattern E6 on Bus1 (D7-D0 = 1110 0110), which is coincident with the highest output level of the DAC. Triggering at this point using simple edge triggering on channel 2 would be virtually impossible. Let’s now set up the oscilloscope to trigger at the 50% output level of the DAC using pattern triggering. 18 Using the Digit and Hex softkeys along with the selection knob, change the B1 pattern to “80 hex” (1000 0000). 32 Agilent InfiniiVision 7000B Series Oscilloscopes Evaluation Guide Viewing Multiple Signals in an MCU-based Design with an MSO 5 Although the oscilloscope should be triggering on a stable pattern of “80h” on Bus1, you should be seeing two phases of the sine wave. This is because this particular pattern occurs both when the output of the DAC is increasing in value and decreasing in value. Let’s further qualify the trigger condition using mixed-signal triggering (analog + digital triggering) in order to trigger only when the DAC is increasing in value. 19 First, set the channel 1 vertical scale to 200 mV/div and the vertical offset to 1.6 V. 20 Next, press Channel B1; then, select 1. 21 Now, press Pattern X ; then, select “0” as the pattern on channel 1. The oscilloscope should now be triggering on pattern “80h” of B1 while channel 1 is low (or below its trigger level). Agilent InfiniiVision 7000B Series Oscilloscopes Evaluation Guide 33 Agilent InfiniiVision 7000B Series Oscilloscopes Evaluation Guide 6 Verifying I2C Serial Bus Communication Many of today’s embedded designs include serial bus communications using protocols such as I2C (Inter-Integrated Circuit). The I2C bus is primarily used for chip-to-chip communications. In this lab you will see that the I2C bus generates a series of commands to instruct the microcontroller to generate three specific chirps (or bursts) with a varying numbers of pulses. Our goal is to synchronize the oscilloscope’s display on specific chirps using the oscilloscope’s I2C trigger capabilities and verify the serial data transmissions. To enable I2C decoding, your oscilloscope must have the low-speed serial bus decode option (Option LSS) installed. You can verify the installed options on your oscilloscope at [Utility] > Service > About Oscilloscope. Setup 1 Connect the demo kit’s 40-pin ribbon cable from the back of the Agilent InfiniiVision Series oscilloscope to the 40-pin connector on the demo board. 2 Connect channel 1 probe to the CH1 test point and ground (GND). 3 Connect channel 2 probe to the CH2 test point and ground (GND). 4 Set the rotary switch on the demo board for the I2C signal (Mode #5). 5 Press [Default Setup]. 6 Press [Auto Scale]. 7 Set the timebase to 500 µs/div. 34 Verifying I2C Serial Bus Communication 6 Notice that the oscilloscope may trigger on multiple chirps of different lengths (1, 2, or 3 cycles) using standard edge triggering (default trigger mode after Auto Scale). To trigger on the first chirp that consists of three sine wave cycles, we can set up the I2C triggering of the oscilloscope to trigger on a Write cycle based on a specific address and serial data content. Digital signals D7-D0 are the digital inputs to the DAC generated by the MCU. D15 is the I2C clock signal (SCL) and D14 is the I2C data signal (SDA). Before we set up the trigger condition, we will first turn on I2C serial decoding. Note that although the I2C clock and data signals are being captured by the digital channels of the oscilloscope, I2C triggering and decoding on the oscilloscope can also utilize the analog channels as input sources for the clock and data signals. 8 Press [Serial]; then, select the I2C decode mode (default serial decode mode). 9 Press Settings; then, select D15 as the clock input source (SCL). 10 Next, press SDA; then, select D14 as the data input source (SDA). Agilent InfiniiVision 7000B Series Oscilloscopes Evaluation Guide 35 6 Verifying I2C Serial Bus Communication You should now be able to view the time-aligned serial decode trace at the bottom of the display showing I2C decoding of D14 (SDA). But the oscilloscope is not yet triggering on I2C. It is still triggering on an edge crossing of channel 2. Let’s now set up the oscilloscope to trigger on a Write operation to address 0x50hex with an Acknowledge, followed by a data value of 0x10hex. 11 Press [Trigger]; then, select the I2C trigger mode. 12 Now press Trigger:Start; then, select o Frame(Start:Addr7:Write:Ack:Data) as the trigger condition 13 Press Address 0xXX; then, select 0x50. 14 Press Data 0xXX; then, select 0x10. 36 Agilent InfiniiVision 7000B Series Oscilloscopes Evaluation Guide Verifying I2C Serial Bus Communication 6 The oscilloscope should now be triggering on a Write operation to Address 50 hex with an Acknowledge (50WA), followed by a data byte value of 10 hex with an acknowledge (10A). This particular trigger condition is coincident with a transmission of a 3-cycle analog chirp shown on channel 1 (yellow waveform) and channel 2 (green waveform). Let’s now view the I2C decoded data in the “lister” format. 15 Press [Serial]. 16 Press Lister. 17 Next, press Lister Display to turn on the Lister display mode. Agilent InfiniiVision 7000B Series Oscilloscopes Evaluation Guide 37 6 Verifying I2C Serial Bus Communication 18 To scroll through a stored list of I2C packets, first press [Run/Stop] to stop acquisitions. 19 Rotate the selection knob to scroll through the list with direct time-correlation to the captured waveforms. For additional information on how to automatically search and navigate within the Lister display, refer to “Using Serial Search and Navigation" on page 67. 38 Agilent InfiniiVision 7000B Series Oscilloscopes Evaluation Guide Agilent InfiniiVision 7000B Series Oscilloscopes Evaluation Guide 7 Verifying SPI Serial Bus Communication Another common serial bus protocol used in many embedded designs is the Serial Peripheral Interface (SPI) bus. Although this bus requires more signals than the I2C bus, it is a very flexible serial bus protocol that the designer can define, such as customizing the number of bits in each serial transmission. While the I2C bus is primarily used for chip-to-chip communication within a single PC board, the SPI bus can be used for chip-to-chip communication or for serial communication to nearby peripherals. To enable SPI decoding, your oscilloscope must have the low speed serial bus decode option (Option LSS) installed. You can verify the installed options on your oscilloscope at [Utility] > Service > About Oscilloscope. Setup 1 Connect the demo kit’s 40-pin ribbon cable from the back of the Agilent InfiniiVision Series oscilloscope to the 40-pin connector on the demo board. 2 Connect channel 1 probe to the CH1 test point and ground (GND). 3 Connect channel 2 probe to the CH2 test point and ground (GND). 4 Set the rotary switch on the demo board for the SPI signal (Mode #6). 5 Press [Default Setup]. 6 Press [Auto Scale]. 39 7 Verifying SPI Serial Bus Communication 7 Press [Serial]; then, select the SPI decode mode. 8 Press Signals; then, select the D1 as the Clock source. 9 Press Data; then, select D3 as the serial data signal source. 10 Press ~CS; then, select D0 as the Chip Select (not) source. You should now be able to view the SPI serial decode trace at the bottom of the display. Let’s now set up the oscilloscope to trigger on a specific SPI transmission of data (02 10) in order to synchronize acquisitions coincident with a specific burst of the analog signals. 11 Press [Trigger]; then, select the SPI trigger mode. 12 Press #Bits; then, select 16 as the number of bits to trigger on. 13 Press 0 1 X to select “0”; then, press Set all Bits 0 to preset all 16 bits to “0”. 14 Using the Bit softkey, the selection knob, and the 0 1 X softkey, enter “000 0010 0001 0000” as the specific serial bit pattern to trigger on. 40 Agilent InfiniiVision 7000B Series Oscilloscopes Evaluation Guide Verifying SPI Serial Bus Communication 7 The oscilloscope should now be triggering on a stable serial pattern showing a 3-cycle “chirp” on the oscilloscope’s display. Let’s now set up the oscilloscope to display the decoded SPI data in a “lister” format. 15 Press [Serial]. 16 Press Lister. 17 Press Lister Display to turn on the Lister display mode. 18 To scroll through a stored list of SPI packets, first press [Run/Stop] to stop acquisitions. Agilent InfiniiVision 7000B Series Oscilloscopes Evaluation Guide 41 7 Verifying SPI Serial Bus Communication 19 Rotate the selection knob to scroll through the list with direct time-correlation to the captured waveforms. For additional information on how to automatically search and navigate within the lister display, refer to “Using Serial Search and Navigation" on page 67. 42 Agilent InfiniiVision 7000B Series Oscilloscopes Evaluation Guide Agilent InfiniiVision 7000B Series Oscilloscopes Evaluation Guide 8 Verifying RS-232/UART Serial Bus Communication The RS-232 and UART serial buses are typically used to communicate between a CPU/MCU and peripheral devices such as printers, storage devices, and/or EEPROM programmers. The bus consists of separate transmit and receive signals and the clock is embedded in these signals. The RS-232/UART bus is very flexible in terms of user-definable baud rates, number of bits, bit polarity, bit order, and parity. Each of the parameters can be defined on the Agilent InfiniiVision Series oscilloscope for triggering and decoding this bus. You can also use the RS-232/UART trigger and decode option on many RS-485 applications because the RS-485 specification is an electrical specification only; not a protocol specification. To enable RS-232/UART decode and triggering, your oscilloscope must have the RS-232/UART serial bus decode option (Option 232) installed. You can verify the installed options on your oscilloscope at [Utility] > Service > About Oscilloscope. Setup 1 Connect the demo kit’s 40-pin ribbon cable from the back of the Agilent InfiniiVision Series oscilloscope to the 40-pin connector on the demo board. 2 Connect channel 1 probe to the CH1 test point and ground (GND). 3 Connect channel 2 probe to the CH2 test point and ground (GND). 4 Set the rotary switch on the demo board for the RS-232 signal (Mode #7). 5 Press [Default Setup]. 6 Press [Auto Scale]. 7 Set the timebase to 1.0 ms/div. 8 To turn on UART/RS-232 decode, first press [Serial]; then, select the UART/RS232 serial decode mode. 43 8 Verifying RS-232/UART Serial Bus Communication 9 To configure the bus for odd parity, press Bus Config; then, press Parity three times to select Odd parity. The oscilloscope should now be decoding both the transmit and receive RS-232 signals in hex format. Let’s now turn on default RS232 waveform labels so that we can see which analog channel is capturing the transmit data stream and which analog channel is capturing the receive data stream. Let’s also set up the oscilloscope to trigger on a specific transmit byte (0x4D). The oscilloscope should currently be triggering on an edge crossing of channel 2 (Auto Scale default triggering). 10 Press [Label] (between the channel 1 and channel 2 keys) to turn on default labels. 11 Press [Trigger]; then, select the UART/RS232 triggering mode. 12 Press Trigger Setup; then, select Tx Data. 13 Next, press Data 0x00; then, select 0x4D. 44 Agilent InfiniiVision 7000B Series Oscilloscopes Evaluation Guide Verifying RS-232/UART Serial Bus Communication 8 With default labels turned on, we can now clearly see which input signals are the transmit (TX) and receive (RX) signals, and which serial decode trace is the transmit decode (TX) and the receive decode (RX). In addition, we should see that the oscilloscope is triggering on 4D hex of the transmit signal at exactly center-screen. Note that in addition to decoding and triggering on hex formatted data, the InfiniiVision Series oscilloscopes are also able to decode and trigger on binary and ASCII formatted data. Let’s change the decode base from the default hex setting to ASCII and see if we can uncover a secret encoded message generated by the demo board’s signals. 14 Press [Serial]; then, press Settings. 15 Press Base; then, select ASCII. Agilent InfiniiVision 7000B Series Oscilloscopes Evaluation Guide 45 8 Verifying RS-232/UART Serial Bus Communication You should now see the encoded message: “Agilent MSOs RRR #1”. In addition, you may notice that the last decoded byte (1) is occasionally flashing in red. This is an indication of an infrequent parity error. Let’s now set up the oscilloscope to trigger specifically on a parity error condition. But because this error condition is infrequent, we will first need to change the trigger mode to NORMAL to prevent the oscilloscope from auto triggering. 16 Press [Mode/Coupling] and then press Mode twice to select the Normal trigger mode. 17 Press [Trigger]; then, press Trigger Setup. 18 Next, press Trigger Tx Data; then, select Rx or Tx Parity Error as the trigger condition. You should now see that the oscilloscope is triggering on the parity error (red “1”) at center-screen and the “1” ASCII character is constantly red (no longer flashing). Let’s now analyze transmitted and received data both before and after this particular error byte using the oscilloscope’s “lister” display mode. 19 Press [Serial]; then, press Lister. 20 Next, press Lister Display to turn it on. 46 Agilent InfiniiVision 7000B Series Oscilloscopes Evaluation Guide Verifying RS-232/UART Serial Bus Communication 8 21 To scroll through a stored list of RS232/UART packets, first press [Run/Stop] to stop acquisitions. 22 Rotate the selection knob to scroll through the list with direct time-correlation to the captured waveforms. For additional information on how to automatically search and navigate within the lister display, refer to “Using Serial Search and Navigation" on page 67. Agilent InfiniiVision 7000B Series Oscilloscopes Evaluation Guide 47 Agilent InfiniiVision 7000B Series Oscilloscopes Evaluation Guide 9 Verifying CAN Serial Bus Communication The Controller Area Network (CAN) bus is used in a variety of today’s automotive and industrial applications. Because this bus is typically differential, it is a very robust bus with lots of noise immunity and can be used to communicate over relatively long distances between devices. Because the CAN bus is usually a differential bus, a differential active probe is typically required. However, the CAN signal on our demo board is a single-ended signal (CAN_L). So for this lab, we will be using a standard high impedance passive probe. With a CAN bus signal, there is not an explicit clock signal as there is with I2C and SPI. Clocking is embedded within the CAN signal, and CAN receivers must recover the clock based on a known baud rate. To enable CAN decoding, your oscilloscope must have the CAN/LIN serial bus decode option (Option AMS) installed. You can verify the installed options on your oscilloscope at [Utility] > Service > About Oscilloscope. Setup 1 Connect the demo kit’s 40-pin ribbon cable from the back of the Agilent InfiniiVision Series oscilloscope to the 40-pin connector on the demo board. 2 Connect channel 1 probe to the CH1 test point and ground (GND). 3 Connect channel 2 probe to the CH2 test point and ground (GND). 4 Set the rotary switch on the demo board for the CAN signal (Mode #8). 5 Press [Default Setup]. 6 Set the channel 1 vertical scale to 1.0 V/div and the vertical offset to -1.0 V. 7 Push the Trigger Level knob to set triggering on channel 1 at the 50% level. 8 Turn on channel 2. 48 9 Verifying CAN Serial Bus Communication 9 Press [Digital] to turn on digital channels; then, press Turn off D15-D8 to turn off these unused channels. 10 Next, press Bus; then, press Bus1 two times. Note that Bus1 is an overlaid display of D7-D0. We will use this mode later to make a time-correlated measurement. Let’s now set up the oscilloscope to decode and trigger on CAN frames. 11 To turn on CAN decode, first press [Serial]; then, select the CAN serial decode mode. 12 To set decoding for the appropriate baud rate, press Settings. 13 Press Baud.; then, select 125 kb/s. 14 To trigger on the channel 1 CAN signal, first press [Trigger]; then, select the CAN triggering mode. The oscilloscope should now be triggering on Start-of-frame (SOF) of any CAN frame. Let’s now set up the oscilloscope to trigger on a specific data frame ID (07F hex). 15 Press Trigger: SOF; then, select Data Frame ID (~RTR) as the CAN triggering mode. 16 Press Bits. 17 Next, press Hex; then, select “F”. Agilent InfiniiVision 7000B Series Oscilloscopes Evaluation Guide 49 9 Verifying CAN Serial Bus Communication The oscilloscope should now be triggering on frame 07F. Because “F” is unique in the lower nibble of the ID for our demo board signal, specifying the upper two nibbles (07) is not necessary in order to trigger on 07F hex. Let’s now make some time-correlated measurements across analog, digital, and serial bus signals. 18 To measure the average voltage of the channel 2 waveform (1 Hz signal), first press [Meas], and then change the Source to “2”. 19 Next, press Select:; then, select Average. 20 To begin executing the selected measurement, either push the selection knob or press Measure Avg. 21 In order to view both the measurements and the value of the parallel digital bus (B1), press the Back back/up key (above the power switch). The channel 2 signal (green waveform) might represent the output of an analog sensor in an automobile or an industrial system. Perhaps it is an electrical representation of temperature. This analog signal is then converted to an 8-bit digital byte using an ADC. The digital output of the 8-bit ADC is represented by the eight digital waveforms (D0-D7) and Bus1, which is an overlay display of all eight bits. This 8-bit digital output of the ADC is then converted to a serial string of data embedded within CAN frame ID: 07F. This serial data byte is displayed as the 2-digit hex white characters within the CAN serial decode trace shown at the bottom of the display. We can now see all three (analog waveform with measurement, digital bus, and serial data) all time-correlated. However, the update rate of the input signals and the oscilloscope are too fast to 50 Agilent InfiniiVision 7000B Series Oscilloscopes Evaluation Guide Verifying CAN Serial Bus Communication 9 verify that these signals have correlated values. So let’s stop acquisitions and “freeze” the display in order to verify a time-correlated measurement on just one acquisition. 22 Press [Run/Stop]. You should now see that the hex value of the parallel bus (Bus1) is exactly the same as the hex value of the data byte within the CAN decode trace. And, both of these directly relate to the average voltage of the channel 2 input signal (Avg(2)). Let’s now see if our CAN signal includes any error frames. 23 Press [Run/Stop] to begin repetitive acquisitions again. Notice within the serial decode trace at the bottom of the display a red flashing “ERR” message near the end of the frame/packet. This is an indication that the oscilloscope is detecting error frames. With hardware-based decoding, Agilent InfiniiVision Series oscilloscopes are able to capture infrequent errors and display them on-screen very quickly. All other oscilloscopes on the market today utilize software-based decoding which tends to be slow, especially when using deep memory. This means that critical information can be missed, such as these infrequent error frames. Now that we know our system has errors, let’s set up the oscilloscope to trigger on just error frames, instead of triggering on frame ID:07F. However, because the error frames on our CAN demo signal occur relatively infrequently, we will need to select the Normal trigger mode to prevent the oscilloscope from auto triggering due to a low repetition rate trigger event. Agilent InfiniiVision 7000B Series Oscilloscopes Evaluation Guide 51 9 Verifying CAN Serial Bus Communication 24 Press [Mode/Coupling]; then, press Mode two times to select the Normal trigger mode. 25 To trigger on just CAN error frames, first press [Trigger]. 26 Next, select to trigger on Error Frame. The oscilloscope should now be triggering exclusively on error frames. To analyze transmitted data both before and after these error frames, let’s re-scale the oscilloscope’s timebase in order to capture more frames, and then let’s turn on the “Lister” display mode. 27 Set the timebase to 2.0 ms/div. 28 Press [Serial]; then, press Lister. 29 Next, press Lister Display to turn on the Lister display mode. 52 Agilent InfiniiVision 7000B Series Oscilloscopes Evaluation Guide 9 Verifying CAN Serial Bus Communication 30 To scroll through a stored list of CAN packets, first press [Run/Stop] to stop acquisitions. 31 Rotate the selection knob to scroll through the list with direct time-correlation to the captured waveforms. For additional information on how to automatically search and navigate within the Lister display, refer to “Using Serial Search and Navigation" on page 67. Agilent InfiniiVision 7000B Series Oscilloscopes Evaluation Guide 53 Agilent InfiniiVision 7000B Series Oscilloscopes Evaluation Guide 10 Verifying LIN Serial Bus Communication The LIN serial bus is another protocol that is used in many automotive applications. The LIN protocol is more often used in less safety-critical applications as compared to CAN automotive applications. LIN is a single-ended bus (signal to ground) with voltage levels usually based on the car’s battery voltage. Similar to CAN, the clock is embedded within the LIN data signal. This bus is typically slower and lower cost than CAN technology. Typical non-safety critical applications include seat and mirror controls. To enable LIN decode and triggering, your oscilloscope must have the CAN/LIN serial bus decode option (Option AMS) installed. You can verify the installed options on your oscilloscope at [Utility] > Service > About Oscilloscope. Setup 1 Connect the demo kit’s 40-pin ribbon cable from the back of the Agilent InfiniiVision Series oscilloscope to the 40-pin connector on the demo board. 2 Connect channel 1 probe to the CH1 test point and ground (GND). 3 Connect channel 2 probe to the CH2 test point and ground (GND). 4 Set the rotary switch on the demo board for the LIN signal (Mode #9). 5 Press [Default Setup]. 6 Set the channel 1 vertical scale to 500 mV/div and the vertical offset to +1.0 V. 7 Push the Trigger Level knob to set the channel 1 trigger level to 50%. 8 Set the timebase to 1.0 ms/div. 9 To turn on LIN decode, first press [Serial]; then, select the LIN serial decode mode. 10 To set decoding for the appropriate baud rate of our demo signal, press Settings. 11 Press Baud Rate; then, select 19.2 kb/s. 54 Verifying LIN Serial Bus Communication 10 The oscilloscope should now be decoding the LIN data, but not yet triggering on this LIN signal. Let’s now set up the oscilloscope to trigger specifically on LIN frame ID 12 hex. 12 Press [Trigger]; then, select the LIN triggering mode. 13 Press Trigger: Sync; then, select the ID-Frame ID trigger mode. 14 Press Frame ID 0xXX; then, select 0x12. The oscilloscope should now be triggering on frame: 12 hex. Notice the last byte in the serial decode string. This is the checksum byte. This byte is sometimes displayed in red. This is an indication of checksum errors. Let now trigger on frame ID: 21 hex so that we can see another type of error condition. 15 Press Frame ID 0x12; then, select 0x21. Agilent InfiniiVision 7000B Series Oscilloscopes Evaluation Guide 55 10 Verifying LIN Serial Bus Communication Notice the first byte in the serial decode string is sometimes shown in red. This is the frame ID field. When this field is displayed in red, it is an indication of a parity error in the header field of this frame. To analyze transmitted data both before and after this particular frame (21 hex), let’s turn on the “Lister” display mode. But first, let’s re-scale the timebase to 10.0 ms/div in order to capture several LIN frames on-screen. 16 Set the timebase to 10.0 ms/div. 17 Press [Serial]; then, press Lister. 18 Next, press Lister Display to turn on the Lister display mode. 56 Agilent InfiniiVision 7000B Series Oscilloscopes Evaluation Guide Verifying LIN Serial Bus Communication 10 19 To scroll through a stored list of LIN packets, first press [Run/Stop] to stop acquisitions. 20 Rotate the selection knob to scroll through the list with direct time-correlation to the captured waveforms. For additional information on how to automatically search and navigate within the lister display, refer to “Using Serial Search and Navigation" on page 67. Agilent InfiniiVision 7000B Series Oscilloscopes Evaluation Guide 57 Agilent InfiniiVision 7000B Series Oscilloscopes Evaluation Guide 11 Verifying I2S Serial Bus Communication The Integrated Interchip sound (I2S) bus is a serial bus interface standard used for connecting digital audio devices together, such compact disc, digital audio tape, digital sound processors, and digital TV sound. The I2S serial bus is based on a 2’s complement format. The serial data channel includes both left and right channel audio information (stereo). In addition to the serial data signal, the I2S protocol also includes an explicit clock signal (SCLK) and a word select (WS) signal. To enable I2S decoding, your oscilloscope must have the I2S serial bus decode option (Option I2S) installed. You can verify the installed options on your oscilloscope at [Utility] > Service > About Oscilloscope. Setup 1 Connect the demo kit’s 40-pin ribbon cable from the back of the Agilent InfiniiVision Series oscilloscope to the 40-pin connector on the demo board. 2 Connect channel 1 probe to the CH1 test point and ground (GND). 3 Connect channel 2 probe to the CH2 test point and ground (GND). 4 Set the rotary switch on the demo board for the I2S signal (Mode #C). 5 Press [Default Setup]. 6 Press [Auto Scale]. 7 Set the timebase to 10.0 µs/div. 8 To turn on I2S decode, first press [Serial]; then, select the I2S serial decode mode. 9 To define the I2S serial input signals, first press Signals; then, select the D14 input as the serial clock (SCLK) source. 10 Next, press WS; then, select the D15 input as the Word Select source. 11 Now press SDATA; then, select the channel 1 input as the serial data source. 58 Verifying I2S Serial Bus Communication 11 You should now see I2S decoding based on 8-bit words of “left” channel and “right” channel data. Note that this might represent stereo information in a digital audio/sound system. Let’s now set up the oscilloscope to trigger on a specific transmitted audio data. 12 Press [Trigger]; then, select the I2S trigger mode. 13 Press Trigger Setup to view the default I2S trigger condition. Note that the default trigger condition is to trigger when the left-channel data equals “0” (signed decimal value), and we can see that this condition occurs when the analog waveform on channel 2 (green trace) crosses through the 50% level of a sine wave output in either the positive or negative direction. Let’s now set up the oscilloscope to trigger on a specific direction of the output analog signal (increasing or decreasing data value). 14 Press Trigger =; then, select (Increasing Value) as the trigger condition. The oscilloscope should now be triggering on +20, which is the first left-channel data value captured after crossing through -10 and +10 Agilent InfiniiVision 7000B Series Oscilloscopes Evaluation Guide 59 11 Verifying I2S Serial Bus Communication (default setting). To analyze left and right channel data both before and after this particular byte, let’s turn on the “Lister” display mode. 15 Press [Serial], and then press Lister. 16 Next, press Lister Display to turn it on. 17 To scroll through a stored list of I2S packets, first press [Run/Stop] to stop acquisitions. 18 Rotate the selection knob to scroll through the list with direct time-correlation to the captured waveforms. For additional information on how to automatically search and navigate within the lister display, refer to “Using Serial Search and Navigation" on page 67. 60 Agilent InfiniiVision 7000B Series Oscilloscopes Evaluation Guide Agilent InfiniiVision 7000B Series Oscilloscopes Evaluation Guide 12 Using Segmented Memory Acquisition to Capture More Data Segmented Memory acquisition is a special mode of acquisition that conserves and optimizes the oscilloscope’s acquisition memory. It is ideal for capturing multiple low duty cycle signals where there may long dead-times between important events. Typical applications include burst radar, pulsed lasers, as well as many serial bus applications that utilize packetized data. During this lab, we will demonstrate an application using a “burst” signal, as well as a CAN bus application. To enable Segmented Memory acquisition as well CAN decode, your oscilloscope must have the Segmented Memory and CAN/LIN options (Option SGM and Option AMS) installed. You can verify the installed options on your oscilloscope at [Utility] > Service > About Oscilloscope. Part A: Using Segmented Memory on “Burst” Signals 1 Connect the demo kit’s 40-pin ribbon cable from the back of the Agilent InfiniiVision Series oscilloscope to the 40-pin connector on the demo board. 2 Connect channel 1 probe to the CH1 test point and ground (GND). 3 Connect channel 2 probe to the CH2 test point and ground (GND). 4 Set the rotary switch on the demo board for the “Burst” signal (Mode #3). 5 Press [Default Setup]. 6 Press [Auto Scale]. 61 12 Using Segmented Memory Acquisition to Capture More Data It may appear that the oscilloscope is capturing a repetitive low-cycle pulse. But it is actually capturing a burst of pulses. You can re-scale the timebase to 1.0 µs to view the burst of pulses. To capture and compare multiple bursts of signal activity, you could re-scale the timebase to capture a longer time-span. However, with limited acquisition memory (8M on InfiniiVision Series oscilloscopes) the oscilloscope would automatically reduce its sample rate to capture the longer time-span. This would reduce measurement accuracy. Another alternative would be to use the oscilloscope’s Segmented Memory acquisition mode. Let’s now set up a Segmented Memory acquisition to capture 150 consecutive occurrences of this burst of signals. 7 Set the timebase to 500 ns/div and the horizontal delay to 1.700 µs. 8 Press [Acquire]. 9 Press Segmented; then, select 150 (# of Segments). 10 Now press Segmented to begin a Segmented Memory acquisition. 62 Agilent InfiniiVision 7000B Series Oscilloscopes Evaluation Guide Using Segmented Memory Acquisition to Capture More Data 12 The oscilloscope should have just captured 150 consecutive waveform segments with Segment #1 shown on-screen. Let’s now review all of the waveform segments and determine how long of a time-span the oscilloscope just captured. 11 Press Current Seg. 12 Review all 150 waveform segments by rotating the selection knob. 13 Rotate the selection knob until Segment #150 is selected and shown on screen. Notice that each segment/burst has been time-tagged with a time value relative to the first captured segment (Segment #1). Segment #150 should have a time-tag of approximately 149 ms. Capturing this much waveform information at a high sample rate using conventional acquisition memory would be impossible. Let’s now see how Segmented Memory can be used on packetized serial bus signals. Agilent InfiniiVision 7000B Series Oscilloscopes Evaluation Guide 63 12 Using Segmented Memory Acquisition to Capture More Data Part B: Using Segmented Memory on Packetized Serial Bus Signals 1 Connect the demo kit’s 40-pin ribbon cable from the back of the Agilent InfiniiVision Series oscilloscope to the 40-pin connector on the demo board. 2 Connect channel 1 probe to the CH1 test point and ground (GND). 3 Connect channel 2 probe to the CH2 test point and ground (GND). 4 Set the rotary switch on the demo board for the “CAN” signal (Mode #8). 5 Press [Default Setup]. 6 Set the channel 1 vertical scale to 500 mV/div and the vertical offset to +1.0 V. 7 Push the Trigger Level knob to automatically set the trigger level to 50%. 8 Press [Serial]; then, select the CAN serial decode mode. 9 Press Settings. 10 Press Baud ; then, select 125 kb/s as the baud rate 11 Press [Trigger]; then, select the CAN triggering mode. 12 Set the timebase to 100.0 µs/div and the horizontal delay to +400.0 µs. 64 Agilent InfiniiVision 7000B Series Oscilloscopes Evaluation Guide Using Segmented Memory Acquisition to Capture More Data 12 The oscilloscope should now be capturing random CAN frames (packets of data) while triggering on Start-of-frame (SOF). Again, to capture more frames, we could re-scale the timebase. However, the number of consecutive frames that the oscilloscope could capture using conventional acquisition memory at a high sample rate would be limited. Let’s now set up a Segmented Memory acquisition to capture 500 consecutive CAN frames. 13 Press [Acquire]. 14 Press Segmented; then, select 500 (# of Segments). 15 Now, press Segmented to begin a segmented memory acquisition. The oscilloscope should have just captured and decoded 500 consecutive CAN frames. Let’s now review all of the CAN frames and determine how long of a time-span the oscilloscope just captured. 16 Press Current Seg. 17 Review all 500 packets of CAN data by rotating the selection knob. 18 Rotate the selection knob until Current Segment 500 is selected on shown on screen. Notice that each segment/burst has been time-tagged with a time value relative to the first captured segment (Segment #1). Segment #500 should have a time-tag of approximately 1 second. Capturing this much serial data using conventional acquisition memory would be impossible. Let’s now see how we can examine this serial data in the oscilloscope’s serial “lister” display mode. Agilent InfiniiVision 7000B Series Oscilloscopes Evaluation Guide 65 12 Using Segmented Memory Acquisition to Capture More Data 19 Press [Serial]. 20 Press Lister. 21 Press Lister Display to turn it on (Lister shows just one CAN frame). 22 Press Options. 23 Press Analyze Segments. 24 To review all 500 frames, rotate the selection knob to scroll through all segments/frames. For additional information on how to automatically search and navigate within the lister display, refer to “Using Serial Search and Navigation" on page 67. 66 Agilent InfiniiVision 7000B Series Oscilloscopes Evaluation Guide Agilent InfiniiVision 7000B Series Oscilloscopes Evaluation Guide 13 Using Serial Search and Navigation Searching through a deep memory acquisition of serially decoded data can sometimes be a tedious process. But with InfiniiVision’s new Search and Navigate capability on the 7000B Series DSOs and MSOs, finding specific serial events is much easier now. In this lab we will first use a manual process for reviewing captured serial packets utilizing the serial decode “lister” display. We will then use the new automatic Search and Navigate capability that is available on this oscilloscope. Although the instructions for this lab are based on using the CAN serial bus demo signal, if your oscilloscope is not equipped with the CAN/LIN option, you can use one of the other serial bus signals and options that your oscilloscope may be equipped with. However, we suggest that you first become familiar with that particular serial bus by referencing one of the previous serial bus labs. You can verify the installed options on your oscilloscope at [Utility] > Service > About Oscilloscope. Setup 1 Connect the demo kit’s 40-pin ribbon cable from the back of the Agilent InfiniiVision Series oscilloscope to the 40-pin connector on the demo board. 2 Connect channel 1 probe to the CH1 test point and ground (GND). 3 Connect channel 2 probe to the CH2 test point and ground (GND). 4 Set the rotary switch on the demo board for the “CAN” signal (Mode #8). 5 Press [Default Setup]. 6 Set the channel 1 vertical scale to 500 mV/div and the vertical offset to 1.0 V. 7 Push the Trigger Level knob to set the trigger level at 50%. 8 Press [Serial]; then, select the CAN decode mode. 9 Press Settings. 10 Press Baud; then, select 125 kb/s. 67 13 Using Serial Search and Navigation 11 Set the timebase to 50 ms/div in order to capture multiple serial packets. 12 Press [Serial]. 13 Press Lister. 14 Press Lister Display to view the decoded list. 15 Press [Run/Stop] to stop acquisitions. At this point, we have a few different options to use in order to search and navigate through this deep memory acquisition of CAN serial packets. We will begin by manually searching through our list and waveform. We will then use the oscilloscope’s automatic search and navigate capabilities. 16 Rotate the selection knob to scroll through the decode list. 17 Point to a particular CAN frame-of-interest, such as a frame with an error (Fo, Fr). 18 Either push the selection knob or press Zoom to Selection to zoom-in on this packet. 68 Agilent InfiniiVision 7000B Series Oscilloscopes Evaluation Guide Using Serial Search and Navigation 13 Let’s now set up the oscilloscope to automatically search and navigate based on specific serial search criteria. Let’s now “mark” each CAN frame with the ID of 07F hex, and then view these frames time-correlated with the waveform. 19 Press [Search]. 20 Press Search for; then, select Data Frame ID (~RTR) to search on. Note that all “Data Frames” based on ID = XXX (don’t care) are now marked in orange in the left-most column. Let’s now narrow our search to just “Data Frames” with ID = 07F hex. 21 Press Bits. 22 Press Hex; then, select “F”. At this point we could manually scroll to these “marked” frames, or we could use the oscilloscope’s navigation capability to automatically scroll to and display these particular “marked” frames. Let’s use the automatic navigation capability. 23 Press the forward key (near the [Navigate] key) multiple times to find all of the occurrences of CAN frame 07F. 24 Press the back key to navigate back up the list. Agilent InfiniiVision 7000B Series Oscilloscopes Evaluation Guide 69 13 Using Serial Search and Navigation In addition to navigating to specific frames based on a particular search criteria, we can also “time” navigate by “playing” through waveform. 25 Press [Navigate]. 26 Select the Time navigation mode. 27 Press the forward key to navigate forward in time. 28 Press the time. back key to stop and then press it again to navigate back in 29 Press the forward or the back keys multiple times to speed up on slow down the time navigation. 30 Press the stop key to stop navigation. Note that “time” navigation is not limited to serial bus waveforms. It can used to navigate through the acquisition memory on any set of captured waveforms. 70 Agilent InfiniiVision 7000B Series Oscilloscopes Evaluation Guide Agilent InfiniiVision 7000B Series Oscilloscopes Evaluation Guide Appendix A Using Trigger Holdoff to Synchronize Acquisitions/Display on Complex Signals Triggering on simple repetitive signals is very easy using standard edge triggering. But if you need to synchronize your oscilloscope’s acquisitions/display on more complex signals, such as an amplitude-modulated signal, you will need to use your oscilloscope’s trigger holdoff capability, unless you have an external synchronization signal available. This lab will show you how to use trigger holdoff to achieve a stable trigger in the absence of a synchronization signal. Setup 1 Connect the demo kit’s 40-pin ribbon cable from the back of the Agilent InfiniiVision Series oscilloscope to the 40-pin connector on the demo board. 2 Connect channel 1 probe to the CH1 test point and ground (GND). 3 Connect channel 2 probe to the CH2 test point and ground (GND). 4 Set the rotary switch on the demo board for the “AM” signal (Mode #1). 5 Press [Default Setup]. 6 Set the channel 1 vertical scale to 500 mV/div and the vertical offset to 2.0 V. 7 Push the Trigger Level knob to set the trigger level at 50%. 8 Push the Waveform Intensity knob to set the waveform intensity at 50%. 71 A Using Trigger Holdoff to Synchronize Acquisitions/Display on Complex Signals Notice that even though this signal crosses the trigger level setting at approximately the 50% level, the waveform appears to be not triggered. This is because the oscilloscope is randomly triggering on any edge crossing of the carrier signal. To properly trigger on this complex signal, we need to set up the oscilloscope to synchronize trigger arming and disarming based on the modulating frequency. We can do this with trigger “holdoff”. 9 Press the [Run/Stop] front panel to stop repetitive acquisitions. 72 Agilent InfiniiVision 7000B Series Oscilloscopes Evaluation Guide Using Trigger Holdoff to Synchronize Acquisitions/Display on Complex Signals A We can now visually determine how often this signal repeats. But first, notice that there appears to a narrow “gap” in every 2nd modulation. In addition, we can see that one modulation has a slightly higher peak-to-peak voltage than the next modulation. If you use the oscilloscope’s timing cursors to measure the time between every 2nd modulation, you will see that this signal repeats approximately every 420 µs. To establish distinct trigger arm, disarm, and then re-arm points on a complex signal such as this, there must be a large timing gap between trigger events. We can create this timing gap by changing the trigger level away from the 50% level. We can then set the trigger holdoff to a value less than the repeat time of the signal to establish a stable trigger point. Let’s try it. 10 Set the trigger level to the approximate 75% level by rotating the Trigger Level knob until the trigger level is approximately 2.8 V. 11 Press [Mode/Coupling]. 12 Press Holdoff; then, set the holdoff value to approximately 375 µs. 13 Press [Run/Stop] to begin repetitive acquisitions again. The oscilloscope should now trigger on edge crossings of the carrier signal at the 2.8 voltage level. Triggering will then be disarmed and then re-armed 375 µs later, which should be during a large “gap” between every 2nd modulation. The oscilloscope then triggers again on the next edge crossing of the carrier signal at 2.8 V. Agilent InfiniiVision 7000B Series Oscilloscopes Evaluation Guide 73 www.agilent.com Agilent InfiniiVision 7000B Series Oscilloscopes Model Bandwidth Max. sample rate DSO7012B 100 MHz 2 GSa/s 2 MSO7012B 100 MHz 2 GSa/s 2 + 16 DSO7014B 100 MHz 2 GSa/s 4 MSO7014B 100 MHz 2 GSa/s 4 + 16 DSO7032B 350 MHz 2 GSa/s 2 MSO7032B 350 MHz 2 GSa/s DSO7034B 350 MHz 2 GSa/s MSO7034B 350 MHz 2 GSa/s DSO7052B* 500 MHz 4 GSa/s MSO7052B* 500 MHz 4 GSa/s 2 + 16 DSO7054B* 500 MHz 4 GSa/s 4 MSO7054B* 500 MHz 4 GSa/s 4 + 16 DSO7104B* 1 GHz 4 GSa/s 4 MSO7104B* 1 GHz 4 GSa/s 4 + 16 Memory MegaZoom III memory 8 Mpts standard # Ch 2 + 16 4 Other standard features • Dedicated controls for each channel • AutoScale • Automatic and cursor measurements • Front panel USB port • Built-in help • InfiniiMax AutoProbe interface 4 + 16 2 * Maximum sample rate and memory are interleaved Agilent Technologies, Inc. 2008-2009 Printed in U.S.A. First edition, November 2009 *N2918-97004* N2918-97004