1
Measurement Guide and Programming
Examples
PSA and ESA Series Spectrum Analyzers
This manual provides documentation for the following instruments:
Agilent Technologies PSA Series
E4443A (3 Hz - 6.7 GHz)
E4445A (3 Hz - 13.2 GHz)
E4440A (3 Hz - 26.5 GHz)
E4446A (3 Hz - 44 GHz)
E4448A (3 Hz - 50 GHz)
Agilent Technologies ESA-E Series
E4401B (9 kHz - 1.5 GHz)
E4402B (9 kHz - 3.0 GHz)
E4404B (9 kHz - 6.7 GHz)
E4405B (9 kHz - 13.2 GHz)
E4407B (9 kHz - 26.5 GHz)
Agilent Technologies ESA-L Series
E4411B (9 kHz - 1.5 GHz)
E4403B (9 kHz - 3.0 GHz)
E4408B (9 kHz - 26.5 GHz)
Manufacturing Part Number: E4401-90482
Supersedes: E4401-90466
Printed in USA
April 2004
© Copyright 1999 - 2004 Agilent Technologies
Notice
The information contained in this document is subject to change
without notice.
Agilent Technologies makes no warranty of any kind with regard to this
material, including but not limited to, the implied warranties of
merchantability and fitness for a particular purpose. Agilent
Technologies shall not be liable for errors contained herein or for
incidental or consequential damages in connection with the furnishing,
performance, or use of this material.
Safety Information
The following safety symbols are used throughout this manual.
Familiarize yourself with the symbols and their meaning before
operating this instrument.
WARNING
Warning denotes a hazard. It calls attention to a procedure
which, if not correctly performed or adhered to, could result in
injury or loss of life. Do not proceed beyond a warning note
until the indicated conditions are fully understood and met.
CAUTION
Caution denotes a hazard. It calls attention to a procedure that, if not
correctly performed or adhered to, could result in damage to or
destruction of the instrument. Do not proceed beyond a caution sign
until the indicated conditions are fully understood and met.
NOTE
Note calls out special information for the user’s attention. It provides
operational information or additional instructions of which the user
should be aware.
The instruction documentation symbol. The product is
marked with this symbol when it is necessary for the
user to refer to the instructions in the documentation.
This symbol is used to mark the on position of the
power line switch.
This symbol is used to mark the standby position of the
power line switch.
This symbol indicates that the input power required is
AC.
2
WARNING
This is a Safety Class 1 Product (provided with a protective
earth ground incorporated in the power cord). The mains plug
shall be inserted only in a socket outlet provided with a
protected earth contact. Any interruption of the protective
conductor inside or outside of the product is likely to make the
product dangerous. Intentional interruption is prohibited.
WARNING
No operator serviceable parts inside. Refer servicing to
qualified personnel. To prevent electrical shock do not remove
covers.
WARNING
If this product is not used as specified, the protection provided
by the equipment could be impaired. This product must be used
in a normal condition (in which all means for protection are
intact) only.
CAUTION
Always use the three-prong AC power cord supplied with this product.
Failure to ensure adequate grounding may cause product damage.
Where to Find the Latest Information
Documentation is updated periodically. For the latest information about
Agilent Technologies PSA and ESA spectrum analyzers, including
firmware upgrades and application information, please visit the
following Internet URL:
http://www.agilent.com/find/psa
http://www.agilent.com/find/esa
Microsoft is a U.S. registered trademark of Microsoft Corporation.
Bluetooth is a trademark owned by its proprietor and used under
license.
3
4
Contents
Table of Contents
1. Recommended Test Equipment
2. Measuring Multiple Signals
Comparing Signals on the Same Screen Using Marker Delta . . . . . . . . . . . . . . . . . . . . . . . 12
Comparing Signals on the Same Screen Using Marker Delta Pair . . . . . . . . . . . . . . . . . . . . 14
Comparing Signals not on the Same Screen Using Marker Delta . . . . . . . . . . . . . . . . . . . . 15
Resolving Signals of Equal Amplitude . . . . . . . . . . . . . . . . . . . . . . . . . . . . . . . . . . . . . . . . . 17
Resolving Small Signals Hidden by Large Signals . . . . . . . . . . . . . . . . . . . . . . . . . . . . . . . 20
Decreasing the Frequency Span Around the Signal . . . . . . . . . . . . . . . . . . . . . . . . . . . . . . . 22
3. Measuring a Low−Level Signal
Reducing Input Attenuation . . . . . . . . . . . . . . . . . . . . . . . . . . . . . . . . . . . . . . . . . . . . . . . . . 26
Decreasing the Resolution Bandwidth . . . . . . . . . . . . . . . . . . . . . . . . . . . . . . . . . . . . . . . . . 28
Using the Average Detector and Increased Sweep Time . . . . . . . . . . . . . . . . . . . . . . . . . . . 29
Trace Averaging . . . . . . . . . . . . . . . . . . . . . . . . . . . . . . . . . . . . . . . . . . . . . . . . . . . . . . . . . . 30
4. Improving Frequency Resolution and Accuracy
Using a Frequency Counter to Improve Frequency Resolution and Accuracy . . . . . . . . . . 32
5. Tracking Drifting Signals
Measuring a Source’s Frequency Drift . . . . . . . . . . . . . . . . . . . . . . . . . . . . . . . . . . . . . . . . . 36
Tracking a Signal . . . . . . . . . . . . . . . . . . . . . . . . . . . . . . . . . . . . . . . . . . . . . . . . . . . . . . . . . 38
6. Making Distortion Measurements
Identifying Analyzer Generated Distortion . . . . . . . . . . . . . . . . . . . . . . . . . . . . . . . . . . . . . 40
Third-Order Intermodulation Distortion . . . . . . . . . . . . . . . . . . . . . . . . . . . . . . . . . . . . . . . . 42
Measuring TOI Distortion with a One-Button Measurement . . . . . . . . . . . . . . . . . . . . . . . . 44
Measuring Harmonics and Harmonic Distortion with a One-Button Measurement . . . . . . 45
7. Measuring Noise
Measuring Signal-to-Noise . . . . . . . . . . . . . . . . . . . . . . . . . . . . . . . . . . . . . . . . . . . . . . . . . . 48
Measuring Noise Using the Noise Marker . . . . . . . . . . . . . . . . . . . . . . . . . . . . . . . . . . . . . . 50
Measuring Noise-Like Signals Using Marker Pairs . . . . . . . . . . . . . . . . . . . . . . . . . . . . . . . 52
Measuring Noise-Like Signals Using the Channel Power Measurement . . . . . . . . . . . . . . . 54
8. Making Time-Gated Measurements
Generating a Pulsed-RF FM Signal . . . . . . . . . . . . . . . . . . . . . . . . . . . . . . . . . . . . . . . . . . . 58
Connecting the Instruments to Make Time-Gated Measurements . . . . . . . . . . . . . . . . . . . . 61
Gated LO Measurement (PSA) . . . . . . . . . . . . . . . . . . . . . . . . . . . . . . . . . . . . . . . . . . . . . . . 62
Gated Video Measurement (ESA) . . . . . . . . . . . . . . . . . . . . . . . . . . . . . . . . . . . . . . . . . . . . 64
Gated FFT Measurement (PSA) . . . . . . . . . . . . . . . . . . . . . . . . . . . . . . . . . . . . . . . . . . . . . . 66
5
Table of Contents
Contents
9. Measuring Digital Communications Signals
Making Burst Power Measurements . . . . . . . . . . . . . . . . . . . . . . . . . . . . . . . . . . . . . . . . . . .68
Making Statistical Power Measurements (CCDF) . . . . . . . . . . . . . . . . . . . . . . . . . . . . . . . . .71
Making Adjacent Channel Power (ACP) Measurements . . . . . . . . . . . . . . . . . . . . . . . . . . .74
Making Multi-Carrier Power (MCP) Measurements . . . . . . . . . . . . . . . . . . . . . . . . . . . . . . .77
10.Using External Millimeter Mixers (Option AYZ)
Making Measurements With Agilent 11970 Series Harmonic Mixers . . . . . . . . . . . . . . . . .82
Setting Harmonic Mixer Bias Current . . . . . . . . . . . . . . . . . . . . . . . . . . . . . . . . . . . . . . . . . .84
Entering Conversion-Loss Correction Data for Harmonic Mixers . . . . . . . . . . . . . . . . . . . .85
Making Measurements with Agilent 11974 Series Preselected Harmonic Mixers . . . . . . . .86
Frequency Tracking Calibration with Agilent 11974 Series Preselected Harmonic Mixers .88
11.Demodulating AM and FM Signals
Measuring the Modulation Rate of an AM Signal . . . . . . . . . . . . . . . . . . . . . . . . . . . . . . . . .92
Measuring the Modulation Index of an AM Signal . . . . . . . . . . . . . . . . . . . . . . . . . . . . . . . .94
Demodulating an AM Signal Using the ESA Series . . . . . . . . . . . . . . . . . . . . . . . . . . . . . . .96
Demodulating an FM Signal Using the ESA-E Series (Requires Option BAA) . . . . . . . . . .98
12.Using Segmented Sweep (ESA-E Series Spectrum Analyzers)
Measuring Harmonics Using Standard Sweep . . . . . . . . . . . . . . . . . . . . . . . . . . . . . . . . . .102
Measuring Harmonics Using Segmented Sweep . . . . . . . . . . . . . . . . . . . . . . . . . . . . . . . . .104
Using Segmented Sweep With Limit Lines . . . . . . . . . . . . . . . . . . . . . . . . . . . . . . . . . . . . .106
Using Segmented Sweep to Monitor the Cellular Activity of a cdmaOne Band . . . . . . . .108
13.Stimulus Response Measurements (ESA Options 1DN and 1DQ)
Making a Stimulus Response Transmission Measurement . . . . . . . . . . . . . . . . . . . . . . . . .112
Calculating the N dB Bandwidth Using Stimulus Response . . . . . . . . . . . . . . . . . . . . . . . .114
Measuring Stop Band Attenuation Using Log Sweep (ESA-E Series) . . . . . . . . . . . . . . . .116
Making a Reflection Calibration Measurement . . . . . . . . . . . . . . . . . . . . . . . . . . . . . . . . . .118
Measuring Return Loss using the Reflection Calibration Routine . . . . . . . . . . . . . . . . . . .120
14.Demodulating and Viewing Television Signals
(ESA-E Series Option B7B)
Demodulating and Viewing Television Signals . . . . . . . . . . . . . . . . . . . . . . . . . . . . . . . . .122
Measuring Depth of Modulation . . . . . . . . . . . . . . . . . . . . . . . . . . . . . . . . . . . . . . . . . . . . .126
15.Concepts
Resolving Closely Spaced Signals . . . . . . . . . . . . . . . . . . . . . . . . . . . . . . . . . . . . . . . . . . . .130
Harmonic Distortion Calculations . . . . . . . . . . . . . . . . . . . . . . . . . . . . . . . . . . . . . . . . . . . .132
Time Gating Concepts . . . . . . . . . . . . . . . . . . . . . . . . . . . . . . . . . . . . . . . . . . . . . . . . . . . . .133
Trigger Concepts . . . . . . . . . . . . . . . . . . . . . . . . . . . . . . . . . . . . . . . . . . . . . . . . . . . . . . . . .153
6
Contents
16.ESA/PSA Programming Examples
Examples Included in this Chapter: . . . . . . . . . . . . . . . . . . . . . . . . . . . . . . . . . . . . . . . . . . 164
Finding Additional Examples and More Information . . . . . . . . . . . . . . . . . . . . . . . . . . . . . 165
Programming Examples Information and Requirements . . . . . . . . . . . . . . . . . . . . . . . . . . 166
Programming in C Using the VTL . . . . . . . . . . . . . . . . . . . . . . . . . . . . . . . . . . . . . . . . . . . 167
Using C to Make a Power Suite ACPR Measurement on a cdmaOne Signal . . . . . . . . . . 176
Using C to Serial Poll the Analyzer to Determine when an Auto-alignment is Complete . 179
Using C and Service Request (SRQ) to Determine When a Measurement is Complete . . 182
Using Visual Basic® 6 to Capture a Screen Image . . . . . . . . . . . . . . . . . . . . . . . . . . . . . . 188
Using Visual Basic® 6 to Transfer Binary Trace Data . . . . . . . . . . . . . . . . . . . . . . . . . . . 192
Using Agilent VEE to Transfer Trace Data . . . . . . . . . . . . . . . . . . . . . . . . . . . . . . . . . . . . 197
17.ESA Programming Examples
Examples Included in this Chapter: . . . . . . . . . . . . . . . . . . . . . . . . . . . . . . . . . . . . . . . . . . 200
Programming Examples System Requirements . . . . . . . . . . . . . . . . . . . . . . . . . . . . . . . . . 201
Using C with Marker Peak Search and Peak Excursion Measurement Routines . . . . . . . 202
Using C for Marker Delta Mode and Marker Minimum Search Functions . . . . . . . . . . . . 206
Using C to Perform Internal Self-Alignment . . . . . . . . . . . . . . . . . . . . . . . . . . . . . . . . . . . 210
Using C to Read Trace Data in an ASCII Format (over GPIB) . . . . . . . . . . . . . . . . . . . . . 214
Using C to Read Trace Data in a 32-Bit Real Format (over GPIB) . . . . . . . . . . . . . . . . . . 218
Using C to Read Trace Data in an ASCII Format (over RS-232) . . . . . . . . . . . . . . . . . . . 223
Using C to Read Trace Data in a 32-bit Real Format (over RS-232) . . . . . . . . . . . . . . . . . 228
Using C to Add Limit Lines . . . . . . . . . . . . . . . . . . . . . . . . . . . . . . . . . . . . . . . . . . . . . . . . 233
Using C to Measure Noise . . . . . . . . . . . . . . . . . . . . . . . . . . . . . . . . . . . . . . . . . . . . . . . . . 239
Using C to Enter Amplitude Correction Data . . . . . . . . . . . . . . . . . . . . . . . . . . . . . . . . . . . 243
Using C to Determine if an Error has Occurred . . . . . . . . . . . . . . . . . . . . . . . . . . . . . . . . . 247
Using C to Measure Harmonic Distortion (over GPIB) . . . . . . . . . . . . . . . . . . . . . . . . . . . 253
Using C to Measure Harmonic Distortion (over RS-232) . . . . . . . . . . . . . . . . . . . . . . . . . 261
Using C to Make Faster Power Averaging Measurements . . . . . . . . . . . . . . . . . . . . . . . . . 269
18.PSA Programming Examples
Examples Included in this Chapter: . . . . . . . . . . . . . . . . . . . . . . . . . . . . . . . . . . . . . . . . . . 278
Programming Examples Information and Requirements . . . . . . . . . . . . . . . . . . . . . . . . . . 279
Using C with Marker Peak Search and Peak Excursion Measurement Routines . . . . . . . . 280
Using C for Saving and Recalling Instrument State Data . . . . . . . . . . . . . . . . . . . . . . . . . 283
Using C to Save Binary Trace Data . . . . . . . . . . . . . . . . . . . . . . . . . . . . . . . . . . . . . . . . . . 287
Using C to Make a Power Calibration Measurement for a GSM Mobile Handset . . . . . . 291
Using C with the CALCulate:DATA:COMPress? RMS Command . . . . . . . . . . . . . . . . . 297
Using C Over Socket LAN (UNIX) . . . . . . . . . . . . . . . . . . . . . . . . . . . . . . . . . . . . . . . . . . 303
7
Table of Contents
AM and FM Demodulation Concepts . . . . . . . . . . . . . . . . . . . . . . . . . . . . . . . . . . . . . . . . . 157
Stimulus Response Measurement Concepts . . . . . . . . . . . . . . . . . . . . . . . . . . . . . . . . . . . . 158
Table of Contents
Contents
Using C Over Socket LAN (Windows NT) . . . . . . . . . . . . . . . . . . . . . . . . . . . . . . . . . . . . .323
Using Java Programming Over Socket LAN . . . . . . . . . . . . . . . . . . . . . . . . . . . . . . . . . . . .326
Using the VXI Plug-N-Play Driver in LabVIEW® . . . . . . . . . . . . . . . . . . . . . . . . . . . . . . .335
Using LabVIEW® 6 to Make an EDGE GSM Measurement . . . . . . . . . . . . . . . . . . . . . . .336
Using Visual Basic® .NET with the IVI-Com Driver . . . . . . . . . . . . . . . . . . . . . . . . . . . . .338
Using Agilent VEE to Capture the Equivalent SCPI Learn String . . . . . . . . . . . . . . . . . . .342
8
Recommended Test Equipment
1
Recommended Test Equipment
9
Recommended Test Equipment
NOTE
To find descriptions of specific analyzer functions, for the ESA, refer to
the Agilent Technologies ESA Series Spectrum Analyzers
User’s/Programmer’s Reference Guide and for the PSA, refer to the
Agilent Technologies PSA Series Spectrum Analyzers User’s and
Programmer’s Reference Guide.
Recommended Test Equipment
Test Equipment
Specifications
Recommended Model
0.25 MHz to 4.0 GHz
Ext Ref Input
E443XB series or
E4438C
Signal Sources
Signal Generator (2)
Adapters
Type-N (m) to BNC (f) (3)
1250-0780
Termination, 50 Ω
Type-N (m)
908A
Cables
(3) BNC, 122-cm (48-in)
10503A
Miscellaneous
Directional Bridge
86205A
Bandpass Filter
Center Frequency:
200 MHz
Bandwidth: 10 MHz
Lowpass Filter (2)
Cutoff Frequency:
300 MHz
RF Antenna
10
0955-0455
08920-61060
Chapter 1
Measuring Multiple Signals
2
Measuring Multiple Signals
11
Measuring Multiple Signals
Comparing Signals on the Same Screen Using Marker Delta
Comparing Signals on the Same Screen Using
Marker Delta
Using the analyzer, you can easily compare frequency and amplitude
differences between signals, such as radio or television signal spectra.
The analyzer delta marker function lets you compare two signals when
both appear on the screen at one time.
In this procedure, the analyzer 10 MHz signal is used to measure
frequency and amplitude differences between two signals on the same
screen. Delta marker is used to demonstrate this comparison.
Measuring Multiple Signals
Figure 2-1
An Example of Comparing Signals on the Same Screen
Step 1. Preset the analyzer:
Press Preset, Factory Preset (if present).
Step 2. (PSA)
a. Enable the rear panel 10 MHz output.
Press System, Reference, 10 MHz Out (On).
b. Connect the 10 MHz OUT (SWITCHED) from the rear panel to the front
panel RF input.
(ESA)
Connect the rear panel 10 MHz REF OUT to the front panel RF input.
Step 3. Set the analyzer center frequency, span and reference level to view the
10 MHz signal and its harmonics up to 50 MHz:
Press FREQUENCY Channel, Center Freq, 30, MHz.
Press SPAN X Scale, Span, 50, MHz.
Press AMPLITUDE Y Scale, Ref Level, 10, dBm.
12
Chapter 2
Measuring Multiple Signals
Comparing Signals on the Same Screen Using Marker Delta
Step 4. Place a marker at the highest peak on the display (10 MHz):
Press Peak Search.
The Next Pk Right and Next Pk Left softkeys are available to move the
marker from peak to peak. The marker should be on the 10 MHz
reference signal:
Step 5. Anchor the first marker and activate a second marker:
Press Marker, Delta.
The label on the first marker now reads 1R, indicating that it is the
reference point.
Step 6. Move the second marker to another signal peak using the front-panel
knob or by using the Peak Search key:
Press Peak Search, Next Peak or
Press Peak Search, Next Pk Right or Next Pk Left.
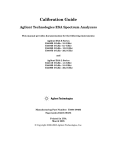
The amplitude and frequency difference between the markers is
displayed in the active function block. For ESA see the left side of
Figure 2-2 and the right side for PSA.
Using the Delta Marker Function (ESA left, PSA right)
NOTE
The resolution of the marker readings can be increased by turning on
the frequency count function.
Measuring Multiple Signals
Figure 2-2
Chapter 2
13
Measuring Multiple Signals
Comparing Signals on the Same Screen Using Marker Delta Pair
Comparing Signals on the Same Screen Using
Marker Delta Pair
In this procedure, the analyzer 10 MHz signal is used to measure
frequency and amplitude differences between two signals on the same
screen using the delta pair marker function.
Step 1. Refer to the previous procedure “Comparing Signals on the Same
Screen Using Marker Delta” on page 12 and follow steps 1, 2 and 3.
Step 2. Turn on Delta Pair reference marker to compare the 10 MHz signal and
the 30 MHz signal:
Press Peak Search, Marker, Delta Pair (ref).
Note that the Delta Pair marker does not anchor the first marker.
Step 3. Use the knob or Peak Search to move the second marker (labeled 1) to
the 30 MHz peak:
Press Peak Search, Next Peak or Next Pk Right.
Step 4. Use the front panel knob to move the ref marker to the 20 MHz peak:
Measuring Multiple Signals
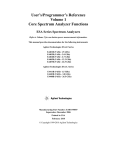
The active function displays the amplitude and frequency difference
between the 20 MHz and 30 MHz peaks as shown in Figure 2-3.
Figure 2-3
Using the Delta Pair Marker Function (ESA left, PSA right)
NOTE
In Figure 2-3 notice that the active function readout has moved to the
top left of the analyzer display. The active function position has three
positions: top, center and bottom. To modify the active function position:
Press Display, Active Fctn Position, Top (Center, or Bottom).
Center position is the factory default setting.
14
Chapter 2
Measuring Multiple Signals
Comparing Signals not on the Same Screen Using Marker Delta
Comparing Signals not on the Same Screen
Using Marker Delta
Measure the frequency and amplitude difference between two signals
that do not appear on the screen at one time. (This technique is useful
for harmonic distortion tests when narrow span and narrow bandwidth
are necessary to measure the low level harmonics.)
In this procedure, the analyzer 10 MHz signal is used to measure
frequency and amplitude differences between one signal on screen and
one signal off screen. Delta marker is used to demonstrate this
comparison.
Figure 2-4
Comparing One Signal on Screen with One Signal Off Screen
Measuring Multiple Signals
Step 1. Preset the analyzer:
Press Preset, Factory Preset (if present).
Step 2. (PSA)
a. Enable the rear panel 10 MHz output:
Press System, Reference, 10 MHz Out (On).
b. Connect the 10 MHz OUT (SWITCHED) from the rear panel to the front
panel RF input:
(ESA)
Connect the rear panel 10 MHz REF OUT to the front panel RF input.
Chapter 2
15
Measuring Multiple Signals
Comparing Signals not on the Same Screen Using Marker Delta
Step 3. Set the center frequency, span and reference level to view only the
10 MHz signal:
Press FREQUENCY Channel, Center Freq, 10, MHz.
Press SPAN X Scale, Span, 5, MHz.
Press AMPLITUDE Y Scale, Ref Level, 10, dBm.
Step 4. Place a marker on the 10 MHz peak and then set the center frequency
step size equal to the marker frequency (10 MHz):
Press Peak Search.
Press Marker →, Mkr → CF Step.
Step 5. Activate the marker delta function:
Press Marker, Delta.
Step 6. Increase the center frequency by 10 MHz:
Press FREQUENCY Channel, Center Freq, ↑.
The first marker moves to the left edge of the screen, at the amplitude
of the first signal peak.
Measuring Multiple Signals
Figure 2-5 shows the reference annotation for the delta marker (1R) at
the left side of the display, indicating that the 10 MHz reference signal
is at a lower frequency than the frequency range currently displayed.
The delta marker appears on the peak of the 20 MHz component. The
delta marker annotation displays the amplitude and frequency
difference between the 10 and 20 MHz signal peaks.
Figure 2-5
Delta Marker with Reference Signal Off-Screen (ESA)
Step 7. Turn the markers off:
Press Marker, Off.
16
Chapter 2
Measuring Multiple Signals
Resolving Signals of Equal Amplitude
Resolving Signals of Equal Amplitude
In this procedure a decrease in resolution bandwidth is used in
combination with a decrease in video bandwidth to resolve two signals
of equal amplitude with a frequency separation of 100 kHz. Notice that
the final RBW selection to resolve the signals is the same width as the
signal separation while the VBW is slightly narrower than the RBW.
Step 1. Connect two sources to the analyzer input as shown in Figure 2-6.
Figure 2-6
Setup for Obtaining Two Signals
300.1 MHz. Set both source amplitudes to −20 dBm. The amplitude of
both signals should be approximately −20 dBm at the output of the
bridge.
Step 3. Setup the analyzer to view the signals:
Press Preset, Factory Preset (if present).
Press FREQUENCY Channel, Center Freq, 300, MHz.
Press BW/Avg, Res BW, 300, kHz.
Press SPAN X Scale, Span, 2, MHz.
A single signal peak is visible. See Figure 2-7 for an ESA example.
NOTE
If the signal peak is not present on the display, span out to 20 MHz,
turn signal tracking on, span back to 2 MHz and turn signal tracking
off.:
Press SPAN, Span, 20, MHz.
Press Peak Search, FREQUENCY, Signal Track (On).
Press SPAN, 2, MHz.
Press FREQUENCY, Signal Track (Off)
Chapter 2
17
Measuring Multiple Signals
Step 2. Set one source to 300 MHz. Set the frequency of the other source to
Measuring Multiple Signals
Resolving Signals of Equal Amplitude
Figure 2-7
Unresolved Signals of Equal Amplitude (ESA)
Step 4. Change the resolution bandwidth (RBW) to 100 kHz so that the RBW
setting is less than or equal to the frequency separation of the two
signals:
Press BW/Avg, Res BW, 100, kHz.
Notice that the peak of the signal has become flattened indicating that
two signals may be present.
Measuring Multiple Signals
Step 5. Decrease the video bandwidth to 10 kHz:
Press Video BW, 10, kHz.
Two signals are now visible as shown with the ESA on the left side in
Figure 2-8 and the PSA on the right side. Use the front-panel knob or
step keys to further reduce the resolution bandwidth and better resolve
the signals.
Figure 2-8
Resolving Signals of Equal Amplitude (ESA left, PSA right)
18
Chapter 2
Measuring Multiple Signals
Resolving Signals of Equal Amplitude
As the resolution bandwidth is decreased, resolution of the individual
signals is improved and the sweep time is increased. For fastest
measurement times, use the widest possible resolution bandwidth.
Under factory preset conditions, the resolution bandwidth is “coupled”
(or linked) to the span.
Since the resolution bandwidth has been changed from the coupled
value, a # mark appears next to Res BW in the lower-left corner of the
screen, indicating that the resolution bandwidth is uncoupled. (For
more information on coupling, refer to the Auto Couple key description
in the Agilent Technologies ESA Spectrum Analyzers
User’s/Programmer’s Reference Guide and the PSA Spectrum
Analyzers User’s/Programmer’s Reference Guide.)
NOTE
To resolve two signals of equal amplitude with a frequency separation
of 200 kHz, the resolution bandwidth must be less than the signal
separation so a resolution bandwidth of 100 kHz must be used. (For
analyzers that use a 1-3-10 RBW step sequence, a 100 kHz RBW is the
best choice for signal separation, but for high performance analyzers,
like the PSA, a 180 kHz RBW can be selected by fine tuning the RBW
filters at 10% increments.) Filter widths above 200 kHz exceed the
200 kHz signal separation and would not resolve the signals.
Measuring Multiple Signals
Chapter 2
19
Measuring Multiple Signals
Resolving Small Signals Hidden by Large Signals
Resolving Small Signals Hidden by Large
Signals
This procedure uses narrow resolution bandwidths to resolve two input
signals with a frequency separation of 155 kHz and an amplitude
difference of 60 dB.
Step 1. Connect two sources to the analyzer input as shown in Figure 2-6.
Step 2. Set one source to 300 MHz at −10 dBm. Set the second source to
300.05 MHz, so that the signal is 50 kHz higher than the first signal.
Set the amplitude of the signal to −70 dBm (60 dB below the first
signal).
Step 3. Set the analyzer as follows:
Press Preset, Factory Preset (if present).
Press FREQUENCY Channel, Center Freq, 300, MHz.
Press BW/Avg, 30, kHz.
Press SPAN X Scale, Span, 500, kHz.
Measuring Multiple Signals
NOTE
If the signal peak is not present on the display, span out to 20 MHz,
turn signal tracking on, span back to 2 MHz and turn signal tracking
off:
Press SPAN, Span, 20, MHz.
Press Peak Search, FREQUENCY, Signal Track (On).
Press SPAN, 2, MHz.
Press FREQUENCY, Signal Track (Off).
Step 4. Set the 300 MHz signal to the reference level:
Press Peak Search, Mkr →, Mkr → Ref Lvl.
NOTE
The ESA 30 kHz filter shape factor of 15:1 (PSA is 4.1:1) has a
bandwidth of 450 kHz at the 60 dB point (PSA has a BW of 123 kHz).
The half-bandwidth (225 kHz for ESA and 61.5 kHz for PSA) is NOT
narrower than the frequency separation of 50 kHz, so the input signals
can not be resolved.
20
Chapter 2
Measuring Multiple Signals
Resolving Small Signals Hidden by Large Signals
Figure 2-9
Signal Resolution with a 30 kHz RBW (ESA left, PSA right)
Step 5. Reduce the resolution bandwidth filter to view the smaller hidden
signal. Place a delta marker on the smaller signal:
Press BW/Avg, 1, kHz.
Press Peak Search, Marker, 50, kHz.
The ESA 1 kHz filter shape factor of 15:1 (PSA is 4.1:1) has a
bandwidth of 15 kHz at the 60 dB point (PSA has a BW of 4.1 kHz). The
half-bandwidth (7.5 kHz for ESA and 2.05 kHz for PSA) is narrower
than 50 kHz, so the input signals can be resolved.
Figure 2-10
Signal Resolution with a 1 kHz RBW (ESA left, PSA right)
NOTE
To determine the resolution capability for intermediate amplitude
differences, assume the filter skirts between the 3 dB and 60 dB points
are parabolic, like an ideal Gaussian filter. The resolution capability is
approximately:
Measuring Multiple Signals
NOTE
∆f 2
12.04 dB • -------------
RBW
where ∆f is the separation between the signals.
Chapter 2
21
Measuring Multiple Signals
Decreasing the Frequency Span Around the Signal
Decreasing the Frequency Span Around the
Signal
Using the analyzer signal track function, you can quickly decrease the
span while keeping the signal at center frequency. This is a fast way to
take a closer look at the area around the signal to identify signals that
would otherwise not be resolved.
This procedure uses signal tracking and span zoom to view the analyzer
50 MHz reference signal in a 200 kHz span.
Step 1. Perform a factory preset:
Press Preset, Factory Preset (if present).
Step 2. Enable the internal 50 MHz amplitude reference signal of the analyzer
as follows:
(PSA)
Press Input/Output, Input Port, Amptd Ref.
(ESA E4401B and E4411B)
Press Input/Output, Amptd Ref (On).
Measuring Multiple Signals
(ESA E4402B, E4403B, E4404B, E4405B, E4407B and E4408B)
Connect a cable from the front panel AMPTD REF OUT to the analyzer
RF input:
Press Input/Output, Amptd Ref Out (On).
Step 3. Set the start frequency to 20 MHz and the stop frequency to 1 GHz:
Press FREQUENCY Channel, Start Freq, 20, MHz.
Press FREQUENCY Channel, Stop Freq, 1, GHz.
Step 4. Place a marker at the peak:
Press Peak Search.
Step 5. Turn on the signal tracking function to move the signal to the center of
the screen (if it is not already positioned there):
Press FREQUENCY Channel, Signal Track (On).
See the left-side of figure Figure 2-11. (Note that the marker must be on
the signal before turning signal track on.)
NOTE
Because the signal track function automatically maintains the signal at
the center of the screen, you can reduce the span quickly for a closer
look. If the signal drifts off of the screen as you decrease the span, use a
wider frequency span. (You can also use Span Zoom, in the SPAN menu,
as a quick way to perform the Peak Search, FREQUENCY, Signal Track,
SPAN key sequence.)
22
Chapter 2
Measuring Multiple Signals
Decreasing the Frequency Span Around the Signal
Step 6. Reduce span and resolution bandwidth to zoom in on the marked
signal:
Press SPAN X Scale, Span, 200, kHz.
If the span change is large enough, the span decreases in steps as
automatic zoom is completed. See Figure 2-11 on the right side. You can
also use the front-panel knob or step keys to decrease the span and
resolution bandwidth values.
NOTE
Step 7. Turn off signal tracking:
Press FREQUENCY Channel, Signal Track (Off).
Figure 2-11
Signal Tracking
Measuring Multiple Signals
LEFT: Signal tracking on before span decrease
RIGHT: After zooming in on the signal
Chapter 2
23
Measuring Multiple Signals
Measuring Multiple Signals
Decreasing the Frequency Span Around the Signal
24
Chapter 2
Measuring a Low−Level Signal
Measuring a Low−Level Signal
3
25
Measuring a Low−Level Signal
Reducing Input Attenuation
Reducing Input Attenuation
The ability to measure a low-level signal is limited by internally
generated noise in the spectrum analyzer. The measurement setup can
be changed in several ways to improve the analyzer sensitivity.
The input attenuator affects the level of a signal passing through the
instrument. If a signal is very close to the noise floor, reducing input
attenuation can bring the signal out of the noise.
Ensure that the total power of all input signals at the analyzer RF
input does not exceed +30 dBm (1 watt).
CAUTION
Step 1. Preset the analyzer:
Press Preset, Factory Preset (if present).
Step 2. Set the frequency of the signal source to 300 MHz. Set the source
amplitude to −80 dBm. Connect the source RF OUTPUT to the analyzer
RF INPUT.
Step 3. Set the center frequency, span and reference level:
Press FREQUENCY Channel, Center Freq, 300, MHz.
Press SPAN X Scale, Span, 5, MHz.
Press AMPLITUDE Y Scale, Ref Level, 40, −dBm.
Step 4. Move the desired peak (in this example, 300 MHz) to the center of the
display:
Press Peak Search, Marker ➞, Mkr ➞ CF.
Step 5. Reduce the span to 1 MHz (as shown in Figure 3-1) and if necessary
re-center the peak:
Press Span, 1, MHz.
Measuring a Low-Level Signal (ESA Display)
Measuring a Low−Level Signal
Figure 3-1
26
Chapter 3
Measuring a Low−Level Signal
Reducing Input Attenuation
Step 6. Set the attenuation to 20 dB:
Press AMPLITUDE Y Scale, Attenuation, 20, dB.
Note that increasing the attenuation moves the noise floor closer to the
signal level.
A “#” mark appears next to the Atten annotation at the top of the
display, indicating that the attenuation is no longer coupled to other
analyzer settings.
Step 7. To see the signal more clearly, set the attenuation to 0 dB:
Press AMPLITUDE, Attenuation, 0, dB.
See Figure 3-2 shows 0 dB input attenuation.
Figure 3-2
Measuring a Low-Level Signal Using 0 dB Attenuation (ESA)
CAUTION
When you finish this example, increase the attenuation to protect the
analyzer’s RF input:
Press AMPLITUDE Y Scale, Attenuation (Auto) or press Auto Couple.
NOTE
All figures in this chapter are screen captures from an ESA. Display
and numerical results may be different for a PSA.
Measuring a Low−Level Signal
Chapter 3
27
Measuring a Low−Level Signal
Decreasing the Resolution Bandwidth
Decreasing the Resolution Bandwidth
Resolution bandwidth settings affect the level of internal noise without
affecting the level of continuous wave (CW) signals. Decreasing the
RBW by a decade reduces the noise floor by 10 dB.
Step 1. Refer to the first procedure “Reducing Input Attenuation” on page 26 of
this chapter and follow steps 1, 2 and 3.
Step 2. Decrease the resolution bandwidth:
Press BW/Avg, ↓.
The low-level signal appears more clearly because the noise level is
reduced (see Figure 3-3).
Figure 3-3
Decreasing Resolution Bandwidth
A “#” mark appears next to the Res BW annotation in the lower left
corner of the screen, indicating that the resolution bandwidth is
uncoupled.
Measuring a Low−Level Signal
RBW Selections
You can use the step keys to change the RBW in a 1−3−10 sequence.
For ESA, RBWs below 1 kHz are digital and have a selectivity ratio of
5:1 while RBWs at 1 kHz and higher have a 15:1 selectivity ratio. The
ESA’s maximum RBW is 5 MHz and the minimum is 1 Hz (optional).
All PSA RBWs are digital and have a selectivity ratio of 4.1:1. For PSA,
choosing the next lower RBW for better sensitivity increases the sweep
time by about 10:1 for swept measurements, and about 3:1 for FFT
measurements (within the limits of RBW). Using the knob or keypad,
you can select RBWs from 1 Hz to 3 MHz in approximately 10%
increments, plus 4, 5, 6 and 8 MHz. This enables you to make the trade
off between sweep time and sensitivity with finer resolution.
28
Chapter 3
Measuring a Low−Level Signal
Using the Average Detector and Increased Sweep Time
Using the Average Detector and
Increased Sweep Time
When the analyzer’s noise masks low-level signals, changing to the
average detector and increasing the sweep time smooths the noise and
improves the signal’s visibility. Slower sweeps are required to average
more noise variations.
Step 1. Refer to the first procedure “Reducing Input Attenuation” on page 26 of
this chapter and follow steps 1, 2 and 3.
Step 2. Select the average detector:
Press Det/Demod, Detector, Average.
A “#” mark appears next to the Avg annotation, indicating that the
detector has been chosen manually (see Figure 3-4).
Step 3. Increase the sweep time to 100 ms:
Press Sweep, Sweep Time, ↑.
Note how the noise smooths out, as there is more time to average the
values for each of the displayed data points.
Step 4. With the sweep time at 100 ms, change the average type to
log averaging:
(ESA) Press BW/Avg, Avg Type, Video Avg.
(PSA) Press BW/Avg, Avg/VBW Type, Log-Pwr.
Figure 3-4
Varying the Sweep Time with the Average Detector
Measuring a Low−Level Signal
Chapter 3
29
Measuring a Low−Level Signal
Trace Averaging
Trace Averaging
Averaging is a digital process in which each trace point is averaged with
the previous average for the same trace point. Selecting averaging,
when the analyzer is autocoupled, changes the detection mode (from
peak in ESA and normal in PSA) to sample, smoothing the displayed
noise level. ESA sample mode displays the instantaneous value of the
signal at the end of the time or frequency interval represented by each
display point (for PSA it is the center of the time or frequency interval),
rather than the value of the peak during the interval. Sample mode
may not measure a signal’s amplitude as accurately as normal mode,
because it may not find the true peak.
NOTE
This is a trace processing function and is not the same as using the
average detector (as described on page 29).
Step 1. Refer to the first procedure “Reducing Input Attenuation” on page 26 of
this chapter and follow steps 1, 2 and 3.
Step 2. Turn video averaging on:
Press BW/Avg, Average (On).
As the averaging routine smooths the trace, low level signals become
more visible. Average 100 appears in the active function block.
Step 3. With average as the active function, set the number of averages to 25:
Press 25, Enter.
Annotation on the left side of the graticule shows the type of averaging
(the annotation for ESA is VAvg and is LgAv for PSA), and the number
of traces averaged.
Changing most active functions restarts the averaging, as does toggling
the Average key. Once the set number of sweeps completes, the analyzer
continues to provide a running average based on this set number.
Measuring a Low−Level Signal
NOTE
If you want the measurement to stop after the set number of sweeps,
use single sweep: Press Sweep, Sweep (to select Single), or press Single
and then toggle the Average key.
30
Chapter 3
Improving Frequency Resolution
and Accuracy
4
Improving Frequency Resolution
and Accuracy
31
Improving Frequency Resolution
and Accuracy
Improving Frequency Resolution and Accuracy
Using a Frequency Counter to Improve Frequency Resolution and Accuracy
Using a Frequency Counter to Improve
Frequency Resolution and Accuracy
This procedure uses the spectrum analyzer internal frequency counter
to increase the resolution and accuracy of the frequency readout.
Step 1. Preset the analyzer:
Press Preset, Factory Preset (if present).
Step 2. Enable the internal 50 MHz amplitude reference signal as follows:
(PSA)
Press Input/Output, Input Port, Amptd Ref.
(ESA E4401B and E4411B)
Press Input/Output, Amptd Ref (On).
(ESA E4402B, E4403B, E4404B, E4405B, E4407B and E4408B)
Connect a cable from the front panel AMPTD REF OUT to the analyzer
RF input:
Press Input/Output, Amptd Ref Out (On).
Step 3. Set the center frequency to 50 MHz and the span to 80 MHz:
Press FREQUENCY Channel, Center Freq, 50, MHz.
Press SPAN X Scale, Span, 80, MHz.
Step 4. Turn the frequency counter on:
(ESA) Press Freq Count.
(PSA) Press Marker Fctn, Marker Count, Marker Count (On).
NOTE
The frequency and amplitude of the marker and the word Marker
appears in the active function area (this is not the counted result). The
counted result appears in the upper-right corner of the display to the
right-side of Cntr1.
Step 5. Move the marker, with the front-panel knob, half-way down the skirt of
the signal response.
Notice that the readout in the active frequency function changes while
the counted frequency result (upper-right corner of display) does not.
See Figure 4-1. To get an accurate count, you do not need to place the
marker at the exact peak of the signal response.
NOTE
Marker count properly functions only on CW signals or discrete spectral
components. The marker must be > 25 dB above the displayed noise
level.
32
Chapter 4
Figure 4-1
Using Marker Counter (ESA Display)
Step 6. Change counter resolution:
ESA frequency-counter resolution can be set from 1 Hz to 100 kHz by
pressing Freq Count, Resolution.
PSA frequency-counter resolution is fixed at 0.001 Hz for 2 ms and
longer gate times. Longer gate times allow for greater averaging of
signals whose frequency is "noisy", at the expense of throughput.
NOTE
For PSA, if the Gate Time (under the Marker Count menu) is an integer
multiple of the length of a power-line cycle (20 ms for 50 Hz power,
16.67 ms for 60 Hz power), the counter rejects incidental modulation at
the power line rate. The shortest Gate Time that rejects both 50 and 60
Hz modulation is 100 ms (100 ms is the default Gate Time setting when
set to Auto).
Step 7. The marker counter remains on until turned off. Turn off the marker
counter:
(ESA) Press Freq Count, Marker Count (Off). Or Press Marker, Off.
(PSA) Press Marker Fctn, Marker Count, Marker Count (Off). Or Press
Marker, Off.
NOTE
When using the built-in frequency counter function with the ESA, if the
ratio of the resolution bandwidth to the span is too small (less than or
equal to 0.002), the Marker Count: Widen Res BW message appears on
the display. It indicates that the resolution bandwidth is too narrow.
Chapter 4
33
Improving Frequency Resolution
and Accuracy
Improving Frequency Resolution and Accuracy
Using a Frequency Counter to Improve Frequency Resolution and Accuracy
Improving Frequency Resolution
and Accuracy
Improving Frequency Resolution and Accuracy
Using a Frequency Counter to Improve Frequency Resolution and Accuracy
34
Chapter 4
Tracking Drifting Signals
5
Tracking Drifting Signals
35
Tracking Drifting Signals
Measuring a Source’s Frequency Drift
Measuring a Source’s Frequency Drift
The analyzer can measure the short- and long-term stability of a
source. The maximum amplitude level and the frequency drift of an
input signal trace can be displayed and held by using the
maximum-hold function. You can also use the maximum hold function if
you want to determine how much of the frequency spectrum a signal
occupies.
Tracking Drifting Signals
This procedure using signal tracking to keep the drifting signal in the
center of the display. The drifting is captured by the analyzer using
maximum hold.
Step 1. Connect the signal generator to the analyzer input.
Step 2. Set the signal generator frequency to 300 MHz with an amplitude of
−20 dBm.
Step 3. Set the analyzer center frequency, span and reference level.
Press Preset, Factory Preset (if present).
Press FREQUENCY Channel, Center Freq, 300, MHz.
Press SPAN X Scale, Span, 10, MHz.
Press AMPLITUDE Y Scale, Ref Level, 10, −dBm.
Step 4. Place a marker on the peak of the signal and turn signal tracking on:
Press Peak Search.
Press FREQUENCY Channel, Signal Track (On).
Reduce the span to 500 kHz:
Press SPAN, Span Zoom, 500, kHz.
Notice that the signal is held in the center of the display.
Step 5. Turn off the signal track function:
Press FREQUENCY Channel, Signal Track (Off).
Step 6. Measure the excursion of the signal with maximum hold:
(ESA) Press View/Trace, Max Hold.
(PSA) Press Trace/View, Max Hold.
As the signal varies, maximum hold maintains the maximum responses
of the input signal.
NOTE
Annotation on the left side of the screen indicates the trace mode. For
example, M1 S2 S3 indicates trace 1 is in maximum-hold mode, trace 2
and trace 3 are in store-blank mode.
36
Chapter 5
Tracking Drifting Signals
Measuring a Source’s Frequency Drift
Step 7. Activate trace 2 (trace 2 should be underlined) and change the mode to
continuous sweeping:
(ESA) Press View/Trace, Trace (2).
(PSA) Press Trace/View, Trace (2).
Press Clear Write.
Trace 1 remains in maximum hold mode to show any drift in the signal.
Step 8. Slowly change the frequency of the signal generator ± 50 kHz in 1 kHz
increments. Your analyzer display should look similar to Figure 5-1.
Viewing a Drifting Signal With Max Hold and Clear Write
Chapter 5
Tracking Drifting Signals
Figure 5-1
37
Tracking Drifting Signals
Tracking a Signal
Tracking a Signal
Tracking Drifting Signals
The signal track function is useful for tracking drifting signals that
drift relatively slowly by keeping the signal centered on the display as
the signal drifts. This procedure tracks a drifting signal.
Note that the primary function of the signal track function is to track
unstable signals, not to track a signal as the center frequency of the
analyzer is changed. If you choose to use the signal track function when
changing center frequency, check to ensure that the signal found by the
tracking function is the correct signal.
Step 1. Set the source frequency to 300 MHz with an amplitude of −20 dBm.
Step 2. Set the analyzer center frequency at a 1 MHz offset:
Press Preset, Factory Preset (if present).
Press FREQUENCY Channel, Center Freq, 301, MHz.
Press SPAN X Scale, Span, 10, MHz.
Step 3. Turn the signal tracking function on:
Press FREQUENCY Channel, Signal Track (On).
Notice that signal tracking places a marker on the highest amplitude
peak and then brings the selected peak to the center of the display.
After each sweep the center frequency of the analyzer is adjusted to
keep the selected peak in the center.
Step 4. Turn the delta marker on to read signal drift:
Press Marker, Delta.
Step 5. Tune the frequency of the signal generator in 100 kHz increments.
Notice that the center frequency of the analyzer also changes in
100 kHz increments, centering the signal with each increment.
Figure 5-2
Tracking a Drifting Signal (ESA left, PSA right)
38
Chapter 5
Making Distortion Measurements
6
Making Distortion
Measurements
39
Making Distortion Measurements
Identifying Analyzer Generated Distortion
Identifying Analyzer Generated Distortion
High level input signals may cause analyzer distortion products that
could mask the real distortion measured on the input signal. Using
trace 2 and the RF attenuator, you can determine which signals, if any,
are internally generated distortion products.
Using a signal from a signal generator, determine whether the
harmonic distortion products are generated by the analyzer.
Step 1. Connect the signal generator to the analyzer input.
Step 2. Set the source frequency to 200 MHz with an amplitude of 0 dBm.
Step 3. Set the analyzer center frequency and span:
Press Preset, Factory Preset (if present).
Press FREQUENCY Channel, Center Freq, 400, MHz.
Press SPAN X Scale, Span, 500, MHz.
The signal produces harmonic distortion products (spaced 200 MHz
from the original 200 MHz signal) in the analyzer input mixer as shown
in Figure 6-1.
Harmonic Distortion (ESA left, PSA right)
Making Distortion Measurements
Figure 6-1
Step 4. Change the center frequency to the value of the first harmonic:
Press Peak Search, Next Peak, Marker→, Mkr→CF.
Step 5. Change the span to 50 MHz and re-center the signal:
Press SPAN X Scale, Span, 50, MHz.
Press Peak Search, Marker→, Mkr→CF.
Step 6. Set the attenuation to 0 dB:
Press AMPLITUDE Y Scale, Attenuation, 0, dB.
40
Chapter 6
Making Distortion Measurements
Identifying Analyzer Generated Distortion
Step 7. To determine whether the harmonic distortion products are generated
by the analyzer, first save the trace data in trace 2 as follows:
(ESA) Press View/Trace, Trace (2), Clear Write.
(PSA) Press Trace/View, Trace (2), Clear Write.
Step 8. Allow trace 2 to update (minimum two sweeps), then store the data
from trace 2 and place a delta marker on the harmonic of trace 2:
Press View.
Press Peak Search, Marker, Delta.
The analyzer display shows the stored data in trace 2 and the measured
data in trace 1. The ∆Mkr1 amplitude reading is the difference in
amplitude between the reference and active markers.
Step 9. Increase the RF attenuation to 10 dB:
Press AMPLITUDE Y Scale, Attenuation, 10, dB.
Notice the ∆Mkr1 amplitude reading. This is the difference in the
distortion product amplitude readings between 0 dB and 10 dB input
attenuation settings. If the ∆Mkr1 amplitude absolute value is
approximately ≥1 dB for an input attenuator change, the distortion is
being generated, at least in part, by the analyzer. In this case more
input attenuation is necessary. See Figure 6-2.
RF Attenuation of 10 dB
Making Distortion Measurements
Figure 6-2
The ∆Mkr1 amplitude reading comes from two sources:
1) Increased input attenuation causes poorer signal-to-noise ratio. This
can cause the ∆Mkr1 to be positive.
2) The reduced contribution of the analyzer circuits to the harmonic
measurement can cause the ∆Mkr1 to be negative.
Large ∆Mkr1 measurements indicate significant measurement errors.
Set the input attenuator to minimize the absolute value of ∆Mkr1.
Chapter 6
41
Making Distortion Measurements
Third-Order Intermodulation Distortion
Third-Order Intermodulation Distortion
Two-tone, third-order intermodulation distortion is a common test in
communication systems. When two signals are present in a non-linear
system, they can interact and create third-order intermodulation
distortion products that are located close to the original signals. These
distortion products are generated by system components such as
amplifiers and mixers.
For the quick setup TOI measurement example, refer to “Measuring
TOI Distortion with a One-Button Measurement” on page 44.
This procedure tests a device for third-order intermodulation using
markers. Two sources are used, one set to 300 MHz and the other to
301 MHz.
Making Distortion Measurements
Step 1. Connect the equipment as shown in Figure 6-3. This combination of
signal generators, low pass filters, and directional coupler (used as a
combiner) results in a two-tone source with very low intermodulation
distortion. Although the distortion from this setup may be better than
the specified performance of the analyzer, it is useful for determining
the TOI performance of the source/analyzer combination. After the
performance of the source/analyzer combination has been verified, the
device-under-test (DUT) (for example, an amplifier) would be inserted
between the directional coupler output and the analyzer input.
Figure 6-3
Third-Order Intermodulation Equipment Setup
NOTE
The coupler should have a high degree of isolation between the two
input ports so the sources do not intermodulate.
Step 2. Set one source (signal generator) to 300 MHz and the other source to
301 MHz, for a frequency separation of 1 MHz. Set the sources equal in
amplitude as measured by the analyzer (in this example, they are set to
−5 dBm).
42
Chapter 6
Making Distortion Measurements
Third-Order Intermodulation Distortion
Step 3. Set the analyzer center frequency and span:
Press Preset, Factory Preset (if present).
Press FREQUENCY Channel, Center Freq, 300.5, MHz.
Press SPAN X Scale, Span, 5, MHz.
Step 4. Reduce the RBW until the distortion products are visible:
Press BW/Avg, Res BW, ↓.
Step 5. Set the mixer level to improve dynamic range:
(ESA) Press AMPLITUDE Y Scale, More, Max Mixer Lvl, –30, dBm.
(PSA) Press AMPLITUDE Y Scale, More, More, Max Mixer Lvl, –30, dBm.
The analyzer automatically sets the attenuation so that a signal at the
reference level has a maximum value of −30 dBm at the input mixer.
Step 6. Move the signal to the reference level:
Press Peak Search, Mkr →, Mkr → Ref Lvl.
Step 7. Reduce the RBW until the distortion products are visible:
Press BW/Avg, Res BW, ↓.
Step 8. Activate the second marker and place it on the peak of the distortion
product (beside the test signal) using the Next Peak key.
Making Distortion Measurements
Press Marker, Delta, Peak Search, Next Peak.
Step 9. Measure the other distortion product:
Press Marker, Normal, Peak Search, Next Peak.
Step 10. Measure the difference between this test signal and the second
distortion product (see Figure 6-4):
Press Delta, Peak Search, Next Peak.
Figure 6-4
Measuring the Distortion Product
Chapter 6
43
Making Distortion Measurements
Measuring TOI Distortion with a One-Button Measurement
Measuring TOI Distortion with a One-Button
Measurement
One-button power measurements are a part of the Power Suite
measurement utility and are standard on all ESA and PSA models.
Power Suite uses preset analyzer states to measure some of the more
common RF power tests. You can modify the preset states in the Power
Suite measurements, giving you the flexibility to modify analyzer
settings. Power Suite also has preset states for cellular, Bluetooth and
WiFi radio formats for fast, accurate and repeatable measurements.
This procedure uses the intermodulation one-button test from the
Power Suite Measure menu to automate the TOI measurement. It is
measuring the TOI performance as in the previous procedure
“Third-Order Intermodulation Distortion” on page 42.
Step 1. Refer to the second procedure “Third-Order Intermodulation
Distortion” on page 42 of this chapter and follow steps 1 and 2.
Step 2. Set the analyzer center frequency to 300.5 MHz:
Making Distortion Measurements
Press Preset, Factory Preset (if present).
Press FREQUENCY Channel, Center Freq, 300.5, MHz.
Step 3. Measure the intermodulation products using the Power Suite
measurement tools:
Press Measure, More, Intermod (TOI).
Figure 6-5
Measuring the Distortion Products with Power Suite
44
Chapter 6
Making Distortion Measurements
Measuring Harmonics and Harmonic Distortion with a One-Button
Measurement
Measuring Harmonics and Harmonic
Distortion with a One-Button Measurement
This procedure measures the harmonics of the 10 MHz reference output
signal. The harmonics and total harmonic distortion are measured
using the one-button automated harmonic measurement.
Step 1. Preset the analyzer:
Press Preset, Factory Preset (if present).
Step 2. Connect the ESA 10 MHz reference output from the rear of the
analyzer to the INPUT. For PSA turn the internal 10 MHz reference
signal on:
(PSA) Press System, Reference, 10MHz Out (On).
Step 3. Set the analyzer reference level, center frequency and RBW:
Press AMPLITUDE Y Scale, Ref Level, 10, dBm.
Press FREQUENCY Channel, Center Freq, 10, MHz.
Press BW/Avg, Res BW, 300, kHz.
Step 4. Run the Power Suite harmonic distortion measurement:
Step 5. Set the number of harmonic distortion measurement averages to 3:
Press Meas Setup, Avg Number (On), 3, Enter
Step 6. Set the average mode to exponential to continuously update the result
after each subsequent sweep:
Press Meas Setup, Avg Mode (Exp).
Repeat average mode clears the averaged result after the specified
number of averages is complete.
Step 7. Optimize the analyzer’s dynamic range settings:
Press Meas Setup, Optimize Ref Level.
Step 8. Display the total harmonic distortion:
(ESA) Press View/Trace, Harmonics & THD.
(ESA) Press Trace/View, Harmonics & THD.
Chapter 6
45
Making Distortion Measurements
Press Measure, More, Harmonic Distortion.
Making Distortion Measurements
Measuring Harmonics and Harmonic Distortion with a One-Button
Measurement
Figure 6-6
Measuring the Harmonic Distortion
The amplitudes of the harmonics are listed relative to the fundamental
frequency.
Making Distortion Measurements
NOTE
An asterisk (*) appearing next to the total harmonic distortion value
indicates that the ideal resolution bandwidths for one or more
harmonics could not be set. These harmonics for which the resolution
bandwidths could not be set are flagged with an asterisk beside their
amplitude value. The measurement is still accurate as long as the
signal has little or no modulation.
Step 9. Exit out of the harmonic distortion measurement:
Press MEASURE, Meas Off.
46
Chapter 6
7
Measuring Noise
Measuring Noise
47
Measuring Noise
Measuring Signal-to-Noise
Measuring Signal-to-Noise
Signal-to-noise is a ratio used in many communication systems as an
indication of noise in a system. Typically the more signals added to a
system adds to the noise level, reducing the signal-to-noise ratio
making it more difficult for modulated signals to be demodulated. This
measurement is also referred to as carrier-to-noise in some
communication systems.
The signal-to-noise measurement procedure below may be adapted to
measure any signal in a system if the signal (carrier) is a discrete tone.
If the signal in your system is modulated, it is necessary to modify the
procedure to correctly measure the modulated signal level.
In this example the 50 MHz amplitude reference signal is used as the
fundamental signal. The amplitude reference signal is assumed to be
the signal of interest and the internal noise of the analyzer is measured
as the system noise. To do this, you need to set the input attenuator
such that both the signal and the noise are well within the calibrated
region of the display.
Step 1. Preset the analyzer:
Press Preset, Factory Preset (if present).
Step 2. Enable the internal 50 MHz amplitude reference signal as follows:
(PSA)
Press Input/Output, Input Port, Amptd Ref.
(ESA E4401B and E4411B)
Press Input/Output, Amptd Ref (On).
(ESA E4402B, E4403B, E4404B, E4405B, E4407B and E4408B)
Connect a cable from the front panel AMPTD REF OUT to the analyzer
RF input:
Press Input/Output, Amptd Ref Out (On).
Step 3. Set the center frequency, span, reference level and attenuation:
Measuring Noise
Press FREQUENCY Channel, Center Freq, 50, MHz.
Press SPAN X Scale, Span, 1, MHz.
Press AMPLITUDE Y Scale, Ref Level, −10, dBm.
Press AMPLITUDE Y Scale, Attenuation, 40, dB.
Step 4. Place a marker on the peak of the signal and then place a delta marker
in the noise at a 200 kHz offset:
Press Peak Search.
Press Marker, Delta, 200, kHz.
Step 5. Turn on the marker noise function to view the signal-to-noise
48
Chapter 7
Measuring Noise
Measuring Signal-to-Noise
measurement results:
(ESA) Press Marker, More, Function, Marker Noise.
(PSA) Press Marker Fctn, Marker Noise.
Figure 7-1
Measuring the Signal-to-Noise
Read the signal-to-noise in dB/Hz, that is with the noise value
determined for a 1 Hz noise bandwidth. If you wish the noise value for a
different bandwidth, decrease the ratio by 10 × log ( BW ) . For example, if
the analyzer reading is −70 dB/Hz but you have a channel bandwidth of
30 kHz:
S/N = –70 dB/Hz + 10 × log ( 30 kHz ) = – 25.23 dB ⁄ ( 30 kHz )
NOTE
The display detection mode is now average. If the delta marker is closer
than one quarter of a division away from the edge of the response to the
discrete signal, the amplitude reference signal in this case, there is a
potential for error in the noise measurement. See “Measuring Noise
Using the Noise Marker” on page 50.
Measuring Noise
Chapter 7
49
Measuring Noise
Measuring Noise Using the Noise Marker
Measuring Noise Using the Noise Marker
This procedure uses the marker function, Marker Noise, to measure
noise in a 1 Hz bandwidth. In this example the noise marker
measurement is made near the 50 MHz reference signal to illustrate
the use of Marker Noise.
Step 1. Enable the internal 50 MHz reference signal of the analyzer:
(PSA)
Press Input/Output, Input Port, Amptd Ref.
(ESA E4401B and E4411B)
Press Input/Output, Amptd Ref (On).
(ESA E4402B, E4403B, E4404B, E4405B, E4407B and E4408B)
Connect a cable from the front panel AMPTD REF OUT to the INPUT:
Press Input/Output, Amptd Ref Out (On).
Step 2. Preset the analyzer and modify the analyzer settings:
Press Preset, Factory Preset (if present).
Press FREQUENCY Channel, Center Freq, 49.98, MHz.
Press SPAN X Scale, Span, 100, kHz.
Press AMPLITUDE Y Scale, Ref Level, −10, dBm.
Press AMPLITUDE Y Scale, Attenuation, 40, dB.
Step 3. Activate the noise marker:
(ESA) Press Marker, More, Function, Marker Noise.
(PSA) Press Marker Fctn, Marker Noise.
Note that display detection automatically changes to “Avg”; average
detection calculates the noise marker from an average value of the
displayed noise. Notice that the noise marker floats between the
maximum and the minimum displayed noise points. The marker
readout is in dBm (1 Hz) or dBm per unit bandwidth.
For noise power in a different bandwidth, add 10 × log ( BW ) . For example,
for noise power in a 1 kHz bandwidth, dBm (1 kHz), add 10 × log ( 1000 ) or
30 dB to the noise marker value.
Measuring Noise
NOTE
ESA average detection is available for firmware revisions A.08.00 and
later. Earlier firmware revisions earlier use sample detection for
marker noise calculations.
Step 4. Reduce the variations of the sweep-to-sweep marker value by
increasing the sweep time:
Press Sweep, Sweep Time, 3, s.
50
Chapter 7
Measuring Noise
Measuring Noise Using the Noise Marker
Increasing the sweep time when the average detector is enabled allows
the trace to average over a longer time interval, thus reducing the
variations in the results (increases measurement repeatability).
Step 5. Move the marker to 50 MHz (left display Figure 7-2):
Press Marker.
Rotate the front-panel knob until the noise marker reads 50 MHz.
The noise marker value is based on the mean of 5% of the total number
of sweep points centered at the marker. The points that are averaged
span one-half of a division. Notice that the marker does not go to the
peak of the signal because there are not enough points at the peak of
the signal. The noise marker is also averaging points below the peak
due to the narrow RBW.
Step 6. Widen the resolution bandwidth to allow the marker to make a more
accurate peak power measurement using the noise marker:
Press BW/Avg, Res BW, 10, kHz.
Press Marker.
Figure 7-2
Noise Marker (Left - ESA 1 kHz RBW, Right - PSA 10 kHz RBW))
Step 7. Set the analyzer to zero span at the marker frequency:
Press Mkr →, Mkr → CF.
Press SPAN X Scale, Zero Span.
Press Marker.
Remember that the noise marker calculates a value based on an
average of the points around the frequency of interest. Generally when
making power measurements using the noise marker on discrete
signals, first tune to the frequency of interest and then make your
measurement in zero span (time-domain).
Chapter 7
51
Measuring Noise
Note that the marker amplitude value is now correct since all points
averaged are at the same frequency and not influenced by the shape of
the bandwidth filter.
Measuring Noise
Measuring Noise-Like Signals Using Marker Pairs
Measuring Noise-Like Signals Using Marker
Pairs
Marker pairs let you measure power over a frequency span. The
markers allow you to easily and conveniently select any arbitrary
portion of the displayed signal. However, while the analyzer, when
autocoupled, makes sure the analysis is power-responding (rms
voltage-responding), you must set all of the other parameters.
Step 1. Preset the analyzer:
Press Preset, Factory Preset (if present).
Step 2. Set the center frequency, span, reference level and attenuation:
Press FREQUENCY Channel, Center Freq, 50, MHz.
Press SPAN X Scale, Span, 100, kHz.
Press AMPLITUDE Y Scale, Ref Level, −20, dBm.
Press AMPLITUDE Y Scale, Attenuation, 40, dB.
Step 3. Turn on the marker span pair to setup the band power measurement in
step 5:
Press Marker, Span Pair, Span Pair (Span), 40, kHz.
Step 4. Set the resolution and video bandwidths:
Press BW/Avg, Res BW, 1, kHz.
Press BW/Avg, Video BW, 10, kHz.
Common practice is to set the resolution bandwidth from 1% to 3% of
the measurement (marker) span, 40 kHz in this example. For ESA, the
video bandwidth should be at least ten times wider than the resolution
bandwidth.
Step 5. Measure the total noise power between the markers:
(ESA) Marker, More, Function, Band Power.
(PSA) Marker Fctn, Band/Intvl.
Step 6. Add a discrete tone to see the effects on the reading. Enable the internal
50 MHz amplitude reference signal of the analyzer as follows:
Measuring Noise
(PSA)
Press Input/Output, Input Port, Amptd Ref.
(ESA E4401B and E4411B)
Press Input/Output, Amptd Ref (On).
(ESA E4402B, E4403B, E4404B, E4405B, E4407B and E4408B)
Connect a cable from the front panel AMPTD REF OUT to the analyzer
RF input:
Press Input/Output, Amptd Ref Out (On).
52
Chapter 7
Measuring Noise
Measuring Noise-Like Signals Using Marker Pairs
Figure 7-3
Band Power Marker Power Measurement (ESA left, PSA right)
Step 7. Set the marker span pair to Center to move the markers (set at 40 kHz
span) around without changing the span. Use the front-panel knob to
move the band power markers and note the change in the power
reading:
Press Marker, Span Pair (Center), then rotate front-panel knob.
NOTE
You can also use Delta Pair to set the measurement start and stop points
independently.
Measuring Noise
Chapter 7
53
Measuring Noise
Measuring Noise-Like Signals Using the Channel Power Measurement
Measuring Noise-Like Signals Using the
Channel Power Measurement
You may want to measure the total power of a noise-like signal that
occupies some bandwidth. Typically, channel power measurements are
used to measure the total (channel) power in a selected bandwidth for a
modulated (noise-like) signal. Alternatively, to manually calculate the
channel power for a modulated signal, use the noise marker value and
add 10 × log ( channel BW ) . However, if you are not certain of the
characteristics of the signal, or if there are discrete spectral components
in the band of interest, you can use the channel power measurement.
This example uses the noise of the analyzer, adds a discrete tone, and
assumes a channel bandwidth of 50 kHz. If desired, a specific signal
may be substituted.
Step 1. Preset the analyzer:
Press Preset, Factory Preset (if present).
Step 2. Set the center frequency:
Press FREQUENCY Channel, Center Freq, 50, MHz.
Step 3. Start the channel power measurement:
Press MEASURE, Channel Power.
Step 4. Configure the display to show the combined spectrum view with
channel power limits (span highlighted in blue):
(ESA) Press View/Trace, Combined.
(PSA) Press Trace/View, Combined.
Step 5. Turn averaging on:
Press Meas Setup, Avg Number (On).
Step 6. Add a discrete tone to see the effects on the reading. Enable the internal
50 MHz amplitude reference signal of the analyzer as follows:
(PSA)
Press Input/Output, Input Port, Amptd Ref.
Measuring Noise
(ESA E4401B and E4411B)
Press Input/Output, Amptd Ref (On).
(ESA E4402B, E4403B, E4404B, E4405B, E4407B and E4408B)
Connect a cable from the front panel AMPTD REF OUT to the analyzer
RF input:
Press Input/Output, Amptd Ref Out (On).
54
Chapter 7
Measuring Noise
Measuring Noise-Like Signals Using the Channel Power Measurement
Step 7. Optimize the analyzer reference level setting:
Press Meas Setup, Optimize Ref Level.
Your display should be similar to Figure 7-4.
Figure 7-4
Measuring Channel Power (ESA left, PSA right)
The power reading is essentially that of the tone; that is, the total noise
power is far enough below that of the tone that the noise power
contributes very little to the total.
The algorithm that computes the total power works equally well for
signals of any statistical variant, whether tone-like, noise-like, or
combination.
Measuring Noise
Chapter 7
55
Measuring Noise
Measuring Noise
Measuring Noise-Like Signals Using the Channel Power Measurement
56
Chapter 7
Making Time-Gated Measurements
8
Making Time-Gated
Measurements
57
Making Time-Gated Measurements
Making Time-Gated Measurements
Generating a Pulsed-RF FM Signal
Generating a Pulsed-RF FM Signal
Traditional frequency-domain spectrum analysis provides only limited
information for certain signals. Examples of these difficult-to-analyze
signal include the following:
•
•
•
•
•
Pulsed-RF
Time multiplexed
Interleaved or intermittent
Time domain multiple access (TDMA) radio formats
Modulated burst
The time gating measurement examples use a simple
frequency-modulated, pulsed-RF signal. The goal is to eliminate the
pulse spectrum and then view the spectrum of the FM carrier as if it
were continually on, rather than pulsed. This reveals low-level
modulation components that are hidden by the pulse spectrum.
Refer back to these first three steps to setup the pulse signal, the
pulsed-RF FM signal and the oscilloscope settings when performing the
gated LO procedure (page 62), the gated video procedure (page 64) and
gated FFT procedure (page 66).
For an instrument block diagram and instrument connections see
“Connecting the Instruments to Make Time-Gated Measurements” on
page 61.
Step 1. Setup the pulse signal with a period of 5 ms and a width of 4 ms:
There are many ways to create a pulse signal. This example
demonstrates how to create a pulse signal using a pulse generator or by
using the internal function generator in the ESG. See Table 8-1 for
setup information of a pulse generator and Table 8-2 for setup
information of the internal generator of the ESG. Select either the pulse
generator or a second ESG to create the pulse signal. You need two
ESGs if you want to use the ESG internal function generator to create a
pulse signal.
Table 8-1
81100 Family Pulse Generator Settings
Period
5 ms (or pulse frequency equal to 200 Hz)
Pulse width
4 ms
High output level
2.5 V
Waveform
pulse
Low output level
-2.5 V
Delay
0 or minimum
58
Chapter 8
Table 8-2
ESG #2 Internal Function Generator (LF OUT) Settings
LF Out Source
FuncGen
LF Out Waveform
Pulse
LF Out Period
5 ms
LF Out Width (pulse
width)
4 ms
LF Out Amplitude
2.5 Vp
LF Out
On
RF On/Off
Off
Mod On/Off
On
Step 2. Set up ESG #1 to transmit a pulsed-RF signal with frequency
modulation. Set the FM deviation to 1 kHz and the FM rate to 50 kHz:
ESG #1 generates the pulsed FM signal by frequency modulating the
carrier signal and then pulse modulating the FM signal. The pulse
signal created in step 1 is connected to the EXT 2 INPUT (on the front of
ESG #1). The ESG RF OUTPUT is the pulsed-RF FM signal to be
analyzed by the spectrum analyzer.
Table 8-3
ESG #1 Instrument Connections
Frequency
40 MHz
Amplitude
0 dBm
Pulse
On
Pulse Source
Ext2 DC
FM
On
FM Path
1
FM Dev
1 kHz
FM Source
Internal
FM Rate
50 kHz
RF On/Off
On
Mod On/Off
On
Chapter 8
59
Making Time-Gated Measurements
Making Time-Gated Measurements
Generating a Pulsed-RF FM Signal
Making Time-Gated Measurements
Making Time-Gated Measurements
Generating a Pulsed-RF FM Signal
Step 3. Set up the oscilloscope to view the trigger, gate and RF signals (see
Figure 8-1 for an example of the oscilloscope display):
Table 8-4
Agilent Infiniium Oscilloscope with 3 or more input channels:
Instrument Connections
Timebase
1 ms/div
Channel 1
ON, 2 V/div, OFFSET = 2 V, DC coupled, 1 M Ω input,
connect to the pulse signal (ESG LF OUTPUT or pulse
generator OUTPUT). Adjust channel 1 settings as
necessary.
Channel 2
ON, 500 mV/div, OFFSET = 2 V, DC coupled, 1 M Ω
input, connect to the ESA GATE/HI SWP OUT
connector or PSA TRIGGER 2 OUT connector on the
spectrum analyzer. Adjust channel 2 settings as
needed when gate is active.
Channel 3
ON, 500 mV/div, OFFSET = 0 V, DC coupled, 50 Ω
input, connect to the ESG RF OUTPUT pulsed-RF
signal. Adjust channel 3 settings as necessary.
Channel 4
OFF
Trigger
Edge, channel 1, level = 1.5 V, or as needed
Figure 8-1
Viewing the Gate Timing with an Oscilloscope
Figure 8-1 oscilloscope channels:
1. Channel 1 (left display, top trace) - the trigger signal.
2. Channel 2 (left display, bottom trace) - the gate signal (gate signal is
not be active until the gate is on in the spectrum analyzer).
3. Channel 3 (right display) - the RF output of the signal generator.
60
Chapter 8
Connecting the Instruments to Make
Time-Gated Measurements
Figure 8-2 shows a block diagram of the test setup. ESG #1 produces a
pulsed FM signal by using an external pulse signal. The external pulse
signal is connected to the front of the ESG #1 to the EXT 2 INPUT to
control the pulsing. The pulse signal is also used as the trigger signal.
The oscilloscope is useful for illustrating timing interactions between
the trigger signal and the gate. PSA Gate View could be used in place of
the oscilloscope.
Using this measurement setup allows you to view all signal spectra on
the spectrum analyzer and all timing signals on the oscilloscope. This
setup is helpful when you perform gated measurements on unknown
signals.
Figure 8-2
Instrument Connection Diagram
Chapter 8
61
Making Time-Gated Measurements
Making Time-Gated Measurements
Connecting the Instruments to Make Time-Gated Measurements
Making Time-Gated Measurements
Making Time-Gated Measurements
Gated LO Measurement (PSA)
Gated LO Measurement (PSA)
This procedure utilizes gated LO to gate the FM signal. For concept and
theory information about gated LO see “How Time Gating Works” on
page 135.
Step 1. Set the PSA center frequency, span and reference level:
Press FREQUENCY Channel, Center Freq, 40, MHz.
Press SPAN X Scale, Span, 500, kHz.
Press AMPLITUDE Y Scale, Ref Level, −15, dBm.
In Figure 8-4 (left), the moving signals are a result of the pulsed signal.
Using delta markers with a time readout, notice that the period of the
spikes is at 5 ms (the same period as the pulse signal). Using time
gating, these signals are be blocked out, leaving the original FM signal.
Step 2. Set the gate source to the rear external trigger input:
Press Sweep, Gate Setup, Gate Source, Ext Rear.
Step 3. Set the gate delay to 2 ms and the gate length to 1 ms. Check that the
gate trigger is set to positive:
Press Sweep, Gate Setup, Delay, 2, ms.
Press Sweep, Gate Setup, Length, 1, ms.
Press Sweep, Gate Setup, Polarity (Pos).
Step 4. Use the PSA gate view display to confirm the gate “on” time is during
the RF burst interval (alternatively you could also use the oscilloscope
to view the gate settings):
Press Sweep, Gate Setup, Gate View (On).
Figure 8-3
Viewing the PSA Gate Settings with Gated LO
In Figure 8-3 the gray vertical line (the far left line outside of the RF
envelope) represents the location equivalent to a zero gate delay.
62
Chapter 8
In Figure 8-3 the vertical green parallel bars represent the gate
settings. The first (left) bar is set at the delay time while the second
(right) bar is set at the gate length, measured from the first bar. The
trace of the signal in this time-domain view is the RF envelope. The
gate signal is triggered off of the positive edge of the trigger signal.
When positioning the gate, a good starting point is to have it extend
from 20% to 80% of the way through the pulse (for the PSA with
linear-phase RBW filters).
While gate view mode is on, move the gate delay, length and polarity
around. Notice the changes in the vertical gate bars while making your
changes. Set the gate delay, length and polarity back to the step 3
settings.
The PSA time gate triggering mode uses positive and negative edge
triggering. Level triggering is not available.
NOTE
Step 5. Turn the gate view off and enable the gate settings (see the right-side
display in Figure 8-4):
Press Sweep, Gate Setup, Gate View (Off).
Press Sweep, Gate (On).
Figure 8-4
Pulsed-RF FM Signal (Left), Gated FM Signal (Right)
Step 6. Turn off the pulse modulation on ESG #1 by pressing Pulse, Pulse so
that Off is selected.
Notice that the gated spectrum is much cleaner than the ungated
spectrum (as seen in Figure 8-4). The spectrum you see with the gate on
is the same as a frequency modulated signal without being pulsed. The
displayed spectrum does not change and in both cases, you can see the
two low-level modulation sidebands caused by the narrow-band FM.
Chapter 8
63
Making Time-Gated Measurements
Making Time-Gated Measurements
Gated LO Measurement (PSA)
Making Time-Gated Measurements
Making Time-Gated Measurements
Gated Video Measurement (ESA)
Gated Video Measurement (ESA)
This procedure utilizes gated video to gate the FM signal. For concept
and theory information about gated video see “How Time Gating
Works” on page 135.
Step 1. Set the ESA center frequency, span and reference level:
Press FREQUENCY Channel, Center Freq, 40, MHz.
Press SPAN X Scale, Span, 500, kHz.
Press AMPLITUDE Y Scale, Ref Level, 0, dBm.
Step 2. Set analyzer sweep time to 2005 ms:
Press Sweep, Sweep Time, 2005, ms.
For gated video, the calculated sweep time should be set to at least
# sweep points × PRI (pulse repetition interval ) to ensure that the gate is on at least
once during each of the 401 sweep points. In this example, the PRI is
5 ms, so you should set the sweep time to 401 times 5 ms, or 2005 ms. If
the sweep time is set too fast, some trace points may show values of
zero power or other incorrect low readings. If the trace seems
incomplete or erratic, try a longer sweep time.
NOTE
Good practices for determining the minimum sweep time for
gated video:
In the event that the signal is not noisy, the sweep time can be set to
less than # sweep points × PRI (pulse repetition interval ) (as calculated above).
Instead of using PRI in the previous sweep time calculation, we can use
the “gate off time” where sweep time equals # sweep points × gate off time . In
our example we could use a sweep time of 401 points times 4 ms or
1.604 s. Increase the width of video bandwidth to improve the
probability of capturing the pulse using “gate off time”. If trace points
are still showing values of zero power, increase the sweep time by small
increments until there are no more dropouts.
Figure 8-5
Viewing the Pulsed-RF FM Signal (without gating)
64
Chapter 8
Step 3. Set the gate delay to 2 ms and the gate length to 1 ms. Check that the
gate control is set to edge with a positive trigger:
Press Sweep, Gate, Gate Control (Edge).
Press Edge Gate, Slope (Pos).
Press Gate Delay, 2, ms.
Press Gate Length, 1, ms.
Step 4. Turn the gate on:
Press Sweep, Gate, Gate (On).
Figure 8-6
Viewing the FM Signal of a Pulsed RF Signal using Gated Video
Step 5. Notice that the gated spectrum is much cleaner than the ungated
spectrum (as seen in Figure 8-5). The spectrum you see is the same as a
frequency modulated signal without being pulsed. To prove this, turn
off the pulse modulation on ESG #1 by pressing Pulse, Pulse so that Off
is selected. The displayed spectrum does not change.
Step 6. Check the oscilloscope display and ensure that the gate is positioned
under the pulse. The gate should be set so that it is on somewhere
between 25% to 80% of the pulse. If necessary, adjust gate length and
gate delay. Figure 8-7 shows the oscilloscope display when the gate is
positioned correctly (the bottom trace).
Figure 8-7
The Oscilloscope Display
Chapter 8
65
Making Time-Gated Measurements
Making Time-Gated Measurements
Gated Video Measurement (ESA)
Making Time-Gated Measurements
Making Time-Gated Measurements
Gated FFT Measurement (PSA)
Gated FFT Measurement (PSA)
This procedure utilizes gated FFT to gate the FM signal. For concept
and theory information about gated FFT see “How Time Gating Works”
on page 135.
Step 1. Set the PSA center frequency, span and reference level:
Press FREQUENCY Channel, Center Freq, 40, MHz.
Press SPAN X Scale, Span, 500, kHz.
Press AMPLITUDE Y Scale, Ref Level, −15, dBm.
Step 2. Set the trigger to the external rear trigger input:
Press Trig, Ext Rear.
Step 3. Select the minimum resolution bandwidth required:
Press BW/Avg, Res BW (Auto).
The duration of the analysis required is determined by the RBW. Divide
1.83 (always constant) by 4 ms to calculate the minimum RBW. The
pulse width in our case is 4 ms so we need a minimum RBW of 458 Hz.
In this case because the RBW is so narrow let the analyzer choose the
RBW for the current analyzer settings (span). Check that the RBW is
greater than 458 Hz.
With the above PSA settings, the RBW should be 4.7 kHz. Note that the
measurement speed is faster than the gated LO example. Typically
gated FFT is faster than gated LO for spans less than 10 MHz.
Vary the RBW settings and note the signal changes shape as the RBW
transitions from 1 kHz to 300 Hz.
Figure 8-8
Viewing the Gated FFT Measurement Results from the PSA
NOTE
If the trigger event needs to be delayed use the Trig Delay function under
the Trig menu. It is recommended to apply some small amount of trigger
delay to allow time for the pulse modulator to settle.
66
Chapter 8
Measuring Digital Communications
Signals
9
Measuring Digital
Communications Signals
67
Measuring Digital Communications Signals
Making Burst Power Measurements
Making Burst Power Measurements
Measuring Digital Communications
Signals
PSA and ESA spectrum analyzers make power measurements on
digital communication signals fast and repeatable by providing a
comprehensive suite of power-based one-button automated
measurements with pre-set standards-based format setups. The
automated measurements also include pass/fail functionality that allow
the user to quickly check if the signal passed the measurement.
NOTE
ESA spectrum analyzer sweep times: In zero-span, ESA can sweep as
fast as 10 µs with 2 points displayed. For 101 points, the minimum
sweep time is 1 ms. Option AYX or B7D is recommended when faster
sweep times are required.
The following example demonstrates how to make a burst power
measurement on a Bluetooth signal broadcasting at 2.402 GHz.
Step 1. Using an ESG, setup a Bluetooth signal transmitting DH1 packets
continuously at 2.402 GHz and −10 dBm and connect the RF OUTPUT
to the spectrum analyzer RF INPUT.
Step 2. Preset the analyzer, set the analyzer center frequency to 2.402 GHz:
Press Preset, Factory Preset (if present).
Press FREQUENCY Channel, Center Freq, 2.402, GHz.
Step 3. Set the analyzer radio mode to Bluetooth and check to make sure
packet type DH1 is selected:
Press Mode Setup, Radio Std, More, Bluetooth.
Press Mode Setup, Radio Std Setup, Packet Type (DH1).
Step 4. Select the burst power one-button measurement from the measure
menu and optimize the reference level:
Press MEASURE, More, Burst Power.
Press Meas Setup, Optimize Ref Level.
Step 5. View the results of the burst power measurement using the full screen
(See Figure 9-1):
Press Display, Full Screen.
68
Chapter 9
Measuring Digital Communications Signals
Making Burst Power Measurements
Full Screen Display of Burst Power Measurement Results
NOTE
Press the Return key to exit the full screen display without changing
any parameter values.
Step 6. Select one of the following three trigger methods to capture the bursted
signal (RF burst is recommended, if available):
Press Trig, RF Burst.
For more information on trigger selections see “Trigger Concepts” on
page 153.
NOTE
Although the trigger level allows the analyzer to detect the presence of
a burst, the time samples contributing to the burst power measurement
are determined by the threshold level, as described next.
Step 7. Set the relative threshold level above which the burst power
measurement is calculated:
Press Meas Setup, Threshold Lvl (Rel), −10, dB.
The burst power measurement includes all points above the threshold
and no points below. The threshold level is indicated on the display by
the green horizontal line (for video triggering it is the upper line). In
this example, the threshold level has been set to be 10 dB below the
relative level of the burst. The mean power of the burst is measured
from all data above the threshold level.
Step 8. Set the burst width to measure the central 200 µs of the burst:
Press Meas Setup, Meas Method, Measured Burst Width, Burst Width
(Man), 200, µs.
The burst width is indicated on the screen by two vertical white lines.
Manually setting the burst width allows you to make it a long time
interval (to include the rising and falling edges of the burst) or to make
it a short time interval, measuring a small central section of the burst.
Chapter 9
69
Measuring Digital Communications
Signals
Figure 9-1
Measuring Digital Communications
Signals
Measuring Digital Communications Signals
Making Burst Power Measurements
NOTE
If you set the burst width manually to be wider than the screen’s
display, the vertical white lines move off the edges of the screen. This
could give misleading results as only the data on the screen can be
measured.
NOTE
The Bluetooth standard states that power measurements should be
taken over at least 20% to 80% of the duration of the burst.
Step 9. Increase the sweep time to display more than one burst at a time:
Press Sweep, Sweep Time, 6200, µs (or 6.2, ms).
The screen display shows several bursts in a single sweep as in
Figure 9-2. The burst power measurement measures the mean power of
the first burst, indicated by the vertical white lines.
Figure 9-2
Setting Burst Width (Left) Displaying Multiple Bursts (Right)
NOTE
Although the burst power measurement still runs correctly when
several bursts are displayed simultaneously, the timing accuracy of the
measurement is degraded. For the best results (including the best
trade-off between measurement variations and averaging time), it is
recommended that the measurement be performed on a single burst.
70
Chapter 9
Measuring Digital Communications Signals
Making Statistical Power Measurements (CCDF)
Making Statistical Power Measurements
(CCDF)
NOTE
CCDF can be measured with ESA-E series analyzers with option AYX
or B7D and with all PSA series analyzers.
All CDMA signals, and W-CDMA signals in particular, are
characterized by high power peaks that occur infrequently. It is
important that these peaks are preserved otherwise separate data
channels can not be received properly. Too many peak signals can also
cause spectral regrowth. If a CDMA system works well most of the time
and only fails occasionally, this can often be caused by compression of
the higher peak signals.
The following example shows how to make a CCDF measurement on a
W-CDMA signal broadcasting at 1.96 GHz.
Step 1. Using an ESG, setup a W-CDMA signal transmitting at 1.96 GHz and
−10 dBm. Connect the RF OUTPUT to the spectrum analyzer RF
INPUT.
Step 2. Preset the analyzer and set the center frequency to 1.96 GHz:
Press Preset, Factory Preset (if present).
Press FREQUENCY Channel, Center Freq, 1.96, GHz.
Step 3. Set the analyzer radio mode to 3GPP W-CDMA as a base station device:
Press Mode Setup, Radio Std, 3GPP W-CDMA.
Press Mode Setup, Radio Std Setup, Device (BTS).
Step 4. Select the CCDF one-button measurement from the measure menu and
then optimize the reference level and attenuation settings suitable for
the CCDF measurement:
Press MEASURE, Power Stat CCDF.
Press Meas Setup, Optimize Ref Level.
Chapter 9
71
Measuring Digital Communications
Signals
Complementary cumulative distribution function (CCDF) curves
characterize a signal by providing information about how much time
the signal spends at or above a given power level. The CCDF
measurement shows the percentage of time a signal spends at a
particular power level. Percentage is on the vertical axis and power (in
dB) is on the horizontal axis.
Measuring Digital Communications Signals
Making Statistical Power Measurements (CCDF)
Measuring Digital Communications
Signals
Figure 9-3
Power Stat CCDF Measurement on a W-CDMA Signal
Step 5. Store your current measurement trace for future reference:
Press Display, Store Ref Trace.
When the power stat CCDF measurement is first made, the graphical
display should show a signal typical of pure noise. This is labelled
Gaussian, and is shown in aqua. Your CCDF measurement is displayed
as a yellow plot. You have stored this measurement’s plot to make for
easy comparison with subsequent measurements.
Step 6. Display the stored trace:
Press Display, Ref Trace (On).
The stored trace from your last measurement is displayed as a magenta
plot (as shown in Figure 9-4), and allows direct comparison with your
current measurement.
Figure 9-4
Storing and Displaying a Power Stat CCDF Measurement
72
Chapter 9
Measuring Digital Communications Signals
Making Statistical Power Measurements (CCDF)
Step 7. Change the measurement bandwidth to 1 MHz:
Press Meas Setup, Meas BW, 1, MHz.
Reducing the measurement bandwidth to 1 MHz
NOTE
If you choose a measurement bandwidth setting that the analyzer
cannot display, it automatically sets itself to the closest available
bandwidth setting.
Measuring Digital Communications
Signals
Figure 9-5
Step 8. Change the number of measured points from 100,000 (100k) to 1,000
(1k):
Press Meas Setup, Counts, 1, kpoints.
Reducing the number of points decreases the measurement time,
however the number of points is a factor in determining measurement
uncertainty and repeatability. Notice how the displayed plot loses a lot
of its smoothness. You are gaining speed but reducing repeatability and
increasing measurement uncertainty.
NOTE
The number of points collected per sweep is dependent on the sampling
rate and the measurement interval. The number of samples that have
been processed are indicated at the top of the screen. The graphical plot
is continuously updated so you can see it getting smoother as
measurement uncertainty is reduced and repeatability improves.
Step 9. Change the scaling of the X-axis to 1 dB per division to optimize your
particular measurement:
Press SPAN X Scale, Scale/Div, 1, dB.
Chapter 9
73
Measuring Digital Communications Signals
Making Adjacent Channel Power (ACP) Measurements
Making Adjacent Channel Power (ACP)
Measurements
The adjacent channel power (ACP) measurement is also referred to as
the adjacent channel power ratio (ACPR) and adjacent channel leakage
ratio (ACLR). We use the term ACP to refer to this measurement.
Measuring Digital Communications
Signals
ACP measures the total power (rms voltage) in the specified channel
and up to six pairs of offset frequencies. The measurement result
reports the ratios of the offset powers to the main channel power.
The following example shows how to make an ACP measurement on a
W-CDMA base station signal broadcasting at 1.96 GHz.
Step 1. Using an ESG, setup a W-CDMA signal transmitting at 1.96 GHz and
−10 dBm. Connect the RF OUTPUT to the spectrum analyzer RF
INPUT.
Step 2. Preset the analyzer, set the analyzer center frequency to 1.96 GHz.
Press Preset, Factory Preset (if present).
Press FREQUENCY Channel, Center Freq, 1.96, GHz.
Step 3. Set the analyzer radio mode to 3GPP W-CDMA as a base station device:
Press Mode Setup, Radio Std, 3GPP W-CDMA.
Press Mode Setup, Radio Std Setup, Device (BTS).
Step 4. Select the adjacent channel power one-button measurement from the
measure menu and then optimize the reference level and attenuation
settings suitable for the ACP measurement (see Figure 9-6):
Press MEASURE, ACP.
Press Meas Setup, Optimize Ref Level.
NOTE
Optimize Ref Level protects against input signal overloads, but does not
necessarily set the input attenuation and reference level for optimum
measurement dynamic range.
To improve the measurement repeatability, increase the sweep time to
smooth out the trace (average detector must be selected). Measurement
repeatability can be traded off with sweep time.
To increase dynamic range, Noise Correction can be used to factor out
the added power of the noise floor effects. Noise correction is very useful
when measuring signals near the noise floor of the analyzer.
74
Chapter 9
Measuring Digital Communications Signals
Making Adjacent Channel Power (ACP) Measurements
Figure 9-6
ACP Measurement on a Base Station W-CDMA Signal
Measuring Digital Communications
Signals
The frequency offsets, channel integration bandwidths, and span
settings can all be modified from the default settings selected by the
radio standard.
Two vertical white lines indicate the bandwidth limits of the central
channel being measured.
Offsets A and B are designated by the adjacent pairs of red and yellow
lines, in this case: 5 MHz and 10 MHz from the center frequency
respectively.
Step 5. Select the combined spectrum and bar graph view of the results:
(ESA) Press View/Trace, Combined.
(PSA) Press Trace/View, Combined.
Step 6. View the results using the full screen:
Press Display, Full Screen.
NOTE
Press the Return key to exit the full screen display without changing
any parameter values.
Step 7. Define a new third pair of offset frequencies:
Press Meas Setup, Offset/Limits, Offset (C), Offset Freq (On), 15, MHz.
This third pair of offset frequencies is offset by 15.0 MHz from the
center frequency (the outside offset pair) as shown in Figure 9-7. Three
further pairs of offset frequencies (D, E and F) are also available.
Chapter 9
75
Measuring Digital Communications Signals
Making Adjacent Channel Power (ACP) Measurements
Measuring Digital Communications
Signals
Figure 9-7
Measuring a Third Adjacent Channel
Step 8. Set pass/fail limits for each offset:
Press Meas Setup, Offset/Limits, Offset (A), Neg Offset Limit, −55, dB, Pos
Offset Limit, −55, dB, Offset (B), Neg Offset Limit, −65, dB, Pos Offset Limit,
−65, dB, Offset (C), Neg Offset Limit, −65, dB, Pos Offset Limit, −65, dB.
Step 9. Turn the limit test on:
Press Meas Setup, More, Limit Test (On).
In Figure 9-8 notice that offset A has passed, however offsets B and C
have failed. Power levels that fall below our specified −65 dB for offsets
B and C, fail. Failures are identified by the red letter “F” next to the
levels (dBc and dBm) listed in the lower portion of the window called,
“RMS Results”. The offset bar graph is also shaded red to identify a
failure.
Figure 9-8
Setting Offset Limits
NOTE
You may increase the repeatability by increasing the sweep time.
76
Chapter 9
Measuring Digital Communications Signals
Making Multi-Carrier Power (MCP) Measurements
Making Multi-Carrier Power (MCP)
Measurements
The following example shows how to make an MCP measurement on a
W-CDMA base station broadcasting with 8 carriers on and with two
carriers off. The transmitting carriers are spaced at 5 MHz intervals at
the following frequencies: 977.5 MHz, 982.5 MHz, 987.5 MHz,
992.5 MHz, 1.0075 GHz, 1.0125 GHz, 1.0175 GHz and 1.0225 GHz.
NOTE
Recommended equipment: The Agilent ESG signal generators can
be used to transmit W-CDMA multi-carrier signals of up to 4 carriers.
The multi-carrier signal parameters can be modified including channel
setup, frequency offset and carrier power. An alternative way to setup
multiple carriers is to use multiple ESGs, each transmitting one
W-CDMA signal.
Step 1. Connect a W-CDMA signal with multiple carriers broadcasting at the
frequencies stated above.
Step 2. Set the center frequency of the analyzer to the midpoint of all the
carriers:
Press Preset, Factory Preset (if present).
Press FREQUENCY Channel, Center Freq, 1, GHz.
Step 3. Set the analyzer radio mode to 3GPP W-CDMA as a base station device:
Press Mode Setup, Radio Std, 3GPP W-CDMA.
Press Mode Setup, Radio Std Setup, Device (BTS).
Step 4. Select the multi-carrier power one-button measurement from the
measure menu and then optimize the reference level and attenuation
settings suitable for the MCP measurement:
Press MEASURE, Multi Carrier Power.
Press Meas Setup, Optimize Ref Level.
Step 5. Set the carrier number to 10 (in our multi-carrier setup we have 8
carriers without 2 middle carriers):
Chapter 9
77
Measuring Digital Communications
Signals
The multi-carrier power measurement measures the total power of up
to 12 carriers and their adjacent channels for up to three pairs of offset
frequencies. The offset frequency properties can be modified, including
the offset frequency, the integration bandwidth and upper/lower limits.
The carrier parameters can also be modified including carrier width,
carrier integration bandwidth and whether the carrier is on or off. MCP
can be setup with no radio standard selected or with radio standard
settings for IS-95 and W-CDMA. Results for carriers without power
present are displayed relative to the reference carrier. Results for
adjacent channels are displayed in absolute power (dBm).
Measuring Digital Communications Signals
Making Multi-Carrier Power (MCP) Measurements
Press Meas Setup, Carrier Setup, Carriers, 10, Enter.
Step 6. Configure carrier 5 to have no power present:
Press Meas Setup, Carrier Setup, Configure Carriers, Carrier, 5, Enter,
Carrier Pwr Present (No).
Step 7. Repeat step 6, configuring carrier 6 to have no power present.
Measuring Digital Communications
Signals
Step 8. Display the results in full screen view (see Figure 9-9):
Press Display, Full Screen.
Figure 9-9
MCP Measurement on a Base Station W-CDMA Signal
In this example, the intermodulation falls outside the transmit
channels which are marked by the colored vertical lines. The white set
indicates the reference carrier. The red sets contain the carriers with
power present and the blue lines mark the carriers without power
present. Limits for the upper and lower offsets can also be set as shown
in the example: “Making Adjacent Channel Power (ACP)
Measurements” on page 74.
NOTE
Press the Return key to exit the full screen display without changing
any parameter values.
Step 9. View the results table of carriers 7-10:
Press Meas Setup, Carrier Result, 7, Enter.
Step 10. View the results in a combined spectrum and bar graph (see
Figure 9-10):
(ESA) Press View/Trace, Combined.
(PSA) Press Trace/View, Combined.
78
Chapter 9
Measuring Digital Communications Signals
Making Multi-Carrier Power (MCP) Measurements
Figure 9-10
Combined Spectrum and Bar Graph View
Press File, Save, Type, More, Measurement Results, Save Now.
The results are stored in a comma separated values format to be viewed
by any personal computer spreadsheet application. All data shown on
the display is included in this file.
Chapter 9
79
Measuring Digital Communications
Signals
Step 11. Save the results file to a disk.
Measuring Digital Communications
Signals
Measuring Digital Communications Signals
Making Multi-Carrier Power (MCP) Measurements
80
Chapter 9
Using External Millimeter Mixers
(Option AYZ)
10
Using External Millimeter
Mixers (Option AYZ)
81
Using External Millimeter Mixers (Option AYZ)
Making Measurements With Agilent 11970 Series Harmonic Mixers
Making Measurements With Agilent 11970
Series Harmonic Mixers
External harmonic mixers can be used to extend the frequency range of
the E4407B, E4440A, E4446A and E4448A spectrum analyzers. Agilent
Technologies manufactures external mixers that do not require biasing
and cover frequency ranges from 18 GHz to 110 GHz. For frequency
ranges from 110 GHz up to 325 GHz, other mixers are available from
other manufacturers (these mixers may require biasing). The Agilent
Technologies E4407B, E4440A, E4446A, and E4448A spectrum
analyzers support harmonic mixers and preselected harmonic mixers.
When using harmonic mixers, multiple mixing products are shown on
the analyzer display. The output of a harmonic mixer contains the sum
and difference frequencies of the input signal with the LO and all of its
harmonics. To display the correct signal, signal identification can be
used to remove all undesired mixing products. Once the correct signal is
identified, signal identification must be turned off to measure the
amplitude accurately.
Step 1. Connect the signal source and harmonic mixer to the analyzer as shown
Using External Millimeter Mixers
(Option AYZ)
in Figure 10-1.
Figure 10-1
Instrument Connections with a 11970 Series Harmonic Mixer
CAUTION
The analyzer local oscillator output power is approximately +16 dBm.
Be sure that your external harmonic mixer can accommodate the power
level before connecting it to the analyzer.
NOTE
Agilent 5061-5458 SMA type cables should be used to connect the mixer
IF and LO ports to the analyzer. Do not over-tighten the cables. The
maximum torque should not exceed 112 N-cm (10 in-lb.)
82
Chapter 10
Using External Millimeter Mixers (Option AYZ)
Making Measurements With Agilent 11970 Series Harmonic Mixers
Step 2. Perform a factory preset:
Press Preset, Factory Preset (if present).
Step 3. Set up a high frequency signal on a microwave signal generator (no
modulation required). Set the frequency to 35 GHz and the amplitude
to 0 dBm.
Step 4. Select external mixing, and then select band A (from 26.5 to 40 GHz):
Press Input/Output, Input Mixer, Input Mixer (Ext).
Press Ext Mix Band, 26.5−40 GHz (A).
The IF output of a harmonic mixer contains a signal at the
intermediate frequency of the analyzer whenever the harmonic
frequency of the LO and the frequency of the RF differ by the
intermediate frequency. As a result, within a single harmonic band, a
single input signal can produce multiple responses on the analyzer
display, only one of which is valid (see the left display in Figure 10-2).
These responses come in pairs, where members of the valid response
pair are separated by 642.8 MHz and either the right-most (for negative
harmonics) or left-most (for positive harmonics) member of the pair is
the correct response.
Step 5. Turn on the signal identification feature to show the real signal
response at 35 GHz (by default, the type of signal identification is
Image Suppress):
Step 6. Place a marker on the real signal and turn off signal identification
before making the final amplitude measurement:
Press Peak Search.
Press Signal Ident (Off).
Figure 10-2
Signal Identification (Left - Signal Id Off; Right - Signal Id On)
Chapter 10
83
Using External Millimeter Mixers
(Option AYZ)
Press Input/Output, Input Mixer, Signal ID (On).
Using External Millimeter Mixers (Option AYZ)
Setting Harmonic Mixer Bias Current
Setting Harmonic Mixer Bias Current
The Agilent 11970 Series harmonic mixers do not require an external
bias current. Harmonic mixers that require bias can also be used. The
conversion loss calibration data for mixers requiring an external bias
current are most accurate when the correct bias conditions are applied.
Step 1. Before continuing, complete the previous procedure “Making
Measurements With Agilent 11970 Series Harmonic Mixers” on page 82
to set up the analyzer for external mixing in the band of interest.
Step 2. Activate the bias:
Press Input/Output, Input Mixer, Mixer Config, Mixer Bias (On)
A +I or −I appears in the display annotation indicating bias is on.
Step 3. Enter the desired bias current in mA.
Using External Millimeter Mixers
(Option AYZ)
The mixer bias is supplied from the IF INPUT port of the analyzer.
CAUTION
The open-circuit bias voltage can be as great as ±3.5 V through a source
resistance of 500 ohms. Such voltage levels may appear when recalling
an instrument state in which a bias setting has been stored.
NOTE
The bias value that appears on the analyzer display is expressed in
terms of short-circuit current (that is, the current that would flow if the
IF INPUT were shorted to ground). The actual current flowing into the
mixer is less.
84
Chapter 10
Using External Millimeter Mixers (Option AYZ)
Entering Conversion-Loss Correction Data for Harmonic Mixers
Entering Conversion-Loss Correction Data for
Harmonic Mixers
You may want to correct your measurement for the conversion-loss of
the external harmonic mixer that you are using. The amplitude
correction feature can be used for this.
Step 1. Access the correction factor tables for editing:
Press AMPLITUDE Y Scale, More, Corrections, Other.
You must enter a set of amplitude correction values for the desired
frequency range. Select a correction set for use with external mixing.
The recommended correction set is Other.
Step 2. Edit the conversion loss data for the mixer in use. For Agilent 11970
Series harmonic mixers and Agilent 11974 Series preselected harmonic
mixers, these values are listed on the mixer:
Press Edit.
The data consists of frequency/amplitude pairs. You can enter a single
average value for correction over the entire frequency band. Or you can
improve frequency response accuracy by entering multiple correction
points across the band. Up to 200 points may be defined for each set.
correction function to improve display calibration:
Press Return, Correction (On).
Verify that the correction factors have been applied to the display data
points by checking under the Corrections menu that Apply Corrections is
set to Yes.
Once you have entered the correction set, save the correction set in
internal memory or on floppy disk for future reference.
Chapter 10
85
Using External Millimeter Mixers
(Option AYZ)
Step 3. Once the desired correction points are entered, you must turn on the
Using External Millimeter Mixers (Option AYZ)
Making Measurements with Agilent 11974 Series Preselected Harmonic
Mixers
Making Measurements with Agilent 11974
Series Preselected Harmonic Mixers
Preselected mixers apply a tracking filter to the input signal before
sending it to the mixer. This makes the displayed results easier to
understand because it eliminates the multiple mixing products that are
displayed using harmonic mixers (see “Making Measurements With
Agilent 11970 Series Harmonic Mixers” on page 82).
Step 1. Connect the signal source and preselected mixer to the analyzer as
shown in Figure 10-3.
Using External Millimeter Mixers
(Option AYZ)
Figure 10-3
Instrument Connections with a Preselected Harmonic Mixer
Step 2. Configure the analyzer for preselected external mixing:
Press Input/Output, Input Mixer, Input Mixer (Ext), Mixer Config, Mixer Type
(Presel).
Step 3. If necessary, adjust the tracking of the preselected harmonic mixer
using the procedure “Frequency Tracking Calibration with Agilent
11974 Series Preselected Harmonic Mixers” on page 88.
Step 4. Select the desired mixing band. In this example an Agilent 11974Q (33
to 50 GHz mixer) is used:
Press Input/Output, Input Mixer, Ext Mix Band, 33−50 GHz (Q).
Step 5. Set the microwave source to a frequency of 40 GHz and an amplitude of
−15 dBm.
Step 6. Enter the conversion-loss data for the mixer, to calibrate the amplitude
86
Chapter 10
Using External Millimeter Mixers (Option AYZ)
Making Measurements with Agilent 11974 Series Preselected Harmonic
Mixers
of the display. The conversion-loss versus frequency data is on the
calibration label on the bottom of the Agilent 11974, or on the supplied
calibration sheet.
Use the procedure “Entering Conversion-Loss Correction Data for
Harmonic Mixers” on page 85.
Step 7. To complete the amplitude calibration process, the preselector must be
adjusted at each frequency of interest. Before making final amplitude
measurements with the analyzer, perform the following:
Press Peak Search.
Press SPAN X Scale, Span Zoom, 10, MHz.
Press AMPLITUDE Y Scale, Presel Center.
The final amplitude measurement can now be read out with a marker.
See Figure 10-4.
Figure 10-4
Amplitude Reading of the Preselected Response
Using External Millimeter Mixers
(Option AYZ)
Chapter 10
87
Using External Millimeter Mixers (Option AYZ)
Frequency Tracking Calibration with Agilent 11974 Series Preselected
Harmonic Mixers
Frequency Tracking Calibration with Agilent
11974 Series Preselected Harmonic Mixers
This procedure is used to align the frequency of the preselector filter of
the Agilent 11974 to the tuned frequency of the analyzer. This
procedure should be followed any time that the Agilent 11974 is
connected to a different analyzer. The calibration should be periodically
checked.
Step 1. Connect the signal source and preselected mixer to the analyzer as
shown in Figure 10-3.
Step 2. Set the Agilent 11974 rear-panel switches “Agilent 70907B” and
“LEDS” to the ON position, and the other two switches to the OFF
position, in order for the Agilent 11974 to properly scale to the tune
signal of the analyzer.
Step 3. Configure the analyzer for a preselected external mixer:
Press Preset, Factory Preset (if present).
Press Input/Output, Input Mixer, Input Mixer (Ext), Mixer Config, Mixer Type
(Presel).
Using External Millimeter Mixers
(Option AYZ)
Step 4. Set the desired frequency band of operation for your mixer:
Press Input/Output, Input Mixer, Ext Mix Band, then select external mixing
band (bands A, Q, U or V).
Step 5. Set the preselector adjustment to 0 MHz:
Press AMPLITUDE Y Scale, Presel Adjust, 0, MHz.
Step 6. Set the analyzer to zero span:
Press SPAN X Scale, Zero Span.
Step 7. Set the center frequency to the value in Table 10-1 for your mixer:
Press FREQUENCY Channel, Center Freq, frequency value.
On the rear panel of the Agilent 11974, adjust the corresponding
potentiometer until one or both of the green LEDs are lit.
Table 10-1
Start Frequency Preselector Adjustment
Mixer
Agilent P/N
Analyzer Center
Frequency
Potentiometer
11974A
26.5 GHz
“26.5 GHz Adjust”
11974Q
33.0 GHz
“33.0 GHz Adjust”
11974U
40.0 GHz
“40.0 GHz Adjust”
88
Chapter 10
Using External Millimeter Mixers (Option AYZ)
Frequency Tracking Calibration with Agilent 11974 Series Preselected
Harmonic Mixers
Table 10-1
Start Frequency Preselector Adjustment (Continued)
Mixer
Agilent P/N
Analyzer Center
Frequency
Potentiometer
11974V
50.0 GHz
“50.0 GHz Adjust”
Step 8. Change the analyzer center frequency to the value indicated in
Table 10-2 and again adjust the corresponding potentiometer on the
rear panel of the Agilent 11974 until one or both of the green LEDs are
lit.
Table 10-2
Stop Frequency Preselector Adjustment
Mixer
Agilent P/N
Analyzer Center
Frequency
Potentiometer
11974A
40.0 GHz
“40.0 GHz Adjust”
11974Q
50.0 GHz
“50.0 GHz Adjust”
11974U
60.0 GHz
“60.0 GHz Adjust”
11974V
75.0 GHz
“75.0 GHz Adjust”
Step 9. Repeat steps 6 and 7 until the green LEDs are lit at both frequencies.
Using External Millimeter Mixers
(Option AYZ)
Chapter 10
89
Using External Millimeter Mixers
(Option AYZ)
Using External Millimeter Mixers (Option AYZ)
Frequency Tracking Calibration with Agilent 11974 Series Preselected
Harmonic Mixers
90
Chapter 10
Demodulating AM and FM Signals
11
Demodulating AM and FM
Signals
91
Demodulating AM and FM Signals
Measuring the Modulation Rate of an AM Signal
Measuring the Modulation Rate of an AM
Signal
This section demonstrates how to determine parameters of an AM
signal, such as modulation rate and modulation index (depth) by using
frequency and time domain measurements (see the concepts chapter
“AM and FM Demodulation Concepts” on page 157 for more
information). Using the ESA built-in AM demodulator, you can also
tune-in and listen to an AM signal (“Demodulating an AM Signal Using
the ESA Series” on page 96).
To obtain an AM signal, you can either connect a source transmitting
an AM signal, or connect an antenna to the analyzer input and tune to a
commercial AM broadcast station. For this demonstration an RF source
is used to emulate an AM signal.
Step 1. Connect an Agilent ESG RF signal source to the analyzer INPUT. Set
the ESG frequency to 300 MHz and the amplitude to −10 dBm. Set the
AM depth to 80%, the AM rate to 1 kHz and turn AM on.
Step 2. Preset the analyzer and then set the center frequency, span, RBW and
the sweep time:
Press Preset, Factory Preset (if present).
Press FREQUENCY Channel, Center Freq, 300, MHz.
Press SPAN X Scale, Span, 500, kHz.
Press BW/Avg, Res BW, 30, kHz.
Press Sweep, Sweep Time, 20, ms.
Step 3. Set the y-axis units to volts:
Press AMPLITUDE Y Scale, More, Y-Axis Units, Volts.
Step 4. Position the signal peak near the reference level:
Press AMPLITUDE Y Scale, Ref Level, (rotate front-panel knob).
Step 5. Change the y-scale type to linear:
Demodulating AM and FM Signals
Press AMPLITUDE Y Scale, Scale Type (Lin).
Step 6. Set the analyzer in zero span to make time-domain measurements:
Press SPAN X Scale, Zero Span.
Press Sweep, Sweep Time, 5, ms.
Step 7. Use the video trigger to stabilize the trace:
Press Trig, Video.
Since the modulation is a steady tone, you can use video trigger to
trigger the analyzer sweep on the waveform and stabilize the trace,
much like an oscilloscope. See Figure 11-1.
92
Chapter 11
Demodulating AM and FM Signals
Measuring the Modulation Rate of an AM Signal
If the trigger level is set too high or too low when video trigger mode is
activated, the sweep stops. You need to adjust the trigger level up or
down with the front-panel knob until the sweep begins again.
NOTE
Step 8. Measure the AM rate using delta markers:
Press Peak Search, Marker, Delta, Peak Search, Next Pk Right or Next Pk
Left.
Use markers and delta markers to measure the AM rate. Place the
marker on a peak and then use a delta marker to measure the time
difference between the peaks (this is the AM rate of the signal)
NOTE
Make sure the delta markers above are placed on adjacent peaks. See
Figure 11-1. The frequency or the AM rate is 1 divided by the time
between adjacent peaks:
AM Rate = 1/1.0 ms = 1 kHz
The spectrum analyzer can also make this rate calculation by changing
the marker readout to inverse time.
Press Marker, More, Readout, Inverse Time.
In this example we calculated the time between time-domain peaks at
the frequency of the peak of the AM signal. To make this measurement
more accurately, set the center frequency to a point on the AM signal
where the slope of the AM signal’s skirt is steep and then set the
analyzer in zero span. Set the analyzer sweep time to about 2 times the
modulation rate and increase the number of sweep points.
Another way to calculate the modulation rate would be to view the
signal in the frequency domain and measure the delta frequency
between the peak of the carrier and the first sideband.
Figure 11-1
Measuring Time Parameters
Demodulating AM and FM Signals
Chapter 11
93
Demodulating AM and FM Signals
Measuring the Modulation Index of an AM Signal
Measuring the Modulation Index of an AM
Signal
This procedure demonstrates how to use the spectrum analyzer as a
fixed-tuned (time-domain) receiver to measure the modulation index as
a percent AM value of an AM signal. Using the ESA built-in AM
demodulator, you can also tune-in and listen to an AM signal
(“Demodulating an AM Signal Using the ESA Series” on page 96).
Step 1. Follow steps 1 through 7 of the procedure “Measuring the Modulation
Rate of an AM Signal” on page 92.
Step 2. Turn off all markers and place the analyzer in free run trigger mode:
Press Marker, Off.
Press Trig, Free Run.
Step 3. Increase the sweep time and decrease the VBW so that the waveform is
displayed as a flat horizontal signal:
Press Sweep, Sweep Time, 5, s.
Press BW/Avg, Video BW, 30, Hz.
Step 4. Center the flat waveform at the mid-point of the y-axis and then widen
the VBW and decrease the sweep time to display the waveform as a sine
wave:
Press AMPLITUDE Y Scale, Ref Level.
Press BW/Avg, Video BW, 100, kHz.
Press Sweep, Sweep Time, 5, ms.
Step 5. Measure the modulation index of the AM signal:
Demodulating AM and FM Signals
To measure the modulation index as % AM, read the trace as follows
(see Figure 11-2 for display examples): 100% AM extends from the top
graticule down to the bottom graticule. 80% AM (as in this example) is
when the top of the signal is at 1 division below the top graticule and 1
division above the bottom graticule. To determine % AM of your signal
count each y-axis division as 10%.
94
Chapter 11
Demodulating AM and FM Signals
Measuring the Modulation Index of an AM Signal
Figure 11-2
AM Signal Measured in the Time Domain
LEFT: 100% AM Signal (Modulation Index = 1)
RIGHT: 80% AM Signal (Modulation Index = 0.8)
Demodulating AM and FM Signals
Chapter 11
95
Demodulating AM and FM Signals
Demodulating an AM Signal Using the ESA Series
Demodulating an AM Signal Using the ESA
Series
The demodulation functions listed in the menu under Det/Demod allow
you to demodulate and hear signal information displayed on the
analyzer. Simply place a marker on a signal of interest, set the analyzer
in zero span, activate AM demodulation, turn the speaker on, and then
listen.
AM demodulation is not available on the PSA Series spectrum
analyzers.
NOTE
Step 1. Perform a factory preset:
Press Preset, Factory Preset (if present).
Step 2. Connect an antenna to the analyzer input.
Step 3. Select a frequency range on the analyzer, such as the range for AM
radio broadcasts. For example, the frequency range for AM broadcasts
in the United States is 550 kHz to 1650 kHz:
Press FREQUENCY, Start Freq, 550, kHz, Stop Freq, 1650, kHz.
Step 4. Place a marker on the signal of interest (see Figure 11-3):
Press Peak Search, Next Pk Right or Next Pk Left.
Demodulating AM and FM Signals
Figure 11-3
AM Broadcast Signals
Step 5. Set the frequency of the signal of interest to center frequency:
Press Peak Search, Next Pk Right or Next Pk Left (as necessary), Marker→,
and Mkr→CF.
Step 6. Reduce the span to 1 MHz by using the step down key (↓) and Mkr→CF
96
Chapter 11
Demodulating AM and FM Signals
Demodulating an AM Signal Using the ESA Series
multiple times, keeping the signal of interest in the center of the
display until the span is 1 MHz:
Press SPAN X Scale, Span, (↓), Mkr→CF.
Step 7. Set the analyzer into time-domain with zero span:
Press SPAN X Scale, Zero Span.
Step 8. Change the resolution bandwidth to 100 kHz:
Press BW/Avg, Res BW, 100, kHz.
Step 9. Set the top of the signal near the top of the display by changing the
reference level with the front-panel knob:
Press AMPLITUDE Y Scale, rotate front-panel knob.
Step 10. Set the amplitude scale to linear and then re-adjust the reference level
to keep the signal centered in the display:
Press AMPLITUDE Y Scale, Scale Type (Lin).
Press AMPLITUDE Y Scale, Ref Level, rotate front-panel knob.
Step 11. Set the detector type to sample and turn on AM demodulation:
Press Det/Demod, Detector, Sample.
Press Det/Demod, Demod, AM.
Step 12. Listen to the demodulated AM signal (adjust the volume as necessary):
Press Det/Demod, Demod, Speaker (On).
Step 13. Measure the modulation index (AM depth as a percentage):
Press Sweep Time, 5, s.
Press BW/Avg, Video BW, 30, Hz.
Press AMPLITUDE Y Scale, Ref Level (use the front-panel knob to adjust
the trace to the middle of the screen).
Press BW/Avg, Video BW, 100, kHz.
Press Sweep, Sweep Time, 5, ms.
The middle horizontal graticule line represents 0% AM; the top and
bottom horizontal lines represent 100% AM.
The signal to the speaker is interrupted during retrace because the
analyzer is performing automatic alignment routines. To eliminate the
interruption and clicks between sweeps, turn the auto alignment
function off by pressing System, Alignments, Auto Align, Off.
Refer to the specifications for information about operating the analyzer
with the alignments turned off.
Chapter 11
97
Demodulating AM and FM Signals
NOTE
Demodulating AM and FM Signals
Demodulating an FM Signal Using the ESA-E Series (Requires Option BAA)
Demodulating an FM Signal Using the ESA-E
Series (Requires Option BAA)
This section demonstrates how to demodulate and listen to an FM
signal using the ESA built-in FM demodulator with option BAA.
Using the ESA’s built in FM demodulator you can tune to an FM signal
and view the results of the detector output as displayed in the time
domain. Alternatively, the demodulated signal is also available as an
audio output (to the speaker or headphone jack) and as video output (on
the rear panel of the ESA).
NOTE
FM demodulation is not available on the PSA Series spectrum
analyzers.
Step 1. Perform a factory preset:
Press Preset, Factory Preset (if present).
Step 2. Use an ESG RF source or an antenna for an FM signal to analyze. In
this example an ESG is used transmitting at 300 MHz with FM
deviation of 10 kHz and FM rate of 1 kHz.
NOTE
If you are using a broadcast FM signal in the United States, for
example, the FM channels are broadcasting between 87.7 MHz to
107.7 MHz.
Step 3. Before continuing with the demodulation of the FM signal, calibrate the
demodulator:
Press System, Alignments, Align Now, FM demod.
Step 4. Set the center frequency to the center of the FM signal (in this case
300 MHz):
Press FREQUENCY Channel, Center Freq, 300, MHz.
Demodulating AM and FM Signals
Step 5. Set the analyzer to zero span for time-domain analysis:
Press SPAN X Scale, Zero Span.
Press Sweep, Sweep Time, 4, ms.
Step 6. Set the resolution bandwidth to capture the full bandwidth of the FM
signal. To calculate the required bandwidth use
RBW = ( ( 2 x Frequency Deviation ) + ( 2 x Modulation Rate ) )
In our case the RBW should be: (2 x 10 kHz) + (2 x 1 kHz) = 22 kHz
With ESA’s 1-3-10 sequence RBW selections, choose the next highest
RBW of 30 kHz:
98
Chapter 11
Demodulating AM and FM Signals
Demodulating an FM Signal Using the ESA-E Series (Requires Option BAA)
Press BW/Avg, Res BW, 30, kHz.
Step 7. Turn on the FM demodulator:
Press Det/Demod, Demod, FM.
Step 8. Change the vertical scaling:
Press AMPLITUDE Y Scale, Scale/Div, 5, kHz.
Figure 11-4
FM Demodulation (ESG FM Signal with 10 kHz Deviation)
Step 9. Calculate the FM deviation using markers with max hold and min hold
functionality (also note that each division has 5 kHz of FM deviation if
you wanted to visually calculate the deviation):
Press View/Trace, Max Hold.
Wait until the trace appears to be a flat line before continuing to the
next button sequence below:
Press Marker, Delta, View/Trace, Min Hold.
The value on the screen from the delta value of max hold and min hold
is the peak-to-peak deviation value. We are interested in the average
value which we can calculate by dividing the peak-to-peak value by 2.
In our case it should be approximately 20 kHz/2 or 10 kHz.
Demodulating AM and FM Signals
Chapter 11
99
Demodulating AM and FM Signals
Demodulating an FM Signal Using the ESA-E Series (Requires Option BAA)
Figure 11-5
Calculating Frequency Deviation
Step 10. Take a single sweep of the demodulated signal and then calculate the
FM rate using delta markers on adjacent peaks. Change the marker
readout value to inverse time for a frequency calculation of the FM rate:
Press Marker, Off.
Press View/Trace, Clear Write.
Press Single, Peak Search, Marker, Delta, Peak Search, Next Pk Right (or
Next Pk Left).
Press Marker, More, Readout, Inverse Time.
Demodulating AM and FM Signals
Figure 11-6
Calculating Modulation Rate
Step 11. Listen to the FM signal (first put the analyzer back into continuous
sweeping mode):
Press Sweep, Sweep (Cont).
Press Det/Demod, Demod, Speaker (On).
Adjust the volume of the internal speaker with the volume knob on the
front-panel. Alternatively you can also use the headphone jack (located
below the 3.5 inch floppy disk drive).
100
Chapter 11
Using Segmented Sweep (ESA-E
Series Spectrum Analyzers)
12
Using Segmented Sweep (ESA-E
Series Spectrum Analyzers)
101
Using Segmented Sweep (ESA-E
Series Spectrum Analyzers)
Using Segmented Sweep (ESA-E Series Spectrum Analyzers)
Measuring Harmonics Using Standard Sweep
Measuring Harmonics Using Standard Sweep
This procedure measures the fundamental 50 MHz signal plus the
second and third harmonics. Compare the measurement times with this
procedure, sweeping from 20 MHz to 170 MHz versus the next
procedure “Measuring Harmonics Using Segmented Sweep” on page
104.
Step 1. Preset the instrument:
Press Preset, Factory Preset (if present).
Step 2. Use the analyzer internal 50 MHz amplitude reference signal:
For ESA model numbers E4401B and E4411B, use the internal 50 MHz
amplitude reference signal.
Press Input/Output, Amptd Ref (On).
For all other ESA model numbers connect a cable between the
front-panel AMPTD REF OUT to the analyzer INPUT.
Press Input/Output, Amptd Ref Out (On).
Step 3. Set the frequency span to view the fundamental signal, second
harmonic and third harmonic:
Press FREQUENCY Channel, Start Freq, 20, MHz, Stop Freq, 170, MHz.
Press AMPLITUDE Y Scale, Ref Level, −20, dBm.
Step 4. Set the resolution bandwidth and video bandwidth:
Press BW/Avg, Res BW, 1, kHz.
Press BW/Avg, Video BW, 1, kHz.
Step 5. Place a marker at the 50 MHz signal (you may need to wait for a
minute until the analyzer sweeps past 50 MHz):
Press Peak Search.
Refer to Figure 12-1 to see the result of this first measurement in this
example. Notice the minimum sweep time is set at 193.3 seconds in
order to provide accurate data. If you attempt to enter a faster sweep
time, the Meas Uncal message is shown in the upper right corner of the
display.
102
Chapter 12
Figure 12-1
Measuring Harmonics with Standard Sweep
Chapter 12
103
Using Segmented Sweep (ESA-E
Series Spectrum Analyzers)
Using Segmented Sweep (ESA-E Series Spectrum Analyzers)
Measuring Harmonics Using Standard Sweep
Using Segmented Sweep (ESA-E
Series Spectrum Analyzers)
Using Segmented Sweep (ESA-E Series Spectrum Analyzers)
Measuring Harmonics Using Segmented Sweep
Measuring Harmonics Using Segmented
Sweep
Segmented sweep allows you to define many bands of interest and
display them as a single trace. Although the following examples only
involve a maximum of 3 segments, you can set up the trace to display 32
segments simultaneously.
This procedure uses segmented sweep to measure the 50 MHz
fundamental signal, the second harmonic and the third harmonic.
Compare the measurement time differences between the previous
procedure, “Measuring Harmonics Using Standard Sweep” on page 102
and this procedure using segmented sweep. Segmented sweep is faster
than sweeping the full span to capture the fundamental signal to the
third harmonic.
Step 1. Preset the instrument:
Press Preset, Factory Preset (if present).
Step 2. Turn on the internal 50 MHz amplitude reference signal as in step 2
from the “Measuring Harmonics Using Standard Sweep” on page 102,
section above.
Step 3. Set the reference level and attenuation:
Press AMPLITUDE Y Scale, Ref Level, −20, dBm.
Press AMPLITUDE Y Scale, Attenuation, 5, dB.
Step 4. Open the segmented sweep editor:
Press Sweep, Segmented, Modify, Edit.
Three segments are going to be set up, as in Figure 12-2 below, to view
the fundamental signal, second harmonic and third harmonic.
Step 5. Set the first segment parameters:
Press Segment, 1, Enter.
Press Center Freq, 50, MHz.
Press Span, 100, kHz.
Press Video BW, 30, Hz.
Step 6. Set the second segment parameters:
Press Segment, 2, Enter.
Press Center Freq, 100, MHz.
Press Span, 100, kHz.
Press Video BW, 30, Hz.
Step 7. Set the third segment parameters:
Press Segment, 3, Enter.
104
Chapter 12
Press Center Freq, 150, MHz.
Press Span, 100, kHz.
Press Video BW, 30, Hz.
Notice that the total sweep time for the 3 segments is only 8.13 seconds
(plus a minimal time for transitions between segments). This is
considerably shorter than the 193.3 seconds required to view the same
signals without segmented sweep.
Figure 12-2
Reducing Sweep Time with Segmented Sweep
Chapter 12
105
Using Segmented Sweep (ESA-E
Series Spectrum Analyzers)
Using Segmented Sweep (ESA-E Series Spectrum Analyzers)
Measuring Harmonics Using Segmented Sweep
Using Segmented Sweep (ESA-E
Series Spectrum Analyzers)
Using Segmented Sweep (ESA-E Series Spectrum Analyzers)
Using Segmented Sweep With Limit Lines
Using Segmented Sweep With Limit Lines
Segmented sweep can also use other standard spectrum analyzer
functionality, such as limit lines. In this procedure three segments are
used. In the first segment, the limit lines are used to verify that the
signal phase noise is acceptable. The second and third segments are
used to verify the harmonic signals are below a specified amplitude.
Step 1. Connect the 10 MHz REF OUT from the rear panel to the front-panel
INPUT. Preset the instrument:
Press Preset, Factory Preset (if present).
Step 2. Place the peak of the fundamental signal at the top of the graticule:
Press AMPLITUDE Y Scale, Ref Level, 8, dBm.
Step 3. Open the segmented sweep editor:
Press Sweep, Segmented, Modify, Edit.
Step 4. Display the fundamental signal in the first segment:
Press Segment, 1, Enter.
Press Center Freq, 10, MHz.
Press Span, 500, kHz.
Press Res BW, 3, kHz.
Press Video BW, 30, Hz.
Press Points, 1000, Enter.
Step 5. Display the second harmonic in the second segment:
Press Segment, 2, Enter.
Press Center Freq, 20, MHz.
Press Span, 100, kHz.
Step 6. Display the third harmonic in the third segment:
Press Segment, 3, Enter.
Press Center Freq, 30, MHz.
Press Span, 100, kHz.
Step 7. Open the limit line editor:
Press Display, Limits, Limit 1, Type (Upper), Edit.
Step 8. Enter the limit line data from Table 12-1 below. To enter the table data:
Press Point, 1, Enter, Frequency, 9.75, MHz, Amplitude, −80, dBm,
Connected (Yes).
Step 9. Begin the next limit line point:
Press Tab ⇒|.
106
Chapter 12
Step 10. Enter points 2 through 11 from Table 12-1:
Table 12-1
Limit Line Data
Point
Frequency
Amplitude
Connected
1
9.75 MHz
− 80 dBm
Yes
2
9.8 MHz
− 75 dBm
Yes
3
9.9 MHz
− 70 dBm
Yes
4
9.95 MHz
6 dBm
Yes
5
10.05 MHz
6 dBm
Yes
6
10.1 MHz
− 70 dBm
Yes
7
10.2 MHz
− 75 dBm
Yes
8
10.25 MHz
− 80 dBm
Yes
9
19.95 MHz
− 30 dBm
Yes
10
29.95 MHz
− 15 dBm
Yes
11
30.05 MHz
− 15 dBm
Yes
Step 11. Turn the limits on:
Press Return, Limit (On).
Step 12. Turn the limit test on to determine if the fundamental signal and
harmonics pass:
Press Test (On).
Figure 12-3
Segmented Sweep with Limit Line Test
This procedure can verify compliance with phase noise and harmonics
specifications. You can save this instrument state and limit lines in a
“setup” type file for future applications (File, Save, Type, Setup,
Save Now). Replace the 10 MHz reference signal of the analyzer with
the device under test (DUT) to create a similar measurement.
Chapter 12
107
Using Segmented Sweep (ESA-E
Series Spectrum Analyzers)
Using Segmented Sweep (ESA-E Series Spectrum Analyzers)
Using Segmented Sweep With Limit Lines
Using Segmented Sweep (ESA-E
Series Spectrum Analyzers)
Using Segmented Sweep (ESA-E Series Spectrum Analyzers)
Using Segmented Sweep to Monitor the Cellular Activity of a cdmaOne Band
Using Segmented Sweep to Monitor the
Cellular Activity of a cdmaOne Band
In this example set up two segments to monitor the forward and reverse
links of a U.S. IS-95A cellular band. The third segment is used to zoom
in on an area of interest. You can use any communications band of
interest in your area to duplicate this example.
Step 1. Perform a factory preset:
Press Preset, Factory Preset (if present).
Step 2. Turn on the internal preamp (if installed):
Press AMPLITUDE Y Scale, More, Int Preamp (On).
Step 3. Open the segmented sweep editor:
Press Sweep, Segmented, Modify, Edit.
Step 4. Monitor the activity in the cdmaOne band with the first segment:
Press Center Freq, 836.5, MHz.
Press Span, 25, MHz.
Press Res BW, 10, kHz.
Step 5. Set the reference level to place the signal in the middle of the display:
Press AMPLITUDE Y Scale, Ref Level, 40, −dBm.
Step 6. Monitor the activity of the base station with the second segment:
Press Sweep, Segmented, Modify, Edit, Segment, 2, Enter.
Press Center Freq, 881.5, MHz.
Press Span, 25, MHz.
Press Res BW, 10, kHz.
Figure 12-4
Monitoring the Reverse and Forward Links
108
Chapter 12
Step 7. Locate the frequency of the cdmaOne signal with a marker:
Press Marker, then rotate front-panel knob.
Notice that in this example, there are two cdmaOne carriers located at
882.23 MHz, as shown in Figure 12-4.
Step 8. Set the center frequency of segment 3 to 882.23 MHz:
Press Sweep, Segmented, Modify, Edit, Segment, 3, Enter.
Press Center Freq, 882.23, MHz.
Step 9. Set the span to greater than twice the cdmaOne bandwidth (2 times
1.2288 MHz) since there are two cdma carriers side-by-side:
Press Span, 2.7, MHz.
Press Res BW, 10, kHz.
Step 10. Set trace 1 to maximum hold and set trace 2 to minimum hold:
Press Trace/View, Trace 1, Max Hold.
Press Trace/View, Trace 2, Min Hold.
Figure 12-5
Monitoring Cellular Bands in Segmented Sweep
Figure 12-5 displays the results of this setup over an extended period of
time. As expected, the minimum hold trace of segment 1 shows no
continuously present carriers. This is indicative of cellular activity. If a
persistent signal exists, it may represent the presence of an interfering
carrier. In this example, segment 3 shows continuous transmission of
the carrier without interference.
Chapter 12
109
Using Segmented Sweep (ESA-E
Series Spectrum Analyzers)
Using Segmented Sweep (ESA-E Series Spectrum Analyzers)
Using Segmented Sweep to Monitor the Cellular Activity of a cdmaOne Band
Using Segmented Sweep (ESA-E
Series Spectrum Analyzers)
Using Segmented Sweep (ESA-E Series Spectrum Analyzers)
Using Segmented Sweep to Monitor the Cellular Activity of a cdmaOne Band
110
Chapter 12
Stimulus Response Measurements
(ESA Options 1DN and 1DQ)
13
Stimulus Response
Measurements (ESA Options 1DN
and 1DQ)
111
Stimulus Response Measurements (ESA Options 1DN and 1DQ)
Making a Stimulus Response Transmission Measurement
Stimulus Response Measurements
(ESA Options 1DN and 1DQ)
Making a Stimulus Response Transmission
Measurement
The procedure below describes how to use a built-in tracking generator
to measure the rejection of a band pass filter, a type of transmission
measurement. Refer to the concepts chapter “Stimulus Response
Measurement Concepts” on page 158 for more information a making
stimulus response measurements including adjusting the tracking
generator output power and measuring the N dB bandwidth.
Step 1. To measure the rejection of a band pass filter, connect the equipment as
shown in Figure 13-1. A 200 MHz bandpass filter as the DUT.
Figure 13-1
Transmission Measurement Test Setup
Step 2. Perform a factory preset:
Press Preset, Factory Preset (if present).
Step 3. View the rejection of the bandpass filter. Set a wide RBW:
Press FREQUENCY Channel, Center Freq, 200, MHz.
Press SPAN X Scale, Span, 100, MHz.
Press BW/Avg, Res BW, 3, MHz.
Step 4. Turn on the tracking generator:
Press Source, Amplitude (On), –10, dBm.
CAUTION
Excessive signal input may damage the DUT. Do not exceed the
maximum power that the device under test can tolerate.
NOTE
To reduce ripples caused by source return loss, use 10 dB (E4401B or
E4411B) or 8 dB (all other models) or greater tracking generator output
attenuation. Tracking generator output attenuation is normally a
function of the source power selected. However, the output attenuation
may be controlled in the Source menu.
112
Chapter 13
Stimulus Response Measurements (ESA Options 1DN and 1DQ)
Making a Stimulus Response Transmission Measurement
Step 5. Put the sweep time into stimulus response auto coupled mode:
Press Sweep, Swp Coupling (SR).
Step 6. Increase measurement sensitivity and smooth the noise:
Press BW/Avg, Res BW, 30, kHz.
Press BW/Avg, Video BW, 300, Hz.
A decrease in displayed amplitude is caused by tracking error.
Press Source, Tracking Peak.
Tracking error occurs when the output frequency of the tracking
generator is not exactly matched to the input frequency of the analyzer.
The amplitude should return to the value that was displayed prior to
the decrease in resolution bandwidth.
Step 8. Connect the cable from the tracking generator output to the analyzer
input. Store the frequency response in trace 3 and normalize:
Press View/Trace, More, Normalize, Store Ref (1→3), Normalize (On).
See “Normalization Concepts” on page 159 for information on
normalization.
Step 9. Reconnect the DUT to the analyzer and change the normalized
reference position:
Press View/Trace, More, Normalize, Norm Ref Posn.
Step 10. Measure the rejection of the bandpass filter:
Press Marker, 200, MHz, Delta, 45, MHz.
The marker readout displays the rejection of the filter at 45 MHz above
the center of the bandpass. See Figure 13-2.
Figure 13-2
Measure the Rejection Range
Chapter 13
113
Stimulus Response Measurements
(ESA Options 1DN and 1DQ)
Step 7. Use peak tracking to correct the frequency offset:
Stimulus Response Measurements (ESA Options 1DN and 1DQ)
Calculating the N dB Bandwidth Using Stimulus Response
Calculating the N dB Bandwidth Using
Stimulus Response
Stimulus Response Measurements
(ESA Options 1DN and 1DQ)
This procedure uses the tracking generator for transmission stimulus
response measurements to calculate the 3 dB bandwidth of a 200 MHz
bandpass filter. See the concepts section “Measuring Device
Bandwidth” on page 160 for more information on this measurement.
Step 1. To measure the rejection of a bandpass filter, connect the equipment as
shown in Figure 13-3. This example uses a 200 MHz bandpass filter.
Figure 13-3
Transmission Measurement Test Setup
Step 2. Perform a factory preset:
Press Preset, Factory Preset (if present).
Step 3. Set the center frequency, span and the resolution bandwidth:
Press FREQUENCY Channel, Center Freq, 200, MHz.
Press SPAN X Scale, Span, 100, MHz.
Press BW/Avg, Res BW, 10, kHz.
Step 4. Turn on the tracking generator and set the output power to –10 dBm:
Press Source, Amplitude (On), –10, dBm.
CAUTION
Excessive signal input may damage the DUT. Do not exceed the
maximum power that the device under test can tolerate.
NOTE
To reduce ripples caused by source return loss, use 10 dB (E4401B or
E4411B) or 8 dB (all other models) or greater tracking generator output
attenuation. Tracking generator output attenuation is normally a
function of the source power selected.
114
Chapter 13
Stimulus Response Measurements (ESA Options 1DN and 1DQ)
Calculating the N dB Bandwidth Using Stimulus Response
Step 5. Put the sweep time of the analyzer into stimulus response auto coupled
mode:
Press Sweep, Swp Coupling (SR).
Auto coupled sweep times are usually much faster for stimulus
response measurements than they are for spectrum analyzer (SA)
measurements. If necessary, adjust the reference level to place the
signal on screen.
Stimulus Response Measurements
(ESA Options 1DN and 1DQ)
Step 6. Activate the N dB bandwidth function (See Figure 13-4):
Press Peak Search, More, N dB Points (On).
Figure 13-4
AM Signal Measured in the Time Domain
LEFT: N dB Bandwidth Measurement at −3 dB
RIGHT: N dB Bandwidth Measurement at −60 dB
NOTE
The knob or the data entry keys can be used to change the N dB value
from −3 dB to −60 dB to measure the 60 dB bandwidth of the filter.
Step 7. Turn off the N db Points measurement:
Press N dB Points (Off).
Chapter 13
115
Stimulus Response Measurements (ESA Options 1DN and 1DQ)
Measuring Stop Band Attenuation Using Log Sweep (ESA-E Series)
Measuring Stop Band Attenuation Using Log
Sweep (ESA-E Series)
Stimulus Response Measurements
(ESA Options 1DN and 1DQ)
When measuring filter characteristics, it is useful to look at the
stimulus response over a wide frequency range. Setting the analyzer
x-axis (frequency) to display logarithmically provides this function.
The following example uses the tracking generator to measure the stop
band attenuation of a 10 MHz low pass filter.
Step 1. To measure the response of a low pass filter, connect the equipment as
shown in Figure 13-5. This example uses a 10 MHz low pass filter.
Figure 13-5
Transmission Measurement Test Setup
Step 2. Perform a factory preset:
Press Preset, Factory Preset (if present).
Step 3. Set the start and stop frequencies:
Press FREQUENCY Channel, Start Freq, 100, kHz.
Press FREQUENCY Channel, Stop Freq, 1, GHz.
Press FREQUENCY Channel, Scale Type (Log).
Step 4. Set the resolution bandwidth to 10 kHz:
Press BW/Avg, Res BW, 10, kHz.
Step 5. For E4407B analyzers with option UKB, set the input coupling to DC:
Press Input, Coupling (DC).
Step 6. Turn on the tracking generator and if necessary, set the output power to
–10 dBm:
Press Source, Amplitude (On), –10, dBm.
CAUTION
Excessive signal input may damage the DUT. Do not exceed the
maximum power that the device under test can tolerate.
116
Chapter 13
Stimulus Response Measurements (ESA Options 1DN and 1DQ)
Measuring Stop Band Attenuation Using Log Sweep (ESA-E Series)
Step 7. Put the sweep time into stimulus response auto coupled mode:
Press Sweep, Swp Coupling (SR).
Adjust the reference level if necessary to place the signal on screen.
Step 8. Connect the cable (but not the DUT) from the tracking generator output
to the analyzer input. Store the frequency response into trace 3 and
normalize:
Press View/Trace, More, Normalize, Store Ref (1→3), Normalize (On).
level have changed to dB, indicating that this is now a relative
measurement.
Step 10. To change the normalized reference position:
Press View/Trace, More, Normalize, Norm Ref Posn, 9, Enter.
Step 11. Place the reference marker at the specified cutoff frequency:
Press Marker, Delta Pair (Ref), 10, MHz.
Step 12. Place the second marker at 20 MHz:
Press Delta Pair (Delta), 20, MHz.
In this example, the attenuation over this frequency range is
63.32 dB/octave (one octave above the cutoff frequency).
Step 13. Use the front-panel knob to place the marker at the highest peak in the
stop band to determine the minimum stop band attenuation. In this
example, the peak occurs at 708.76 MHz. The attenuation is 54.92 dB.
Figure 13-6
Minimum Stop Band Attenuation
Chapter 13
117
Stimulus Response Measurements
(ESA Options 1DN and 1DQ)
Step 9. Reconnect the DUT to the analyzer. Note that the units of the reference
Stimulus Response Measurements (ESA Options 1DN and 1DQ)
Making a Reflection Calibration Measurement
Making a Reflection Calibration Measurement
Stimulus Response Measurements
(ESA Options 1DN and 1DQ)
The following procedure makes a reflection measurement using a
coupler or directional bridge to measure the return loss of a filter. This
example uses a 200 MHz bandpass filter as the DUT.
The calibration standard for reflection measurements is usually a short
circuit connected at the reference plane (the point at which the device
under test (DUT) is connected.) See Figure 13-7. A short circuit has a
reflection coefficient of 1 (0 dB return loss). It reflects all incident power
and provides a convenient 0 dB reference.
Step 1. Connect the DUT to the directional bridge or coupler as shown in
Figure 13-7. Terminate the unconnected port of the DUT.
Figure 13-7
Reflection Measurement Short Calibration Test Setup
NOTE
If possible, use a coupler or bridge with the correct test port connector
for both calibrating and measuring. Any adapter between the test port
and DUT degrades coupler/bridge directivity and system source match.
Ideally, you should use the same adapter for the calibration and the
measurement. Be sure to terminate the second port of a two port device.
Step 2. Connect the tracking generator output of the analyzer to the directional
bridge or coupler.
Step 3. Connect the analyzer input to the coupled port of the directional bridge
or coupler.
Step 4. Perform a factory preset:
Press Preset, Factory Preset (if present).
118
Chapter 13
Stimulus Response Measurements (ESA Options 1DN and 1DQ)
Making a Reflection Calibration Measurement
Step 5. Turn on the tracking generator and set the output power to –10 dBm:
Press Source, Amplitude (On), –10, dBm.
Excessive signal input may damage the DUT. Do not exceed the
maximum power that the device under test can tolerate.
CAUTION
Step 6. Set the center frequency, span and resolution bandwidth:
Step 7. Replace the DUT with a short circuit.
Step 8. Normalize the trace:
View/Trace, More, Normalize, Store Ref (1→3), Normalize (On).
This activates the trace 1 minus trace 3 function and display the results
in trace 1 (see Figure 13-8). The normalized trace or flat line represents
0 dB return loss. Normalization occurs each sweep. Replace the short
circuit with the DUT.
NOTE
Since the reference trace is stored in trace 3, changing trace 3 to
Clear Write invalidates the normalization.
Figure 13-8
Short Circuit Normalized
Chapter 13
119
Stimulus Response Measurements
(ESA Options 1DN and 1DQ)
Press FREQUENCY Channel, Center Freq, 200, MHz.
Press SPAN X Scale, Span, 100, MHz.
Press BW/Avg, Res BW, 3, MHz.
Stimulus Response Measurements (ESA Options 1DN and 1DQ)
Measuring Return Loss using the Reflection Calibration Routine
Stimulus Response Measurements
(ESA Options 1DN and 1DQ)
Measuring Return Loss using the Reflection
Calibration Routine
This procedure uses the reflection calibration routine in the proceeding
procedure “Making a Reflection Calibration Measurement” on page 118
to calculate the return loss of the 200 MHz bandpass filter. See the
concepts section “Converting Return Loss to VSWR” on page 160 to find
the VSWR for the measured return loss.
Step 1. After calibrating the system with the above procedure, reconnect the
filter in place of the short circuit without changing any analyzer
settings.
Step 2. Use the marker to read return loss. Position the marker with the
front-panel knob to read the return loss at that frequency:
Press Marker, rotate front-panel knob.
NOTE
Or you can use the Min Search function to measure return loss by
pressing Peak Search, Min Search, a marker is placed at the point where
the return loss is maximized. See Figure 13-9.
Figure 13-9
Measuring the Return Loss of the Filter
120
Chapter 13
Demodulating and Viewing
Television Signals (ESA-E Series
Option B7B)
14
Demodulating and Viewing
Television Signals
(ESA-E Series Option B7B)
121
Demodulating and Viewing Television Signals (ESA-E Series Option B7B)
Demodulating and Viewing Television Signals
Demodulating and Viewing Television Signals
ESA-E Series with option B7B (TV trigger and picture on screen) allows
you to trigger the sweep of the analyzer on a specific television line of a
demodulated TV waveform. Option B7B also allows you to view the
television picture represented by the TV waveform on the color LCD
display of the analyzer.
This procedure sets up the analyzer to trigger on the TV video
waveform and to view the picture of the TV signal on the analyzer.
For more information on TV trigger setup see the concepts chapter “TV
Trigger Setup Menu Functions” on page 154.
Step 1. Connect a source which contains suitable TV carrier signals (for
example, terrestrial broadcast or CATV signals).
Step 2. Disable the background alignment process while viewing TV pictures:
Press System, Alignments, Auto Align, Off.
Demodulating and Viewing
Television Signals (ESA-E Series
Option B7B)
This is necessary to prevent the background alignment process from
interrupting the signal paths of the analyzer during the sweep retrace
period so as to maintain a constant, uninterrupted video waveform.
NOTE
After viewing the TV waveform or picture, re-enable the background
alignment process by pressing System, Alignments, Auto Align, All. If the
background alignment has been disabled for more than 60 minutes or
the ambient temperature has changed more than 3 degrees centigrade,
press System, Alignments, Align Now, All to ensure measurement
accuracy. See the Specifications and Characteristics Chapter for your
analyzer model in the specifications guide, for information about
alignment requirements.
Step 3. Set the center frequency of the analyzer to match the TV video carrier
frequency and set the span to 20 MHz to capture the TV channel:
Press FREQUENCY Channel, then enter the desired value and units.
Press SPAN X Scale, Span, 20, MHz.
Step 4. Auto couple the analyzer settings:
Press Auto Couple, Auto All (if present, newer software only).
Step 5. Adjust the reference level of the analyzer to the peak video carrier level:
Press AMPLITUDE Y Scale, then use the knob or step keys.
NOTE
If the signal is weak and accompanied by excessive noise, you may
choose to enable the internal preamp, if installed, to improve the
signal-to-noise ratio. Press AMPLITUDE, More, Int Preamp (On).
122
Chapter 14
Demodulating and Viewing Television Signals (ESA-E Series Option B7B)
Demodulating and Viewing Television Signals
When viewing the spectrum, for analog TV channels, there should be a
strong, “noise-like” video carrier at the center frequency, a weaker,
“noise-like” chrominance sub-carrier located 3.58 MHz (NTSC
standard) or 4.3 to 4.4 MHz (PAL or SECAM standards) above the video
carrier, and a tightly-grouped sound carrier located 4.5 to 6.5 MHz
above the video carrier. If you are viewing broadcast or cable TV
signals, the lower adjacent channel sound carrier may be very close to
the video carrier at the center frequency.
Step 6. Change the RBW to 3 MHz:
Press BW/Avg, Res BW, 3, MHz.
If the test signal does not have adjacent channels present, change the
resolution bandwidth to 5 MHz. If strong adjacent channel signals are
present (primarily the sound carrier of the lower adjacent channel), set
the RBW to 1 MHz.
Step 7. Set the amplitude scale type of the analyzer to linear:
Press AMPLITUDE Y Scale, Scale Type (Lin).
Step 8. Set the detector mode of the analyzer to sample:
Press Det/Demod, Detector, Sample.
Step 9. Set the analyzer in time-domain span:
Step 10. Adjust the reference level so that the signal peaks are within half of a
division of the top of the display.
Press AMPLITUDE Y Scale, then use the knob or arrow keys.
Step 11. Set up the TV trigger properties:
Press Trig, TV Trig Setup.
Press Field, Entire Frame, Sync (Pos) (or Sync (Neg) for SECAM signals.
Press Standard, then select the appropriate standard for the video
signal.
Press TV Source, SA.
Step 12. Enable the TV trigger:
Press Trig, TV.
The default line number for triggering can be changed to any value
from 1 to 525 or from 1 to 625, depending on the selected video
standard.
Step 13. Decrease the sweep time to view several TV lines (if you have option
AYX or B7D):
Press Sweep, Sweep Time, 500, µs.
Chapter 14
123
Demodulating and Viewing
Television Signals (ESA-E Series
Option B7B)
Press SPAN X Scale, Zero Span.
Demodulating and Viewing Television Signals (ESA-E Series Option B7B)
Demodulating and Viewing Television Signals
A time domain display of the demodulated TV waveform will now be
visible. The signals used for Figure 14-1 were produced by a Phillips
PM 5518-TX Color TV Pattern Generator.
Figure 14-1
Demodulated RF Waveform
Demodulating and Viewing
Television Signals (ESA-E Series
Option B7B)
LEFT: NTSC; PAL is Similar
RIGHT: SECAM
If Trig, TV is the active function, the line number used to trigger the
analyzer sweep can be changed to examine the different parts of the
video waveform. The line numbering scheme varies with TV standard,
but TV test patterns will often be inserted in or near line 17.
Step 14. Set a long sweep time of 100 seconds to minimize disruption of the
analog signal path during the instrument retrace to optimize picture
quality:
Press Sweep, Sweep Time, 100, s.
Step 15. To obtain the best color picture quality with NTSC and PAL signals, set
the center frequency 1.75 MHz above the video carrier frequency:
Press FREQUENCY Channel, CF Step, 1.75, MHz, Center Freq, ⇑.
Setting the center frequency above the video carrier frequency centers
the analyzer’s tuned frequency between the video carrier and the color
subcarrier.
Step 16. Turn on the spectrum analyzer display into a TV monitor:
Press Trig, TV Trig Setup, TV Monitor.
124
Chapter 14
Demodulating and Viewing Television Signals (ESA-E Series Option B7B)
Demodulating and Viewing Television Signals
Figure 14-2
TV Picture Display
NOTE
When using the knob to vary the value of the active function, be aware
that the instrument settings will not be updated until you stop turning
the knob. Make small movements of the knob with frequent pauses.
Chapter 14
125
Demodulating and Viewing
Television Signals (ESA-E Series
Option B7B)
When the picture is active, you can adjust the value of the function that
was active prior to enabling the picture. For example, if center
frequency was the active function and the frequency step size was set to
the TV channel frequency spacing, you can increment or decrement
through the TV channels by pressing the step keys (⇓ ⇑) of the analyzer.
If resolution bandwidth was the active function, you can increase or
decrease the amount of filtering to deal with strong adjacent channel
signals.
Demodulating and Viewing Television Signals (ESA-E Series Option B7B)
Measuring Depth of Modulation
Measuring Depth of Modulation
The depth of modulation provides a measure of the percentage of
amplitude modulation (AM) on the visual carrier. With Option B7B, the
analyzer can be used to measure the horizontal synchronization pulse
level and vertical interval test signal (VITS) white level on an
individual TV line from which a calculation of percent AM can be made.
Note that this measurement method will not be valid for some types of
scrambled video signals.
This procedure measures depth of modulation on an individual TV line.
For more information on TV trigger setup see the concepts chapter “TV
Trigger Setup Menu Functions” on page 154.
NOTE
Before continuing, be sure you have performed the steps in
“Demodulating and Viewing Television Signals” on page 122 at the
beginning of the section to display a TV waveform with linear scaling.
Step 1. Trigger on a TV line that has a test signal containing the reference
Demodulating and Viewing
Television Signals (ESA-E Series
Option B7B)
white level within the waveform (100 IRE) such as the FCC, NTC-7 or
ITU Composite Test Signal (typically found at or near line 17 within
field 1 or field 2):
Press Trig, TV, and enter a line number.
Step 2. Set the sweep time to 80 µs (option AYX or B7D required) to view a
complete TV line:
Press Sweep, Sweep Time, 80, µs.
Step 3. Set the resolution bandwidth and the video bandwidth to 1 MHz:
Press BW/Avg, Res BW, 1, MHz.
Press BW/Avg, Video BW, 1, MHz.
Step 4. Turn on video averaging to 10 averages:
Press BW/Avg, Average (On), 10, Enter.
This minimizes the waveform variations caused by the presence of
additional RF signals near the picture carrier, as well as waveform
noise or jitter.
Step 5. Enable a normal marker and using the front-panel knob move the
marker within the sync tip (NTSC or PAL waveforms) or the white level
(SECAM waveforms) at the top of the waveform:
Press Marker, Normal, then rotate the front-panel knob (or press Peak
Search).
126
Chapter 14
Demodulating and Viewing Television Signals (ESA-E Series Option B7B)
Measuring Depth of Modulation
Step 6. Enable a delta marker and using the front-panel knob move the delta
marker within the white level (NTSC or PAL waveforms) or the sync tip
(SECAM waveforms) at the bottom of the waveform:
Press Marker, Delta, then rotate front-panel knob (or press Peak Search,
Min Search).
Figure 14-3
Measuring Marker Delta (%) for Depth of Modulation (NTSC)
Chapter 14
127
Demodulating and Viewing
Television Signals (ESA-E Series
Option B7B)
The depth of modulation (in percent) can now be determined by
subtracting the marker readout (in percent) from 100. A typical value
would be 87.5%.
Demodulating and Viewing
Television Signals (ESA-E Series
Option B7B)
Demodulating and Viewing Television Signals (ESA-E Series Option B7B)
Measuring Depth of Modulation
128
Chapter 14
15
Concepts
Concepts
129
Concepts
Resolving Closely Spaced Signals
Resolving Closely Spaced Signals
Resolving Signals of Equal Amplitude
Two equal-amplitude input signals that are close in frequency can
appear as a single signal trace on the analyzer display. Responding to a
single-frequency signal, a swept-tuned analyzer traces out the shape of
the selected internal IF (intermediate frequency) filter (typically
referred to as the resolution bandwidth or RBW filter). As you change
the filter bandwidth, you change the width of the displayed response. If
a wide filter is used and two equal-amplitude input signals are close
enough in frequency, then the two signals will appear as one signal. If a
narrow enough filter is used, the two input signals can be discriminated
and appear as separate peaks. Thus, signal resolution is determined by
the IF filters inside the analyzer.
The bandwidth of the IF filter tells us how close together equal
amplitude signals can be and still be distinguished from each other. The
resolution bandwidth function selects an IF filter setting for a
measurement. Typically, resolution bandwidth is defined as the 3 dB
bandwidth of the filter. However, resolution bandwidth may also be
defined as the 6 dB or impulse bandwidth of the filter.
Concepts
Generally, to resolve two signals of equal amplitude, the resolution
bandwidth must be less than or equal to the frequency separation of the
two signals. If the bandwidth is equal to the separation and the video
bandwidth is less than the resolution bandwidth, a dip of
approximately 3 dB is seen between the peaks of the two equal signals,
and it is clear that more than one signal is present.
For ESA spectrum analyzers when the resolution bandwidth is ≥ 1 kHz
and for PSA spectrum analyzers in swept mode, to keep the analyzer
measurement calibrated, sweep time is automatically set to a value
that is inversely proportional to the square of the resolution bandwidth
(1/BW2). So, if the resolution bandwidth is reduced by a factor of 10, the
sweep time is increased by a factor of 100 when sweep time and
bandwidth settings are coupled. For the shortest measurement times,
use the widest resolution bandwidth that still permits discrimination of
all desired signals. Sweep time is also a function of which detector is in
use, peak detector sweeps as fast or more quickly than sample or
average detectors. The ESA allows you to select from 1 kHz to 3 MHz
resolution bandwidths in a 1, 3, 10 sequence and select a 5 MHz
resolution bandwidth. The PSA allows RBW selections up to 8 MHz in
the same steps as ESA and it has the flexibility to fine tune RBWs in
increments of 10% for a total of 160 RBW settings. The ESA and PSA
have CISPR bandwidths (200 Hz, 9 kHz and 120 kHz at −6 dB) for
maximum measurement flexibility. The PSA also has MIL EMI
bandwidths of 10 Hz, 100 Hz, 1 kHz, 10 kHz, 100 kHz and 1 MHz.
130
Chapter 15
Concepts
Resolving Closely Spaced Signals
For best sweep times and keeping the analyzer calibrated set the sweep
time (Sweep, Sweep Time) to Auto, and the auto sweep time (Sweep, Auto
Sweep Time) to Norm. Use the widest resolution bandwidth that still
permits resolution of all desired signals.
NOTE
For ESA-E Series Spectrum Analyzers:
Option 1DR adds narrower resolution bandwidths, from 10 Hz to
300 Hz, in a 1-3-10 sequence and 200 Hz CISPR bandwidth. These
bandwidths are digitally implemented and have a much narrower
shape factor than the wider, analog resolution bandwidths. Also, the
auto coupled sweep times when using the digital resolution bandwidths
are much faster than analog bandwidths of the same width. For
analyzers with Option 1DR, firmware revision A.08.00 and greater, and
Option 1D5 which adds a high-stability frequency precision reference to
the analyzer, resolution bandwidths of 1 Hz and 3 Hz are also available.
Resolving Small Signals Hidden by Large Signals
When dealing with the resolution of signals that are close together and
not equal in amplitude, you must consider the shape of the IF filter of
the analyzer, as well as its 3 dB bandwidth. (See “Resolving Signals of
Equal Amplitude” on page 130 for more information.) The shape of a
filter is defined by the selectivity, which is the ratio of the 60 dB
bandwidth to the 3 dB bandwidth. If a small signal is too close to a
larger signal, the smaller signal can be hidden by the skirt of the larger
signal.
To view the smaller signal, select a resolution bandwidth such that k is
less than a (see Figure 15-1). The separation between the two signals
(a) must be greater than half the filter width of the larger signal (k),
measured at the amplitude level of the smaller signal.
The digital filters in the ESA and PSA have filter widths about
one-third as wide as typical analog RBW filters. This enables you to
resolve close signals with a wider RBW (for a faster sweep time).
Figure 15-1
RBW Requirements for Resolving Small Signals
Concepts
Chapter 15
131
Concepts
Harmonic Distortion Calculations
Harmonic Distortion Calculations
The analyzer provides a one-button automated measurement for
harmonic measurements (from the second to the tenth harmonic) and
provides a calculation of the total harmonic distortion for continuous
wave signals or complex digitally modulated carriers.
When the harmonic distortion measurement is activated, the analyzer
searches for the fundamental and determines the frequencies of the
harmonics. The analyzer then changes to zero span, and measures the
amplitude of each harmonic. The analyzer calculates the total harmonic
distortion by dividing the root-sum-squares of the harmonic voltages by
the fundamental signal voltage and then provides the result as a
percentage.
Hmax
2
∑ Eh
h=2
%THD = 100 × ---------------------------Ef
Where:
%THD = Total Harmonic Distortion as a percentage
h = harmonic number
Hmax = Maximum Harmonic Value listed
Eh = voltage of harmonic h
Ef = voltage of fundamental signal
Example of a THD calculation:
If the number of harmonics selected is 5 (Hmax = 5) and the measured
values are as follows:
E f = 5 dBm = 3.162 mW = 397.6 mV
E 2 = – 42 dBc = –37 dBm = 199.5 nW = 3.159 mV
E 3 = – 26 dBc = –21 dBm = 7.943 µW = 19.93 mV
E 4 = – 49 dBc = –44 dBm = 39.81 nW = 1.411 mV
Concepts
E 5 = – 36 dBc = –31 dBm = 794.3 nW = 6.302 mV
then,
2
2
2
2
3.159 mV + 19.93 mV + 1.411mV + 6.301 mV
THD = 100 × --------------------------------------------------------------------------------------------------------------------------------- = 5.33%
397.6 mV
132
Chapter 15
Concepts
Time Gating Concepts
Time Gating Concepts
Introduction: Using Time Gating on a Simplified
Digital Radio Signal
This section shows you the concepts of using time gating on a simplified
digital radio signal. “Making Time-Gated Measurements” on page 57
demonstrates time gating examples using the ESA and PSA.
Figure 15-2 shows a signal with two radios, radio 1 and radio 2, that are
time-sharing a single frequency channel. Radio 1 transmits for 1 ms
then radio 2 transmits for 1 ms.
Figure 15-2
Simplified Digital Mobile-Radio Signal in Time Domain
We want to measure the unique frequency spectrum of each
transmitter.
A spectrum analyzer without time gating cannot do this. By the time
the spectrum analyzer has completed its measurement sweep, which
lasts about 50 ms, the radio transmissions switch back and forth 25
times. Because the radios are both transmitting at the same frequency,
their frequency spectra overlap, as shown in Figure 15-3. The spectrum
analyzer shows the combined spectrum; you cannot tell which part of
the spectrum results from which signal.
Concepts
Chapter 15
133
Concepts
Time Gating Concepts
Figure 15-3
Frequency Spectra of the Combined Radio Signals
Concepts
Time gating allows you to see the separate spectrum of radio 1 or
radio 2 to determine the source of the spurious signal, as shown in
Figure 15-4.
Figure 15-4
Time-Gated Spectrum of Radio 1
Figure 15-5
Time-Gated Spectrum of Radio 2
Time gating lets you define a time window (or time gate) of when a
measurement is performed. This lets you specify the part of a signal
that you want to measure, and exclude or mask other signals that
might interfere.
134
Chapter 15
Concepts
Time Gating Concepts
How Time Gating Works
Time gating is achieved by the spectrum analyzer selectively
interrupting the path of the detected signal, with a gate, as shown in
Figure 15-7 and Figure 15-8. The gate determines the times at which it
captures measurement data (when the gate is turned “on,” under the
Gate menu, the signal is being passed, otherwise when the gate is “off,”
the signal is being blocked). Under the right conditions, the only signals
that the analyzer measures are those present at the input to the
analyzer when the gate is on. With the correct spectrum analyzer
settings, all other signals are masked out.
There are typically two main types of gating conditions, edge and level:
• With edge gating, the gate timing is controlled by user parameters
(gate delay and gate length) following the selected (rising or falling)
edge of the trigger signal. The gate passes a signal on the edge of the
trigger signal (after the gate delay time has been met) and blocks the
signal at the end of the gate length.
With edge gating, the gate control signal is usually an external
periodic TTL signal that rises and falls in synchronization with the
rise and fall of the pulsed radio signal. The gate delay is the time the
analyzer waits after the trigger event to enable the gate (see Figure
15-6).
• With level gating, the gate will pass a signal when the gate signal
meets the specified level (high or low). The gate blocks the signal
when the level conditions are no longer satisfied (level gating does
not use gate length or gate delay parameters).
Figure 15-6
Edge Trigger Timing Relationships
Chapter 15
135
Concepts
With Agilent PSA and ESA spectrum analyzers, there are three
different implementations for time gating; gated LO, gated video and
gated FFT. Gated LO and gated FFT are only available on the PSA
spectrum analyzers while gated video is only available on the ESA.
Concepts
Time Gating Concepts
Gated LO Concepts (PSA Spectrum Analyzers)
Gated LO is a very sophisticated type of time gating that sweeps the LO
only while the gate is “on” and the gate is passing a signal. See Figure
15-7 for a simplified block diagram of gated LO operation. Notice that
the gate control signal controls when the scan generator is sweeping
and when the gate passes or blocks a signal. This allows the analyzer to
sweep only during the periods when the gate passes a signal. Since
gated LO only sweeps during periods when the gate is “on” and the gate
is passing a signal, gated LO results in faster measurements than gated
video.
Figure 15-7
Gated LO PSA Spectrum Analyzer Block Diagram
NOTE
Gated LO is available on all PSA models with firmware release A.04.12
or greater and the appropriate hardware. See service notes E4440A-09,
E4443A-08, E4445A-08, E4446A-06 or E4448A-07 for more information
on the hardware requirements.
Gated Video Concepts (ESA Spectrum Analyzers)
Concepts
Gated video may be thought of as a simple gate switch, which connects
the signal to the input of the spectrum analyzer. When the gate is “on”
(under the Gate menu) the gate is passing a signal. When the gate is
“off,” the gate is blocking the signal. Whenever the gate is passing a
signal, the analyzer sees the signal. In Figure 15-8 notice that the gate
is placed after the envelope detector and before the video bandwidth
filter in the IF path (hence “gated video”).
The RF section of the spectrum analyzer responds to the signal. The
selective gating occurs before the video processing. This means that
there are some limitations on the gate settings because of signal
response times in the RF signal path.
136
Chapter 15
Concepts
Time Gating Concepts
With video gating the analyzer is continually sweeping, independent of
the position and length of the gate. The analyzer must be swept at a
minimum sweep time (see the sweep time calculations later in this
chapter) to capture the signal when the gate is passing a signal.
Because of this, video gating is typically slower than gated LO and
gated FFT.
Figure 15-8
Gated Video ESA Spectrum Analyzer Block Diagram
NOTE
Gated video is available only on the Agilent ESA-E Series spectrum
analyzers (E4401B, E4402B, E4404B, E4405B and E4407B) with option
1D6.
Gated FFT Concepts (PSA Spectrum Analyzer)
Gated FFT (Fast-Fourier Transform) is an FFT measurement which
begins when the trigger conditions are satisfied.
The process of making a spectrum measurement with FFTs is
inherently a “gated” process, in that the spectrum is computed from a
time record of short duration, much like a gate signal in swept-gated
analysis.
Using the PSA in FFT mode, the duration of the time record to be gated
is:
1.83
FFT Time Record (to be gated) = ------------RBW
Chapter 15
137
Concepts
The duration of the time record is within a tolerance of approximately
3% for resolution bandwidths up through 1 MHz. Unlike swept gated
analysis, the duration of the analysis in gated FFT is fixed by the RBW,
not by the gate signal. Because FFT analysis is faster than swept
analysis (up to 10 MHz), the gated FFT measurements can have better
frequency resolution (a narrower RBW) than swept analysis for a given
duration of the signal to be analyzed.
Concepts
Time Gating Concepts
Figure 15-9
Gated FFT Timing Diagram
Time Gating Basics (Gated LO and Gated Video)
The gate passes or blocks a signal with the following conditions:
• Trigger condition - Usually an external transistor-transistor logic
(TTL) periodic signal for edge triggering and a high/low TTL signal
for level triggering.
• Gate delay - The time after the trigger condition is met when the
gate will pass a signal (for edge triggering).
Concepts
• Gate length - The gate length setting determines the length of time a
gate will pass a signal (for edge triggering).
To understand time gating better, consider a spectrum measurement
performed on two pulsed-RF signals sharing the same frequency
spectrum. You will need to consider the timing interaction of three
signals with this example:
• The composite of the two pulsed-RF signals.
138
Chapter 15
Concepts
Time Gating Concepts
• The gate trigger signal (a periodic TTL level signal).
• The gate signal. This TTL signal is low when the gate is "off"
(blocking) and high when the gate is "on" (passing).
The timing interactions between the three signals are best understood
if you observe them in the time domain (see Figure 15-10).
The main goal is to measure the spectrum of signal 1 and determine if it
has any low-level modulation or spurious signals.
Because the pulse trains of signal 1 and signal 2 have almost the same
carrier frequency, their spectra overlap. Signal 2 will dominate in the
frequency domain due to its greater amplitude. Without gating, you
won't see the spectrum of signal 1; it is masked by signal 2.
To measure signal 1, the gate must be on only during the pulses from
signal 1. The gate will be off at all other times, thus excluding all other
signals. To position the gate, set the gate delay and gate length, as
shown in Figure 15-10, so that the gate is on only during some central
part of the pulse. Carefully avoid positioning the gate over the rising or
falling pulse edges. When gating is activated, the gate output signal
will indicate actual gate position in time, as shown in the line labeled
"Gate."
Figure 15-10
Timing Relationship of Signals During Gating
Chapter 15
139
Concepts
Once the spectrum analyzer is set up to perform the gate measurement,
the spectrum of signal 1 is visible and the spectrum of signal 2 is
excluded, as shown if Figure 15-12. In addition, when viewing signal 1,
you also will have eliminated the pulse spectrum generated from the
pulse edges. Gating has allowed you to view spectral components that
otherwise would be hidden.
Concepts
Time Gating Concepts
Figure 15-11
Signal within pulse #1 (time-domain view)
Figure 15-12
Using Time Gating to View Signal 1 (spectrum view)
Moving the gate so that it is positioned over the middle of signal 2
produces a result as shown in Figure 15-14. Here, you see only the
spectrum within the pulses of signal 2; signal 1 is excluded.
Signal within pulse #2 (time-domain view)
Figure 15-14
Using Time Gating to View Signal 2 (spectrum view)
Concepts
Figure 15-13
140
Chapter 15
Concepts
Time Gating Concepts
Measuring a Complex/Unknown Signal
NOTE
The steps below help to determine the spectrum analyzer settings when
using time gating. The steps apply to the time gating approaches using
gated LO on the PSA and gated video on the ESA.
This example shows you how to use time gating to measure a very
specific signal. Most signals requiring time gating are fairly complex
and in some cases extra steps may be required to perform a
measurement.
Step 1. Determine how your signal under test appears in the time domain and
how it is synchronized to the trigger signal.
You need to do this to position the time gate by setting the delay
relative to the trigger signal. To set the delay, you need to know the
timing relationship between the trigger and the signal under test.
Unless you already have a good idea of how the two signals look in the
time domain, you can examine the signals with an oscilloscope to
determine the following parameters:
• Trigger type (edge or level triggering)
• Pulse repetition interval (PRI), which is the length of time between
trigger events (the trigger period).
• Pulse width, or τ
• Signal delay (SD), which is the length of time occurring between the
trigger event and when the signal is present and stable. If your
trigger occurs at the same time as the signal, signal delay will be
zero.
Concepts
Chapter 15
141
Concepts
Time Gating Concepts
Figure 15-15
Time-domain Parameters
In Figure 15-15, the parameters are:
• Pulse repetition interval (PRI) is 5 ms.
• Pulse width (τ) is 3 ms.
• Signal delay (SD) is 1 ms for positive edge trigger (0.8 ms for
negative edge trigger).
• Gate delay (D) is 2.5 ms.
• Setup time (SUT) is 1.5 ms.
Step 2. Set the spectrum analyzer sweep time:
PSA: Sweep time does not affect the results of gated LO unless the
sweep time is set too fast. In the event the sweep time is set too fast,
Meas Uncal appears on the screen and the sweep time will need to be
increased.
Concepts
ESA: Sweep time does affect the results from gated video. The sweep
time must be set accordingly for correct time gating results. The sweep
time should be set to at least the number of sweep points - 1 multiplied
by the PRI (pulse repetition interval).
Step 3. Locate the signal under test on the display of the spectrum analyzer.
Set the center frequency and span to view the signal characteristics
that you are interested in measuring. Although the analyzer is not yet
configured for correct gated measurements, you will want to determine
the approximate frequency and span in which to display the signal of
interest. If the signal is erratic or intermittent, you may want to hold
the maximum value of the signal with Max Hold (located under the
142
Chapter 15
Concepts
Time Gating Concepts
View/Trace (ESA) or Trace/View (PSA) menu) to determine the frequency
of peak energy.
To optimize measurement speed, set the span narrow enough so that
the display will still show the signal characteristics you want to
measure. For example, if you wanted to look for spurious signals within
a 200 kHz frequency range, you might set the frequency span to just
over 200 kHz.
Step 4. Determine the setup time and signal delay to set up the gate signal.
Turn on the gate and adjust the gate parameters including gate delay
and gate length as shown below.
Generally, the gate should be positioned over a part of the signal that is
stable, not over a pulse edge or other transition that might disturb the
spectrum. Starting the gate at the center of the pulse gives a setup time
of about half the pulse width. Setup time describes the length of time
during which that signal is present and stable before the gate comes on.
The setup time (SUT) must be adequately long enough for the RBW
filters to settle following the burst-on transients. Signal delay (SD) is
the length of time after the trigger, but before the signal of interest
occurs and becomes stable. If the trigger occurs simultaneously with the
signal of interest, SD is equal to zero, and SUT is equal to the gate
delay. Otherwise, SUT is equal to the gate delay minus SD. See Figure
15-16.
Figure 15-16
Positioning the Gate
There is flexibility in positioning the gate, but some positions offer a
wider choice of resolution bandwidths. A good rule of thumb is to
position the gate from 20% to 80% of the burst for PSA, and 25% to 80%
of the burst for ESA. Doing so provides a reasonable compromise
between setup time and gate length.
Concepts
Chapter 15
143
Concepts
Time Gating Concepts
Figure 15-17
Best Position for Gate
As a general rule, you will obtain the best measurement results if you
position the gate relatively late within the signal of interest, but
without extending the gate over the trailing pulse edge or signal
transition. Doing so maximizes setup time and provides the resolution
bandwidth filters of the spectrum analyzer the most time to settle
before a gated measurement is made. "Relatively late," in this case,
means allowing a setup time of approximately 2 divided by the
resolution bandwidth (see step 5 for RBW calculations).
As an example, if you want to use a 1 kHz resolution bandwidth for
measurements, you will need to allow a setup time of at least 2 ms.
Note that the signal need not be an RF pulse. It could be simply a
particular period of modulation in a signal that is continuously
operating at full power, or it could even be during the off time between
pulses. Depending on your specific application, adjust the gate position
to allow for progressively longer setup times (ensuring that the gate is
not left on over another signal change such as a pulse edge or
transient), and select the gate delay and length that offer the best
signal-to-noise ratio on the display.
If you were measuring the spectrum occurring between pulses, you
should use the same (or longer) setup time after the pulse goes away,
but before the gate goes on. This lets the resolution bandwidth filters
fully discharge the large pulse before the measurement is made on the
low-level interpulse signal.
Setup Time for Interpulse Measurement
Concepts
Figure 15-18
144
Chapter 15
Concepts
Time Gating Concepts
Step 5. The resolution bandwidth will need to be adjusted for gated LO and
gated video. The video bandwidth will only need to be adjusted for gated
video.
Resolution Bandwidth:
The resolution bandwidth you can choose is determined by the gate
position, so you can trade off longer setup times for narrower resolution
bandwidths. This trade-off is due to the time required for the
resolution-bandwidth filters to fully charge before the gate comes on.
Setup time, as mentioned, is the length of time that the signal is
present and stable before the gate comes on.
Figure 15-19
Resolution Bandwidth Filter Charge-Up Effects
Because the resolution-bandwidth filters are band-limited devices, they
require a finite amount of time to react to changing conditions.
Specifically, the filters take time to charge fully after the analyzer is
exposed to a pulsed signal.
Because setup time should be greater than filter charge times, be sure
2
RBW
2.16
RBW
that: ( ESA )SUT > ------------- and ( PSA )SUT > ------------- + 3.3µs
3 - + 1.5µs
( PSA )Gate Length > -----------RBW
where SUT is the same as the gate delay in this example. In this
example with SUT equal to 1.5 ms, for ESA, RBW is greater than 2/1.5
ms; that is, RBW is greater than 1333 Hz. The resolution bandwidth
should be set to the next larger value, 3 kHz.
Video Bandwidth:
Chapter 15
145
Concepts
Just as the resolution bandwidth filter needs a finite amount of time to
charge and discharge, so does the video filter, which is a post-detection
filter used mainly to smooth the measurement trace. Regardless of the
length of the real RF pulse, the video filter sees a pulse no longer than
the gate length, and the filter will spend part of that time charging up.
Concepts
Time Gating Concepts
Reducing the video-bandwidth filter too fast causes the signal to appear
to drop in amplitude on the screen.
If you are in doubt about the proper video bandwidth to choose, set it to
its maximum and reduce it gradually until the detected signal level
drops slightly. Then reset it to the value it was at just before the signal
dropped.
Leave both RBW and VBW in the manual mode, not Auto. This is
important so that they will not change if the span is changed. The
setting readout on the bottom line of the analyzer screen should show a
"#" sign next to the function names (for example, #Res BW, #VBW, and
#Sweep), indicating that they have been set manually.
Setting the ESA VBW:
To ensure that a true peak value is obtained before the gate goes off, the
video filter must have a charge time of less than the gate length. For
this purpose, you can approximate the charge time of the video filter as
1/VBW, where VBW is the −3 dB bandwidth of the video filter.
1
( ESA )VBW
Therefore, you will want to be sure that: gate length > -----------------------------
For example using ESA, if you use a 1 kHz video bandwidth for noise
smoothing, you need a gate length greater than 1 ms. Alternatively, if
you use a gate as narrow as 1 µs, you should use a video filter of 1 MHz.
Setting the PSA VBW:
For gated LO measurements the VBW filter acts as a track-and-hold
between sweep times. With this behavior, the VBW does not need to
resettle on each restart of the sweep.
Step 6. Adjust span as necessary, and perform your measurement.
Concepts
The analyzer is set up to perform accurate measurements. Freeze the
trace data by activating single sweep, or by placing your active trace in
view mode. Use the markers to measure the signal parameters you
chose in step 1. If necessary, adjust span, but do not decrease resolution
bandwidth, video bandwidth, or sweep time.
146
Chapter 15
Concepts
Time Gating Concepts
"Quick Rules" for Making Time-Gated Measurements
This section summarizes the rules described in the previous sections.
Table 15-1
Determining Spectrum Analyzer Settings for Viewing a Pulsed
RF Signal
Spectrum
Analyzer
Function
Spectrum Analyzer Setting
Comments
Sweep Time
(gated video
only - ESA)
Set the sweep time to be equal
to or greater than
Because the gate must be on at least
once per trace point, the sweep time
should be set such that the sweep time
for each trace point is greater than or
equal to the pulse repetition interval.
Gate Delay
(number of sweep points - 1) ×
pulse repetition interval (PRI):
The gate delay is equal to the
signal delay plus one-fourth the
pulse width:
Gate Delay = Signal Delay + τ/4
Gate Length
The gate length minimum is
equal to one-fourth the pulse
width (maximum about
one-half):
Gate Length = τ/4
(PSA) Gate Length > 3/RBW +
1.5 µs
Resolution
Bandwidth
Set the resolution bandwidth:
(ESA) RBW > 2/(Gate Delay −
Signal Delay)
The gate delay must be set so that the
gating captures the pulse. If the gate
delay is too short or too long, the gating
can miss the pulse or include resolution
bandwidth transient responses.
If the gate length is too long, the signal
display can include transients caused by
the spectrum analyzer filters.
The recommendation for gate placement
can be between 20% to 80% of the pulse
for PSA and 25% to 80% of the pulse for
ESA.
The resolution bandwidth must be wide
enough so that the charging time for the
resolution bandwidth filters is less than
the pulse width of the signal.
(PSA) RBW > 2.16/(Gate Delay
− Signal Delay) + 3.3 µs
Video
Bandwidth
Set the video bandwidth:
(ESA) VBW > 1/gate length
The video bandwidth must be wide
enough so that the rise times of the video
bandwidth does not attenuate the signal
(in gated video applications). There are
no requirements for PSA VBW settings
using gated LO.
Concepts
Chapter 15
147
Concepts
Time Gating Concepts
Figure 15-20
Gate Positioning Parameters
Most control settings are determined by two key parameters of the
signal under test: the pulse repetition interval (PRI) and the pulse
width (τ). If you know these parameters, you can begin by picking some
standard settings. Table 15-2 and Table 15-3 summarize the
parameters for a signal whose trigger event occurs at the same time as
the beginning of the pulse (in other words, SD is 0). If your signal has a
non-zero delay, just add it to the recommended gate delay.
Concepts
Table 15-2
Suggested Initial Settings for Known Pulse Width (τ) and Zero
Signal Delay
Pulse width (τ)
Gate Delay
(SD + τ/2)
Resolution
Bandwidth
(2>SUT)
Gate Length
(τ/4)
Video Bandwidth
(1/gate length)
ESA gated video
only
4 µs
3 µs
1 MHz
1 µs
1 MHz
10 µs
5 µs
1 MHz
3 µs
1 MHz
50 µs
25 µs
100 kHz
13 µs
100 kHz
63.5 µs
32 µs
100 kHz
16 µs
100 kHz
100 µs
50 µs
100 kHz
25 µs
100 kHz
500 µs
250 µs
10 kHz
125 µs
10 kHz
1 ms
500 µs
10 kHz
250 µs
10 kHz
5 ms
2.5 ms
1 kHz
1.25 ms
1 kHz
10 ms
5 ms
1 kHz
2.5 ms
1 kHz
16.6 ms
8.3 ms
1 kHz
4 ms
1 kHz
33 ms
16.5 ms
1 kHz
8 ms
1 kHz
50 ms
25 ms
1 kHz
13 ms
1 kHz
100 ms
50 ms
1 kHz
25 ms
1 kHz
≥130 ms
65 ms
1 kHz
33 ms
1 kHz
148
Chapter 15
Concepts
Time Gating Concepts
NOTE
Table 15-3 below applies only to ESA spectrum analyzers. PSA gated
LO time gating is not affected by analyzer sweep times (unless the
sweep time is set too fast, Meas Uncal appears on the screen and the
sweep time will need to be increased).
Table 15-3
Suggested Sweep Times for an ESA at 401 Sweep Points and a
Known Pulse Repetition Interval or Pulse Repetition
Frequency
Pulse Repetition
Interval (PRI)
Pulse Repetition
Frequency (PRF)
Sweep Time (minimum)*
50 µs
20 kHz
20.1 ms
100 µs
10 kHz
40.1 ms
500 µs
2 kHz
201 ms
1 ms
1 kHz
401 ms
5 ms
200 Hz
2.01 s
10 ms
100 Hz
4.01 s
16.7 ms
60 Hz
6.7 s
20 ms
50 Hz
8.02 s
33.3 ms
30 Hz
13.4 s
50 ms
20 Hz
20.1 s
100 ms
10 Hz
40.1 s
>170 ms
Use the MAX HOLD trace function and take several measurement sweeps.
* The number of sweep points can be set to values between 101 and 8192. The minimum
sweep time is equal to the (number of sweep points minus 1) times (pulse repetition
interval).
Table 15-4
If You Have a Problem with the Time-Gated Measurement
Symptom
Possible Causes
Suggested Solution
(ESA only) Erratic analyzer
trace with random vertical
lines or dropouts extending
below the peak trace
amplitude.
1) Sweep rate too fast to
ensure at least one gate
occurrence per trace point.
2) Detector may be set to
something other than peak,
sample or average.
Increase sweep time until
dropouts disappear. See
Table 15-3 for sweep time
calculations.
Concepts
Chapter 15
149
Concepts
Time Gating Concepts
Table 15-4
If You Have a Problem with the Time-Gated Measurement
Symptom
Possible Causes
Suggested Solution
Erratic analyzer trace with
dropouts that are not
removed by increasing
analyzer sweep time;
oscilloscope view of gate
output signal jumps
erratically in time domain.
Gate Delay may be greater
than trigger repetition
interval.
Reduce Gate Delay until it
is less than trigger interval.
Gate does not trigger.
1) Gate trigger voltage may
be too low.
2) Gate may not be
activated.
3) (PSA) Gate Source
selection may be wrong.
Ensure gate trigger reaches
TTL levels. Check to see if
other connections to trigger
signal may be reducing
voltage. If using an
oscilloscope, check that all
inputs are high impedance,
not 50 Ω.
Display spectrum does not
change when the gate is
turned on.
Insufficient setup time.
Increase setup time for the
current resolution
bandwidth, or increase
resolution bandwidth.
Displayed spectrum too low
in amplitude.
Resolution bandwidth or
video bandwidth filters not
charging fully.
Widen resolution
bandwidth or video
bandwidth, or both.
Concepts
For PSA check Gate View to
make sure the gate delay is
timed properly.
150
Chapter 15
Concepts
Time Gating Concepts
Using the Edge Mode or Level Mode for Triggering
NOTE
PSA spectrum analyzers use edge mode triggering. ESA spectrum
analyzers can use edge or level triggering modes.
Depending on the trigger signal that you are working with, you can
trigger the gate in one of two separate modes: edge or level. This
gate-trigger function is separate from the normal external trigger
capability of the spectrum analyzer, which initiates a sweep of a
measurement trace based on an external TTL signal.
Edge Mode
Edge mode lets you position the gate relative to either the rising or
falling edge of a TTL trigger signal. The left diagram of Figure 15-21
shows triggering on the positive edge of the trigger signal while the
right diagram shows negative edge triggering.
Example of key presses to initiate positive edge triggering:
(ESA) Press Sweep, Gate, Edge Gate, Slope (Pos).
(PSA) Press Sweep, Gate Setup, Polarity (Pos).
Figure 15-21
Using Positive or Negative Edge Triggering
Level Mode (ESA)
Chapter 15
151
Concepts
In level gate-control mode, an external trigger signal opens and closes
the gate. Either the TTL high level or TTL low level opens the gate,
depending on the setting of Level Gate. Gate delay and gate length
control functions are not applicable when using level mode triggering.
Level mode is useful when your trigger signal occurs at exactly the
same time as does the portion of the signal you want to measure.
Concepts
Time Gating Concepts
Noise Measurements Using Time Gating
Time gating can be used to measure many types of signals. However,
they must be repetitive and for ESA, have a TTL timing trigger signal
available to synchronize the gate. Noise is not a repetitive signal, so if
you need to use gating when measuring noise, you should understand
the impact on the measurement results.
To measure the power accurately of a noisy signal, or noise-like signal
with time gating, a sample or average detector should be used. Average
and sample detection is available for both ESA and PSA spectrum
analyzers when time gating is on.
If peak detection is used during a gated measurement the power
reading will be higher than if average detection is used. The resulting
value increases as the time interval increases, because the probability
of finding the statistically rarer larger peaks increases. For very
accurate noise measurements using the gated function, the impact of
these considerations must be calculated based on the current spectrum
analyzer settings.
The equation below can be used to calculate a correction value for the
measured noise using peak detection. Subtract the correction from the
measured value.
Correction = 10 log 10 [ ln ( 2πτBW i + e ) ]
where:
BWi
is the impulse bandwidth
ESA is approximately 1.62 × resolution bandwidth, for
resolution bandwidths ≥1 kHz.
PSA is approximately 1.5 × resolution bandwidth, for
resolution bandwidths ≤3 MHz.
τ
is the time interval over which the peak detection
occurs and is equal to the sweep time/(number of sweep
points − 1).
Concepts
Refer to Agilent Technologies Application Note 1303, page 18, for more
details.
152
Chapter 15
Concepts
Trigger Concepts
Trigger Concepts
Selecting a Trigger
NOTE
If you are using an ESA with firmware revision A.07.xx or lower, you
can use video and external triggering as set up below in numbers 1 and
2. If you have firmware A.08.xx or later and Option B7E with board
part number E4401-60224 or higher, RF burst triggering is also
available (recommended for this example). PSA can use video, external
and RF burst triggering.
To determine the ESA firmware revision number and hardware board
part number:
Press System, More, Show System.
Press System, More, Show Hdwr.
1. Video Triggering
Video triggering controls the sweep time based on the detected and
VBW filtered envelop signal to steady the bursted signal on the
display and to synchronize the measurement with the burst of
interest. Video triggering triggers the measurement at the point at
which the rising signal crosses the video trigger horizontal green line
on the display:
Press Trig, Video, −30, dBm.
2. External Triggering
In the event that you have an external trigger available that can be
used to synchronize with the burst of interest, connect the trigger
signal to the rear of the ESA using the GATE TRIG/EXT TRIG IN
(TTL) input connector. For the PSA use either the trigger input
connector on the front (EXT TRIGGER IN) or the rear (TRIGGER IN) of
the instrument. It might be necessary to adjust the trigger level (as
indicated by the lower horizontal green line) by rotating the front
panel knob or by entering the numeric value on the keypad.
(ESA) Press Trig, External.
(PSA) Press Trig, Ext Front or Ext Rear.
3. RF Burst Triggering
Press Trig, RF Burst.
Chapter 15
153
Concepts
RF burst triggering occurs in the IF circuitry chain, as opposed to
after the video detection circuitry with video triggering. In the event
video triggering is used, the detection filters are limited to the
maximum width of the resolution bandwidth filters. Set the analyzer
in RF burst trigger mode (RF burst is a default trigger for PSA):
Concepts
Trigger Concepts
TV Trigger
TV Trigger Setup Menu Functions
• TV Source
When TV Source is set to SA, the analyzer demodulates the TV
signal, by using the analyzer as a fixed tuned receiver. This allows
stable, zero span sweeps of the baseband video waveform (band
limited by the RBW and VBW filters).
When TV Source is set to EXT VIDEO IN, an external baseband video
signal may be used to produce the TV line trigger. In this case, an
external TV tuner can be used to obtain the baseband waveform of
the given RF carrier for triggering the analyzer sweep. This will
allow the analyzer to be used in swept mode for measurements of the
RF spectrum to synchronize to the video modulation. The EXT VIDEO
IN connector is located on the rear panel of the analyzer.
• TV Standard
Selection of a TV standard establishes the number of TV lines and
the kind of color encoding method that is used. The number of TV
lines establishes the defaults for the TV line counting circuits of the
analyzer and the color encoding method is used to properly set up
the TV picture display circuits. Option B7B supports both 525 line
and 625 line systems and can provide a color TV picture output for
NTSC and PAL color encoding methods. A black and white picture is
provided for the SECAM method.
The ability to display a color picture is limited by the bandwidth
settings of the analyzer (resolution bandwidth and video
bandwidth). However, baseband video signals input to the EXT
VIDEO IN connector on the rear panel of the analyzer are minimally
filtered, allowing a full color display of NTSC or PAL TV signals.
Concepts
Table 15-5
TV Standard
Number of
Lines per
Frame
Approximate
Field Rate
Color
Encoding
Method
Color
Subcarrier
Frequency
NTSC-M
525
60 Hz
NTSC
3.58 MHz
NTSC-Japan
(no pedestal)
525
60 Hz
NTSC
3.58 MHz
PAL-M
525
60 Hz
PAL
4.43 MHz
PAL-B,D,G,H,I
625
50 Hz
PAL
4.43 MHz
PAL-N
625
50 Hz
PAL
4.43 MHz
PAL-N
Combination
625
50 Hz
PAL
3.58 MHz
154
Chapter 15
Concepts
Trigger Concepts
Table 15-5
TV Standard
Number of
Lines per
Frame
Approximate
Field Rate
Color
Encoding
Method
Color
Subcarrier
Frequency
SECAM
625
50 Hz
SECAM
4.406 MHz,
4.250 MHz
• Field
A television image or frame is composed of 525 (or 625 lines)
delivered in two successive fields of 262.5 (or 312.5 lines) interlaced
together on a CRT when displayed.
When Field is set to Entire Frame, the line count starts at line one in
field one (often referred to as the “odd field”) and ends at 525 (or 625)
in field two (often referred to as the “even field”).
When Field is set to Field One or Field Two, the line count begins at “1”
with the first full line in the selected field and ends at count 263 (or
313) for Field One, and 262 (or 312) for Field Two.
• Sync
Analog broadcast or cable television signals are usually amplitude
modulated on an RF carrier. For NTSC and PAL broadcasts,
typically the RF carrier amplitude is maximized at the sync tips of
the baseband video waveform and minimized at the “white” level.
This results in a demodulated waveform on the analyzer where the
sync pulses are on top, or positive (Sync (Pos)).
With SECAM broadcasts, typically the RF carrier amplitude is
minimized at the sync tips of the video waveform and maximized at
the “white” level. This results in a waveform on the analyzer where
the sync pulses are at the bottom, or negative (Sync (Neg)).
A normal baseband video waveform for all TV standards will have
the sync tips on the bottom. When TV Source is set to Ext Video In,
Sync should be set to Neg.
• TV Monitor
When TV Monitor is pressed, the picture represented by the video
waveform selected with TV Source is presented on the LCD display of
the analyzer. The picture can only be viewed, not printed or saved.
Pressing a key that normally brings up a menu restores the original
graphical display with the selected menu enabled.
Concepts
Chapter 15
155
Concepts
Trigger Concepts
Trigger Settings and Fast Time Domain Sweeps
Trigger delay can be used to move the sweep trigger point arbitrarily
across a given TV line or lines to allow closer examination of waveform
patterns (Press Trig, Trig Delay, and enter a delay time).
Concepts
In fast sweeps (20 µs to less than 5 ms), there may be up to one trace
point of variation in the start time of the waveform digitalization
process with respect to the actual TV trigger pulse. This randomness
leads to the appearance of visual jitter on the LCD display of the
analyzer. In this situation, video averaging may be used (N = 5, for
example) to improve the “visual stability” of the displayed waveform.
This type of jitter does not occur when sweep times are set greater than
or equal to 5 ms where digitalization begins less than 100 ns after the
trigger pulse in that mode (much less than 1 trace point of jitter).
156
Chapter 15
Concepts
AM and FM Demodulation Concepts
AM and FM Demodulation Concepts
Demodulating an AM Signal Using the Analyzer as a
Fixed Tuned Receiver (Time-Domain)
The zero span mode can be used to recover amplitude modulation on a
carrier signal.
The following functions establish a clear display of the waveform:
• Triggering stabilizes the waveform trace by triggering on the
modulation envelope. If the modulation of the signal is stable, video
trigger synchronizes the sweep with the demodulated waveform.
• Linear display mode should be used in amplitude modulation (AM)
measurements to avoid distortion caused by the logarithmic
amplifier when demodulating signals.
• Sweep time to view the rate of the AM signal.
• RBW and VBW are selected according to the signal bandwidth.
Demodulating an FM Signal Using the Analyzer as a
Fixed Tuned Receiver (Time-Domain)
To recover the frequency modulated signal, a spectrum analyzer can be
used as a manually tuned receiver (zero span). However, in contrast to
AM, the signal is not tuned into the passband center, but to one slope of
the filter curve as Figure 15-22.
Figure 15-22
Determining FM Parameters using FM to AM Conversion
Chapter 15
157
Concepts
Here the frequency variations of the FM signal are converted into
amplitude variations (FM to AM conversion). The reason we want to
measure the AM component is that the envelope detector responds only
to AM variations. There are no changes in amplitude if the frequency
changes of the FM signal are limited to the flat part of the RBW (IF
filter). The resultant AM signal is then detected with the envelope
detector and displayed in the time domain.
Concepts
Stimulus Response Measurement Concepts
Stimulus Response Measurement Concepts
NOTE
Stimulus response measurements require option 1DN or 1DQ with ESA
spectrum analyzers.
Stimulus Response Overview
Stimulus response measurements require a source to stimulate a device
under test (DUT), a receiver to analyze the frequency response
characteristics of the DUT, and, for return loss measurements, a
directional coupler or bridge. Characterization of a DUT can be made in
terms of its transmission or reflection parameters. Examples of
transmission measurements include flatness and rejection. Return loss
is an example of a reflection measurement.
A spectrum analyzer combined with a tracking generator forms a
stimulus response measurement system. With the tracking generator
as the swept source and the analyzer as the receiver, operation is the
same as a single channel scalar network analyzer. The tracking
generator output frequency must be made to precisely track the
analyzer input frequency for good narrow band operation. A narrow
band system has a wide dynamic measurement range. This wide
dynamic range will be illustrated in the following example.
There are three basic steps in performing a stimulus response
measurement, whether it is a transmission or a reflection
measurement. The first step is to set up the analyzer, the second is to
normalize, and the last step is to perform the measurement.
Tracking Generator Unleveled Condition
Concepts
When using the tracking generator, the message TG unleveled may
appear. The TG unleveled message indicates that the tracking
generator source power (Source, Amplitude) could not be maintained at
the selected level during some portion of the sweep. If the unleveled
condition exists at the beginning of the sweep, the message will be
displayed immediately. If the unleveled condition occurs after the sweep
begins, the message will be displayed after the sweep is completed. A
momentary unleveled condition may not be detected when the sweep
time is short. The message will be cleared after a sweep is completed
with no unleveled conditions.
The unleveled condition may be caused by any of the following:
• Start frequency is too low or the stop frequency is too high. The
unleveled condition is likely to occur if the true frequency range
exceeds the tracking generator frequency specification (especially
the low frequency specification).
158
Chapter 15
Concepts
Stimulus Response Measurement Concepts
• Source attenuation may be set incorrectly (select Attenuation (Auto)
for optimum setting).
• The source power may be set too high or too low, use Amplitude (Off)
then Amplitude (On) to reset it.
• The source power sweep may be set too high, resulting in an
unleveled condition at the end of the sweep. Use Power Sweep (Off)
then Power Sweep (On) to decrease the amplitude.
• Reverse RF power from the device under test detected by the
tracking generator ALC (automatic level control) system.
Sweeping in Stimulus Response Auto Coupled Mode
Auto coupled sweep times are usually much faster for stimulus
response measurements than they are for spectrum analyzer (SA)
measurements.
In the stimulus response mode, the Q of the DUT can determine the
fastest rate at which the analyzer can be swept. (Q is the quality factor,
which is the center frequency of the DUT divided by the bandwidth of
the DUT.) To determine whether the analyzer is sweeping too fast, slow
the sweep and note whether there is a frequency or amplitude shift of
the trace. Continue to slow the sweep until there is no longer a
frequency or amplitude shift.
Normalization Concepts
To make a transmission measurement accurately, the frequency
response of the test system must be known. Normalization is used to
eliminate this error from the measurement. To measure the frequency
response of the test system, connect the cable (but not the DUT) from
the tracking generator output to the analyzer input.
Press View/Trace, More, Normalize, Store Ref (1→3), Normalize (On).
The frequency response of the test system is automatically stored in
trace 3 and a normalization is performed. This means that the active
displayed trace is now the ratio of the input data to the data stored in
trace 3. (The reference trace is Trace 3 with firmware revision A.04.00
and later)
NOTE
Since the reference trace is stored in trace 3, changing trace 3 to
Clear Write will invalidate the normalization.
Chapter 15
159
Concepts
When normalization is on, trace math is being performed on the active
trace. The trace math performed is (trace 1 − trace 3 + the normalized
reference position), with the result placed into trace 1. Remember that
trace 1 contains the measurement trace, trace 3 contains the stored
reference trace of the system frequency response, and normalized
reference position is indicated by arrowheads at the edges of the
graticule.
Concepts
Stimulus Response Measurement Concepts
Reconnect the DUT to the analyzer. Note that the units of the reference
level have changed to dB, indicating that this is now a relative
measurement. Change the normalized reference position:
Press View/Trace, More, Normalize, Norm Ref Posn.
Arrowheads at the left and right edges of the graticule mark the
normalized reference position, or the position where 0 dB insertion loss
(transmission measurements) or 0 dB return loss (reflection
measurements) will normally reside. You can change the position of the
normalized trace, within the range of the graticule by entering a
position number.
Measuring Device Bandwidth
It is often necessary to measure device bandwidth, such as when testing
a bandpass filter. There is a key in the Peak Search menu that will
perform this function. The device signal being measured must be
displayed before activating the measurement. The span must include
the full response.
Activate the measurement by toggling the N dB Points key to On. The
analyzer places arrow markers at the −3 dB points on either side of the
response and reads the bandwidth. For other bandwidth responses
enter the number of dB down desired, from −1 dB to −80 dB.
No other signal can appear on the display within N dB of the highest
signal. The measured signal cannot have more than one peak that is
greater than or equal to N dB. A signal must have a peak greater than
the currently defined peak excursion to be identified. The default value
for the peak excursion is 6 dB.
Measurements are made continuously, updating at the end of each
sweep. This allows you to make adjustments and see changes as they
happen. The single sweep mode can also be used, providing time to
study or record the data.
The N dB bandwidth measurement error is typically ±1% of the span.
Converting Return Loss to VSWR
Return loss can be expressed as a voltage standing wave ratio (VSWR)
value using the following table or formula:
Concepts
Table 15-6
Power to VSWR Conversion
Return
Loss
(dB)
VSWR
Return
Loss
(dB)
VSWR
Return
Loss
(dB)
VSWR
Return
Loss
(dB)
VSWR
Return
Loss
(dB)
VSWR
4.0
4.42
14.0
1.50
18.0
1.29
28.0
1.08
38.0
1.03
6.0
3.01
14.2
1.48
18.5
1.27
28.5
1.08
38.5
1.02
160
Chapter 15
Concepts
Stimulus Response Measurement Concepts
Table 15-6
Power to VSWR Conversion
Return
Loss
(dB)
VSWR
Return
Loss
(dB)
VSWR
Return
Loss
(dB)
VSWR
Return
Loss
(dB)
VSWR
Return
Loss
(dB)
VSWR
8.0
2.32
14.4
1.47
19.0
1.25
29.0
1.07
39.0
1.02
10.0
1.92
14.6
1.46
19.5
1.24
29.5
1.07
39.5
1.02
10.5
1.85
14.8
1.44
20.0
1.22
30.0
1.07
40.0
1.02
11.0
1.78
15.0
1.43
20.5
1.21
30.5
1.06
40.5
1.02
11.2
1.76
15.2
1.42
21.0
1.20
31.0
1.06
41.0
1.02
11.4
1.74
15.4
1.41
21.5
1.18
31.5
1.05
41.5
1.02
11.6
1.71
15.6
1.40
22.0
1.17
32.0
1.05
42.0
1.02
11.8
1.69
15.8
1.39
22.5
1.16
32.5
1.05
42.5
1.02
12.0
1.67
16.0
1.38
23.0
1.15
33.0
1.05
43.0
1.01
12.2
1.65
16.2
1.37
23.5
1.14
33.5
1.04
43.5
1.01
12.4
1.63
16.4
1.36
24.0
1.13
34.0
1.04
44.0
1.01
12.6
1.61
16.6
1.35
24.5
1.13
34.5
1.04
44.5
1.01
12.8
1.59
16.8
1.34
25.0
1.12
35.0
1.04
45.0
1.01
13.0
1.58
17.0
1.33
25.5
1.11
35.5
1.03
45.5
1.01
13.2
1.56
17.2
1.32
26.0
1.11
36.0
1.03
46.0
1.01
13.4
1.54
17.4
1.31
26.5
1.10
36.5
1.03
46.5
1.01
13.6
1.53
17.6
1.30
27.0
1.09
37.0
1.03
47.0
1.01
13.8
1.51
17.8
1.30
27.5
1.09
37.5
1.03
47.5
1.01
– RL
---------20
1 + 10
VSWR = ----------------------1 – 10
–---------RL
20
Where: RL is the measured return loss value.
VSWR is sometimes stated as a ratio. For example: 1.2:1 “one point two
to one” VSWR. The first number is the VSWR value taken from the
table or calculated using the formula. The second number is always 1.
Concepts
Chapter 15
161
Concepts
Concepts
Stimulus Response Measurement Concepts
162
Chapter 15
ESA/PSA Programming Examples
16
ESA/PSA Programming
Examples
163
ESA/PSA Programming Examples
ESA/PSA Programming Examples
Examples Included in this Chapter:
Examples Included in this Chapter:
The following C and Visual Basic examples work with both the ESA
Series and the PSA Series of spectrum analyzers. There is also a section
on programming in C using the Agilent VTL (VISA transition library).
Programming using the Agilent VTL:
• “Programming in C Using the VTL” on page 167
Programming Examples for ESA and PSA spectrum analyzers:
• “Using C to Make a Power Suite ACPR Measurement on a cdmaOne
Signal” on page 176
• “Using C to Serial Poll the Analyzer to Determine when an
Auto-alignment is Complete” on page 179
• “Using C and Service Request (SRQ) to Determine When a
Measurement is Complete” on page 182
• “Using Visual Basic® 6 to Capture a Screen Image” on page 188
• “Using Visual Basic® 6 to Transfer Binary Trace Data” on page 192
• “Using Agilent VEE to Transfer Trace Data” on page 197
Visual Basic is a registered trademark of Microsoft Corporation.
164
Chapter 16
Finding Additional Examples and More
Information
These examples are available on the Agilent Technologies PSA Series
documentation CD-ROM or the ESA Series documentation CD-ROM.
They can also be found from the URLs:
http://www.agilent.com/find/esa
http://www.agilent.com/find/psa
VXI plug&play drivers: There are additional examples that use the VXI
plug&play instrument drivers. These examples are included in the
on-line documentation in the driver itself. The driver allows you to use
several different programming languages including: VEE, LabVIEW, C,
C++, and BASIC. The software drivers can also be found at the above
URLs.
Interchangeable Virtual Instruments COM (IVI-COM) drivers: Develop
system automation software easily and quickly. IVI-COM drivers take full
advantage of application development environments such as Visual Studio
using Visual Basic, C# or Visual C++ as well as Agilent’s Test and
Measurement Toolkit. You can now develop application programs that are
portable across computer platforms and I/O interfaces. With IVI-COM
drivers you do not need to have in depth test instrument knowledge to
develop sophisticated measurement software. IVI-COM drivers provide a
compatible interface to all. COM environments. The IVI-COM software
drivers can be found at the URL
http://www.agilent.com/find/ivi-com
IntuiLink software: There are additional examples that use the
IntuiLink software. IntuiLink allows you to capture screen and trace
data for display and manipulation in the Windows COM environment.
These examples are included on the Intuilink CD. The latest version of
IntuiLink can also be found at the URL
http://www.agilent.com/find/intuilink
Chapter 16
165
ESA/PSA Programming Examples
ESA/PSA Programming Examples
Finding Additional Examples and More Information
ESA/PSA Programming Examples
ESA/PSA Programming Examples
Programming Examples Information and Requirements
Programming Examples Information and
Requirements
• The programming examples were written for use on an IBM
compatible PC.
• The programming examples use C, Visual Basic and VEE
programming languages.
• The programming examples use GPIB and LAN interfaces.
• Many of the examples use the SCPI programming commands,
though there are some that use the plug&play or IVI.com drivers.
• Most of the examples are written in C using the Agilent VISA
transition library.
The VISA transition library must be installed and the GPIB card
configured. The Agilent I/O libraries contain the latest VISA
transition library and is available at: www.agilent.com/iolib
166
Chapter 16
Programming in C Using the VTL
The C programming examples that are provided are written using the C
programming language and the Agilent VTL (VISA transition library).
This section includes some basic information about programming in the
C language. Note that some of this information may not be relevant to
your particular application. (For example, if you are not using VXI
instruments, the VXI references will not be relevant).
Refer to your C programming language documentation for more details.
(This information is taken from the manual “VISA Transition Library”,
part number E2090-90026.) The following topics are included:
“Typical Example Program Contents” on page 168
“Linking to VTL Libraries” on page 169
“Compiling and Linking a VTL Program” on page 169
“Example Program” on page 171
“Including the VISA Declarations File” on page 171
“Opening a Session” on page 172
“Device Sessions” on page 172
“Addressing a Session” on page 174
“Closing a Session” on page 175
Chapter 16
167
ESA/PSA Programming Examples
ESA/PSA Programming Examples
Programming in C Using the VTL
ESA/PSA Programming Examples
ESA/PSA Programming Examples
Programming in C Using the VTL
Typical Example Program Contents
The following is a summary of the VTL function calls used in the
example programs.
visa.h
This file is included at the beginning of the file to
provide the function prototypes and constants defined
by VTL.
ViSession
The ViSession is a VTL data type. Each object that
will establish a communication channel must be
defined as ViSession.
viOpenDefaultRM You must first open a session with the default
resource manager with the viOpenDefaultRM
function. This function will initialize the default
resource manager and return a pointer to that resource
manager session.
viOpen
viPrintf
viScanf
viClose
168
This function establishes a communication channel
with the device specified. A session identifier that can
be used with other VTL functions is returned. This call
must be made for each device you will be using.
These are the VTL formatted I/O functions that are
patterned after those used in the C programming
language. The viPrintf call sends the IEEE 488.2
*RST command to the instrument and puts it in a
known state. The viPrintf call is used again to query
for the device identification (*IDN?). The viScanf call
is then used to read the results.
This function must be used to close each session. When
you close a device session, all data structures that had
been allocated for the session will be de-allocated.
When you close the default manager session, all
sessions opened using the default manager session will
be closed.
Chapter 16
Linking to VTL Libraries
Your application must link to one of the VTL import libraries:
32-bit Version:
C:\VXIPNP\WIN95\LIB\MSC\VISA32.LIB for Microsoft compilers
C:\VXIPNP\WIN95\LIB\BC\VISA32.LIB for Borland compilers
16-bit Version:
C:\VXIPNP\WIN\LIB\MSC\VISA.LIB for Microsoft compilers
C:\VXIPNP\WIN\LIB\BC\VISA.LIB for Borland compilers
See the following section, “Compiling and Linking a VTL Program” for
information on how to use the VTL run-time libraries.
Compiling and Linking a VTL Program
32-bit Applications
The following is a summary of important compiler-specific
considerations for several C/C++ compiler products when developing
WIN32 applications.
For Microsoft Visual C++ version 2.0 compilers:
• Select Project | Update All Dependencies from the menu.
• Select Project | Settings from the menu. Click on the C/C++
button. Select Code Generation from the Use Run-Time
Libraries list box. VTL requires these definitions for WIN32. Click
on OK to close the dialog boxes.
• Select Project | Settings from the menu. Click on the Link
button and add visa32.lib to the Object / Library Modules
list box. Optionally, you may add the library directly to your project
file. Click on OK to close the dialog boxes.
• You may wish to add the include file and library file search paths.
They are set by doing the following:
1. Select Tools | Options from the menu.
2. Click on the Directories button to set the include file path.
3. Select Include Files from the Show Directories For list
box.
4. Click on the Add button and type in the following:
C:\VXIPNP\WIN95\INCLUDE
5. Select Library Files from the Show Directories For list
box.
Chapter 16
169
ESA/PSA Programming Examples
ESA/PSA Programming Examples
Programming in C Using the VTL
ESA/PSA Programming Examples
ESA/PSA Programming Examples
Programming in C Using the VTL
6. Click on the Add button and type in the following:
C:\VXIPNP\WIN95\LIB\MSC
For Borland C++ version 4.0 compilers:
• You may wish to add the include file and library file search paths.
They are set under the Options | Project menu selection. Double
click on Directories from the Topics list box and add the following:
C:\VXIPNP\WIN95\INCLUDE
C:\VXIPNP\WIN95\LIB\BC
16-bit Applications
The following is a summary of important compiler-specific
considerations for the Windows compiler.
For Microsoft Visual C++ version 1.5:
• To set the memory model, do the following:
1. Select Options | Project.
2. Click on the Compiler button, then select Memory Model from
the Category list.
3. Click on the Model list arrow to display the model options, and
select Large.
4. Click on OK to close the Compiler dialog box.
• You may wish to add the include file and library file search paths.
They are set under the Options | Directories menu selection:
C:\VXIPNP\WIN\INCLUDE
C:\VXIPNP\WIN\LIB\MSC
Otherwise, the library and include files should be explicitly specified
in the project file.
170
Chapter 16
Example Program
This example program queries a GPIB device for an identification
string and prints the results. Note that you must change the address.
/*idn.c - program filename */
#include "visa.h"
#include <stdio.h>
void main ()
{
/*Open session to GPIB device at address 18 */
ViOpenDefaultRM (&defaultRM);
ViOpen (defaultRM, GPIB0::18::INSTR", VI_NULL,
VI_NULL, &vi);
/*Initialize device */
viPrintf (vi, "*RST\n");
/*Send an *IDN? string to the device */
printf (vi, "*IDN?\n");
/*Read results */
viScanf (vi, "%t", &buf);
/*Print results */
printf ("Instrument identification string: %s\n", buf);
/* Close sessions */
viClose (vi);
viClose (defaultRM);
}
Including the VISA Declarations File
For C and C++ programs, you must include the visa.h header file at
the beginning of every file that contains VTL function calls:
#include "visa.h"
This header file contains the VISA function prototypes and the
definitions for all VISA constants and error codes. The visa.h header
file includes the visatype.h header file.
The visatype.h header file defines most of the VISA types. The VISA
types are used throughout VTL to specify data types used in the
functions. For example, the viOpenDefaultRM function requires a
pointer to a parameter of type ViSession. If you find ViSession in the
visatype.h header file, you will find that ViSession is eventually
typed as an unsigned long.
Chapter 16
171
ESA/PSA Programming Examples
ESA/PSA Programming Examples
Programming in C Using the VTL
ESA/PSA Programming Examples
ESA/PSA Programming Examples
Programming in C Using the VTL
Opening a Session
A session is a channel of communication. Sessions must first be opened
on the default resource manager, and then for each device you will be
using. The following is a summary of sessions that can be opened:
• A resource manager session is used to initialize the VISA system.
It is a parent session that knows about all the opened sessions. A
resource manager session must be opened before any other session
can be opened.
• A device session is used to communicate with a device on an
interface. A device session must be opened for each device you will be
using. When you use a device session you can communicate without
worrying about the type of interface to which it is connected. This
insulation makes applications more robust and portable across
interfaces. Typically a device is an instrument, but could be a
computer, a plotter, or a printer.
NOTE
All devices that you will be using need to be connected and in working
condition prior to the first VTL function call (viOpenDefaultRM). The
system is configured only on the first viOpenDefaultRM per process.
Therefore, if viOpenDefaultRM is called without devices connected and
then called again when devices are connected, the devices will not be
recognized. You must close ALL resource manager sessions and re-open
with all devices connected and in working condition.
Device Sessions
There are two parts to opening a communications session with a
specific device. First you must open a session to the default resource
manager with the viOpenDefaultRM function. The first call to this
function initializes the default resource manager and returns a session
to that resource manager session. You only need to open the default
manager session once. However, subsequent calls to viOpenDefaultRM
returns a session to a unique session to the same default resource
manager resource.
Next, you open a session with a specific device with the viOpen
function. This function uses the session returned from
viOpenDefaultRM and returns its own session to identify the device
session. The following shows the function syntax:
viOpenDefaultRM (sesn);
viOpen (sesn, rsrcName, accessMode, timeout, vi);
172
Chapter 16
The session returned from viOpenDefaultRM must be used in the sesn
parameter of the viOpen function. The viOpen function then uses that
session and the device address specified in the rsrcName parameter to
open a device session. The vi parameter in viOpen returns a session
identifier that can be used with other VTL functions.
Your program may have several sessions open at the same time by
creating multiple session identifiers by calling the viOpen function
multiple times.
The following summarizes the parameters in the previous function
calls:
sesn
This is a session returned from the viOpenDefaultRM
function that identifies the resource manager session.
rsrcName
This is a unique symbolic name of the device (device
address).
accessMode
This parameter is not used for VTL. Use VI_NULL.
timeout
This parameter is not used for VTL. Use VI_NULL.
vi
This is a pointer to the session identifier for this
particular device session. This pointer will be used to
identify this device session when using other VTL
functions.
The following is an example of opening sessions with a GPIB
multimeter and a GPIB-VXI scanner:
ViSession defaultRM, dmm, scanner;
.
.
viOpenDefaultRM(&defaultRM);
viOpen (defaultRM, "GPIB0::22::INSTR", VI_NULL,
VI_NULL, &dmm);
viOpen (defaultRM, "GPIB-VXI0::24::INSTR", VI_NULL,
VI_NULL, &scanner);
.
.
viClose (scanner);
viClose (dmm);
viClose(defaultRM);
The above function first opens a session with the default resource
manager. The session returned from the resource manager and a device
address is then used to open a session with the GPIB device at address
22. That session will now be identified as dmm when using other VTL
functions. The session returned from the resource manager is then used
again with another device address to open a session with the GPIB-VXI
device at primary address 9 and VXI logical address 24. That session
will now be identified as scanner when using other VTL functions. See
the following section for information on addressing particular devices.
Chapter 16
173
ESA/PSA Programming Examples
ESA/PSA Programming Examples
Programming in C Using the VTL
ESA/PSA Programming Examples
ESA/PSA Programming Examples
Programming in C Using the VTL
Addressing a Session
As seen in the previous section, the rsrcName parameter in the viOpen
function is used to identify a specific device. This parameter is made up
of the VTL interface name and the device address. The interface name
is determined when you run the VTL Configuration Utility. This name
is usually the interface type followed by a number. The following table
illustrates the format of the rsrcName for the different interface types:
Interface
Syntax
VXI
VXI [board]::VXI logical address[::INSTR]
GPIB-VXI
GPIB-VXI [board]::VXI logical address[::INSTR]
GPIB
GPIB [board]::primary address[::secondary address][::INSTR]
The following describes the parameters used above:
board
VSI logical
address
This is the logical address of the VXI instrument.
primary
address
This is the primary address of the GPIB device.
secondary
address
INSTR
NOTE
This optional parameter is used if you have more than
one interface of the same type. The default value for
board is 0.
This optional parameter is the secondary address of the
GPIB device. If no secondary address is specified, none
is assumed.
This is an optional parameter that indicates that you
are communicating with a resource that is of type
INSTR, meaning instrument.
If you want to be compatible with future releases of VTL and VISA, you
must include the INSTR parameter in the syntax.
The following are examples of valid symbolic names:
XI0::24::INSTR Device at VXI logical address 24 that is of VISA type
INSTR.
VXI2::128
Device at VXI logical address 128, in the third VXI
system (VXI2).
GPIB-VXI0::24 A VXI device at logical address 24. This VXI device is
connected via a GPIB-VXI command module.
GPIB0::7::0
174
A GPIB device at primary address 7 and secondary
address 0 on the GPIB interface.
Chapter 16
The following is an example of opening a device session with the GPIB
device at primary address23.
ViSession defaultRM, vi;
.
.
viOpenDefaultRM (&defaultRM);
viOpen (defaultRM, "GPIB0::23::INSTR", VI_NULL,VI_NULL,&vi);
.
.
viClose(vi);
viClose (defaultRM);
Closing a Session
The viClose function must be used to close each session. You can close
the specific device session, which will free all data structures that had
been allocated for the session. If you close the default resource manager
session, all sessions opened using that resource manager will be closed.
Since system resources are also used when searching for resources
(viFindRsrc) or waiting for events (viWaitOnEvent), the viClose
function needs to be called to free up find lists and event contexts.
Chapter 16
175
ESA/PSA Programming Examples
ESA/PSA Programming Examples
Programming in C Using the VTL
ESA/PSA Programming Examples
ESA/PSA Programming Examples
Using C to Make a Power Suite ACPR Measurement on a cdmaOne Signal
Using C to Make a Power Suite ACPR
Measurement on a cdmaOne Signal
This C programming example (ACPR.c) can be found on the
Documentation CD.
Example:
/***************************************************************************
*
ACPR.c
*
Adjacent Channel Power Measurement using Power Suite
*
Agilent Technologies 2001
*
*
Instrument Requirements:
*
PSA with firmware version >= A.02.00 or
*
ESA with firmware version >= A.08.00
*
*
Note: You can select which ACPR radio standard you would like by
*
changing the standard for the RADIO:STANDARD command.
*
This example sets the radio standard to IS95.
*
*
Note: For PSA, ensure that you are SA mode before running this program.
*
*****************************************************************************/
#include <stdio.h>
#include <stdlib.h>
#include <string.h>
#include "visa.h"
void main ()
{
/*program variable*/
ViSession defaultRM, viPSA;
ViStatus viStatus
= 0;
ViChar _VI_FAR cResult[2000] = {0};
int iNum
=0;
176
Chapter 16
int iSwpPnts = 401;
double freq,value;
static ViChar *cToken ;
long lCount=0L;
char sTraceInfo
[1024]= {0};
FILE *fDataFile;
unsigned long lBytesRetrieved;
char *psaSetup =
"*RST;*CLS;"
// PSA setup initialization
// Reset the device and clear status
":INIT:CONT 0;"// Set analyzer to single sweep mode
":RADIO:STANDARD IS95";// Set the Radio Standard to IS95
/*open session to GPIB device at address 18 */
viStatus=viOpenDefaultRM (&defaultRM);
viStatus=viOpen (defaultRM, "GPIB0::18::INSTR", VI_NULL,VI_NULL, &viPSA);
/*check opening session sucess*/
if(viStatus)
{
printf("Could not open a session to GPIB device at address 18!\n");
exit(0);
}
/*Increase timeout to 20 sec*/
viSetAttribute(viPSA,VI_ATTR_TMO_VALUE,20000);
/*Send setup commands to instrument */
viPrintf(viPSA,"%s\n",psaSetup);
/*Get the center freq from user*/
printf("What is the center carrier frequency in MHz?\n");
scanf( "%lf",&freq);
/*Set the center freq*/
viPrintf(viPSA,"freq:center %lf MHZ\n",freq);
/*Perform an ACPR measurement*/
Chapter 16
177
ESA/PSA Programming Examples
ESA/PSA Programming Examples
Using C to Make a Power Suite ACPR Measurement on a cdmaOne Signal
ESA/PSA Programming Examples
ESA/PSA Programming Examples
Using C to Make a Power Suite ACPR Measurement on a cdmaOne Signal
viQueryf(viPSA,"%s\n", "%#t","READ:ACP?;*wai" , &iNum , cResult);
/*Remove the "," from the ASCII data for analyzing data*/
cToken
= strtok(cResult,",");
/*Save data to an ASCII to a file, by removing the "," token*/
fDataFile=fopen("C:\\ACPR.txt","w");
fprintf(fDataFile,"ACPR.exe Output\nAgilent Technologies 2001\n\n");
fprintf(fDataFile,"Please read Programer’s Reference for an\n");
fprintf(fDataFile,"explanation of returned results.\n\n");
while (cToken != NULL)
{
lCount++;
value = atof(cToken);
fprintf(fDataFile,"\tReturn value[%d] = %lf\n",lCount,value);
cToken =strtok(NULL,",");
}
fprintf(fDataFile,"\nTotal number of return points of ACPR measurement :[%d]
\n\n",lCount);
fclose(fDataFile);
/*print message to the standard output*/
printf("The The ACPR Measurement Result was saved to C:\\ACPR.txt file\n\n");
/* Close session */
viClose (viPSA);
viClose (defaultRM);
}
178
Chapter 16
Using C to Serial Poll the Analyzer to
Determine when an Auto-alignment is
Complete
This C programming example (SerAlign.c) can be found on the
Documentation CD.
Example:
/*********************************************************************
*
SerAlign.c
*
Serial Poll Alignment Routine
*
Agilent Technologies 2001
*
*
Instrument Requirements:
*
PSA Series Spectrum Analyzer or
*
ESA Series Spectrum Analyers or
*
VSA Series Transmitter Tester
*
*
This program demonstrates how to
*
1) Perform an instrument alignment.
*
2) Poll the instrument to determine when the operation is complete.
*
3) Query to determine if the alignment was successfuly completed.
*
**********************************************************************/
#include <stdio.h>
#include <stdlib.h>
#include <windows.h>
#include "visa.h"
void main ()
{
/*program variables*/
ViSession defaultRM, viPSA;
ViStatus viStatus = 0;
ViUInt16 esr,stat;
Chapter 16
179
ESA/PSA Programming Examples
ESA/PSA Programming Examples
Using C to Serial Poll the Analyzer to Determine when an Auto-alignment is
Complete
ESA/PSA Programming Examples
ESA/PSA Programming Examples
Using C to Serial Poll the Analyzer to Determine when an Auto-alignment is
Complete
long lResult = 0;
long lOpc = 0;
char cEnter = 0;
/*open session to GPIB device at address 18 */
viStatus=viOpenDefaultRM (&defaultRM);
viStatus=viOpen (defaultRM, "GPIB0::18::INSTR", VI_NULL,VI_NULL,&viPSA);
/*check opening session sucess*/
if(viStatus)
{
printf("Could not open a session to GPIB device at address 18!\n");
exit(0);
}
/*increase timeout to 60 sec*/
viSetAttribute(viPSA,VI_ATTR_TMO_VALUE,60000);
/*Clear the analyzer*/
viClear(viPSA);
/*Clear all event registers*/
viPrintf(viPSA, "*CLS\n");
/* Set the Status Event Enable Register */
viPrintf(viPSA, "*ESE 1\n");
/*Initiate self-alignment*/
viPrintf(viPSA, "CAL:ALL\n");
/* Send the Operation complete command so that the
stand event register will be set to 1 once
the pending alignment command is complete */
viPrintf(viPSA, "*OPC\n");
/* print message to standard output */
180
Chapter 16
printf("Performing self-alignment.\n");
/* Serial pole the instrument for operation complete */
while(1)
{
viQueryf(viPSA,"*ESR?\n","%ld",&esr);
printf(".");
if (esr & 1) break;//look for operation complete bit
Sleep (1000);// wait 1000ms before polling again
}
/* Query the Status Questionable Condition Register */
viQueryf(viPSA,":STAT:QUES:CAL:COND?\n","%ld",&stat);
/*Determine if alignment was successful*/
if (stat)
printf("\nAlignment not successful\n\n");
else
printf("\nAlignment successful\n\n");
/*reset timeout to 5 sec*/
viSetAttribute(viPSA,VI_ATTR_TMO_VALUE,5000);
/*print message to the standard output*/
printf("Press Return to exit program \n\n");
scanf("%c",&cEnter);
/* Close session */
viClose (viPSA);
viClose (defaultRM);
}
Chapter 16
181
ESA/PSA Programming Examples
ESA/PSA Programming Examples
Using C to Serial Poll the Analyzer to Determine when an Auto-alignment is
Complete
ESA/PSA Programming Examples
ESA/PSA Programming Examples
Using C and Service Request (SRQ) to Determine When a Measurement is
Complete
Using C and Service Request (SRQ) to
Determine When a Measurement is Complete
This C programming example (SRQ.c) can be found on the
Documentation CD.
/*************************************************************************
*
SRQ.C
*
Determine when a measurement is done by waiting for SRQ
*
and reading Status Register
*
*
*
Instrument Requirements:
PSA/ESA/EMC Series Spectrum Analyzers.
*
* This C programming demonstrates how:
*
A. Set the service request mask to assert SRQ when
*
either a measurement is uncalibrated or an error
*
message has occurred.
*
B. Initiate a sweep and wait for the SRQ interupt
*
C. Poll all instruments and report the nature of the
*
interrupt on the spectrum analyzer
*
* You have a royalty-free right to use, modify, reproduce and distribute
* the Sample Application Files (and/or any modified version) in any way
* you find useful, provided that you agree that Agilent Technologies has
* no warranty, obligations or liability for any Sample Application Files.
*
* Agilent Technologies provides programming examples for illustration only,
* This sample program assumes that you are familiar with the programming
* language being demonstrated and the tools used to create and debug
* procedures. Agilent Technologies support engineers can help explain the
* functionality of Agilent Technologies software components and associated
* commands, but they will not modify these samples to provide added
* functionality or construct procedures to meet your specific needs.
*
*
Copyright © 1999- 2004 Agilent Technologies Inc.
182
All rights reserved.
Chapter 16
***************************************************************************/
#include <stdio.h>
#include <windows.h>
#include "visa.h"
ViSessiondefaultRM, viSA;
ViStatuserrStatus;
ViAddr iAddress;
int
iSrqOccurred=0;
char
cBuf[3]={0};
/*Wait until SRQ is generated and for the handler to be called. Print
something while waiting. When interrupt occurs it will be handled by
interrupt handler*/
void WaitForSRQ()
{
long
lCount = 0L;
iSrqOccurred
=0;
for (lCount =0;(lCount<10) && (iSrqOccurred
==0); lCount++)
{
long lCount2 =0;
printf(".");
while ((lCount2++ < 100) && (iSrqOccurred
==0))
{
Sleep(10);
}
}
}
/*Interrupt handler,trigger event handler */
ViStatus _VI_FUNCH mySrqHdlr(ViSession viSA, ViEventType eventType, ViEvent
ctx,ViAddr userHdlr)
{
ViUInt16 iStatusByte;
Chapter 16
183
ESA/PSA Programming Examples
ESA/PSA Programming Examples
Using C and Service Request (SRQ) to Determine When a Measurement is
Complete
ESA/PSA Programming Examples
ESA/PSA Programming Examples
Using C and Service Request (SRQ) to Determine When a Measurement is
Complete
/* Make sure it is an SRQ event, ignore if stray event*/
if (eventType!=VI_EVENT_SERVICE_REQ)
{
printf ("\n Stray event type0x%1x\n",eventType);
/*Return successfully*/
return VI_SUCCESS;
}
/* When an interrupt occurs,determine which device generated the interrupt
(if an instrument other than the PSA/ESA generates the interrupt, simply report
"Instrument at GPIB Address xxx Has Generated an Interrupt").*/
printf ("\n\n SRQ event occurred!\n");
/*Get the GPIB address of the insrument, which has interrupted*/
viQueryf(viSA,"SYST:COMM:GPIB:SELF:ADDR?\n","%t", cBuf);
printf ("\n Instrument at GPIB address %s has generated an interrupt!\n",cBuf);
/*Get the status byte*/
/* If the PSA/ESA generated the interrupt, determine the nature of the
interrupt;
did the measurement complete or an error message occur?*/
viQueryf(viSA, "*ESR?\n", "%d", &iStatusByte);
if ( (0x01 & iStatusByte))
printf("\n SRQ message:\t Measurement complete\n");
else if ( (0x02 | 0x10 | 0x20 & iStatusByte ))
printf ("\n SRQ message:\t Error Message Occurred\n");
/*Return successfully*/
iSrqOccurred
=1;
viReadSTB(viSA,&iStatusByte);
return VI_SUCCESS;
}
/* Main Program*/
void main()
{
184
Chapter 16
/*Program Variables*/
ViStatus viStatus
long
= 0;
lOpc=0;
/* Open a GPIB session at address 18*/
viStatus=viOpenDefaultRM(&defaultRM);
viStatus=viOpen(defaultRM,"GPIB0::18",VI_NULL,VI_NULL,&viSA);
if(viStatus)
{
printf("Could not open a session to GPIB device at address 18!\n");
exit(0);
}
/* Set I/O timeout to twenty seconds */
viSetAttribute(viSA,VI_ATTR_TMO_VALUE,20000);
/*Clear the instrument*/
viClear(viSA);
/*Reset the instrument*/
viPrintf(viSA,"*RST\n");
/*Clear the status byte of the instrument*/
viPrintf(viSA,"*CLS\n");
/*Put the analyzer in a single sweep*/
viPrintf(viSA,"INIT:CONT 0 \n");
/* Change the instrument mode to Spectrum Analysis */
viPrintf(viSA,":INST:NSEL 1\n");
/*Set the analyzer resolution bandwidth to 300 Khz*/
viPrintf(viSA,"SENS:BAND:RES 300 KHz\n");
/*Set the analyzer to 10MHz span*/
viPrintf(viSA,"SENS:FREQ:SPAN 10MHz\n");
Chapter 16
185
ESA/PSA Programming Examples
ESA/PSA Programming Examples
Using C and Service Request (SRQ) to Determine When a Measurement is
Complete
ESA/PSA Programming Examples
ESA/PSA Programming Examples
Using C and Service Request (SRQ) to Determine When a Measurement is
Complete
/*Initiate a sweep*/
viPrintf(viSA,"INIT:IMM\n");
/*Make sure the previous command has been completed*/
viQueryf(viSA, "*OPC?\n", "%d", &lOpc);
if (!lOpc)
{
printf("\nProgram Abort! error ocurred: last command was not
completed!\n");
exit(0);
}
/* Set the service request mask to assert SRQ when either a measurement
is completed or an error message has occurred.*/
viPrintf(viSA,"*SRE 96\n");
viPrintf(viSA,"*ESE 35\n");
/* Configure the computer to respond to an interrupt*/
/*install the handler and enable it */
viInstallHandler(viSA, VI_EVENT_SERVICE_REQ, mySrqHdlr,iAddress);
viEnableEvent(viSA, VI_EVENT_SERVICE_REQ,VI_HNDLR,VI_NULL);
/* Print Comment to user */
printf("Sending illegal command ’IDN’ and then waiting for SRQ\n");
/*Send an undefined command to the device*/
viPrintf(viSA,"IDN\n");
/*Wait for SRQ */
WaitForSRQ();
/*Set video averaging to 50 sweeps and turn averaging On*/
viPrintf(viSA,":SENS:AVER:TYPE LPOW;:SENS:AVER:COUN 50;:SENS:AVER:STAT ON\n");
/* Print Comment to user */
printf("\nInitiating measurement and waiting for SRQ when measurement
186
Chapter 16
done.\n");
/*Initiate the sweeps and set the *OPC bit after the sweeps are completed*/
viPrintf(viSA,":INIT:IMM;*OPC\n");
/*Wait for SRQ */
WaitForSRQ();
/*Disable and uninstall the interrupt handler*/
viDisableEvent
(viSA, VI_EVENT_SERVICE_REQ,VI_HNDLR);
viUninstallHandler(viSA, VI_EVENT_SERVICE_REQ, mySrqHdlr,iAddress);
/*Clear the instrument status register*/
viPrintf(viSA,"*SRE 0 \n");
/*Clear the status byte of the instrument*/
viPrintf(viSA,"*CLS\n");
/*Close the session*/
viClose(viSA);
viClose(defaultRM);
}
Chapter 16
187
ESA/PSA Programming Examples
ESA/PSA Programming Examples
Using C and Service Request (SRQ) to Determine When a Measurement is
Complete
ESA/PSA Programming Examples
ESA/PSA Programming Examples
Using Visual Basic® 6 to Capture a Screen Image
Using Visual Basic® 6 to Capture a Screen
Image
This is a Visual Basic example that stores the current screen image on
your PC. The program works with the ESA or PSA Series spectrum
analyzers. The bas file (screen.bas) and a compiled executable
(screen.exe) can be found on the Documentation CD.
This example:
1. Stores the current screen image on the instrument’s flash as
C:PICTURE.GIF.
2. Transfers the image over GPIB or LAN and stores it on your PC in
the current directory as picture.gif.
3. The file C:PICTURE.GIF is then deleted from the instrument’s
flash.
NOTE
This example uses GPIB address 18 for the spectrum analyzer.
’’ """""""""""""""""""""""""""""""""""""""""""""""""""""""""""""""""""""""
’’
Copyright (c) 1999- 2003 Agilent Technologies Inc.
All rights reserved.
’’
’’ You have a royalty-free right to use, modify, reproduce and distribute
’’ the Sample Application Files (and/or any modified version) in any way
’’ you find useful, provided that you agree that Agilent Technologies has
’’ no warranty, obligations or liability for any Sample Application Files.
’’
’’ Agilent Technologies provides programming examples for illustration only,
’’ This sample program assumes that you are familiar with the programming
’’ language being demonstrated and the tools used to create and debug
’’ procedures. Agilent Technologies support engineers can help explain the
’’ functionality of Agilent Technologies software components and associated
’’ commands, but they will not modify these samples to provide added
’’ functionality or construct procedures to meet your specific needs.
’’ """"""""""""""""""""""""""""""""""""""""""""""""""""""""""""""""""""""""
’’ To develop VISA applications in Microsoft Visual Basic, you first need
’’ to add the Visual Basic (VB) declaration file in your VB project as a
’’ Module. This file contains the VISA function definitions and constant
188
Chapter 16
’’ declarations needed to make VISA calls from Visual Basic.
’’ To add this module to your project in VB 6, from the menu, select
’’ Project->Add Module, select the ’Existing’ tab, and browse to the
’’ directory containing the VB Declaration file, select visa32.bas, and
’’ press ’Open’.
’’
’’ The name and location of the VB declaration file depends on which
’’ operating system you are using.
Assuming the ’standard’ VISA directory
’’ of C:\Program Files\VISA or the ’standard’ VXIpnp directory of
’’ C:\VXIpnp, the visa32.bas file can be located in one of the following:
’’
’’
\winnt\agvisa\include\visa32.bas - Windows NT/2000/XP
’’
\winnt\include\visa32.bas
- Windows NT/2000/XP
’’
\win95\include\visa32.bas
- Windows 95/98/Me
’’’’’’’’’’’’’’’’’’’’’’’’’’’’’’’’’’’’’’’’’’’’’’’’’’’’’’’’’’’’’’’’’’’’’’’’’’’’
’
screen.bas
’
The following example program is written for the PSA and ESA Series
’
Spectrum Analyzers.
’
instrument’s flash as C:PICTURE.GIF. It then transfers the image over
’
GPIB or LAN and stores the image on your PC in the current directory
’
as picture.gif.
’
instrument’s flash.
It stores the current screen image on the
The file C:PICTURE.GIF is then deleted on the
’’’’’’’’’’’’’’’’’’’’’’’’’’’’’’’’’’’’’’’’’’’’’’’’’’’’’’’’’’’’’’’’’’’’’’’’’’’’
Option Explicit
Private Sub Main()
’ Declare Variables used in the program
Dim status As Long
’VISA function status return code
Dim defrm As Long
’Session to Default Resource Manager
Dim vi As Long
’Session to instrument
Dim x As Integer
’Loop Variable
Dim ArrayPtr(1) As Long ’Array of Pointers
Dim ResultsArray(50000) As Byte ’results array, Big enough to hold a GIF
Dim length As Long
’Number of bytes returned from instrument
Dim fnum As Integer
’File Number to used to open file to store data
Dim isOpen As Boolean
’Boolean flag used to keep track of open file
Chapter 16
189
ESA/PSA Programming Examples
ESA/PSA Programming Examples
Using Visual Basic® 6 to Capture a Screen Image
ESA/PSA Programming Examples
ESA/PSA Programming Examples
Using Visual Basic® 6 to Capture a Screen Image
Dim headerlength As Long ’length of header
’Set the default number of bytes that will be contained in the
’ResultsArray to 50,000 (50kB)
length = 50000
’Set the array of pointers to the addresses of the variables
ArrayPtr(0) = VarPtr(length)
ArrayPtr(1) = VarPtr(ResultsArray(0))
’Delete picture.gif file if it exists
On Error Resume Next
Kill "picture.gif"
On Error GoTo Error_Handler
’ Open the default resource manager session
status = viOpenDefaultRM(defrm)
’ Open the session.
Note: For PSA, to use LAN, change the string to
’ "TCPIP0::xxx.xxx.xxx.xxx::inst0::INSTR" where xxxxx is the IP address
status = viOpen(defrm, "GPIB0::18::INSTR", 0, 0, vi)
If (status < 0) Then GoTo VisaErrorHandler
’ Set the I/O timeout to fifteen seconds
status = viSetAttribute(vi, VI_ATTR_TMO_VALUE, 15000)
If (status < 0) Then GoTo VisaErrorHandler
’Store the current screen image on flash as C:PICTURE.GIF
status = viVPrintf(vi, ":MMEM:STOR:SCR ’C:PICTURE.GIF’" + Chr$(10), 0)
If (status < 0) Then GoTo VisaErrorHandler
’Grab the screen image file from the instrument
status = viVQueryf(vi, ":MMEM:DATA? ’C:PICTURE.GIF’" + Chr$(10), _
"%#y", ArrayPtr(0))
190
Chapter 16
’Delete the tempory file on the flash named C:PICTURE.GIF
status = viVPrintf(vi, ":MMEM:DEL ’C:PICTURE.GIF’" + Chr$(10), 0)
If (status < 0) Then GoTo VisaErrorHandler
’Close the vi session and the resource manager session
Call viClose(vi)
Call viClose(defrm)
’Store the results in a text file
fnum = FreeFile()
’Get the next free file number
Open "picture.gif" For Binary As #fnum
isOpen = True
headerlength = 2 + (Chr$(ResultsArray(1)))
For x = headerlength To length - 2
Put #fnum, , ResultsArray(x)
Next x
’ Intentionally flow into Error Handler to close file
Error_Handler:
’ Raise the error (if any), but first close the file
If isOpen Then Close #fnum
If Err Then Err.Raise Err.Number, , Err.Description
Exit Sub
VisaErrorHandler:
Dim strVisaErr As String * 200
Call viStatusDesc(defrm, status, strVisaErr)
MsgBox "*** Error : " & strVisaErr, vbExclamation, "VISA Error Message"
Exit Sub
End Sub
Chapter 16
191
ESA/PSA Programming Examples
ESA/PSA Programming Examples
Using Visual Basic® 6 to Capture a Screen Image
ESA/PSA Programming Examples
ESA/PSA Programming Examples
Using Visual Basic® 6 to Transfer Binary Trace Data
Using Visual Basic® 6 to Transfer Binary Trace
Data
This is a Visual Basic example that gets binary trace data from the
instrument. Binary data transfers are faster than the default ASCII
transfer mode, because less data is sent over the bus. This example
works with the ESA or PSA Series spectrum analyzers. The bas file
(bintrace.bas) and a compiled executable (bintrace.exe) can be found on
the Documentation CD.
This example:
1. Queries the IDN (identification) string from the instrument.
2. While in Spectrum Analysis mode, it reads the trace data in binary
format (Real,32 or Real,64 or Int,32).
3. Stores the data is then to a file "bintrace.txt".
NOTE
This example uses GPIB address 18 for the spectrum analyzer.
’’ """""""""""""""""""""""""""""""""""""""""""""""""""""""""""""""""""""""
’’
Copyright (c) 1999- 2003 Agilent Technologies Inc.
All rights reserved.
’’
’’ You have a royalty-free right to use, modify, reproduce and distribute
’’ the Sample Application Files (and/or any modified version) in any way
’’ you find useful, provided that you agree that Agilent Technologies has
’’ no warranty, obligations or liability for any Sample Application Files.
’’
’’ Agilent Technologies provides programming examples for illustration only,
’’ This sample program assumes that you are familiar with the programming
’’ language being demonstrated and the tools used to create and debug
’’ procedures. Agilent Technologies support engineers can help explain the
’’ functionality of Agilent Technologies software components and associated
’’ commands, but they will not modify these samples to provide added
’’ functionality or construct procedures to meet your specific needs.
’’ """"""""""""""""""""""""""""""""""""""""""""""""""""""""""""""""""""""""
’’ To develop VISA applications in Microsoft Visual Basic, you first need
’’ to add the Visual Basic (VB) declaration file in your VB project as a
’’ Module. This file contains the VISA function definitions and constant
192
Chapter 16
’’ declarations needed to make VISA calls from Visual Basic.
’’ To add this module to your project in VB 6, from the menu, select
’’ Project->Add Module, select the ’Existing’ tab, and browse to the
’’ directory containing the VB Declaration file, select visa32.bas, and
’’ press ’Open’.
’’
’’ The name and location of the VB declaration file depends on which
’’ operating system you are using.
Assuming the ’standard’ VISA directory
’’ of C:\Program Files\VISA or the ’standard’ VXIpnp directory of
’’ C:\VXIpnp, the visa32.bas file can be located in one of the following:
’’
’’
\winnt\agvisa\include\visa32.bas - Windows NT/2000/XP
’’
\winnt\include\visa32.bas
- Windows NT/2000/XP
’’
\win95\include\visa32.bas
- Windows 95/98/Me
’’’’’’’’’’’’’’’’’’’’’’’’’’’’’’’’’’’’’’’’’’’’’’’’’’’’’’’’’’’’’’’’’’’’’’’’’’’’
’
bintrace.bas
’
The following example program is written for the PSA and ESA Series
’
Spectrum Analyzers.
’
and then reads the trace data in Spectrum Analysis mode in binary
’
format (Real,32 or Real,64 or Int,32).
’
file "bintrace.txt".
’
Binary transfers are faster than the default ASCII transfer mode,
’
because less data is sent over the bus.
It queries the IDN string from the instrument
The data is then stored to a
’’’’’’’’’’’’’’’’’’’’’’’’’’’’’’’’’’’’’’’’’’’’’’’’’’’’’’’’’’’’’’’’’’’’’’’’’’’’
Option Explicit
Private Sub Main()
’ Declare Variables used in the program
Dim status As Long
’VISA function status return code
Dim defrm As Long
’Session to Default Resource Manager
Dim vi As Long
’Session to instrument
Dim strRes As String * 100
’Fixed length string to hold *IDN? Results
Dim x As Integer
’Loop Variable
Dim output As String
’output string variable
Dim ArrayPtr(1) As Long ’Array of Pointers
Chapter 16
193
ESA/PSA Programming Examples
ESA/PSA Programming Examples
Using Visual Basic® 6 to Transfer Binary Trace Data
ESA/PSA Programming Examples
ESA/PSA Programming Examples
Using Visual Basic® 6 to Transfer Binary Trace Data
Dim ResultsArray(8192) As Single ’trace element array of Real,32 values
’For Real,64 data use Double. For Int,32 data use Long
Dim length As Long
’Number of trace elements return from instrument
Dim fnum As Integer
’File Number to used to open file to store data
Dim isOpen As Boolean
’Boolean flag used to keep track of open file
’Set the default number of trace elements to the ResultsArray size
’Note: PSA and ESA currently support up to 8192 trace points
length = 8192
’Set the array of pointers to the addresses of the variables
ArrayPtr(0) = VarPtr(length)
ArrayPtr(1) = VarPtr(ResultsArray(0))
On Error GoTo Error_Handler
’ Open the default resource manager session
status = viOpenDefaultRM(defrm)
’ Open the session.
Note: For PSA, to use LAN, change the string to
’ "TCPIP0::xxx.xxx.xxx.xxx::inst0::INTSR" where xxxxx is the IP address
status = viOpen(defrm, "GPIB0::18::INSTR", 0, 0, vi)
If (status < 0) Then GoTo VisaErrorHandler
’ Set the I/O timeout to five seconds
status = viSetAttribute(vi, VI_ATTR_TMO_VALUE, 5000)
If (status < 0) Then GoTo VisaErrorHandler
’Ask for the devices’s *IDN string.
status = viVPrintf(vi, "*IDN?" + Chr$(10), 0)
If (status < 0) Then GoTo VisaErrorHandler
’Read back the IDN string from the instrument
status = viVScanf(vi, "%t", strRes)
If (status < 0) Then GoTo VisaErrorHandler
194
Chapter 16
’Print the IDN string results in a message box
MsgBox (strRes)
’Change the instrument mode to Spectrum Analysis
status = viVPrintf(vi, ":INST:NSEL 1" + Chr$(10), 0)
If (status < 0) Then GoTo VisaErrorHandler
’ Set instrument trace data format to 32-bit Real
’ Note: For higher precision use 64-bit data, ":FORM REAL,64"
’ For faster data transfer for ESA, use ":FORM INT,32"
status = viVPrintf(vi, ":FORM REAL,32" + Chr$(10), 0)
If (status < 0) Then GoTo VisaErrorHandler
’Set Analyzer to single sweep mode
status = viVPrintf(vi, ":INIT:CONT 0" + Chr$(10), 0)
If (status < 0) Then GoTo VisaErrorHandler
’Trigger a sweep and wait for sweep to complete
status = viVPrintf(vi, ":INIT:IMM;*WAI" + Chr$(10), 0)
If (status < 0) Then GoTo VisaErrorHandler
’Query the trace data from the instrument
’Note: Change the "%#zb" to "%#Zb" for Real,64 data
’
For Int,32 leave the modifier as "%#zb"
status = viVQueryf(vi, ":TRAC:DATA? TRACE1" + Chr$(10), _
"%#zb", ArrayPtr(0))
’Close the vi session and the resource manager session
Call viClose(vi)
Call viClose(defrm)
’Print number of elements returned
MsgBox ("Number of trace elements returned = " & length)
’Create a string from the ResultsArray to output to a file
For x = 0 To length - 1
Chapter 16
195
ESA/PSA Programming Examples
ESA/PSA Programming Examples
Using Visual Basic® 6 to Transfer Binary Trace Data
ESA/PSA Programming Examples
ESA/PSA Programming Examples
Using Visual Basic® 6 to Transfer Binary Trace Data
output = output & ResultsArray(x) & vbCrLf
Next x
’Print Results to the Screen
MsgBox (output)
’Store the results in a text file
fnum = FreeFile()
’Get the next free file number
Open "bintrace.txt" For Output As #fnum
isOpen = True
Print #fnum, output
’ Intentionally flow into Error Handler to close file
Error_Handler:
’ Raise the error (if any), but first close the file
If isOpen Then Close #fnum
If Err Then Err.Raise Err.Number, , Err.Description
Exit Sub
VisaErrorHandler:
Dim strVisaErr As String * 200
Call viStatusDesc(defrm, status, strVisaErr)
MsgBox "*** Error : " & strVisaErr, vbExclamation, "VISA Error Message"
Exit Sub
End Sub
196
Chapter 16
Using Agilent VEE to Transfer Trace Data
This VEE programming example transfers trace data from a PSA or ESA
series spectrum analyzer. The program supports data transfer types to
integer 32, real 32, real 64 and ASCII data.
VEE Window Capture of “tracetransfer.vee”:
Chapter 16
197
ESA/PSA Programming Examples
ESA/PSA Programming Examples
Using Agilent VEE to Transfer Trace Data
ESA/PSA Programming Examples
ESA/PSA Programming Examples
Using Agilent VEE to Transfer Trace Data
198
Chapter 16
ESA Programming Examples
17
ESA Programming Examples
199
ESA Programming Examples
Examples Included in this Chapter:
Examples Included in this Chapter:
ESA Programming Examples
This chapter includes C programming examples of how to program the ESA series
using SCPI commands. Twelve examples are written for ESA analyzers with GPIB
interface (Option A4H). Three examples are written for ESA analyzers with an
RS-232 interface (Option 1AX). These examples do not apply to analyzers that
have Option 290 (8590 Series Programming Code Compatibility).
“Using C with Marker Peak Search and Peak Excursion Measurement
Routines” on page 202
“Using C for Marker Delta Mode and Marker Minimum Search Functions” on
page 206
“Using C to Perform Internal Self-Alignment” on page 210
“Using C to Read Trace Data in an ASCII Format (over GPIB)” on page 214
“Using C to Read Trace Data in a 32-Bit Real Format (over GPIB)” on page
218
“Using C to Read Trace Data in an ASCII Format (over RS-232)” on page 223
“Using C to Read Trace Data in a 32-bit Real Format (over RS-232)” on page
228
“Using C to Add Limit Lines” on page 233
“Using C to Measure Noise” on page 239
“Using C to Enter Amplitude Correction Data” on page 243
“Using C to Determine if an Error has Occurred” on page 247
“Using C to Measure Harmonic Distortion (over GPIB)” on page 253
“Using C to Measure Harmonic Distortion (over RS-232)” on page 261
“Using C to Make Faster Power Averaging Measurements” on page 269
200
Chapter 17
ESA Programming Examples
Programming Examples System Requirements
Programming Examples System Requirements
The ESA Series examples were written for use on an IBM compatible PC
configured as follows:
Pentium processor
•
Windows 95/98/2000/XP or Windows NT 4.0 operating system
•
C programming language
•
National Instruments GPIB interface card (for analyzers with Option A4H)
•
National Instruments VISA Transition Libraries (VTL)
•
COM1 serial port configured as follows (for analyzers with Option 1AX)
•
9600 baud
•
8 data bits
•
1 stop bit
•
no parity bits
•
hardware flow control
ESA Programming Examples
•
A HP/Agilent 82341C card may be substituted for the National Instruments GPIB,
and the HP VISA libraries may be substituted for the National Instruments VISA
Transition Libraries. If substitutions are made, the subdirectories for the include
and library files will be different than those listed in the following paragraphs.
Refer to the documentation for your interface card and the VISA libraries for
details.
Chapter 17
201
ESA Programming Examples
Using C with Marker Peak Search and Peak Excursion Measurement
Routines
Using C with Marker Peak Search and Peak Excursion
Measurement Routines
This C programming example (mkpksrch.c) can be found on the Documentation
CD.
ESA Programming Examples
/************************************************************/
/* Using Marker Peak Search and Peak Excursion
*/
/*
*/
/* This example is for the E44xxB ESA Spectrum Analyzers
*/
/* and E740xA EMC Analyzers.
*/
/*
*/
/* This C programming example does the following.
*/
/* The SCPI instrument commands used are given as
*/
/* reference.
*/
/*
*/
/* - Opens a GPIB session at address 18
*/
/* - Clears the Analyzer
*/
/*
*CLS
*/
/* - Resets the Analyzer
*/
/*
*RST
*/
/* - Sets the analyzer center frequency, span and units
*/
/*
SENS:FREQ:CENT freq
*/
/*
SENS:FREQ:SPAN freq
*/
/*
UNIT:POW DBM
*/
/* - Set the input port to the 50 MHz amplitude reference
*/
/*
CAL:SOUR:STAT ON
*/
/* - Set the analyzer to single sweep mode
*/
/*
INIT:CONT 0
*/
/* - Prompt the user for peak excursion and set them
*/
/*
CALC:MARK:PEAK:EXC dB
*/
/* - Set the peak threshold to -90 dBm
*/
/*
TRAC:MATH:PEAK:THR:STAT ON
*/
/*
TRAC:MATH:PEAK:THR -90
*/
/* - Trigger a sweep and wait for sweep to complete
*/
/*
INIT:IMM;*WAI
*/
/* - Set the marker to the maximum peak
*/
/*
CALC:MARK:MAX
*/
/* - Query and read the marker frequency and amplitude
*/
/*
CALC:MARK:X?
*/
/*
CALC:MARK:Y?
*/
/* - Close the session
*/
/************************************************************/
202
Chapter 17
ESA Programming Examples
Using C with Marker Peak Search and Peak Excursion Measurement
Routines
#include
#include
#include
#include
#include
#include
#include
<stdio.h>
<stdlib.h>
<math.h>
<conio.h>
<ctype.h>
<string.h>
"visa.h"
ESA Programming Examples
#define hpESA_IDN_E4401B "Hewlett-Packard, E4401B"
#define hpESA_IDN_E4411B "Hewlett-Packard, E4411B"
#definehpEMC_IDN_E7401A "Hewlett-Packard, E7401A"
ViSession defaultRM, viESA;
ViStatus errStatus;
ViChar
cIdBuff[256]= {0};
char
cEnter = 0;
int
iResult = 0;
/*Set the input port to 50MHz amplitude reference*/
void Route50MHzSignal()
{
viQueryf(viESA, "*IDN?\n", "%t", &cIdBuff);
iResult = (strncmp( cIdBuff, hpESA_IDN_E4401B, strlen(hpESA_IDN_E4401B)) &&
strncmp( cIdBuff, hpESA_IDN_E4411B, strlen(hpESA_IDN_E4411B)) && strncmp( cIdBuff,
hpEMC_IDN_E7401A, strlen(hpEMC_IDN_E7401A)));
if( iResult == 0 )
{
/*Set the input port to the 50MHz amplitude reference for the models*/
/*E4401B, E4411B and E7401A*/
viPrintf(viESA,"CAL:SOUR:STAT ON \n");
}
else
{
/* For the analyzers having frequency limits >= 3GHz, prompt the user*/
/* to connect the amplitude reference output to the input*/
printf ("Connect AMPTD REF OUT to the INPUT \n");
printf ("......Press Return to continue \n");
scanf( "%c",&cEnter);
/*Externally route the 50MHz Signal*/
viPrintf(viESA,"CAL:SOUR:STAT ON \n");
}
}
void main()
Chapter 17
203
ESA Programming Examples
Using C with Marker Peak Search and Peak Excursion Measurement
Routines
{
ESA Programming Examples
/*Program Variables*/
ViStatus viStatus = 0;
double dMarkerFreq = 0;
double dMarkerAmpl = 0;
float fPeakExcursion =0;
long lOpc = 0L;
/*Open a GPIB session at address 18.*/
viStatus=viOpenDefaultRM(&defaultRM);
viStatus=viOpen(defaultRM,"GPIB0::18",VI_NULL,VI_NULL,&viESA);
if(viStatus)
{
printf("Could not open a session to GPIB device at address 18!\n");
exit(0);
}
/*Clear the instrument*/
viClear(viESA);
/*Reset the instrument*/
viPrintf(viESA,"*RST\n");
/*Set Y-Axis units to dBm*/
viPrintf(viESA, "UNIT:POW DBM\n");
/*Set the analyzer center frequency to 50MHZ*/
viPrintf(viESA,"SENS:FREQ:CENT 50e6\n");
/*Set the analyzer span to 50MHZ*/
viPrintf(viESA,"SENS:FREQ:SPAN 50e6\n");
/*Display the program heading */
printf("\n\t\t Marker Program \n\n" );
/* Check for the instrument model number and route the 50MHz signal accordingly*/
Route50MHzSignal();
/*Set analyzer to single sweep mode*/
viPrintf(viESA,"INIT:CONT 0 \n");
/*User enters the peak excursion value*/
printf("\t Enter PEAK EXCURSION in dB: ");
scanf( "%f",&fPeakExcursion);
/*Set the peak excursion*/
viPrintf(viESA,"CALC:MARK:PEAK:EXC %1fDB \n",fPeakExcursion);
204
Chapter 17
ESA Programming Examples
Using C with Marker Peak Search and Peak Excursion Measurement
Routines
/*Set the peak thresold */
viPrintf(viESA,"CALC:MARK:PEAK:THR -90 \n");
/*Trigger a sweep and wait for completion*/
viPrintf(viESA,"INIT:IMM;*WAI\n");
/*Set the marker to the maximum peak*/
viPrintf(viESA,"CALC:MARK:MAX \n");
ESA Programming Examples
/*Query and read the marker frequency*/
viQueryf(viESA,"CALC:MARK:X? \n","%lf",&dMarkerFreq);
printf("\n\t RESULT: Marker Frequency is: %lf MHZ \n\n",dMarkerFreq/10e5);
/*Query and read the marker amplitude*/
viQueryf(viESA,"CALC:MARK:Y?\n","%lf",&dMarkerAmpl);
printf("\t RESULT: Marker Amplitude is: %lf dBm \n\n",dMarkerAmpl);
/*Close the session*/
viClose(viESA);
viClose(defaultRM);
}
Chapter 17
205
ESA Programming Examples
Using C for Marker Delta Mode and Marker Minimum Search Functions
Using C for Marker Delta Mode and Marker Minimum
Search Functions
This C programming example (mkrdelta.c) can be found on the Documentation
CD.
ESA Programming Examples
/************************************************************/
/* Using Marker Delta Mode and Marker Minimum Search
*/
/*
*/
/* This example is for the E44xxB ESA Spectrum Analyzers
*/
/* and E740xA EMC Analyzers.
*/
/*
*/
/* This C programming example does the following.
*/
/* The SCPI instrument commands used are given as
*/
/* reference.
*/
/*
*/
/* - Opens a GPIB session at address 18
*/
/* - Clears the Analyzer
*/
/* - Resets the Analyzer
*/
/*
*RST
*/
/* - Set the input port to the 50 MHz amplitude reference
*/
/*
CAL:SOUR:STAT ON
*/
/* - Set the analyzer to single sweep mode
*/
/*
INIT:CONT 0
*/
/* - Prompts the user for the start and stop frequencies
*/
/* - Sets the start and stop frequencies
*/
/*
SENS:FREQ:START freq
*/
/*
SENS:FREQ:STOP freq
*/
/* - Trigger a sweep and wait for sweep completion
*/
/*
INIT:IMM;*WAI
*/
/* - Set the marker to the maximum peak
*/
/*
CALC:MARK:MAX
*/
/* - Set the analyzer to activate the delta marker
*/
/*
CALC:MARK:MODE DELT
*/
/* - Trigger a sweep and wait for sweep completion
*/
/*
INIT:IMM;*WAI
*/
/* - Set the marker to the minimum amplitude mode
*/
/*
CALC:MARK:MIN
*/
/* - Query and read the marker amplitude
*/
/*
CALC:MARK:Y?
*/
/* - Close the session
*/
/************************************************************/
#include <stdio.h>
206
Chapter 17
ESA Programming Examples
Using C for Marker Delta Mode and Marker Minimum Search Functions
#include
#include
#include
#include
#include
#include
<stdlib.h>
<math.h>
<conio.h>
<ctype.h>
<string.h>
"visa.h"
#define hpESA_IDN_E4401B
#define hpESA_IDN_E4411B
#define hpEMC_IDN_E7401A
"Hewlett-Packard, E4401B"
"Hewlett-Packard, E4411B"
"Hewlett-Packard, E7401A"
/*Set the input port to the 50MHz amplitude reference*/
void Route50MHzSignal()
{
viQueryf(viESA, "*IDN?\n", "%t", &cIdBuff);
iResult = (strncmp( cIdBuff, hpESA_IDN_E4401B, strlen(hpESA_IDN_E4401B)) &&
strncmp( cIdBuff, hpESA_IDN_E4411B, strlen(hpESA_IDN_E4411B)) && strncmp( cIdBuff,
hpEMC_IDN_E7401A, strlen(hpEMC_IDN_E7401A)));
if( iResult == 0 )
{
/*Set the input port to the 50MHz amplitude reference for the models*/
/* E4401B, E4411B and E7401A*/
viPrintf(viESA,"CAL:SOUR:STAT ON \n");
}
else
{
/* For the analyzers having frequency limits >= 3GHz, prompt the user*/
/* to connect the amplitude reference output to the input*/
printf ("Connect AMPTD REF OUT to the INPUT \n");
printf ("......Press Return to continue \n");
scanf( "%c",&cEnter);
/*Externally route the 50MHz Signal*/
viPrintf(viESA,"CAL:SOUR:STAT ON \n");
}
}
void main()
{
/*Program Variable*/
Chapter 17
207
ESA Programming Examples
ViSession defaultRM, viESA;
ViStatus errStatus;
ViChar
cIdBuff[256] ={0};
char
cEnter = 0;
int
iResult =0;
ESA Programming Examples
Using C for Marker Delta Mode and Marker Minimum Search Functions
ESA Programming Examples
ViStatus viStatus = 0;
double dStartFreq =0.0;
double dStopFreq =0.0;
double dMarkerAmplitude = 0.0;
long
lOpc =0L;
/* Open an GPIB session at address 18*/
viStatus=viOpenDefaultRM(&defaultRM);
viStatus=viOpen(defaultRM,"GPIB0::18",VI_NULL,VI_NULL,&viESA);
if(viStatus)
{
printf("Could not open a session to GPIB device at address 18!\n");
exit(0);
}
/*Clear the instrument*/
viClear(viESA);
/*Reset the instrument*/
viPrintf(viESA,"*RST\n");
/*Display the program heading */
printf("\n\t\t Marker Delta Program \n\n" );
/*Check for the instrument model number and route the 50MHz signal accordingly*/
Route50MHzSignal();
/*Set the analyzer to single sweep mode*/
viPrintf(viESA,"INIT:CONT 0\n");
/*Prompt the user for the start frequency*/
printf("\t Enter the Start frequency in MHz ");
/*The user enters the start frequency*/
scanf("%lf",&dStartFreq);
/*Prompt the user for the stop frequency*/
printf("\t Enter the Stop frequency in MHz ");
/*The user enters the stop frequency*/
scanf("%lf",&dStopFreq);
/*Set the analyzer to the values given by the user*/
viPrintf(viESA,"SENS:FREQ:STAR %lf MHZ \n;:SENS:FREQ:STOP %lf
MHZ\n",dStartFreq,dStopFreq);
/*Trigger a sweep, wait for completion*/
208
Chapter 17
ESA Programming Examples
Using C for Marker Delta Mode and Marker Minimum Search Functions
viPrintf(viESA,"INIT:IMM;*WAI\n");
/*Set the marker to the maximum peak*/
viPrintf(viESA,"CALC:MARK:MAX\n");
/*Set the analyzer to activate delta marker mode*/
viPrintf(viESA,"CALC:MARK:MODE DELT\n");
/*Trigger a sweep, wait for completion*/
viPrintf(viESA,"INIT:IMM;*WAI\n");
ESA Programming Examples
/*Set the marker to minimum amplitude*/
viPrintf(viESA,"CALC:MARK:MIN\n");
/*Query and read the marker amplitude*/
viQueryf(viESA,"CALC:MARK:Y?\n","%lf",&dMarkerAmplitude);
/*print the marker amplitude*/
printf("\n\n\tRESULT: Marker Amplitude Delta = %lf dB\n\n",dMarkerAmplitude);
/*Close the session*/
viClose(viESA);
viClose(defaultRM);
}
Chapter 17
209
ESA Programming Examples
Using C to Perform Internal Self-Alignment
Using C to Perform Internal Self-Alignment
This C programming example (intalign.c) can be found on the Documentation CD.
ESA Programming Examples
/************************************************************/
/* Performing Internal Self-alignment
*/
/*
*/
/* This example is for the E44xxB ESA Spectrum Analyzers
*/
/* and E740xA EMC Analyzers.
*/
/*
*/
/* This example shows two ways of executing an internal
*/
/* self-alignment. The first demonstrates using the *OPC?
*/
/* query to determine when the alignment has completed. The */
/* second demonstrates using the query form of the CAL:ALL */
/* command to not only determine when the alignment has
*/
/* been completed, but the pass/fail status of the align*/
/* ment process.
*/
/*
*/
/* This C programming example does the following.
*/
/* The SCPI instrument commands used are given as
*/
/* reference.
*/
/*
*/
/* - Opens a GPIB session at address 18
*/
/* - Clears the Analyzer
*/
/*
*CLS
*/
/* - Resets the Analyzer
*/
/*
*RST
*/
/* - VISA function sets the time out to infinite
*/
/* - Initiate self-alignment
*/
/*
CAL:ALL
*/
/* - Query for operation complete
*/
/*
*OPC?
*/
/* - Query for results of self-alignment
*/
/*
CAL:ALL?
*/
/* - Report the results of the self-alignment
*/
/* - Close the session
*/
/************************************************************/
#include
#include
#include
#include
#include
#include
<stdio.h>
<stdlib.h>
<math.h>
<ctype.h>
<string.h>
"visa.h"
210
Chapter 17
ESA Programming Examples
Using C to Perform Internal Self-Alignment
#define hpESA_IDN_E4401B "Hewlett-Packard, E4401B"
#define hpESA_IDN_E4411B "Hewlett-Packard, E4411B"
#definehpEMC_IDN_E7401A "Hewlett-Packard, E7401A"
ViSession defaultRM, viESA;
ViStatus errStatus;
ViChar
cIdBuff[256]= {0};
char
cEnter = 0;
int
iResult = 0;
viQueryf(viESA, "*IDN?\n", "%t", &cIdBuff);
iResult = (strncmp( cIdBuff, hpESA_IDN_E4401B, strlen(hpESA_IDN_E4401B)) &&
strncmp( cIdBuff, hpESA_IDN_E4411B, strlen(hpESA_IDN_E4411B)) && strncmp( cIdBuff,
hpEMC_IDN_E7401A, strlen(hpEMC_IDN_E7401A)));
if( iResult == 0 )
{
/*Set the input port to the 50MHz amplitude reference for the models*/
/*E4401B, E4411B, and E7401A*/
viPrintf(viESA,"CAL:SOUR:STAT ON \n");
}
else
{
/* For the analyzers having frequency limits >= 3GHz, prompt the user*/
/* to connect the amplitude reference output to the input*/
printf ("Connect AMPTD REF OUT to the INPUT \n");
printf ("......Press Return to continue \n");
scanf( "%c",&cEnter);
/*Externally route the 50MHz Signal*/
viPrintf(viESA,"CAL:SOUR:STAT ON \n");
}
}
void main()
{
/*Program Variables*/
ViStatus viStatus = 0;
long lOpc =0L;
long lResult =0L;
/* Open a GPIB session at address 18*/
Chapter 17
211
ESA Programming Examples
/*Set the input port to 50MHz amplitude reference*/
void Route50MHzSignal()
{
ESA Programming Examples
Using C to Perform Internal Self-Alignment
ESA Programming Examples
viStatus=viOpenDefaultRM(&defaultRM);
viStatus=viOpen(defaultRM,"GPIB0::18",VI_NULL,VI_NULL,&viESA);
if(viStatus)
{
printf("Could not open a session to GPIB device at address 18!\n");
exit(0);
}
/*Clear the instrument*/
viClear(viESA);
/*Reset the instrument*/
viPrintf(viESA,"*RST\n");
/*Display the program heading */
printf("\n\t\t Internal Self-Alignment Program \n\n" );
/*Check for the instrument model number and route the 50MHz-signal accordingly*/
Route50MHzSignal();
/*VISA function sets the time out to infinite for this specified session*/
viSetAttribute(viESA, VI_ATTR_TMO_VALUE, VI_TMO_INFINITE);
printf("\t Performing first self alignment ..... " );
/*Initiate a self-alignment */
viPrintf(viESA,"CAL:ALL\n");
/*Query for operation complete*/
viQueryf(viESA, "*OPC?\n", "%d", &lOpc);
printf ("\n\n\t First Self Alignment is Done \n\n");
if (!lOpc)
{
printf("Program Abort! error ocurred: last command was not completed!\n");
exit(0);
}
printf ("\n\n\t Press Return to continue with next alignment \n\n");
scanf( "%c",&cEnter);
printf("\t Performing next self alignment ..... " );
/* Query for self-alignment results*/
viQueryf(viESA,"CAL:ALL?\n","%d",&lResult);
if (lResult)
printf ("\n\n\t Self-alignment Failed \n");
else
printf ("\n\n\t Self-alignment Passed \n");
/* Query for operation complete*/
212
Chapter 17
ESA Programming Examples
Using C to Perform Internal Self-Alignment
viQueryf(viESA, "*OPC?\n", "%d", &lOpc);
if (!lOpc)
{
printf("Program Abort! error ocurred: last command was not completed!\n");
exit(0);
}
/*Close the session*/
viClose(viESA);
viClose(defaultRM);
}
ESA Programming Examples
Chapter 17
213
ESA Programming Examples
Using C to Read Trace Data in an ASCII Format (over GPIB)
Using C to Read Trace Data in an ASCII Format (over
GPIB)
This C programming example (ascigpib.c) can be found on the Documentation
CD.
ESA Programming Examples
/************************************************************/
/*
/*
/*
/*
/*
/*
/*
/*
/*
/*
/*
/*
/*
/*
/*
/*
/*
/*
/*
/*
/*
/*
/*
/*
/*
/*
/*
/*
/*
/*
/*
/*
/*
/*
/*
/*
/*
Reading Trace Data using ASCII Format (GPIB)
This example is for the E44xxB ESA Spectrum Analyzers
and E740xA EMC Analyzers.
The required SCPI instrument commands are given as
reference.
- Opens a GPIB session at address 18
- Clears the Analyzer
- Resets the Analyzer
*RST
- Set the input port to the 50 MHz amplitude reference
E4411B or E4401B
CAL:SOUR:STAT ON
E4402, E4403B, E4404BE, 4405B, E4407B or E4408B
Prompt to connect AMPTD REF OUT to INPUT
CAL:SOUR STAT ON
- Query for the number of sweep points (only applies to
firmware revisions A.04.00 and later); default is 401
SENS:SWE:POIN?
- Sets the analyzer center frequency to 50 MHz
SENS:FREQ:CENT 50 MHZ
- Sets the analyzer span to 50 MHz
SENS:FREQ:SPAN 50 MHZ
- Set the analyzer to single sweep mode
INIT:CONT 0
- Trigger a sweep and wait for sweep to complete
INIT:IMM;*WAI
- Specify units in dBm
UNIT:POW DBM
- Set the analyzer trace data to ASCII
FORM:DATA: ASC
- Trigger a sweep and wait for sweep to complete
INIT:IMM;*WAI
- Query the trace data
TRAC:DATA? TRACE1
214
*/
*/
*/
*/
*/
*/
*/
*/
*/
*/
*/
*/
*/
*/
*/
*/
*/
*/
*/
*/
*/
*/
*/
*/
*/
*/
*/
*/
*/
*/
*/
*/
*/
*/
*/
*/
*/
Chapter 17
ESA Programming Examples
Using C to Read Trace Data in an ASCII Format (over GPIB)
/* - Remove the "," from the ACSII data
*/
/* - Save the trace data to an ASCII file
*/
/* - Close the session
*/
/************************************************************/
<stdio.h>
<stdlib.h>
<math.h>
<conio.h>
<ctype.h>
<string.h>
"visa.h"
ESA Programming Examples
#include
#include
#include
#include
#include
#include
#include
#define hpESA_IDN_E4401B "Hewlett-Packard, E4401B"
#define hpESA_IDN_E4411B "Hewlett-Packard, E4411B"
#definehpEMC_IDN_E7401A "Hewlett-Packard, E7401A"
ViSession defaultRM, viESA;
ViStatus errStatus;
ViChar
cIdBuff[256] ={0};
char cEnter =0;
int
iResult =0;
/*Set the input port to 50MHz amplitude reference*/
void Route50MHzSignal()
{
viQueryf(viESA, "*IDN?\n", "%t", &cIdBuff);
iResult = (strncmp( cIdBuff, hpESA_IDN_E4401B, strlen(hpESA_IDN_E4401B)) &&
strncmp( cIdBuff, hpESA_IDN_E4411B, strlen(hpESA_IDN_E4411B)) && strncmp( cIdBuff,
hpEMC_IDN_E7401A, strlen(hpEMC_IDN_E7401A)));
if( iResult == 0 )
{
/*Set the input port to the 50MHz amplitude reference for the models*/
/*E4401B, E4411B and E7401A*/
viPrintf(viESA,"CAL:SOUR:STAT ON \n");
}
else
{
/* For the analyzers having frequency limits >= 3GHz, prompt the user*/
/* to connect the amplitude reference output to the input*/
printf ("Connect AMPTD REF OUT to the INPUT \n");
printf ("......Press Return to continue \n");
scanf( "%c",&cEnter);
/*Externally route the 50MHz Signal*/
viPrintf(viESA,"CAL:SOUR:STAT ON \n");
Chapter 17
215
ESA Programming Examples
Using C to Read Trace Data in an ASCII Format (over GPIB)
}
ESA Programming Examples
}
void main()
{
/*Program Variable*/
ViStatus viStatus = 0;
/*Dimension cResult to 13 bytes per sweep point, 8192 sweep points maximum*/
ViChar _VI_FAR cResult[106496] = {0};
FILE *fTraceFile;
static ViChar *cToken ;
int iNum =0;
int iSwpPnts = 401;
long lCount=0L;
long lOpc=0;
/*iNum set to 13 times number of sweep points, 8192 sweep points maximum*/
iNum =106496;
lCount =0;
/* Open a GPIB session at address 18*/
viStatus=viOpenDefaultRM(&defaultRM);
viStatus=viOpen(defaultRM,"GPIB0::18",VI_NULL,VI_NULL,&viESA);
if(viStatus)
{
printf("Could not open a session to GPIB device at address 18!\n");
exit(0);
}
/* Clear the instrument */
viClear(viESA);
/*Reset the instrument. This will set number of sweep points to default of 401*/
viPrintf(viESA,"*RST\n");
/*Display the program heading */
printf("\n\t\t Read in Trace Data using ASCII Format (GPIB) Program \n\n" );
/* Check for the instrument model number and route the 50MHz signal accordingly*/
Route50MHzSignal();
/*Query number of sweep points per trace (firmware revision A.04.00 and later)*/
/*For firmware revisions prior to A.04.00, the number of sweep points is 401*/
iSwpPnts = 401;
viQueryf(viESA,"SENSE:SWEEP:POINTS?\n","%d",&iSwpPnts);
/*Set the analyzer center frequency to 50MHz*/
216
Chapter 17
ESA Programming Examples
Using C to Read Trace Data in an ASCII Format (over GPIB)
viPrintf(viESA,"SENS:FREQ:CENT 50 MHz\n");
/*Set the analyzer to 50MHz Span*/
viPrintf(viESA,"SENS:FREQ:SPAN 50 MHz\n");
/*Set the analyzer to single sweep mode */
viPrintf(viESA,"INIT:CONT 0 \n");
/*Trigger a sweep and wait for sweep to complete */
viPrintf(viESA,"INIT:IMM;*WAI\n");
ESA Programming Examples
/* Specify units in dBm*/
viPrintf(viESA,"UNIT:POW DBM \n");
/*Set analyzer trace data format to ASCII Format*/
viPrintf(viESA,"FORM:DATA ASC \n");
/*Trigger a sweep and wait for sweep to complete */
viPrintf(viESA,"INIT:IMM;*WAI\n");
/*Query the Trace Data using ASCII Format */
viQueryf(viESA,"%s\n", "%#t","TRAC:DATA? TRACE1" , &iNum , cResult);
/*Remove the "," from the ASCII trace data for analyzing data*/
cToken = strtok(cResult,",");
/*Save trace data to an ASCII to a file, by removing the "," token*/
fTraceFile=fopen("C:\\temp\\ReadAscGpib.txt","w");
fprintf(fTraceFile,"ReadAscGpib.exe Output\nAgilent Technologies 2000\n\n");
fprintf(fTraceFile,"\tAmplitude of point[%d] = %s dBm\n",lCount+1,cToken);
while (cToken != NULL)
{
lCount++;
cToken =strtok(NULL,",");
if (lCount != iSwpPnts)
fprintf(fTraceFile,"\tAmplitude of point[%d] = %s
dBm\n",lCount+1,cToken);
}
fprintf(fTraceFile,"\nThe Total trace data points of the spectrum are :[%d]
\n\n",lCount);
fclose(fTraceFile);
/*Close the session*/
viClose(viESA);
viClose(defaultRM);
}
Chapter 17
217
ESA Programming Examples
Using C to Read Trace Data in a 32-Bit Real Format (over GPIB)
Using C to Read Trace Data in a 32-Bit Real Format
(over GPIB)
This C programming example (32btgpib.c) can be found on the Documentation
CD.
ESA Programming Examples
/************************************************************/
/*
/*
/*
/*
/*
/*
/*
/*
/*
/*
/*
/*
/*
/*
/*
/*
/*
/*
/*
/*
/*
/*
/*
/*
/*
/*
/*
/*
/*
/*
/*
/*
/*
/*
/*
/*
/*
Reading Trace Data using 32-bit Real Format (GPIB)
This example is for the E44xxB ESA Spectrum Analyzers
and E740xA EMC Analyzers.
This C programming example does the following.
The SCPI instrument commands used are given as
reference.
- Opens a GPIB session at address 18
- Clears the Analyzer
- Resets the Analyzer
*RST
- Set the input port to the 50 MHz amplitude reference
CAL:SOUR:STAT ON
- Query for the number of sweep points (for firmware
revisions A.04.00 and later). Default is 401.
SENS:SWE:POIN?
- Calculate the number of bytes in the header
- Set the analyzer to single sweep mode
INIT:CONT 0
- Sets the analyzer center frequency and span to 50 MHz
SENS:FREQ:CENT 50 MHZ
SENS:FREQ:SPAN 50 MHZ
- Specify 10 dB per division for the amplitude scale in
and dBm Units
DISP:WIND:TRAC:Y:SCAL:PDIV 10 dB
UNIT:POW DBM
- Set the analyzer trace data to 32-bit Real
FORM:DATA: REAL,32
- Set the binary order to swap
FORM:BORD SWAP
- Trigger a sweep and wait for sweep to complete
INIT:IMM;*WAI
- Calculate the number of bytes in the trace record
- Query the trace data
TRAC:DATA? TRACE1
218
*/
*/
*/
*/
*/
*/
*/
*/
*/
*/
*/
*/
*/
*/
*/
*/
*/
*/
*/
*/
*/
*/
*/
*/
*/
*/
*/
*/
*/
*/
*/
*/
*/
*/
*/
*/
*/
Chapter 17
ESA Programming Examples
Using C to Read Trace Data in a 32-Bit Real Format (over GPIB)
/* - Remove the "," from the ACSII data
*/
/* - Save the trace data to an ASCII file
*/
/* - Close the session
*/
/************************************************************/
<stdio.h>
<stdlib.h>
<math.h>
<conio.h>
<ctype.h>
<string.h>
"visa.h"
ESA Programming Examples
#include
#include
#include
#include
#include
#include
#include
#define hpESA_IDN_E4401B "Hewlett-Packard, E4401B"
#define hpESA_IDN_E4411B "Hewlett-Packard, E4411B"
#define hpEMC_IDN_E7401A "Hewlett-Packard, E7401A"
ViSession defaultRM, viESA;
ViChar
cIdBuff[256];
char cEnter =0;
int
iResult =0;
void Route50MHzSignal()
{
viQueryf(viESA, "*IDN?\n", "%t", &cIdBuff);
iResult = (strncmp( cIdBuff, hpESA_IDN_E4401B, strlen(hpESA_IDN_E4401B)) &&
strncmp( cIdBuff, hpESA_IDN_E4411B, strlen(hpESA_IDN_E4411B)) && strncmp( cIdBuff,
hpEMC_IDN_E7401A, strlen(hpEMC_IDN_E7401A)));
if( iResult == 0 )
{
/*Set the input port to the 50MHz internal reference source for the models*/
/*E4401B, E4411B and E7401A*/
viPrintf(viESA,"CAL:SOUR:STAT ON \n");
}
else
{
/* For the analyzers having frequency limits >= 3GHz, prompt the user to*/
/* connect the amplitude reference output to the input*/
printf ("Connect AMPTD REF OUT to the INPUT \n");
printf ("......Press Return to continue \n");
scanf( "%c",&cEnter);
/*Externally route the 50MHz Signal*/
viPrintf(viESA,"CAL:SOUR:STAT ON \n");
}
}
Chapter 17
219
ESA Programming Examples
ESA Programming Examples
Using C to Read Trace Data in a 32-Bit Real Format (over GPIB)
void main()
{
/*Program Variables*/
ViStatus viStatus= 0;
ViChar _VI_FAR cResult[5000] = {0};
ViReal32 dTraceArray[401] = {0};
char cBufferInfo[6]= {0};
long lNumberBytes =0L;
long lOpc =0L;
unsigned long lRetCount = 0L;
int iSize = 0;
/*BytesPerPoint is 4 for Real32 or Int32 formats, 8 for Real64, and 2 for Uint16*/
int iBytesPerPnt = 4;
int iSwpPnts = 401;
int iDataBytes=1604;
int iHeaderBytes=6;
FILE *fTraceFile;
/* Open a GPIB session at address 18*/
viStatus=viOpenDefaultRM(&defaultRM);
viStatus=viOpen(defaultRM,"GPIB0::18",VI_NULL,VI_NULL,&viESA);
if(viStatus)
{
printf("Could not open a session to GPIB device at address 18!\n");
exit(0);
}
/*Clear the instrument */
viClear(viESA);
/*Reset the instrument. This will set number of sweep points to default of 401*/
viPrintf(viESA,"*RST\n");
/*Display the program heading */
printf("\n\t\t Read in Trace Data using 32-bit Real Format (using GPIB) \n\n" );
/* Set the input port to the 50MHz amplitude reference*/
Route50MHzSignal();
/*Query number of sweep points per trace (firmware revision A.04.00 and later)*/
/*For firmware revisions prior to A.04.00, the number of sweep points is 401*/
iSwpPnts=401;
viQueryf(viESA,"SENSE:SWEEP:POINTS?\n","%d",&iSwpPnts);
/*Calculate number of bytes in the header. The header consists of the "#" sign*/
/*followed by a digit representing the number of digits to follow. The digits */
220
Chapter 17
ESA Programming Examples
Using C to Read Trace Data in a 32-Bit Real Format (over GPIB)
/*which follow represent the number of sweep points multiplied by the number */
/*of bytes per point. */
iHeaderBytes = 3;
/*iDataBytes >3, plus increment for "#" and "n"*/
iDataBytes = (iSwpPnts*iBytesPerPnt);
lNumberBytes = iDataBytes;
while ((iDataBytes = (iDataBytes / 10 )) > 0 )
{
iHeaderBytes++;
}
ESA Programming Examples
/*Set analyzer to single sweep mode */
viPrintf(viESA,"INIT:CONT 0 \n");
/*Set the analyzer to 50MHz-center frequency */
viPrintf(viESA,"SENS:FREQ:CENT 50 MHZ\n");
/*Set the analyzer to 50MHz Span */
viPrintf(viESA,"SENS:FREQ:SPAN 50 MHZ\n");
/* Specify dB per division of each vertical division and
viPrintf(viESA,"DISP:WIND:TRAC:Y:SCAL:PDIV 10dB\n");
viPrintf(viESA,"UNIT:POW DBM\n");
Units */
/*Set analyzer trace data format to 32-bit Real */
viPrintf(viESA,"FORM:DATA REAL,32 \n");
/*Set the binary byte order to SWAP */
viPrintf(viESA, "FORM:BORD SWAP\n");
/*Trigger a sweep and wait for sweep to complete*/
viPrintf(viESA,"INIT:IMM;*WAI\n");
/*Calculate size of trace record. This will be sum of HeaderBytes, NumberBytes*/
/*(the actual data bytes) and the "/n" terminator*/
iSize = lNumberBytes +iHeaderBytes+1;
/*Get trace header data and trace data */
viPrintf(viESA,"TRAC:DATA? TRACE1\n");
viRead (viESA,(ViBuf)cResult,iSize,&lRetCount);
/*Extract the trace data*/
memcpy(dTraceArray,cResult+iHeaderBytes,(size_t)lNumberBytes);
/*Save trace data to an ASCII file*/
fTraceFile=fopen("C:\\temp\\ReadTrace32Gpib.txt","w");
fprintf(fTraceFile,"ReadTrace32Gpib.exe Output\nAgilent Technologies 2000\n\n");
Chapter 17
221
ESA Programming Examples
Using C to Read Trace Data in a 32-Bit Real Format (over GPIB)
ESA Programming Examples
fprintf(fTraceFile,"The %d trace data points of the
spectrum:\n\n",(lNumberBytes/4));
for ( long i=0;i<lNumberBytes/4;i++)
fprintf(fTraceFile,"\tAmplitude of point[%d] = %.2lf
dBm\n",i+1,dTraceArray[i]);
fclose(fTraceFile);
/*Close the session*/
viClose(viESA);
viClose(defaultRM);
}
222
Chapter 17
ESA Programming Examples
Using C to Read Trace Data in an ASCII Format (over RS-232)
Using C to Read Trace Data in an ASCII Format (over
RS-232)
This C programming example (ascrs232.c) can be found on the Documentation
CD.
/************************************************************/
Reading Trace Data using ASCII Format (RS-232)
This example is for the E44xxB ESA Spectrum Analyzers
and E740xA EMC Analyzers.
This C programming example does the following.
The SCPI instrument commands used are given as
reference.
- Opens an RS-232 session at COM1/COM2
- Clears the Analyzer
- Resets the Analyzer
*RST
- Set the input port to the 50 MHz amplitude reference
CAL:SOUR:STAT ON
- Query for the number of sweep points (for firmware
revisions A.04.00 and later). Default is 401.
SENS:SWE:POIN?
- Set the analyzer to single sweep mode
INIT:CONT 0
- Sets the analyzer center frequency and span to 50 MHz
SENS:FREQ:CENT 50 MHZ
SENS:FREQ:SPAN 50 MHZ
- Trigger a sweep
INIT:IMM
- Check for operation complete
*OPC?
- Specify dBm Unit
UNIT:POW DBM
- Set the analyzer trace data ASCII
FORM:DATA: ASC
- Trigger a sweep
INIT:IMM
- Check for operation complete
*OPC?
- Query the trace data
TRAC:DATA? TRACE1
Chapter 17
*/
*/
*/
*/
*/
*/
*/
*/
*/
*/
*/
*/
*/
*/
*/
*/
*/
*/
*/
*/
*/
*/
*/
*/
*/
*/
*/
*/
*/
*/
*/
*/
*/
*/
*/
*/
*/
ESA Programming Examples
/*
/*
/*
/*
/*
/*
/*
/*
/*
/*
/*
/*
/*
/*
/*
/*
/*
/*
/*
/*
/*
/*
/*
/*
/*
/*
/*
/*
/*
/*
/*
/*
/*
/*
/*
/*
/*
223
ESA Programming Examples
Using C to Read Trace Data in an ASCII Format (over RS-232)
ESA Programming Examples
/* - Remove the "," from the ACSII data
*/
/* - Save the trace data to an ASCII file
*/
/* - Close the session
*/
/************************************************************/
#include
#include
#include
#include
#include
#include
#include
<stdio.h>
<stdlib.h>
<math.h>
<conio.h>
<ctype.h>
<string.h>
"visa.h"
#define
#define
#define
hpESA_IDN_E4401B
hpESA_IDN_E4411B
hpEMC_IDN_E7401A
"Hewlett-Packard, E4401B"
"Hewlett-Packard, E4411B"
"Hewlett-Packard, E7401A"
ViSession defaultRM, viESA;
ViStatus errStatus;
ViChar
cIdBuff[256] ={0};
char cEnter ={0};
int
iResult =0;
/*Set the input port to 50MHz amplitude reference*/
void Route50MHzSignal()
{
viQueryf(viESA, "*IDN?\n", "%t", &cIdBuff);
iResult = (strncmp( cIdBuff, hpESA_IDN_E4401B, strlen(hpESA_IDN_E4401B)) &&
strncmp( cIdBuff, hpESA_IDN_E4411B, strlen(hpESA_IDN_E4411B)) && strncmp( cIdBuff,
hpEMC_IDN_E7401A, strlen(hpEMC_IDN_E7401A)));
if( iResult == 0 )
{
/*Set the input port to the 50MHz amplitude reference for the models*/
/*E4411B and E4401B*/
viPrintf(viESA,"CAL:SOUR:STAT ON \n");
}
else
{
/* For the analyzers having frequency limits >= 3GHz, prompt the user to/*
/* connect the amplitude reference output to the input*/
printf ("Connect AMPTD REF OUT to the INPUT \n");
printf ("......Press Return to continue \n");
scanf( "%c",&cEnter);
/*Externally route the 50MHz Signal*/
viPrintf(viESA,"CAL:SOUR:STAT ON \n");
224
Chapter 17
ESA Programming Examples
Using C to Read Trace Data in an ASCII Format (over RS-232)
}
}
ESA Programming Examples
void main()
{
/*Program Variable*/
ViStatus viStatus = 0;
/*Dimension cResult to 13 bytes per sweep point, 8192 sweep points maximum*/
ViChar _VI_FAR cResult[106496] = {0};
FILE *fTraceFile;
static ViChar *cToken;
int iNum =0;
int iSwpPnts = 401;
long lCount=0L;
long lOpc=0L;
/*iNum set to 13 times number of sweep points, 8192 sweep points maximum*/
iNum =106496;
lCount =0;
/* Open a serial session at COM1 */
viStatus=viOpenDefaultRM(&defaultRM);
if (viStatus =viOpen(defaultRM,"ASRL1::INSTR",VI_NULL,VI_NULL,&viESA) !=
VI_SUCCESS)
{
printf("Could not open a session to ASRL device at COM1!\n");
exit(0);
}
/* Clear the instrument */
viClear(viESA);
/*Reset the instrument. This will set number of sweep points to default of 401*/
viPrintf(viESA,"*RST\n");
/*Display the program heading */
printf("\n\t\tRead in Trace Data using ASCII Format (RS232) Program \n\n" );
/* Check for the instrument model number and route the 50MHz signal accordingly*/
Route50MHzSignal();
/*Query number of sweep points per trace (firmware revision A.04.00 and later)*/
/*For firmware revisions prior to A.04.00, the number of sweep points is 401 */
iSwpPnts = 401;
viQueryf(viESA, "SENSE:SWEEP:POINTS?\n","%d",&iSwpPnts);
/*Set the analyzer center frequency to 50MHz */
Chapter 17
225
ESA Programming Examples
Using C to Read Trace Data in an ASCII Format (over RS-232)
viPrintf(viESA,"SENS:FREQ:CENT 50 MHz\n");
/*Set the analyzer to 50MHz Span*/
viPrintf(viESA,"SENS:FREQ:SPAN 50 MHz\n");
/*set the analyzer to single sweep mode*/
viPrintf(viESA,"INIT:CONT 0 \n");
ESA Programming Examples
/*Trigger a spectrum measurement*/
viPrintf(viESA,"INIT:IMM \n");
/*Read the operation complete query*/
viQueryf(viESA, "*OPC?\n", "%d", &lOpc);
if (!lOpc)
{
printf("Program Abort! error ocurred: last command was not completed!\n");
exit(0);
}
/*Specify units in dBm*/
viPrintf(viESA,"UNIT:POW DBM \n");
/*Set analyzer trace data format to ASCII Format*/
viPrintf(viESA,"FORM:DATA ASC \n");
/*Trigger a spectrum measurement*/
viPrintf(viESA,"INIT:IMM \n");
/*Read the operation complete query */
viQueryf(viESA, "*OPC?\n", "%d", &lOpc);
if (!lOpc)
{
printf("Program Abort! error ocurred: last command was not completed!\n");
exit(0);
}
/*Query the Trace Data using ASCII Format */
viQueryf(viESA,"%s\n", "%#t","TRAC:DATA? TRACE1" , &iNum , cResult);
/*Remove the "," from the ASCII trace data for analyzing data*/
cToken = strtok(cResult,",");
/*Save trace data to an ASCII to a file, by removing the "," token*/
fTraceFile=fopen("C:\\temp\\ReadAscRS232.txt","w");
fprintf(fTraceFile,"ReadAscRS232.exe Output\nHewlett-Packard 1999\n\n");
fprintf(fTraceFile,"\tAmplitude of point[%d] = %s dBm\n",lCount+1,cToken);
while (cToken != NULL)
{
226
Chapter 17
ESA Programming Examples
Using C to Read Trace Data in an ASCII Format (over RS-232)
lCount++;
cToken =strtok(NULL,",");
if (lCount != iSwpPnts)
fprintf(fTraceFile,"\tAmplitude of point[%d] = %s
dBm\n",lCount+1,cToken);
}
fprintf(fTraceFile,"\nThe Total trace data points of the spectrum are :[%d]
\n\n",lCount);
fclose(fTraceFile);
Chapter 17
ESA Programming Examples
/*Close the session*/
viClose(viESA);
viClose(defaultRM);
}
227
ESA Programming Examples
Using C to Read Trace Data in a 32-bit Real Format (over RS-232)
Using C to Read Trace Data in a 32-bit Real Format
(over RS-232)
This C programming example (32brs232.c) can be found on the Documentation
CD.
ESA Programming Examples
/************************************************************/
/*
/*
/*
/*
/*
/*
/*
/*
/*
/*
/*
/*
/*
/*
/*
/*
/*
/*
/*
/*
/*
/*
/*
/*
/*
/*
/*
/*
/*
/*
/*
/*
/*
/*
/*
/*
/*
Reading Trace Data using 32-bit Real Format (RS-232)
This example is for the E44xxB ESA Spectrum Analyzers
and E740xA EMC Analyzers.
This C programming example does the following.
The SCPI instrument commands used are given as
reference.
- Opens an RS-232 session at COM1/COM2
- Clears the Analyzer
- Resets the Analyzer
*RST
- Set the input port to the 50 MHz amplitude reference
CAL:SOUR:STAT ON
- Query for the number of sweep points (for firmware
revision A.04.00 and later). Default is 401.
SENS:SWE:POIN?
- Calculate the number of bytes in the header
- Set the analyzer to single sweep mode
INIT:CONT 0
- Sets the analyzer center frequency and span to 50 MHz
SENS:FREQ:CENT 50 MHZ
SENS:FREQ:SPAN 50 MHZ
- Specify 10 dB per division for the amplitude scale in
and dBm Units
DISP:WIND:TRAC:Y:SCAL:PDIV 10 dB
UNIT:POW DBM
- Set the analyzer trace data to 32-bit Real
FORM:DATA: REAL,32
- Set the binary order to swap
FORM:BORD SWAP
- Trigger a sweep
INIT:IMM
- Check for operation complete
*OPC?
- Calculate the number of bytes in the trace record
228
*/
*/
*/
*/
*/
*/
*/
*/
*/
*/
*/
*/
*/
*/
*/
*/
*/
*/
*/
*/
*/
*/
*/
*/
*/
*/
*/
*/
*/
*/
*/
*/
*/
*/
*/
*/
*/
Chapter 17
ESA Programming Examples
Using C to Read Trace Data in a 32-bit Real Format (over RS-232)
#include
#include
#include
#include
#include
#include
#include
ESA Programming Examples
/* - Set VISA timeout to 60 seconds, to allow for slower
*/
/*
transfer times caused by higher number of sweep points */
/*
at low baud rates.
*/
/* - Set VISA to terminate read after buffer is empty
*/
/* - Query the trace data
*/
/*
TRAC:DATA? TRACE1
*/
/* - Reset VISA timeout to 3 seconds
*/
/* - Remove the "," from the ACSII data
*/
/* - Save the trace data to an ASCII file
*/
/* - Close the session
*/
/************************************************************/
<stdio.h>
<stdlib.h>
<math.h>
<conio.h>
<ctype.h>
<string.h>
"visa.h"
#define hpESA_IDN_E4401B "Hewlett-Packard, E4401B"
#define hpESA_IDN_E4411B "Hewlett-Packard, E4411B"
#definehpEMC_IDN_E7401A "Hewlett-Packard, E7401A"
ViSession defaultRM, viESA;
ViStatus errStatus;
ViChar
cIdBuff[256]= {0};
char
cEnter = 0;
int
iResult = 0;
/*Set the input port to 50MHz amplitude reference*/
void Route50MHzSignal()
{
viQueryf(viESA, "*IDN?\n", "%t", &cIdBuff);
iResult = (strncmp( cIdBuff, hpESA_IDN_E4401B, strlen(hpESA_IDN_E4401B)) &&
strncmp( cIdBuff, hpESA_IDN_E4411B, strlen(hpESA_IDN_E4411B)) && strncmp( cIdBuff,
hpEMC_IDN_E7401A, strlen(hpEMC_IDN_E7401A)));
if( iResult == 0 )
{
/*Set the input port to the 50MHz amplitude reference for the models*/
/*E4411B and E4401B*/
viPrintf(viESA,"CAL:SOUR:STAT ON \n");
}
else
{
Chapter 17
229
ESA Programming Examples
Using C to Read Trace Data in a 32-bit Real Format (over RS-232)
/* For the analyzers having frequency limits >= 3GHz, prompt the user to*/
/* connect the amplitude reference output to the input*/
printf ("Connect AMPTD REF OUT to the INPUT \n");
printf ("......Press Return to continue \n");
scanf( "%c",&cEnter);
/*Externally route the 50MHz Signal*/
viPrintf(viESA,"CAL:SOUR:STAT ON \n");
ESA Programming Examples
}
}
void main()
{
/*Program Variables*/
ViStatus viStatus= 0;
ViChar _VI_FAR cResult[1024000] = {0};
ViReal32 dTraceArray[1024] = {0};
char cBufferInfo[7]= {0};
long lNumberBytes =0L;
long lOpc =0L;
unsigned long lRetCount = 0L;
int iSize = 0;
/*BytesPerPnt is 4 for Real32 or Int32 formats, 8 for Real64, and 2 for Uint16*/
int iBytesPerPnt = 4;
int iSwpPnts = 401;
/*Number of points per sweep*/
int iDataBytes = 1604;/*Number of data points, assuming 4 bytes per point*/
int iHeaderBytes = 6; /*Number of bytes in the header, assuming 1604 data bytes*/
FILE *fTraceFile;
/* Open a serial session at COM1 */
viStatus=viOpenDefaultRM(&defaultRM);
if (viStatus =viOpen(defaultRM,"ASRL1::INSTR",VI_NULL,VI_NULL,&viESA) !=
VI_SUCCESS)
{
printf("Could not open a session to ASRL device at COM1!!\n");
exit(0);
}
/*Clear the instrument */
viClear(viESA);
/*Reset the instrument. This will set number of sweep points to default of 401*/
viPrintf(viESA,"*RST\n");
/*Display the program heading */
printf("\n\t\t Read in Trace Data using ASCII Format (using RS-232) Program \n\n"
);
230
Chapter 17
ESA Programming Examples
Using C to Read Trace Data in a 32-bit Real Format (over RS-232)
/* Set the input port to the internal 50MHz reference source */
Route50MHzSignal();
/*Query number of sweep points per trace (firmware revision A.04.00 or later)*/
/*For firmware revisions prior to A.04.00, the number of sweep points is 401 */
iSwpPnts = 401;
viQueryf(viESA,"SENSE:SWEEP:POINTS?\n","%d",&iSwpPnts);
/*Set analyzer to single sweep mode */
viPrintf(viESA,"INIT:CONT 0 \n");
/* Set the analyzer to 50MHz-center frequency */
viPrintf(viESA,"SENS:FREQ:CENT 50 MHZ\n");
/*Set the analyzer to 50MHz Span */
viPrintf(viESA,"SENS:FREQ:SPAN 50 MHZ\n");
/* Specify dB per division of each vertical division & Units */
viPrintf(viESA,"DISP:WIND:TRAC:Y:SCAL:PDIV 10dB\n");
viPrintf(viESA,"UNIT:POW DBM\n");
/*Set analyzer trace data format to 32-bit Real */
viPrintf(viESA,"FORM:DATA REAL,32\n");
/*Set the binary byte order to SWAP */
viPrintf(viESA, "FORM:BORD SWAP\n");
/*Trigger a sweep */
viPrintf(viESA,"INIT:IMM\n");
/*Read the operation complete query */
viQueryf(viESA, "*OPC?\n", "%d", &lOpc);
if (!lOpc)
Chapter 17
231
ESA Programming Examples
/*Calculate number of bytes in the header. The header consists of the "#" sign*/
/*followed by a digit representing the number of digits to follow. The digits */
/*which follow represent the number of sweep points multiplied by the number */
/*of bytes per point. */
iHeaderBytes = 3;
/*iDataBytes >0, plus increment for "#" and "n" */
iDataBytes = (iSwpPnts*iBytesPerPnt);
lNumberBytes = iDataBytes;
while ((iDataBytes = (iDataBytes / 10 )) > 0 )
{
iHeaderBytes++;
}
ESA Programming Examples
Using C to Read Trace Data in a 32-bit Real Format (over RS-232)
{
printf("Program Abort! error ocurred: last command was not completed!\n");
exit(0);
}
/*Calculate size of trace record. This will be the sum of HeaderBytes, Number*/
/*Bytes (the actual data bytes) and the "\n" terminator*/
iSize = lNumberBytes + iHeaderBytes + 1;
ESA Programming Examples
/*Increase timeout to 60 sec*/
viSetAttribute(viESA,VI_ATTR_TMO_VALUE,60000);
/*Set RS-232 interface to terminate when the buffer is empty*/
viSetAttribute(viESA,VI_ATTR_ASRL_END_IN,VI_ASRL_END_NONE);
/*Get trace header data and trace data*/
viPrintf(viESA,"TRAC:DATA? TRACE1\n");
viRead (viESA,(ViBuf)cResult,iSize,&lRetCount);
/*Reset timeout to 3 sec*/
viSetAttribute(viESA,VI_ATTR_TMO_VALUE,3000);
/*Extract the trace data*/
memcpy(dTraceArray,cResult+iHeaderBytes,(size_t)lNumberBytes);
/*Save trace data to an ASCII file*/
fTraceFile=fopen("C:\\temp\\ReadTrace32Rs232.txt","w");
fprintf(fTraceFile,"ReadTrace32Rs232.exe Output\nHewlett-Packard 1999\n\n");
fprintf(fTraceFile,"The %d trace data points of the
spectrum:\n\n",(lNumberBytes/4));
for ( long i=0;i<lNumberBytes/iBytesPerPnt;i++)
fprintf(fTraceFile,"\tAmplitude of point[%d] = %.2lf
dBm\n",i+1,dTraceArray[i]);
fclose(fTraceFile);
/*Close the session*/
viClose(viESA);
viClose(defaultRM);
}
232
Chapter 17
ESA Programming Examples
Using C to Add Limit Lines
Using C to Add Limit Lines
This C programming example (limlines.c) can be found on the Documentation CD.
/************************************************************/
Using Limit Lines
*/
*/
This example is for the E44xxB ESA Spectrum Analyzers
*/
and E740xA EMC Analyzers.
*/
*/
This C programming example does the following.
*/
The SCPI instrument commands used are given as
*/
reference.
*/
*/
*/
- Open a GPIB session at address 18.
*/
- Clear the analyzer.
*/
*CLR
*/
- Reset the analyzer.
*/
*RST
*/
- Set Y-Axis Units to dBm
*/
UNIT:POW DBM
*/
- Define the upper limit line to have frequency/
*/
amplitude pairs.
*/
CALC:LLINE1:CONT:DOM FREQ
*/
CALC:LLINE1:TYPE UPP
*/
CALC:LLINE1:DISP ON
*/
CALC:LLINE1:DATA freq1,amp1,1,freq2,amp2,1...
*/
- Define the lower limit line to have frequency/amplitude*/
pairs.
*/
CALC:LLINE2:CONT:DOM FREQ
*/
CALC:LLINE2:TYPE LOW
*/
CALC:LLINE2:DISP ON
*/
CALC:LLINE2:DATA freq1,amp1,1,freq2,amp2,1...
*/
- Turn the limit line test function on.
*/
CALC:LLINE2:STAT ON
*/
- Set the analyzer to a center frequency of 50 MHz, span */
to 20 MHz, and resolution bandwidth to 1 MHz.
*/
SENS:FREQ:SPAN 20 MHZ
*/
SENS:FREQ:CENT 50 MHZ
*/
SENS:BWID:RES 1 MHZ
*/
- Turn the limit line test function on.
*/
- Set the analyzer reference level to 0 dBm.
*/
DISP:WIND:TRAC:Y:SCAL:RLEV 0
*/
Chapter 17
ESA Programming Examples
/*
/*
/*
/*
/*
/*
/*
/*
/*
/*
/*
/*
/*
/*
/*
/*
/*
/*
/*
/*
/*
/*
/*
/*
/*
/*
/*
/*
/*
/*
/*
/*
/*
/*
/*
/*
/*
/*
/*
233
ESA Programming Examples
ESA Programming Examples
Using C to Add Limit Lines
/* - Set the input port to the 50 MHz amplitude reference. */
/*
CAL:SOUR:STAT ON
*/
/* - Check to see if limit line passes or fails. It should */
/*
pass.
*/
/*
CALC:LLINE:FAIL?
*/
/* - Pause for 5 seconds.
*/
/* - Deactivate the 50 MHz alignment signal.
*/
/*
CAL:SOUR:STAT OFF
*/
/* - The limit line test should fail.
*/
/* - Close the session.
*/
/************************************************************/
#include
#include
#include
#include
#include
#include
#include
#include
#define
<stdio.h>
<stdlib.h>
<math.h>
<conio.h>
<ctype.h>
<string.h>
<windows.h>
"visa.h"
YIELD Sleep(5000)
#define hpESA_IDN_E4401B "Hewlett-Packard, E4401B"
#define hpESA_IDN_E4411B "Hewlett-Packard, E4411B"
#define hpEMC_IDN_E7401A "Hewlett-Packard, E7401A"
ViSession defaultRM, viESA;
ViStatus errStatus;
ViChar
cIdBuff[256]= {0};
char
cEnter = 0;
int
iResult = 0;
long
lLimitTest =0L;
/*Set the input port to 50MHz amplitude reference*/
void Route50MHzSignal()
{
viQueryf(viESA, "*IDN?\n", "%t", &cIdBuff);
iResult = (strncmp( cIdBuff, hpESA_IDN_E4401B, strlen(hpESA_IDN_E4401B)) &&
strncmp( cIdBuff, hpESA_IDN_E4411B, strlen(hpESA_IDN_E4411B)) && strncmp( cIdBuff,
hpEMC_IDN_E7401A, strlen(hpEMC_IDN_E7401A)));
if( iResult == 0 )
{
/*Set the input port to the 50MHz amplitude reference for the models*/
/*E4401B, E4411B, and E7401A*/
viPrintf(viESA,"CAL:SOUR:STAT ON \n");
}
234
Chapter 17
ESA Programming Examples
Using C to Add Limit Lines
else
{
/* For the analyzers having frequency limits >= 3GHz, prompt the user*/
/* to connect the amplitude reference output to the input*/
printf ("Connect AMPTD REF OUT to the INPUT \n");
printf ("......Press Return to continue \n");
scanf( "%c",&cEnter);
/*Externally route the 50MHz Signal*/
viPrintf(viESA,"CAL:SOUR:STAT ON \n");
ESA Programming Examples
}
}
void printResult()
{
viQueryf(viESA, "CALC:CLIM:FAIL?\n", "%ld", &lLimitTest);
if (lLimitTest!=0)
{
printf ("\n\t..Limit Line Failed.....\n");
viQueryf(viESA, "CALC:LLINE1:FAIL?\n", "%ld", &lLimitTest);
if (lLimitTest==0)
printf ("\n\t......Limit Line1 Passed \n");
else printf ("\n\t......Limit Line1 Failed \n");
viQueryf(viESA, "CALC:LLINE2:FAIL?\n", "%ld", &lLimitTest);
if (lLimitTest==0)
printf ("\n\t......Limit Line2 Passed \n");
else printf ("\n\t......Limit Line2 Failed \n");
}
else
printf ("\n\t..Limit Test Pass\n");
}
void main()
{
/*Program Variable*/
ViStatus viStatus = 0;
long
lOpc =0L;
/* Open a GPIB session at address 18*/
viStatus=viOpenDefaultRM(&defaultRM);
viStatus=viOpen(defaultRM,"GPIB0::18",VI_NULL,VI_NULL,&viESA);
if(viStatus)
{
printf("Could not open a session to GPIB device at address 18!\n");
Chapter 17
235
ESA Programming Examples
Using C to Add Limit Lines
exit(0);
}
/*Clear the instrument*/
viClear(viESA);
/*Reset the instrument*/
viPrintf(viESA,"*RST\n");
ESA Programming Examples
/* Check for the instrument model number and route the 50MHz signal accordingly*/
/*Route50MHzSignal();
/*Display the program heading */
printf("\n\t\t Limit Lines Program \n\n" );
/*Set the Y-Axis Units to dBm */
viPrintf(viESA, "UNIT:POW DBM\n");
/*Set to Frequency Domain Mode*/
viPrintf(viESA,"CALC:LLINE1:CONT:DOM FREQ\n");
/*Delete any current limit line and define the upper limit line
to have the following frequency/amplitude pairs*/
viPrintf(viESA,"CALC:LLINE1:TYPE UPP\n");
/* Turn on display*/
viPrintf(viESA,"CALC:LLINE1:DISP ON\n");
/*Send the upper limit line data*/
viPrintf(viESA,"CALC:LLINE1:DATA 40E06,-50,1, 45E06,-20,1, 50E06,-15,1,
55E06,-20,1, 60E06,-50,1\n");
/* Turn on display*/
viPrintf(viESA,"CALC:LLINE1:DISP ON\n");
/*Delete any current limit line and define the lower limit line
to have the following frequency/amplitude pairs*/
viPrintf(viESA,"CALC:LLINE2:TYPE LOW\n");
/*Send the lower limit line data*/
viPrintf(viESA,"CALC:LLINE2:DATA
40E06,-100,1,49.99E06,-100,1,50E06,-30,1,50.01E06,-100,1,60E06,-100,1\n");
/* Turn on display*/
viPrintf(viESA,"CALC:LLINE2:DISP ON\n");
/*Turn the limit line test function on.*/
236
Chapter 17
ESA Programming Examples
Using C to Add Limit Lines
viPrintf(viESA,"CALC:LLINE2:STAT ON\n");
/*Set the analyzer to a center frequency of 50 MHz, span to 20 MHz,
and resolution bandwidth to 1 MHz.*/
viPrintf(viESA,"SENS:FREQ:CENT 50e6\n");
viPrintf(viESA,"SENS:FREQ:SPAN 20e6\n");
viPrintf(viESA,"SENS:BWID:RES 1e6\n");
/*Set the analyzer reference level to 0 dBm*/
viPrintf(viESA,"DISP:WIND:TRAC:Y:SCAL:RLEV 0 \n");
/*Trigger a spectrum measurement*/
viPrintf(viESA,"INIT:IMM \n");
/*Check for operation complete */
viQueryf(viESA, "*OPC?\n", "%d", &lOpc);
if (!lOpc)
{
printf("Program Abort! error ocurred: last command was not completed!\n");
exit(0);
}
/*Check to see if limit line passes or fails. It should pass.*/
printf ("\n\t Limit Line status after activating the 50MHz signal \n");
/*Print the limits line result*/
printResult();
/*Pause for 5 seconds*/
YIELD;
/*Deactivate the 50 MHz alignment signal.*/
viPrintf(viESA,"CAL:SOUR:STAT OFF\n");
/*Trigger a spectrum measurement*/
viPrintf(viESA,"INIT:IMM \n");
/*Check for operation complete */
viQueryf(viESA, "*OPC?\n", "%d", &lOpc);
if (!lOpc)
{
printf("Program Abort! error ocurred: last command was not completed!\n");
exit(0);
}
Chapter 17
237
ESA Programming Examples
/* Check for the instrument model number and route the 50MHz-signal accordingly*/
Route50MHzSignal();
ESA Programming Examples
Using C to Add Limit Lines
/* The limit line test should fail.*/
printf ("\n\t Limit Line status after de-activating the 50MHz signal \n");
/*Print the limits line result*/
printResult();
/*Close the session*/
viClose(viESA);
viClose(defaultRM);
ESA Programming Examples
}
238
Chapter 17
ESA Programming Examples
Using C to Measure Noise
Using C to Measure Noise
This C programming example (noise.c) can be found on the Documentation CD.
/************************************************************/
Chapter 17
ESA Programming Examples
/* Measuring Noise
*/
/*
*/
/* This example is for the E44xxB ESA Spectrum Analyzers
*/
/* and E740xA EMC Analyzers.
*/
/*
*/
/* This C programming example does the following.
*/
/* The SCPI instrument commands used are given as
*/
/* reference.
*/
/*
*/
/* - Opens a GPIB session at address 18
*/
/* - Clears the Analyzer
*/
/* - Resets the Analyzer
*/
/*
*RST
*/
/* - Sets the center frequency and span
*/
/*
SENS:FREQ:CENT 50 MHZ
*/
/*
SENS:FREQ:SPAN 10 MHZ
*/
/* - Set the input port to the 50 MHz amplitude reference
*/
/*
CAL:SOUR:STAT ON
*/
/* - Set the analyzer to single sweep mode
*/
/*
INIT:CONT 0
*/
/* - Trigger a sweep and wait for sweep completion
*/
/*
INIT:IMM;*WAI
*/
/* - Set the marker to the maximum peak
*/
/*
CALC:MARK:MAX
*/
/* - Set the analyzer to active delta marker
*/
/*
CALC:MARK:MODE DELT
*/
/* - Set the delta marker to 2 MHZ
*/
/*
CALC:MARK:X 2E+6
*/
/* - Activate the noise marker function
*/
/*
CALC:MARK:FUNC NOIS
*/
/* - Trigger a sweep and wait for sweep completion
*/
/*
INIT:IMM;*WAI
*/
/* - Query the marker delta amplitude from the analyzer
*/
/*
CALC:MARK:Y?
*/
/* - Report the marker delta amplitude as the carrier to
*/
/*
noise ratio in dBc/Hz
*/
/* - Close the session
*/
/************************************************************/
239
ESA Programming Examples
Using C to Measure Noise
ESA Programming Examples
#include
#include
#include
#include
#include
#include
#include
<stdio.h>
<stdlib.h>
<math.h>
<conio.h>
<ctype.h>
<string.h>
"visa.h"
#define hpESA_IDN_E4401B "Hewlett-Packard, E4401B"
#define hpESA_IDN_E4411B "Hewlett-Packard, E4411B"
#definehpEMC_IDN_E7401A "Hewlett-Packard, E7401A"
ViSession defaultRM, viESA;
ViStatus errStatus;
ViChar
cIdBuff[256]= {0};
char
cEnter = 0;
int
iResult = 0;
long
lOpc =0L;
/*Set the input port to 50MHz amplitude reference*/
void Route50MHzSignal()
{
viQueryf(viESA, "*IDN?\n", "%t", &cIdBuff);
iResult = (strncmp( cIdBuff, hpESA_IDN_E4401B, strlen(hpESA_IDN_E4401B)) &&
strncmp( cIdBuff, hpESA_IDN_E4411B, strlen(hpESA_IDN_E4411B)) && strncmp( cIdBuff,
hpEMC_IDN_E7401A, strlen(hpEMC_IDN_E7401A)));
if( iResult == 0 )
{
/*Set the input port to the 50MHz amplitude reference for the models*/
/*E4401B, E4411B amd E7401A*/
viPrintf(viESA,"CAL:SOUR:STAT ON \n");
}
else
{
/* For the analyzers having frequency limits >= 3GHz, prompt the user*/
/* to connect the amplitude reference output to the input*/
printf ("Connect AMPTD REF OUT to the INPUT \n");
printf ("......Press Return to continue \n");
scanf( "%c",&cEnter);
/*Externally route the 50MHz Signal*/
viPrintf(viESA,"CAL:SOUR:STAT ON \n");
}
}
240
Chapter 17
ESA Programming Examples
Using C to Measure Noise
void main()
{
/*Program Variables*/
ViStatus viStatus = 0;
double dMarkAmp =0.0;
long lOpc=0L;
ESA Programming Examples
/*Open a GPIB session at address 18*/
viStatus=viOpenDefaultRM(&defaultRM);
viStatus=viOpen(defaultRM,"GPIB0::18",VI_NULL,VI_NULL,&viESA);
if(viStatus)
{
printf("Could not open a session to GPIB device at address 18!\n");
exit(0);
}
/*Clear the Instrument*/
viClear(viESA);
/*Reset the Instrument*/
viPrintf(viESA,"*RST\n");
/*Display the program heading */
printf("\n\t\t Noise Program \n\n" );
/* Check for the instrument model number and route the 50MHz signal accordingly*/
Route50MHzSignal();
/*Set the analyzer center frequency to 50MHz*/
viPrintf(viESA,"SENS:FREQ:CENT 50e6\n");
/*Set the analyzer span to 10MHz*/
viPrintf(viESA,"SENS:FREQ:SPAN 10e6\n");
/*Set the analyzer in a single sweep mode*/
viPrintf(viESA,"INIT:CONT 0 \n");
/*Trigger a sweep and wait for sweep completion*/
viPrintf(viESA,"INIT:IMM;*WAI \n");
/*Set the marker to the maximum peak*/
viPrintf(viESA,"CALC:MARK:MAX \n");
/*Check for operation complete*/
viQueryf(viESA, "*OPC?\n", "%d", &lOpc);
if (!lOpc)
{
Chapter 17
241
ESA Programming Examples
Using C to Measure Noise
printf("Program Abort! error ocurred: last command was not completed!\n");
exit(0);
}
/*Set the analyzer in a single sweep mode*/
viPrintf(viESA,"INIT:CONT 0 \n");
ESA Programming Examples
/*Trigger a spectrum measurement*/
viPrintf(viESA,"INIT:IMM \n");
/*Set the analyzer in active delta marker mode*/
viPrintf(viESA,"CALC:MARK:MODE DELT \n");
/*Set the marker delta frequency to 2 MHz. This places the
active marker two divisions to the right of the input signal.*/
viPrintf(viESA,"CALC:MARK:X 2E+6 \n");
/*Activate the noise marker function.*/
viPrintf(viESA,"CALC:MARK:FUNC NOIS \n");
/*Trigger a sweep and wait for sweep completion*/
viPrintf(viESA,"INIT:IMM;*WAI \n");
/*Query and read the marker delta amplitude from the analyzer*/
viQueryf(viESA,"CALC:MARK:Y? \n","%lf",&dMarkAmp);
/*Report the marker delta amplitude as the carrier-to-noise ratio in dBc/Hz*/
printf("\t Marker Amplitude = %lf dBc/Hz\n",dMarkAmp);
/*Close the session*/
viClose(viESA);
viClose(defaultRM);
}
242
Chapter 17
ESA Programming Examples
Using C to Enter Amplitude Correction Data
Using C to Enter Amplitude Correction Data
This C programming example (amplcorr.c) can be found on the Documentation
CD.
/************************************************************/
#include
#include
#include
#include
#include
#include
#include
ESA Programming Examples
/* Entering Amplitude Correction Data
*/
/*
*/
/* This example is for the E44xxB ESA Spectrum Analyzers
*/
/* and E740xA EMC Analyzers.
*/
/*
*/
/* This C programming example does the following.
*/
/* The SCPI instrument commands used are given as
*/
/* reference.
*/
/*
*/
/* - Opens a GPIB session at address 18
*/
/* - Clears the Analyzer
*/
/* - Resets the Analyzer
*/
/*
*RST
*/
/* - Sets the stop frequency to 1.5 GHz
*/
/*
SENS:FREQ:STOP 1.5 GHZ
*/
/* - Set the input port to the 50 MHz amplitude reference
*/
/*
CAL:SOUR:STAT ON
*/
/* - Enter amplitude correction frequency/amplitude pairs: */
/*
0 Hz/ 0 dB, 100 MHz/5 dB, 1 GHz/-5 dB, 1.5 GHz/ 10 dB */
/*
SENS:CORR:CSET1:DATA 0,0,100E6,5.0,1.0E9,-5.0,...
*/
/* - Activate amplitude correction
*/
/*
SENS:CORR:CSET1:DATA
*/
/*
SENS:CORR:CSET1:ALL:STAT ON
*/
/* - Query the analyzer for the amplitude corection factors */
/*
SENS:CORR:CSET1:DATA?
*/
/* - Store them in an array
*/
/* - Display the array
*/
/* - Close the session
*/
/************************************************************/
<stdio.h>
<stdlib.h>
<math.h>
<conio.h>
<ctype.h>
<string.h>
"visa.h"
Chapter 17
243
ESA Programming Examples
Using C to Enter Amplitude Correction Data
#define hpESA_IDN_E4401B
#define hpESA_IDN_E4411B
#define hpEMC_IDN_E7401A
"Hewlett-Packard, E4401B"
"Hewlett-Packard, E4411B"
"Hewlett-Packard, E7401A"
ESA Programming Examples
ViSession defaultRM, viESA;
ViStatus errStatus;
ViChar
cIdBuff[256]= {0};
char
cEnter = 0;
int
iResult = 0;
/*Set the input port to 50MHz amplitude reference*/
void Route50MHzSignal()
{
viQueryf(viESA, "*IDN?\n", "%t", &cIdBuff);
iResult = (strncmp( cIdBuff, hpESA_IDN_E4401B, strlen(hpESA_IDN_E4401B)) &&
strncmp( cIdBuff, hpESA_IDN_E4411B, strlen(hpESA_IDN_E4411B)) && strncmp( cIdBuff,
hpEMC_IDN_E7401A, strlen(hpEMC_IDN_E7401A)));
if( iResult == 0 )
{
/*Set the input port to the 50MHz amplitude reference for the models*/
/*E4401B, E4411B, and E7401A*/
viPrintf(viESA,"CAL:SOUR:STAT ON \n");
}
else
{
/* For the analyzers having frequency limits >= 3GHz, prompt the user*/
/* to connect the amplitude reference output to the input*/
printf ("Connect AMPTD REF OUT to the INPUT \n");
printf ("......Press Return to continue \n");
scanf( "%c",&cEnter);
/*Externally route the 50MHz Signal*/
viPrintf(viESA,"CAL:SOUR:STAT ON \n");
}
}
void main()
{
/*Program Variables*/
ViChar _VI_FAR cResult[1024] ={0};
ViReal64 _VI_FAR aRealArray[2][100] ={0};
ViStatus viStatus = 0;
int iNum =0;
int iNoOfPoints =0;
long lCount = 0;
244
Chapter 17
ESA Programming Examples
Using C to Enter Amplitude Correction Data
long lFreq=0L;
long lAmpltd=1;
static ViChar *cToken;
/*No of amplitude corrections points */
iNoOfPoints = 4;
ESA Programming Examples
/* Open a GPIB session at address 18*/
viStatus=viOpenDefaultRM(&defaultRM);
viStatus=viOpen(defaultRM,"GPIB0::18",VI_NULL,VI_NULL,&viESA);
if(viStatus)
{
printf("Could not open a session to GPIB device at address 18!\n");
exit(0);
}
/*Clear the instrument*/
viClear(viESA);
/*Reset the instrument*/
viPrintf(viESA,"*RST\n");
/*Display the program heading */
printf("\n\t\t Amplitude Correction Program \n\n" );
/*Set the stop frequency to 1.5 GHz */
viPrintf(viESA,"SENS:FREQ:STOP 1.5 GHz\n");
/* Check for the instrument model number and route the 50MHz signal accordingly*/
Route50MHzSignal();
/*
Purge any currently-loaded amplitude correction factors*/
viPrintf(viESA,"SENS:CORR:CSET1:DEL \n");
/* Enter amp cor frequency/amplitude pairs:
0 Hz, 0 dB, 100 MHz, 5 dB, 1 GHz, -5 dB, 1.5GHz,10*/
viPrintf(viESA,"SENS:CORR:CSET1:DATA ");
viPrintf(viESA,"0, 0.0,");
viPrintf(viESA,"100.E6, 5.0,");
viPrintf(viESA,"1.E9, -5.0,");
viPrintf(viESA,"1.5E9, 10 \n");
/* Activate amplitude correction. Notice that the noise floor slopes
up from 0 Hz to 100 MHz, then downward by 10 dB to 1 GHz, then upwards
again by 15 dB to 1.5 GHz.*/
viPrintf(viESA,"SENS:CORR:CSET1:STATE ON \n");
viPrintf(viESA,"SENS:CORR:CSET:ALL:STAT ON \n");
Chapter 17
245
ESA Programming Examples
Using C to Enter Amplitude Correction Data
/*Query the analyzer for its amplitude correction factors */
viQueryf(viESA,"SENS:CORR:CSET1:DATA?" , "%s" , &cResult);
/*Remove the "," from the amplitude correction for analyzing data*/
cToken = strtok(cResult,",");
ESA Programming Examples
/*Store the array (frequency) value into a two-dimensional real array*/
aRealArray[lFreq=0][lCount=0] = atof( cToken);
/*Remove the "," from the amplitude correction for analyzing data*/
cToken =strtok(NULL,",");
/*Store the array(amplitude) value into a two-dimensional real array*/
aRealArray[lAmpltd=1][lCount] = atof(cToken);
while (cToken != NULL)
{
lCount++;
if (lCount == iNoOfPoints)
{
lCount --;
break;
}
/*Remove the "," from the amplitude correction for analyzing data*/
cToken =strtok(NULL,",");
/*Store the array (frequency) value into a two-dimensional real array*/
aRealArray[lFreq][lCount] = atof(cToken);
cToken =strtok(NULL,",");
/*Store the array (amplitude) value into a two-dimensional real array*/
aRealArray[lAmpltd][lCount] = atof(cToken);
}
/*Display the contents of the array.*/
for (long i=0;i<=lCount;i++)
{
printf("\tFrequency of point[%d] = %f MHz\n",i,aRealArray[lFreq][i]/1e6);
printf("\tAmplitude of point[%d] = %f dB\n",i,aRealArray[lAmpltd][i]);
}
/*Close the session*/
viClose(viESA);
viClose(defaultRM);
}
246
Chapter 17
ESA Programming Examples
Using C to Determine if an Error has Occurred
Using C to Determine if an Error has Occurred
This C programming example (error.c) can be found on the Documentation CD.
/************************************************************/
Determine if an error has occurred
*/
*/
This example is for the E44xxB ESA Spectrum Analyzers
*/
and E740xA EMC Analyzers.
*/
*/
This C programming example does the following.
*/
The SCPI instrument commands used are given as
*/
reference.
*/
*/
- Opens a GPIB session at address 18
*/
- Clears the Analyzer
*/
*CLS
*/
- Resets the Analyzer
*/
*RST
*/
- Sets the service request mask to assert SRQ when
*/
either a measurement is uncalibrated or an error
*/
message has occurred.
*/
STAT:QUES:ENAB 512
*/
STAT:QUES:INT:ENAB 8
*/
*ESE 35
*/
*SRE 104
*/
- Set the center frequency to 500MHz and span to 100MHz */
SENS:FREQ:CENT 500 MHZ
*/
SENS:FREQ:SPAN 100 MHZ
*/
- Set the analyzer to an uncalibrated state
*/
- When an interrupt occurs, poll all instruments
*/
- Report the nature of the interrupt on the ESA analyzer */
- Pause 5 seconds to observe the analyzer
*/
- Sets the service request mask to assert SRQ when
*/
either a measurement is uncalibrated or an error
*/
message has occurred.
*/
*ESE 35
*/
*SRE 96
*/
- Send an illegal command to the ESA
*/
IDN (illegal command)
*/
- When an interrupt occurs, poll all instruments
*/
- Report the nature of the interrupt on the ESA analyzer */
- Clear the analyzer status registers
*/
*SRE 0
*/
Chapter 17
ESA Programming Examples
/*
/*
/*
/*
/*
/*
/*
/*
/*
/*
/*
/*
/*
/*
/*
/*
/*
/*
/*
/*
/*
/*
/*
/*
/*
/*
/*
/*
/*
/*
/*
/*
/*
/*
/*
/*
/*
/*
/*
247
ESA Programming Examples
Using C to Determine if an Error has Occurred
ESA Programming Examples
/*
*ESE 0
*/
/*
STAT:QUES:ENAB 0
*/
/*
STAT:QUES:INT:ENAB 0
*/
/*
*CLS
*/
/* - Continue monitoring for an interrupt
*/
/* - Close the session
*/
/************************************************************/
#include
#include
#include
#include
#include
#include
#include
#include
<stdio.h>
<stdlib.h>
<math.h>
<conio.h>
<ctype.h>
<string.h>
<windows.h>
"visa.h"
#define
#define
#define
#define
hpESA_IDN_E4401B "Hewlett-Packard, E4401B"
hpESA_IDN_E4411B "Hewlett-Packard, E4411B"
hpEMC_IDN_E7401A "Hewlett-Packard, E7401A"
YIELD Sleep(10)
ViSession defaultRM, viESA;
ViStatus errStatus;
ViChar
cIdBuff[256] = {0};
char cEnter =0;
int
iResult =0;
int
iSrqOccurred = 0;
char cBuf[3]={0};
/*Wait until SRQ is generated and for the handler to be called. Print
something while waiting. When interrupt occurs it will be handled by
interrupt handler*/
void WaitForSRQ()
{
long
lCount = 0L;
iSrqOccurred
=0;
printf ("\t\nWaiting for an SRQ to be generated ...");
for (lCount =0;(lCount<10) && (iSrqOccurred
==0); lCount++)
{
long lCount2 =0;
printf(".");
while ((lCount2++ < 100) && (iSrqOccurred
==0))
{
248
Chapter 17
ESA Programming Examples
Using C to Determine if an Error has Occurred
YIELD;
}
}
printf("\n");
}
/*Set the input port to 50MHz amplitude reference*/
void Route50MHzSignal()
{
/*Externally route the 50MHz Signal*/
viPrintf(viESA,"CAL:SOUR:STAT ON \n");
}
}
/*Interrupt handler,trigger event handler */
ViStatus _VI_FUNCH sSrqHdlr(ViSession viESA, ViEventType eventType, ViEvent
ctx,ViAddr userHdlr)
{
ViUInt16 iStatusByte=0;
long lCond = 0L;
/* Make sure it is an SRQ event, ignore if stray event*/
if (eventType!=VI_EVENT_SERVICE_REQ)
{
printf ("\n Stray event type0x%1x\n",eventType);
/*Return successfully*/
Chapter 17
249
ESA Programming Examples
viQueryf(viESA, "*IDN?\n", "%t", &cIdBuff);
iResult = (strncmp( cIdBuff, hpESA_IDN_E4401B, strlen(hpESA_IDN_E4401B)) &&
strncmp( cIdBuff, hpESA_IDN_E4411B, strlen(hpESA_IDN_E4411B)) && strncmp( cIdBuff,
hpEMC_IDN_E7401A, strlen(hpEMC_IDN_E7401A)));
if( iResult == 0 )
{
/*Set the input port to the 50MHz amplitude reference for the models*/
/*E4401B, E4411B and E7401A*/
viPrintf(viESA,"CAL:SOUR:STAT ON \n");
}
else
{
/* For the analyzers having frequency limits >= 3GHz, prompt the user*/
/* to connect the amplitude reference output to the input*/
printf ("Connect AMPTD REF OUT to the INPUT \n");
printf ("......Press Return to continue \n");
scanf( "%c",&cEnter);
ESA Programming Examples
Using C to Determine if an Error has Occurred
return VI_SUCCESS;
ESA Programming Examples
}
/* When an interrupt occurs, determine which device generated the interrupt
(if an instrument other than the ESA generates the interrupt, simply report
"Instrument at GPIB Address xxx Has Generated an Interrupt").*/
printf ("\n SRQ Event Occurred!\n");
printf ("\n ... Original Device Session = %1d\n",viESA);
/*Get the GPIB address of the insrument, which has interrupted*/
viQueryf(viESA,"SYST:COMM:GPIB:SELF:ADDR?\n","%t", cBuf);
printf ("\n Instrument at GPIB Address %s Has Generated an Interrupt!\n",cBuf);
/*Get the status byte*/
/* If the ESA generated the interrupt, determine the nature of the interrupt
either a measurement is uncalibrated or an error message has occurred?*/
viQueryf(viESA, "STAT:QUES:INT:EVEN?\n", "%d", &iStatusByte);
if ( (0x08 & iStatusByte))
printf("\n SRQ message:\t Measurement uncalibrated\n");
/* If the ESA generated the interrupt, determine the nature of the interrupt;
did is the measurement complete or an error message occur?*/
viQueryf(viESA, "*ESR?\n", "%d", &iStatusByte);
if ( (iStatusByte !=0) && (0x01 & iStatusByte))
printf("\n SRQ message:\t Measurement complete\n");
else if ( (iStatusByte !=0) && (0x02 | 0x10 | 0x20 & iStatusByte ))
printf ("\n SRQ message:\t Error Message Occurred\n");
/*Return successfully*/
iSrqOccurred
=1;
viReadSTB(viESA, &iStatusByte);
return VI_SUCCESS;
}
void main()
{
/*Program Variables*/
ViStatus viStatus = 0;
long
lOpc= 0L;
int
iIntNum= 0;
long
lCount= 0L;
/* Open a GPIB session at address 18*/
viStatus=viOpenDefaultRM(&defaultRM);
viStatus=viOpen(defaultRM,"GPIB0::18",VI_NULL,VI_NULL,&viESA);
if(viStatus)
{
250
Chapter 17
ESA Programming Examples
Using C to Determine if an Error has Occurred
printf("Could not open a session to GPIB device at address 18!\n");
exit(0);
}
/*Clear the instrument*/
viClear(viESA);
/*Reset the instrument*/
viPrintf(viESA,"*RST\n");
/*Display the program heading */
printf("\n\t\t Status register - Determine if an Error has Occurred\n\n" );
/* Check for the instrument model number and route the 50MHz-signal accordingly*/
Route50MHzSignal();
/*Put the analyzer in single sweep*/
viPrintf(viESA,"INIT:CONT 0 \n");
/*Set the service request mask to assert SRQ when either a measurement
is uncalibrated (i.e. "Meas Uncal" displayed on screen) or an error
message has occurred.*/
viPrintf(viESA,"STAT:QUES:ENAB 512\n");
viPrintf(viESA,"STAT:QUES:INT:ENAB 8\n");
viPrintf(viESA,"*ESE 35\n");
viPrintf(viESA,"*SRE 104\n");
/*Configure the computer to respond to an interrupt,install the handler
and enable it */
viInstallHandler(viESA, VI_EVENT_SERVICE_REQ, sSrqHdlr,ViAddr(10));
viEnableEvent(viESA, VI_EVENT_SERVICE_REQ,VI_HNDLR,VI_NULL);
iSrqOccurred
=0;
/*Set the analyzer to a 500 MHz center frequency*/
viPrintf(viESA,"SENS:FREQ:CENT 500 MHZ \n");
/*Set the analyzer to a 100 MHz span*/
viPrintf(viESA,"SENS:FREQ:SPAN 100 MHZ\n");
/*Set the analyzer to a auto resolution BW*/
viPrintf(viESA,"SENS:BAND:RES:AUTO 1\n");
/*Set the analyzer to a Auto Sweep Time*/
viPrintf(viESA,"SENS:SWE:TIME:AUTO 1\n");
Chapter 17
251
ESA Programming Examples
/*Clear the status byte of the instrument*/
viPrintf(viESA,"*CLS\n");
ESA Programming Examples
Using C to Determine if an Error has Occurred
/*Allow analyzer to sweep several times.*/
viPrintf(viESA,"INIT:CONT 1 \n");
ESA Programming Examples
/*Manually couple sweeptime to 5ms. reduce resolution BW to 30 KHz.
"Meas Uncal" should be displayed on the screen, and an interrupt should
be generated.*/
viPrintf(viESA,"SENS:SWE:TIME 5 ms \n");
viPrintf(viESA,"SENS:BAND:RES 30 KHZ \n");
/*Wait for SRQ*/
WaitForSRQ();
/*Pause for 5 seconds to observe "Meas Uncal" message on ESA display*/
Sleep(5000);
/* Set the service request mask to assert SRQ when either a measurement
is completed or an error message has occurred.*/
viPrintf(viESA,"*SRE 96\n");
viPrintf(viESA,"*ESE 35\n");
/*Send an undefined command to the device*/
viPrintf(viESA,"IDN\n");
/*Wait for SRQ*/
WaitForSRQ();
/*Disable and uninstall the interrupt handler*/
viDisableEvent (viESA, VI_EVENT_SERVICE_REQ,VI_HNDLR);
viUninstallHandler(viESA, VI_EVENT_SERVICE_REQ, sSrqHdlr,ViAddr(10));
/*Clear the instrument status register*/
viPrintf(viESA,"*SRE 0 \n");
viPrintf(viESA,"*ESE 0 \n");
viPrintf(viESA,"STAT:QUES:ENAB 0\n");
viPrintf(viESA,"STAT:QUES:INT:ENAB 0\n");
/*Clear the status byte of the instrument*/
viPrintf(viESA,"*CLS\n");
/*Close the session*/
viClose(viESA);
viClose(defaultRM);
}
252
Chapter 17
ESA Programming Examples
Using C to Measure Harmonic Distortion (over GPIB)
Using C to Measure Harmonic Distortion (over GPIB)
This C programming example (harmgpib.c) can be found on the Documentation
CD.
/************************************************************/
Measuring Harmonic Distortion (GPIB)
This example is for the E44xxB ESA Spectrum Analyzers
and E740xA EMC Analyzers.
This C programming example does the following.
The SCPI instrument commands used are given as
reference.
- Opens a GPIB session at address 18
- Clears the Analyzer
*CLS
- Resets the Analyzer
*RST
- Set the input port to the 50 MHz reference
CAL:SOUR:STAT ON
- Set the analyzer center frequency to the fundamental
SENS:FREQ:CENT freq
- Set the analyzer to 10 MHz span
SENS:FREQ:SPAN 10 MHZ
- Set the analyzer to single sweep mode
INIT:CONT 0
- Take a sweep and wait for sweep completion
INIT:IMM;*WAI
- Perform the peak search
CALC:MARK:MAX
- Set the marker to reference level
CALC:MARK:SET:RLEV
- Take a sweep and wait for sweep completion
INIT:IMM;*WAI
- Perform the peak search
CALC:MARK:MAX
- Change VISA timeout to 60 seconds
- Activate signal track
CALC:MARK:TRCK:STAT ON
- Perform narrow span and wait
SENS:FREQ:SPAN 10e4
- Check for operation complete
Chapter 17
*/
*/
*/
*/
*/
*/
*/
*/
*/
*/
*/
*/
*/
*/
*/
*/
*/
*/
*/
*/
*/
*/
*/
*/
*/
*/
*/
*/
*/
*/
*/
*/
*/
*/
*/
*/
*/
*/
ESA Programming Examples
/*
/*
/*
/*
/*
/*
/*
/*
/*
/*
/*
/*
/*
/*
/*
/*
/*
/*
/*
/*
/*
/*
/*
/*
/*
/*
/*
/*
/*
/*
/*
/*
/*
/*
/*
/*
/*
/*
253
ESA Programming Examples
ESA Programming Examples
Using C to Measure Harmonic Distortion (over GPIB)
/*
/*
/*
/*
/*
/*
/*
/*
/*
/*
/*
/*
/*
/*
/*
/*
/*
/*
/*
/*
/*
/*
/*
/*
/*
/*
/*
/*
/*
/*
/*
/*
/*
/*
/*
/*
/*
/*
/*
/*
/*
/*
/*
/*
/*
/*
-
-
-
*OPC?
*/
De-activate signal track
*/
CALC:MARK:TRCK:STAT OFF
*/
Reset VISA timeout to 3 seconds
*/
Set units to dBm
*/
UNIT:POW DBM
*/
Take a sweep and wait for sweep completion
*/
INIT:IMM;
*/
*OPC?
*/
Perform the peak search
*/
CALC:MARK:MAX
*/
Read the marker amplitude,this is the fundamental Level*/
CALC:MARK:Y?
*/
Change the amplitude units to volts
*/
UNIT:POW V
*/
Take a sweep
*/
INIT:IMM
*/
Check for operation complete
*/
*OPC?
*/
Read the marker amplitude in volts, this is the
*/
fundamental amplitude in volts.
*/
CALC:MARK:Y?
*/
Read the marker frequency
*/
CALC:MARK:X?
*/
Measure each harmonic amplitude as follows:
*/
Set the span to 20 MHz
*/
SENS:FREQ:SPAN 20 MHZ
*/
Set the center frequency to the desired harmonic
*/
SENS:FREQ:CENT <freq>
*/
Take a sweep and wait for operation complete
*/
INIT:IMM
*/
*OPC?
*/
Perform peak search
*/
CALC:MARK:MAX
*/
Set VISA timeout to 60 seconds
*/
Activate signal track
*/
CALC:MARK:TRCK:STAT ON
*/
Zoom down to a 100 kHz span
*/
SENS:FREQ:SPAN 10E4
*/
Take a sweep and wait for operation complete
*/
INIT:IMM
*/
*OPC?
*/
Signal track off
*/
CALC:MARK:TRCK:STAT OFF
*/
Reset VISA timeout to 3 seconds
*/
Perform Peak Search
*/
254
Chapter 17
ESA Programming Examples
Using C to Measure Harmonic Distortion (over GPIB)
#include
#include
#include
#include
#include
#include
#include
ESA Programming Examples
/*
CALC:MARK:MAX
*/
/*
Set marker amplitude in volts
*/
/*
UNIT:POW V
*/
/*
Query, read the marker amplitude in volts
*/
/*
CALC:MARK:Y?
*/
/*
Change the amplitude units to dBm and read the
*/
/*
marker amplitude.
*/
/*
UNIT:POW DBM
*/
/* - Calculate the relative amplitude of each harmonic
*/
/*
reletive to the fundamental
*/
/* - Calculate the total harmonic distortion
*/
/* - Display the fundamental amplitude in dBm, fundamental */
/*
frequency in MHz, relative amplitude of each harmonic */
/*
in dBc and total harmonic distortion in percent
*/
/* - Close the session
*/
/************************************************************/
<stdio.h>
<stdlib.h>
<math.h>
<conio.h>
<ctype.h>
<string.h>
"visa.h"
#define hpESA_IDN_E4401B "Hewlett-Packard, E4401B"
#define hpESA_IDN_E4411B "Hewlett-Packard, E4411B"
#definehpEMC_IDN_E7401A "Hewlett-Packard, E7401A"
ViSession defaultRM, viESA;
ViStatus errStatus;
ViChar
cIdBuff[256]= {0};
char
cEnter = 0;
int
iResult = 0;
long
lOpc =0L;
/*Set the input port to 50MHz amplitude reference*/
void Route50MHzSignal()
{
viQueryf(viESA, "*IDN?\n", "%t", &cIdBuff);
iResult = (strncmp( cIdBuff, hpESA_IDN_E4401B, strlen(hpESA_IDN_E4401B)) &&
strncmp( cIdBuff, hpESA_IDN_E4411B, strlen(hpESA_IDN_E4411B)) && strncmp( cIdBuff,
hpEMC_IDN_E7401A, strlen(hpEMC_IDN_E7401A)));
if( iResult == 0 )
{
Chapter 17
255
ESA Programming Examples
Using C to Measure Harmonic Distortion (over GPIB)
/*Set the input port to the 50MHz amplitude reference for the models*/
/*E4401B, E4411B, and E7401A*/
viPrintf(viESA,"CAL:SOUR:STAT ON \n");
ESA Programming Examples
}
else
{
/* For the analyzers having frequency limits >= 3GHz, prompt the user*/
/* to connect the amplitude reference output to the input*/
printf ("Connect AMPTD REF OUT to the INPUT \n");
printf ("......Press Return to continue \n");
scanf( "%c",&cEnter);
/*Externally route the 50MHz Signal*/
viPrintf(viESA,"CAL:SOUR:STAT ON \n");
}
}
void TakeSweep()
{
/*Take a sweep and wait for the sweep completion*/
viPrintf(viESA,"INIT:IMM\n");
viQueryf(viESA, "*OPC?\n", "%d", &lOpc);
if (!lOpc)
{
printf("Program Abort! Error occurred: last command was not completed! \n");
exit(0);
}
}
void main()
{
/*Program Variables*/
ViStatus viStatus = 0;
double dFundamental = 0.0;
double dHarmFreq =0.0;
float fHarmV[10] ={0.0};
float fHarmDbm[10]={0.0};
float fRelAmptd[10]={0.0};
float fFundaAmptdDbm=0.0;
double dFundaAmptdV=0.0;
double dMarkerFreq = 0.0;
double dPrcntDistort =0.0;
double dSumSquare =0.0;
long
lMaxHarmonic =0L;
long
lNum=0L;
/*Setting default values*/
256
Chapter 17
ESA Programming Examples
Using C to Measure Harmonic Distortion (over GPIB)
lMaxHarmonic =5;
dFundamental =50.0;
ESA Programming Examples
/* Open a GPIB session at address 18*/
viStatus=viOpenDefaultRM(&defaultRM);
viStatus=viOpen(defaultRM,"GPIB0::18",VI_NULL,VI_NULL,&viESA);
if(viStatus)
{
printf("Could not open a session to GPIB device at address 18!\n");
exit(0);
}
/*Clear the instrument*/
viClear(viESA);
/*Reset the instrument*/
viPrintf(viESA,"*RST\n");
/*Display the program heading */
printf("\n\t\t Harmonic Distortion Program \n\n" );
/* Check for the instrument model number and route the 50MHz-signal accordingly*/
Route50MHzSignal();
/*Prompt user for fundamental frequency*/
printf("\t Enter the input signal fundamental frequency in MHz ");
/*The user enters fundamental frequency*/
scanf("%lf",&dFundamental);
/*Set the analyzer center frequency to the fundamental frequency. */
viPrintf(viESA,"SENS:FREQ:CENT %lf MHZ \n;",dFundamental);
/*Set the analyzer to 10MHz Span */
viPrintf(viESA,"SENS:FREQ:SPAN 10 MHZ\n");
/*Put the analyzer in a single sweep
viPrintf(viESA,"INIT:CONT 0 \n");
*/
/*Trigger a sweep, wait for sweep completion*/
viPrintf(viESA,"INIT:IMM;*WAI\n");
/*Perform a peak search */
viPrintf(viESA,"CALC:MARK:MAX \n");
/* Place the signal at the reference level using the
marker-to-reference level command and take sweep */
Chapter 17
257
ESA Programming Examples
Using C to Measure Harmonic Distortion (over GPIB)
viPrintf(viESA,"CALC:MARK:SET:RLEV \n");
/*Trigger a sweep, wait for sweep completion*/
viPrintf(viESA,"INIT:IMM;*WAI\n");
/*Perform a peak search */
viPrintf(viESA,"CALC:MARK:MAX \n");
ESA Programming Examples
/*increase timeout to 60 sec*/
viSetAttribute(viESA,VI_ATTR_TMO_VALUE,60000);
/*Perform activate signal track */
viPrintf(viESA,"CALC:MARK:TRCK:STAT ON \n");
/*Take a sweep and wait for the sweep completion*/
TakeSweep();
/*Perform narrow span and wait */
viPrintf(viESA,"SENS:FREQ:SPAN 10e4 \n");
/*Take a sweep and wait for the sweep completion*/
TakeSweep();
/*De activate the signal track */
viPrintf(viESA,"CALC:MARK:TRCK:STAT OFF \n");
/*Reset timeout to 3 sec*/
viSetAttribute(viESA,VI_ATTR_TMO_VALUE,3000);
/*Set units to DBM*/
viPrintf(viESA,"UNIT:POW DBM \n");
/*Perform a peak search */
viPrintf(viESA,"CALC:MARK:MAX \n");
/*Read the marker amplitude, this is the fundamental amplitude
in dBm */
viQueryf(viESA,"CALC:MARK:Y?\n","%1f", &fFundaAmptdDbm);
/*Change the amplitude units to Volts */
viPrintf(viESA,"UNIT:POW V \n");
/*Read the marker amplitude in volts, This is the fundamental amplitude
in Volts (necessary for the THD calculation).*/
viQueryf(viESA,"CALC:MARK:Y?\n","%lf",&dFundaAmptdV);
258
Chapter 17
ESA Programming Examples
Using C to Measure Harmonic Distortion (over GPIB)
/*Read the marker frequency. */
viQueryf(viESA,"CALC:MARK:X? \n","%lf",&dMarkerFreq);
dFundamental = dMarkerFreq;
/*Measure each harmonic amplitude as follows: */
for ( lNum=2;lNum<=lMaxHarmonic;lNum++)
{
/*Measuring the Harmonic No#[%d] message */
printf("\n\t Measuring the Harmonic No [%d] \n",lNum );
ESA Programming Examples
/*Set the span to 20 MHz*/
viPrintf(viESA,"SENS:FREQ:SPAN 20 MHZ \n");
/*Set the center frequency to the nominal harmonic frequency*/
dHarmFreq = lNum*dFundamental;
viPrintf(viESA,"SENS:FREQ:CENT %lf HZ \n;",dHarmFreq);
/*Take a sweep and wait for the sweep completion*/
TakeSweep();
/*Perform a peak search and wait for completion */
viPrintf(viESA,"CALC:MARK:MAX\n");
/*increase timeout to 60 sec*/
viSetAttribute(viESA,VI_ATTR_TMO_VALUE,60000);
/*Activate signal track */
viPrintf(viESA,"CALC:MARK:TRCK:STAT ON\n");
/*Zoom down to a 100 kHz span */
viPrintf(viESA,"SENS:FREQ:SPAN 10e4\n");
/*Take a sweep and
TakeSweep();
wait for the sweep completion*/
/* Signal track off */
viPrintf(viESA,"CALC:MARK:TRCK:STAT OFF\n");
/*Reset timeout to 3 sec*/
viSetAttribute(viESA,VI_ATTR_TMO_VALUE,3000);
/*Set Marker Amplitude in Volts*/
viPrintf(viESA,"UNIT:POW V\n");
/*Perform a peak search and wait for completion*/
viPrintf(viESA,"CALC:MARK:MAX\n");
Chapter 17
259
ESA Programming Examples
Using C to Measure Harmonic Distortion (over GPIB)
/*Query and read the Marker Amplitude in Volts*/
/*Store the result in the array.*/
viQueryf(viESA,"CALC:MARK:Y?\n","%1f", &fHarmV[lNum]);
ESA Programming Examples
/*Change the amplitude units to DBM
viPrintf(viESA,"UNIT:POW DBM\n");
*/
/* Read the marker amplitude */
viQueryf(viESA,"CALC:MARK:Y?\n","%1f", &fHarmDbm[lNum]);
}
/*Sum the square of each element in the fHarmV array. Then
calculate the relative amplitude of each harmonic relative
to the fundamental */
for (lNum=2;lNum<=lMaxHarmonic;lNum++)
{
dSumSquare= dSumSquare + (pow (double(fHarmV[lNum]) ,2.0));
/* Relative Amplitude */
fRelAmptd[lNum] = fHarmDbm[lNum] - fFundaAmptdDbm ;
}
/*Calculate the total harmonic distortion by dividing the square root of
the sum of the squares (dSumSquare) by the fundamental amplitude in Volts
(dFundaAmptdV).Multiply this value by 100 to obtain a result in percent*/
dPrcntDistort = ((sqrt(double (dSumSquare))) /dFundaAmptdV) *100 ;
/*Fundamental amplitude in dBm */
printf("\n\t Fundamental Amplitude: %lf dB \n\n",fFundaAmptdDbm);
/*Fundamental Frequency in MHz*/
printf("\t Fundamental Frequency is: %lf MHz \n\n",dFundamental/10e5);
/*Relative amplitude of each harmonic in dBc*/
for (lNum=2;lNum<=lMaxHarmonic;lNum++)
printf("\t Relative amplitude of Harmonic[%d]: %lf dBc
\n\n",lNum,fRelAmptd[lNum]);
/*Total harmonic distortion in percent*/
printf("\t Total Harmonic Distortion: %lf percent \n\n",dPrcntDistort);
/*Close the session*/
viClose(viESA);
viClose(defaultRM);
}
260
Chapter 17
ESA Programming Examples
Using C to Measure Harmonic Distortion (over RS-232)
Using C to Measure Harmonic Distortion (over RS-232)
This C programming example (harmrs23.c) can be found on the Documentation
CD.
/************************************************************/
Measuring Harmonic Distortion (RS-232)
This example is for the E44xxB ESA Spectrum Analyzers
and E740xA EMC Analyzers.
This C programming example does the following.
The SCPI instrument commands used are given as
reference.
- Opens an RS-232 session to the COM1 serial port
- Clears the Analyzer
*CLS
- Resets the Analyzer
*RST
- Set the input port to the 50 MHz reference
CAL:SOUR:STAT ON
- Set the analyzer center frequency to the fundamental
SENS:FREQ:CENT freq
- Set the analyzer to 10 MHz span
SENS:FREQ:SPAN 10 MHZ
- Set the analyzer to single sweep mode
INIT:CONT 0
- Trigger a sweep and wait for sweep completion
INIT:IMM;*WAI
- Perform the peak search
CALC:MARK:MAX
- Set the marker to reference level
CALC:MARK:SET:RLEV
- Trigger a sweep and wait for sweep completion
INIT:IMM;*WAI
- Perform the peak search
CALC:MARK:MAX
- Change VISA timeout to 60 seconds
- Activate signal track
CALC:MARK:TRCK:STAT ON
- Perform narrow span and wait
SENS:FREQ:SPAN 10e4
- Check for operation complete
Chapter 17
*/
*/
*/
*/
*/
*/
*/
*/
*/
*/
*/
*/
*/
*/
*/
*/
*/
*/
*/
*/
*/
*/
*/
*/
*/
*/
*/
*/
*/
*/
*/
*/
*/
*/
*/
*/
*/
*/
ESA Programming Examples
/*
/*
/*
/*
/*
/*
/*
/*
/*
/*
/*
/*
/*
/*
/*
/*
/*
/*
/*
/*
/*
/*
/*
/*
/*
/*
/*
/*
/*
/*
/*
/*
/*
/*
/*
/*
/*
/*
261
ESA Programming Examples
ESA Programming Examples
Using C to Measure Harmonic Distortion (over RS-232)
/*
/*
/*
/*
/*
/*
/*
/*
/*
/*
/*
/*
/*
/*
/*
/*
/*
/*
/*
/*
/*
/*
/*
/*
/*
/*
/*
/*
/*
/*
/*
/*
/*
/*
/*
/*
/*
/*
/*
/*
/*
/*
/*
/*
/*
/*
-
-
-
*OPC?
*/
De-activate signal track
*/
CALC:MARK:TRCK:STAT OFF
*/
Reset VISA timeout to 3 seconds
*/
Set units to dBm
*/
UNIT:POW DBM
*/
Take a sweep and wait for sweep completion
*/
INIT:IMM;
*/
*OPC?
*/
Perform the peak search
*/
CALC:MARK:MAX
*/
Read the marker amplitude,this is the fundamental Level*/
CALC:MARK:Y?
*/
Change the amplitude units to volts
*/
UNIT:POW V
*/
Take a sweep
*/
INIT:IMM
*/
Check for operation complete
*/
*OPC?
*/
Read the marker amplitude in volts, this is the
*/
fundamental amplitude in volts.
*/
CALC:MARK:Y?
*/
Read the marker frequency
*/
CALC:MARK:X?
*/
Measure each harmonic amplitude as follows:
*/
Set the span to 20 MHz
*/
SENS:FREQ:SPAN 20 MHZ
*/
Set the center frequency to the desired harmonic
*/
SENS:FREQ:CENT <freq>
*/
Take a sweep and wait for operation complete
*/
INIT:IMM
*/
*OPC?
*/
Perform peak search
*/
CALC:MARK:MAX
*/
Set VISA timeout to 60 seconds
*/
Activate signal track
*/
CALC:MARK:TRCK:STAT ON
*/
Zoom down to a 100 kHz span
*/
SENS:FREQ:SPAN 10E4
*/
Take a sweep and wait for operation complete
*/
INIT:IMM
*/
*OPC?
*/
Signal track off
*/
CALC:MARK:TRCK:STAT OFF
*/
Reset VISA timeout to 3 seconds
*/
Perform Peak Search
*/
262
Chapter 17
ESA Programming Examples
Using C to Measure Harmonic Distortion (over RS-232)
#include
#include
#include
#include
#include
#include
#include
ESA Programming Examples
/*
CALC:MARK:MAX
*/
/*
Set marker amplitude in volts
*/
/*
UNIT:POW V
*/
/*
Query, read the marker amplitude in volts
*/
/*
CALC:MARK:Y?
*/
/*
Change the amplitude units to dBm and read the
*/
/*
marker amplitude.
*/
/*
UNIT:POW DBM
*/
/* - Calculate the relative amplitude of each harmonic
*/
/*
reletive to the fundamental
*/
/* - Calculate the total harmonic distortion
*/
/* - Display the fundamental amplitude in dBm, fundamental */
/*
frequency in MHz, relative amplitude of each harmonic */
/*
in dBc and total harmonic distortion in percent
*/
/* - Close the session
*/
/************************************************************/
<stdio.h>
<stdlib.h>
<math.h>
<conio.h>
<ctype.h>
<string.h>
<visa.h>
#define hpESA_IDN_E4401B "Hewlett-Packard, E4401B"
#define hpESA_IDN_E4411B "Hewlett-Packard, E4411B"
#definehpEMC_IDN_E7401A "Hewlett-Packard, E7401A"
ViSession defaultRM, viESA;
ViStatus errStatus;
ViChar
cIdBuff[256]= {0};
char
cEnter = 0;
int
iResult = 0;
long
lOpc =0L ;
/*Set the input port to 50MHz amplitude reference*/
void Route50MHzSignal()
{
viQueryf(viESA, "*IDN?\n", "%t", &cIdBuff);
iResult = (strncmp( cIdBuff, hpESA_IDN_E4401B, strlen(hpESA_IDN_E4401B)) &&
strncmp( cIdBuff, hpESA_IDN_E4411B, strlen(hpESA_IDN_E4411B)) && strncmp( cIdBuff,
hpEMC_IDN_E7401A, strlen(hpEMC_IDN_E7401A)));
if( iResult == 0 )
{
Chapter 17
263
ESA Programming Examples
Using C to Measure Harmonic Distortion (over RS-232)
/*Set the input port to the 50MHz amplitude reference for the models*/
/*E4411B, E4401B*/
viPrintf(viESA,"CAL:SOUR:STAT ON\n");
ESA Programming Examples
}
else
{
/* For the analyzers having frequency limits >= 3GHz, prompt the user*/
/* to connect the amplitude reference output to the input*/
printf ("Connect AMPTD REF OUT to the INPUT \n");
printf ("......Press Return to continue \n");
scanf( "%c",&cEnter);
/*Externally route the 50MHz Signal*/
viPrintf(viESA,"CAL:SOUR:STAT ON\n");
}
}
void TakeSweep()
{
/*Take a sweep and wait for the sweep completion*/
viPrintf(viESA,"INIT:IMM\n");
viQueryf(viESA, "*OPC?\n", "%d", &lOpc);
if (!lOpc)
{
printf("Program Abort! Error occurred: last command was not completed! \n");
exit(0);
}
}
void main()
{
/*Program Variables*/
ViStatus viStatus = 0;
double dFundamental = 0.0;
double dHarmFreq = 0.0;
float fHarmV[10] ={0.0};
float fHarmDbm[10]={0.0};
float fRelAmptd[10]={0.0};
float fFundaAmptdDbm=0.0;
double dFundaAmptdV=0.0;
double dMarkerFreq = 0.0;
double dPrcntDistort =0.0;
double dSumSquare =0.0;
long
lMaxHarmonic =0L;
long
lNum=0L;
264
Chapter 17
ESA Programming Examples
Using C to Measure Harmonic Distortion (over RS-232)
/*Setting default values*/
lMaxHarmonic =5;
dFundamental =50.0;
ESA Programming Examples
/* Open a serial session at COM1 */
viStatus=viOpenDefaultRM(&defaultRM);
if (viStatus =viOpen(defaultRM,"ASRL1::INSTR",VI_NULL,VI_NULL,&viESA) !=
VI_SUCCESS)
{
printf("Could not open a session to ASRL device at COM1!\n");
exit(0);
}
/*Clear the instrument*/
viClear(viESA);
/*Reset the instrument*/
viPrintf(viESA,"*RST\n");
/*Display the program heading */
printf("\n\t\t Harmonic Distortion Program \n\n" );
/* Check for the instrument model number and route the 50MHz-signal accordingly*/
Route50MHzSignal();
/*Prompt user for fundamental frequency*/
printf("\t Enter the input signal fundamental frequency in MHz ");
/*The user enters fundamental frequency*/
scanf("%lf",&dFundamental);
/*Set the analyzer center frequency to the fundamental frequency. */
viPrintf(viESA,"SENS:FREQ:CENT %lf MHZ\n",dFundamental);
/*Set the analyzer to 10MHz Span */
viPrintf(viESA,"SENS:FREQ:SPAN 10 MHZ\n");
/*Put the analyzer in a single sweep mode */
viPrintf(viESA,"INIT:CONT 0\n");
/*Trigger a sweep, wait for sweep completion*/
viPrintf(viESA,"INIT:IMM;*WAI\n");
/*Perform a peak search */
viPrintf(viESA,"CALC:MARK:MAX\n");
Chapter 17
265
ESA Programming Examples
Using C to Measure Harmonic Distortion (over RS-232)
/* Place the signal at the reference level using the
marker-to-reference level command and take sweep */
viPrintf(viESA,"CALC:MARK:SET:RLEV\n");
/*Trigger a sweep, wait for sweep completion*/
viPrintf(viESA,"INIT:IMM;*WAI\n");
ESA Programming Examples
/*Perform a peak search */
viPrintf(viESA,"CALC:MARK:MAX\n");
/*Increase timeout to 60 sec*/
viSetAttribute(viESA,VI_ATTR_TMO_VALUE,60000);
/*Perform activate signal track */
viPrintf(viESA,"CALC:MARK:TRCK:STAT ON\n");
/*Take a sweep and wait for the sweep completion*/
TakeSweep();
/*Perform narrow span and wait */
viPrintf(viESA,"SENS:FREQ:SPAN 10e4\n");
/*Take a sweep and wait for the sweep completion*/
TakeSweep();
/*De activate the signal track */
viPrintf(viESA,"CALC:MARK:TRCK:STAT OFF\n");
/*Reset timeout to 3 sec*/
viSetAttribute(viESA,VI_ATTR_TMO_VALUE,3000);
/*Set units to dBm*/
viPrintf(viESA,"UNIT:POW DBM\n");
/*Perform a peak search */
viPrintf(viESA,"CALC:MARK:MAX\n");
/*Read the marker amplitude, this is the fundamental amplitude
in dBm */
viQueryf(viESA,"CALC:MARK:Y?\n","%1f", &fFundaAmptdDbm);
/*Change the amplitude units to Volts */
viPrintf(viESA,"UNIT:POW V\n");
/*Read the marker amplitude in volts, This is the fundamental amplitude
in Volts (necessary for the THD calculation).*/
266
Chapter 17
ESA Programming Examples
Using C to Measure Harmonic Distortion (over RS-232)
viQueryf(viESA,"CALC:MARK:Y?\n","%lf",&dFundaAmptdV);
/*Read the marker frequency. */
viQueryf(viESA,"CALC:MARK:X? \n","%lf",&dMarkerFreq);
dFundamental = dMarkerFreq;
ESA Programming Examples
/*Measure each harmonic amplitude as follows: */
for ( lNum=2;lNum<=lMaxHarmonic;lNum++)
{
/*Measuring the Harmonic No#[%d] message */
printf("\n\t Measuring the Harmonic No [%d] \n",lNum );
/*Set the span to 20 MHz*/
viPrintf(viESA,"SENS:FREQ:SPAN 20 MHZ\n");
/*Set the center frequency to the nominal harmonic frquency*/
dHarmFreq = lNum * dFundamental;
viPrintf(viESA,"SENS:FREQ:CENT %lf HZ\n",dHarmFreq);
/*Take a sweep and wait for the sweep completion*/
TakeSweep();
/*Perform a peak search and wait for completion */
viPrintf(viESA,"CALC:MARK:MAX\n");
/*Increase timeout to 60 sec*/
viSetAttribute(viESA,VI_ATTR_TMO_VALUE,60000);
/*Activate signal track */
viPrintf(viESA,"CALC:MARK:TRCK:STAT ON\n");
/*Zoom down to a 100 KHz span */
viPrintf(viESA,"SENS:FREQ:SPAN 10e4\n");
/*Take a sweep and wait for the sweep completion*/
TakeSweep();
/* Signal track off */
viPrintf(viESA,"CALC:MARK:TRCK:STAT OFF\n");
/*Reset timeout to 3 sec*/
viSetAttribute(viESA,VI_ATTR_TMO_VALUE,3000);
/*Set marker amplitude in Volts*/
viPrintf(viESA,"UNIT:POW V\n");
Chapter 17
267
ESA Programming Examples
Using C to Measure Harmonic Distortion (over RS-232)
/*Perform a peak search and wait for completion*/
viPrintf(viESA,"CALC:MARK:MAX\n");
/*Query and read the marker amplitude in Volts*/
/*Store the result in the fHarmV array.*/
viQueryf(viESA,"CALC:MARK:Y?\n","%1f", &fHarmV[lNum]);
ESA Programming Examples
/*Change the amplitude units to dBm */
viPrintf(viESA,"UNIT:POW DBM\n");
/* Read the marker amplitude */
viQueryf(viESA,"CALC:MARK:Y?\n","%1f", &fHarmDbm[lNum]);
}
/*Sum the square of each element in the fHarmV array and calculate
the relative amplitude of each harmonic relative to the fundamental*/
for (lNum=2;lNum<=lMaxHarmonic;lNum++)
{
dSumSquare= dSumSquare + (pow (double(fHarmV[lNum]) ,2.0));
/* Relative Amplitude */
fRelAmptd[lNum] = fHarmDbm[lNum] - fFundaAmptdDbm ;
}
/*Calculate the total harmonic distortion by dividing the square root of
the sum of the squares (dSumSquare) by the fundamental amplitude in Volts
(dFundaAmptdV).Multiply this value by 100 to obtain a result in percent*/
dPrcntDistort = ((sqrt(double (dSumSquare))) /dFundaAmptdV) *100 ;
/*Fundamental amplitude in dBm */
printf("\nFundamental Amplitude: %lf dB \n",fFundaAmptdDbm);
/*Fundamental frequency in MHz*/
printf("Fundamental Frequency is: %lf MHz \n",dFundamental/10e5);
/*Relative amplitude of each harmonic in dBc*/
for (lNum=2;lNum<=lMaxHarmonic;lNum++)
printf("Relative amplitude of Harmonic[%d]: %lf dBc
\n",lNum,fRelAmptd[lNum]);
/*Total harmonic distortion in percent*/
printf("Total Harmonic Distortion: %lf percent\n",dPrcntDistort);
/*Close the session*/
viClose(viESA);
viClose(defaultRM);
}
268
Chapter 17
ESA Programming Examples
Using C to Make Faster Power Averaging Measurements
Using C to Make Faster Power Averaging Measurements
This C programming example (average.c) can be found on the Documentation CD.
/************************************************************/
Average.c
Agilent Technologies 1999
This C programming example does the following:
Performs Power Averaging of Multiple ESA Measurements
and Writes the Result back to a Trace for display
The required SCPI instrument commands are given as
reference.
- Opens a GPIB device at address 18
- Clears and Resets the Analyzer to a known state
SYST:PRES:TYPE FACT
*RST
- Identify the Instrument model
*IDN?
- Sets the analyzer center frequency and span
SENS:FREQ:CENT freq
SENS:FREQ:SPAN freq
- Sets the analyzer resolution bandwidth
SENS:BAND rbw
- Selects sampled as the detector mode
SENS:DET SAMP
- Disable optional Input/Output functions
:SYST:PORT:IFVS:ENAB OFF
- Turn off auto-alignment
CAL:AUTO OFF
- Select the desired number of sweep points
SWE:POINTS points
- Select the appropriate display reference level and
amplitude reference routing
E4402B/03B/04B/05B/07B/08B or E7402A/03A/04A/05A
DISP:WIND:TRAC:Y:RLEV -20 DBM
CAL:SOUR:STAT ON
E4401B, E4411B, or E7401A
DISP:WIND:TRAC:Y:RLEV -25 DBM
*/
CAL:SOUR:STAT ON;
- Select single sweep mode
INIT:CONT OFF
- Disable local display
Chapter 17
*/
*/
*/
*/
*/
*/
*/
*/
*/
*/
*/
*/
*/
*/
*/
*/
*/
*/
*/
*/
*/
*/
*/
*/
*/
*/
*/
*/
*/
*/
*/
*/
*/
*/
ESA Programming Examples
/*
/*
/*
/*
/*
/*
/*
/*
/*
/*
/*
/*
/*
/*
/*
/*
/*
/*
/*
/*
/*
/*
/*
/*
/*
/*
/*
/*
/*
/*
/*
/*
/*
/*
/*
/*
/*
/*
/*
*/
*/
*/
*/
269
ESA Programming Examples
ESA Programming Examples
Using C to Make Faster Power Averaging Measurements
/*
DISP:ENAB OFF
*/
/* - Select internal machine binary data format (milli-dBm) */
/*
FORM:DAT INT,32
*/
/* - Select appropriate byte order (Intel)
*/
/*
FORM:BORD SWAP
*/
/* - Repeat the following the requested number of times:
*/
/*
- Trigger a measurement and wait for completion
*/
/*
INIT:*OPC?
*/
/*
- Read the resulting measurement trace
*/
/*
TRAC:DATA? TRACE1
*/
/* - Compute running averaged power at all trace points
*/
/* - Display measurement statistics
*/
/* - Write averaged data to second trace display
*/
/*
TRAC:DATA TRACE2 <definite length block of data>
*/
/* - Enable viewing of second trace
*/
/*
TRACE2:MODE VIEW
*/
/* - Enable local display for viewing
*/
/*
DISP:ENAB ON
*/
/* - Select continuous sweep mode
*/
/*
INIT:CONT ON
*/
/* - Close session and Return instrument to local control
*/
/************************************************************/
#include
#include
#include
#include
#include
#include
<stdio.h>
<stdlib.h>
<string.h>
<math.h>
<sys\timeb.h>
<visa.h>
#define
#define
#define
hpESA_IDN_E4401B "Hewlett-Packard, E4401B"
hpESA_IDN_E4411B "Hewlett-Packard, E4411B"
hpEMC_IDN_E7401A "Hewlett-Packard, E7401A"
#define
*/
#define
*/
#define
*/
#define
#define
NUM_TRACES 100
/* number of traces to average
NUM_POINTS 401
/* requested number of points/trace
CENTER 50
/* center frequency in MHz, an integer
SPAN 20
RBW 300
#define DISPLAY
*/
/* span frequency in MHz, an integer
/* resolution BW in kHz, an integer
0
270
*/
*/
/* ESA display enable, disable for speed
Chapter 17
ESA Programming Examples
Using C to Make Faster Power Averaging Measurements
#define DATA_LENGTH
4
*/
#define MAX_POINTS 8192
*/
/* number of data bytes in one trace point
/* maximum number of points/trace in ESA
*/
*/
int iResult =0;
unsigned long lRetCount;
*/
/* the number of bytes transferred in one trace record
double dDelta, dTimePer, dPower;
struct timeb start_time, stop_time, elapsed_time;
char cCommand[100];
char cBuffer[100];
char cEnter;
double dPwrAvgArray[MAX_POINTS];
ViUInt32 iHeaderLength,
*/
/* header is "#nyyy..." n is number of chars in yyy,
/* yyy is the total data length in bytes
/* iArrayLength is number of bytes of data
iArrayLength,
*/
*/
iTermLength = 1,
/* the response message includes a LF character
iBlockSize,
/* number of bytes expected in one trace definite block
iTotalRetCount;
/* total number of bytes actually transferred
*/
*/
*/
ViSession defaultRM, viESA;
/* reserve space for the header, data and terminator
*/
ViChar cInBuffer[sizeof("#nyyyyl") + (MAX_POINTS * DATA_LENGTH) ];
ViChar cOutBuffer[sizeof("TRAC:DATA TRACE2,#nyyyyl") + (MAX_POINTS * DATA_LENGTH
) ];
/******************
Calculate length byte in block header
Chapter 17
271
ESA Programming Examples
int iNumTraces = NUM_TRACES,/* number of traces to average
*/
iRbw = RBW,
/* resolution bandwidth
iNumPoints = NUM_POINTS,/* actual number of trace points per sweep
*/
iSpan = SPAN,
/* Analyzer Frequency Span in MHz
iCenter = CENTER;
/* Analyzer Center frequency in MHz
*/
ESA Programming Examples
Using C to Make Faster Power Averaging Measurements
***********************/
int HeaderLength(int iArrayLength)
int iHeaderLength;
iHeaderLength = 3;
{
/* iArrayLength >0 plus increment for "#" and
"n"
*/
ESA Programming Examples
while ( (iArrayLength = (iArrayLength / 10)) > 0 )
iHeaderLength++;
}
{
return(iHeaderLength);
}
/*******************
prepare ESA for measurement
************************/
void setup() {
viPrintf(viESA, ":SENS:FREQ:CENT %i MHz\n", iCenter);
viPrintf(viESA,":SENS:FREQ:SPAN %i MHZ\n", iSpan);
viPrintf(viESA, ":SENS:BAND %i KHZ\n", iRbw);
/* use the sampling detector for power-average calculations
viPrintf(viESA, ":DET SAMP\n");
*/
/* Turn off analog output of option board to maximize measurement rate
viPrintf(viESA, ":SYST:PORT:IFVS:ENAB OFF\n");
*/
/* Turn auto align off to maximize measurement rate
viPrintf(viESA, ":CAL:AUTO OFF\n");
*/
/* set requested number of points
viPrintf(viESA, ":SWE:POINTS %i\n", NUM_POINTS);
*/
printf("This program will measure and calculate\n");
printf ("the power average of %i %i-point
traces.\n",iNumTraces,iNumPoints);
/* Turn on 50 MHz amplitude reference signal
viPrintf(viESA, ":CAL:SOUR:STAT ON\n");
/* Identify the instrument and get the model number
viQueryf(viESA, "*IDN?\n", "%t", &cBuffer);
*/
*/
iResult = (strncmp( cBuffer, hpESA_IDN_E4401B, strlen(hpESA_IDN_E4401B)) &&
strncmp( cBuffer, hpESA_IDN_E4411B, strlen(hpESA_IDN_E4411B)) && strncmp( cBuffer,
hpEMC_IDN_E7401A, strlen(hpEMC_IDN_E7401A)));
if( iResult == 0 )
272
Chapter 17
ESA Programming Examples
Using C to Make Faster Power Averaging Measurements
ESA Programming Examples
{
/*Set the input port to the 50MHz amplitude reference for the models*/
/*E4401B, E4411B and E7401A*/
viPrintf(viESA,":DISP:WIND:TRAC:Y:RLEV -25 DBM\n");
viPrintf(viESA,"CAL:SOUR:STAT ON \n");
}
else
{
/* For the analyzers having frequency limits >= 3GHz, prompt the user*/
/* to connect the amplitude reference output to the input*/
printf ("Connect AMPTD REF OUT to the INPUT \n");
printf ("......Press Return to continue \n");
scanf( "%c",&cEnter);
/*Externally route the 50MHz Signal*/
viPrintf(viESA, ":DISP:WIND:TRAC:Y:RLEV -20 DBM\n");
viPrintf(viESA,"CAL:SOUR:STAT ON \n");
}
/* Single sweep mode
viPrintf(viESA, ":INIT:CONT OFF\n");
*/
/* Turn off the local display to maximize measurement rate
if(!DISPLAY)
{
viPrintf(viESA, ":DISP:ENAB OFF\n");
}
*/
/* transfer data in definite length,32 bit integer blocks. Select
/* machine units (milli-dBm) to maximize measurement rate
viPrintf(viESA, ":FORM:DATA INT,32\n" );
*/
*/
/* select the byte order; low-byte first for Intel platforms
/* To further increase measurement rate,:FORM:BORD NORM could
/* be used instead. The byte ordering would then need to be
/* done within this program.
viPrintf(viESA, ":FORM:BORD SWAP\n");
*/
*/
*/
*/
/* pre-calculate amount of data to be transferred per measurement
iTermLength = 1;
iArrayLength = iNumPoints * DATA_LENGTH;
iHeaderLength = HeaderLength(iArrayLength);
iBlockSize = iHeaderLength + iArrayLength + iTermLength;
*/
}
Chapter 17
273
ESA Programming Examples
Using C to Make Faster Power Averaging Measurements
/****************
Write binary trace data to ESA
*******************/
void write_binary_trace(char *cScpiCommand, int *ipTraceData)
{
ESA Programming Examples
/*
trace data must point to an integer array of size NUM_POINTS
memcpy(&cOutBuffer[strlen(cScpiCommand)], ipTraceData, iArrayLength);
memcpy(&cOutBuffer, cScpiCommand, strlen(cScpiCommand));
/* Add a <newline> to the end of the data, This isn’t necessary
/* if the GPIB card has been configured to assert EOI when the last
/* character is sent, but it ensures a valid iTermLength is provided.
cOutBuffer[iArrayLength + strlen(cScpiCommand)] = 0x0A;
iBlockSize = (strlen(cScpiCommand) + iArrayLength + 1);
viWrite(viESA,(ViBuf) cOutBuffer, iBlockSize, &lRetCount );
*/
*/
*/
*/
}
/*******
Measure and calculate power-average of multiple measurements
*********/
void average() {
int i=0, iLoop=0;
int iArray[NUM_POINTS];
long lOpc =0L;
double dLogTen = log(10.0);
setup();
iTotalRetCount = lRetCount = 0;
/* start the timer
ftime( &start_time );
*/
/* Now run through the event loop iNumTraces times
for(i=0; i<iNumTraces; i++)
{
*/
/* trigger a new measurement and wait for complete
viPrintf(viESA, ":INIT:IMM;*WAI\n");
*/
/* Read the trace data into a buffer
viPrintf(viESA, ":TRAC:DATA? TRACE1\n");
viRead(viESA,(ViBuf) cInBuffer, (ViUInt32) iBlockSize, &lRetCount );
iTotalRetCount += lRetCount;
*/
/* copy trace data to an array,
/* byte order swapping could be done here rather than in ESA
memcpy(iArray, &cInBuffer[iHeaderLength], iArrayLength);
*/
*/
274
Chapter 17
ESA Programming Examples
Using C to Make Faster Power Averaging Measurements
*/
*/
*/
/* stop the timer
ftime( &stop_time );
*/
/* Calculate elapsed time
if (start_time.millitm > stop_time.millitm) {
stop_time.millitm += 1000;
stop_time.time--;
}
elapsed_time.millitm = stop_time.millitm - start_time.millitm;
elapsed_time.time = stop_time.time - start_time.time;
*/
/* This is measurement time in milliseconds
dDelta = (1000.0 * elapsed_time.time) + (elapsed_time.millitm);
*/
/* show measurement statistics
*/
dTimePer=dDelta/((float)iNumTraces);
printf("\tPower average of %i %i-point traces performed in %3.1f
seconds\n",iNumTraces,iNumPoints,dDelta/1000);
printf("\t%6.1f milliseconds per averaged measurement\n",dTimePer);
printf("\t%6.1f averaged measurements per second\n",1000.0/dTimePer);
printf("\t%i bytes transferred per trace, %i bytes total\n\n",lRetCount,
iTotalRetCount);
return;
}
/********************************
void main(void) {
int iLoop;
int iAvgArray[NUM_POINTS];
ViStatus viStatus;
Main
/* Open a GPIB session at address 18
viStatus = viOpenDefaultRM(&defaultRM);
Chapter 17
******************************/
*/
275
ESA Programming Examples
}
/* calculate a running dPower-average
for(iLoop = 0; iLoop < NUM_POINTS; iLoop++) {
/* running average of dPower, in milliwatts
dPower = exp( dLogTen * (iArray[iLoop]/10000.0));
if(i > 0)
{
dPwrAvgArray[iLoop] += ((dPower - dPwrAvgArray[iLoop])/(i+1));
}
else
{
dPwrAvgArray[iLoop] = dPower;
}
}
/* end of event loop
ESA Programming Examples
Using C to Make Faster Power Averaging Measurements
viStatus = viOpen(defaultRM,"GPIB0::18",VI_NULL,VI_NULL,&viESA);
if(viStatus)
{
printf("Could not open a session to GPIB device at address 18!\n");
exit(0);
}
ESA Programming Examples
/*Clear the Instrument
viClear(viESA);
*/
/* go to known instrument state with cleared status byte
viPrintf(viESA, ":SYST:PRES:TYPE FACT;*RST\n");
*/
/* measure, transfer and calculate power average of multiple traces
average();
*/
/* convert average power array back to integer array
for (iLoop = 0; iLoop < iNumPoints; iLoop++)
{
dPower = 10.0 * log10( dPwrAvgArray[iLoop]);
iAvgArray[iLoop] = (int) (1000.0 * dPower);
}
*/
/* build ’TRAC:DATA TRACE2,#nyyy’ header and write the result to Trace 2
sprintf(cCommand,":TRAC:DATA TRACE2,#%i%i", HeaderLength(iArrayLength)-2,
iArrayLength);
write_binary_trace(cCommand, iAvgArray);
*/
/* enable the trace, local display and return to continuous sweep
viPrintf(viESA,":TRACE2:MODE VIEW;:DISP:ENAB ON;:INIT:CONT ON\n");
*/
/* Close session
viClose(viESA);
viClose(defaultRM);
*/
} /*****************************
276
End of Main
*******************************/
Chapter 17
PSA Programming Examples
18
PSA Programming Examples
277
PSA Programming Examples
Examples Included in this Chapter:
Examples Included in this Chapter:
• “Using C with Marker Peak Search and Peak Excursion
Measurement Routines” on page 280
• “Using C for Saving and Recalling Instrument State Data” on page
283
• “Using C to Save Binary Trace Data” on page 287
• “Using C to Make a Power Calibration Measurement for a GSM
Mobile Handset” on page 291
• “Using C with the CALCulate:DATA:COMPress? RMS Command”
on page 297
• “Using C Over Socket LAN (UNIX)” on page 303
• “Using C Over Socket LAN (Windows NT)” on page 323
• “Using Java Programming Over Socket LAN” on page 326
• “Using the VXI Plug-N-Play Driver in LabVIEW®” on page 335
• “Using LabVIEW® 6 to Make an EDGE GSM Measurement” on
page 336
PSA Programming Examples
• “Using Visual Basic® .NET with the IVI-Com Driver” on page 338
• “Using Agilent VEE to Capture the Equivalent SCPI Learn String”
on page 342
LabVIEW is a registered trademark of National Instruments
Corporation.
Visual Basic is a registered trademark of Microsoft Corporation.
278
Chapter 18
PSA Programming Examples
Programming Examples Information and Requirements
Programming Examples Information and
Requirements
• The programming examples were written for use on an IBM
compatible PC.
• The programming examples use C, Visual Basic and LabVIEW
programming languages.
• There are examples using GPIB and LAN interfaces.
• Many of the examples use the SCPI programming commands,
though there are some that use the plug&play or IVI.com drivers.
• Most of the examples are written in C using the Agilent VISA
transition library.
The VISA transition library must be installed and the GPIB card
configured. The Agilent I/O libraries contain the latest VISA
transition library and is available at: www.agilent.com/iolib
PSA Programming Examples
Chapter 18
279
PSA Programming Examples
Using C with Marker Peak Search and Peak Excursion Measurement
Routines
Using C with Marker Peak Search and Peak
Excursion Measurement Routines
This C programming example (peaksrch.c) can be found on the
Documentation CD.
/************************************************************/
/* peaksrch.c
*/
/* Agilent Technologies 2001
*/
/*
*/
/* Using Marker Peak Search and Peak Excursion
*/
/*
*/
/* This example is for the E444xA PSA Spectrum Analyzers
*/
PSA Programming Examples
/*
*/
/* This C programming example does the following.
*/
/*
*/
/* - Open a GPIB session at address 18
*/
/* - Select Spectrum Analysis Mode
*/
/* - Reset & Clear the Analyzer
*/
/* - Set the analyzer center frequency and span
*/
/* - Set the input port to the 50 MHz amplitude reference
*/
/* - Set the analyzer to single sweep mode
*/
/* - Prompt the user for peak excursion level in dBm
*/
/* - Set the peak threshold to user defined level
*/
/* - Trigger a sweep and wait for sweep to complete
*/
/* - Set the marker to the maximum peak
*/
/* - Query and read the marker frequency and amplitude
*/
/* - Close the session
*/
/************************************************************/
#include <windows.h>
#include <stdio.h>
#include "visa.h"
ViSession defaultRM, viPSA;
ViStatus
errStatus;
280
Chapter 18
PSA Programming Examples
Using C with Marker Peak Search and Peak Excursion Measurement
Routines
void main()
{
/*Program Variables*/
ViStatus viStatus
= 0;
char cEnter = 0;
int
iResult = 0;
double dMarkerFreq = 0;
double dMarkerAmpl = 0;
float fPeakExcursion =0;
long lOpc = 0L;
char *psaSetup =
// PSA setup initialization
":INST SA;"
"*RST;*CLS;"
// Change to Spectrum Analysis mode
// Reset the device and clear status
":SENS:FREQ:CENT 50 MHz;"// Set center freq to 50 MHz
":SENS:FREQ:SPAN 50 MHz;"// Set freq span to 50 MHz
":SENS:FEED AREF;"// Set input port to internal 50 MHz ref
":INIT:CONT 0;"// Set analyzer to single sweep mode
PSA Programming Examples
":CALC:MARK:PEAK:THR -90";// Set the peak thresold to -90 dBm
/*Open a GPIB session at address 18.*/
viStatus=viOpenDefaultRM(&defaultRM);
viStatus=viOpen(defaultRM,"GPIB0::18",VI_NULL,VI_NULL,&viPSA);
if(viStatus)
{
printf("Could not open a session to GPIB device at address 18!\n");
exit(0);
}
/*Display the program heading */
printf("\n\t\t Marker Program \n\n" );
/* Send setup commands to instrument */
viPrintf(viPSA,"%s\n",psaSetup);
Chapter 18
281
PSA Programming Examples
Using C with Marker Peak Search and Peak Excursion Measurement
Routines
/*User enters the peak excursion value */
printf("\t Enter PEAK EXCURSION level in dBm:
");
scanf( "%f",&fPeakExcursion);
/*Set the peak excursion*/
viPrintf(viPSA,"CALC:MARK:PEAK:EXC %1fDB \n",fPeakExcursion);
/*Trigger a sweep and wait for completion*/
viPrintf(viPSA,"INIT:IMM;*WAI\n");
/*Set the marker to the maximum peak*/
viPrintf(viPSA,"CALC:MARK:MAX \n");
/*Query and read the marker frequency*/
viQueryf(viPSA,"CALC:MARK:X? \n","%lf",&dMarkerFreq);
printf("\n\t RESULT: Marker Frequency is: %lf MHz \n\n",dMarkerFreq/10e5);
PSA Programming Examples
/*Query and read the marker amplitude*/
viQueryf(viPSA,"CALC:MARK:Y?\n","%lf",&dMarkerAmpl);
printf("\t RESULT: Marker Amplitude is: %lf dBm \n\n",dMarkerAmpl);
/*Close the session*/
viClose(viPSA);
viClose(defaultRM);
}
282
Chapter 18
PSA Programming Examples
Using C for Saving and Recalling Instrument State Data
Using C for Saving and Recalling Instrument
State Data
This C programming example (State.c) can be found on the
Documentation CD.
/***************************************************************************
*
State.c
*
Agilent Technologies 2001
*
*
PSA Series Transmitter Tester using VISA for I/O
*
This program shows how to save and recall a state of the instrument
*
*******************************************************************************/
#include <stdio.h>
#include <stdlib.h>
#include <conio.h>
#include "visa.h"
PSA Programming Examples
void main ()
{
/*program variables*/
ViSession defaultRM, viVSA;
ViStatus viStatus= 0;
/*open session to GPIB device at address 18 */
viStatus=viOpenDefaultRM (&defaultRM);
viStatus=viOpen (defaultRM, "GPIB0::18::INSTR", VI_NULL,VI_NULL, &viVSA);
/*check opening session sucess*/
if(viStatus)
{
printf("Could not open a session to GPIB device at address 18!\n");
exit(0);
}
Chapter 18
283
PSA Programming Examples
Using C for Saving and Recalling Instrument State Data
/*set the instrument to SA mode*/
viPrintf(viVSA, "INST SA\n");
/*reset the instrument */
viPrintf(viVSA, "*RST\n");
/*set the input port to the internal 50Mhz reference source*/
viPrintf(viVSA, "SENS:FEED AREF\n");
/*tune the analyzer to 50MHZ*/
viPrintf(viVSA, "SENS:FREQ:CENT 50E6\n");
/*change the span*/
viPrintf(viVSA, "SENS:FREQ:SPAN 10 MHZ\n");
/*turn the display line on*/
viPrintf(viVSA, "DISP:WIND:TRACE:Y:DLINE:STATE ON\n");
PSA Programming Examples
/*change the resolution bandwidth*/
viPrintf(viVSA, "SENS:SPEC:BAND:RES 100E3\n");
/*change the Y Axis Scale/Div*/
viPrintf(viVSA, "DISP:WIND:TRAC:Y:SCAL:PDIV 5\n");
/*Change the display refernece level*/
viPrintf(viVSA, "DISP:WIND:TRAC:Y:SCAL:RLEV -15\n");
/*trigger the instrument*/
viPrintf(viVSA, "INIT:IMM;*WAI\n");
/*save this state in register 10.
!!!Carefull this will overwrite register 10*/
viPrintf(viVSA, "*SAV 10\n");
/*display message*/
284
Chapter 18
PSA Programming Examples
Using C for Saving and Recalling Instrument State Data
printf("PSA Programming example showing *SAV,*RCL SCPI commands\n");
printf("used to save instrument state\n\t\t------------------------");
printf("\n\nThe instrument state has been saved to an internal register\n");
printf("Please observe the display and notice the signal shape\n");
printf("Then press any key to reset the
instrument\n\t\t------------------------");
/*wait for any key to be pressed*/
getch();
/*reset the instrument */
viPrintf(viVSA, "*RST\n");
/*set again the input port to the internal 50Mhz reference source*/
viPrintf(viVSA, "SENS:FEED AREF\n");
/*display message*/
printf("\n\nThe instrument was reset to the factory default setting\n");
printf("Notice the abscence of the signal on the display\n");
PSA Programming Examples
printf("Press any key to recall the saved
state\n\t\t------------------------");
/*wait for any key to be pressed*/
getch();
/*recall the state saved in register 10*/
viPrintf(viVSA, "*RCL 10\n");
/*display message*/
printf("\n\nNotice the previous saved instrument settings were restored\n");
printf("Press any key to terminate the
program\n\t\t------------------------\n\n");
/*wait for any key to be pressed*/
getch();
/*reset the instrument */
Chapter 18
285
PSA Programming Examples
Using C for Saving and Recalling Instrument State Data
viPrintf(viVSA, "*RST;*wai\n");
/*Set the instrument to continuous sweep */
viPrintf(viVSA, "INIT:CONT 1\n");
/* close session */
viClose (viVSA);
viClose (defaultRM);
PSA Programming Examples
}
286
Chapter 18
PSA Programming Examples
Using C to Save Binary Trace Data
Using C to Save Binary Trace Data
This C programming example (Trace.c) can be found on the
Documentation CD.
This example uses Option B7J.
/***************************************************************************
*
Trace.c
*
Agilent Technologies 2001
*
*
Instrument Requirements:
*
E444xA with option B7J and firmware version >= A.02.00 or
*
E4406A with firmware version >= A.05.00
*
*
This Program shows how to get and save binary trace data in Basic mode
*
The results are saved to C:\trace.txt
*****************************************************************************/
#include <stdio.h>
#include <stdlib.h>
PSA Programming Examples
#include <windows.h>
#include "visa.h"
void main ()
{
/*program variable*/
ViSession defaultRM, viPSA;
ViStatus viStatus= 0;
char sBuffer[80]= {0};
char dummyvar;
FILE *fTraceFile;
long lNumberPoints= 0;
long lNumberBytes= 0;
long lLength= 0;
long i = 0;
long lOpc = 0L;
unsigned long lBytesRetrieved;
Chapter 18
287
PSA Programming Examples
Using C to Save Binary Trace Data
ViReal64 adTraceArray[10240];
char *psaSetup =/* setup commands for VSA/PSA */
":INST BASIC;"/* Set the instrument mode to Basic */
"*RST;*CLS;"/* Reset the device and clear status */
":INIT:CONT 0;"/* Set analyzer to single measurement mode */
":FEED AREF;"/* set the input port to the internal
50MHz reference source */
":DISP:FORM:ZOOM1;"/* zoom the spectrum display */
":FREQ:CENT 50E6;"/* tune the analyzer to 50MHz */
":FORM REAL,64;"/* Set the ouput format to a binary format */
":FORM:BORD SWAP;"/* set the binary byte order to SWAP (for PC) */
":INIT:IMM;";/* trigger a spectrum measurement */
/*open session to GPIB device at address 18 */
viStatus=viOpenDefaultRM (&defaultRM);
viStatus=viOpen (defaultRM, "GPIB0::18::INSTR", VI_NULL,VI_NULL, &viPSA);
PSA Programming Examples
/*check opening session sucess*/
if(viStatus)
{
printf("Could not open a session to GPIB device at address 18!\n");
exit(0);
}
/* Set I/O timeout to ten seconds */
viSetAttribute(viPSA,VI_ATTR_TMO_VALUE,10000);
/* Send setup commands to instrument */
viPrintf(viPSA,"%s\n",vsaSetup);
/* Query the instrument for Operation complete */
viQueryf(viPSA,"*OPC?\n", "%d", &lOpc);
/* fetch the spectrum trace data*/
viPrintf(viPSA,"FETC:SPEC7?\n");
288
Chapter 18
PSA Programming Examples
Using C to Save Binary Trace Data
/*print message to the standard output*/
printf("Getting the spectrum trace in binary format...\nPlease wait...\n\n");
/* get number of bytes in length of postceeding trace data
and put this in sBuffer*/
viRead (viPSA,(ViBuf)sBuffer,2,&lBytesRetrieved);
/* Put the trace data into sBuffer */
viRead (viPSA,(ViBuf)sBuffer,sBuffer[1] - ’0’,&lBytesRetrieved);
/* append a null to sBuffer */
sBuffer[lBytesRetrieved] = 0;
/* convert sBuffer from ASCII to integer */
lNumberBytes = atoi(sBuffer);
/* calculate the number of points given the number of byte in the trace
REAL 64 binary format means each number is represented by 8 bytes*/
PSA Programming Examples
lNumberPoints = lNumberBytes/sizeof(ViReal64);
/*get and save trace in data array */
viRead (viPSA,(ViBuf)adTraceArray,lNumberBytes,&lBytesRetrieved);
/* read the terminator character and discard */
viRead (viPSA,(ViBuf)sBuffer,1, &lLength);
/*print message to the standard output*/
printf("Querying instrument to see if any errors in Queue.\n");
/* loop until all errors read */
do
{
viPrintf (viPSA,"SYST:ERR?\n");/* check for errors */
viRead (viPSA,(ViBuf)sBuffer,80,&lLength);/* read back last error message
*/
Chapter 18
289
PSA Programming Examples
Using C to Save Binary Trace Data
sBuffer[lLength] = 0;
printf("%s\n",sBuffer);
/* append a null to byte count */
/* print error buffer to display */
} while (sBuffer[1] != ’0’);
/* set the analyzer to continuous mode for manual use */
viPrintf(viPSA, "INIT:CONT 1\n");
/*save trace data to an ASCII file*/
fTraceFile=fopen("C:\\Trace.txt","w");
fprintf(fTraceFile,"Trace.exe Output\nAgilent Technologies 2001\n\n");
fprintf(fTraceFile,"List of %d points of the averaged spectrum
trace:\n\n",lNumberPoints);
for (i=0;i<lNumberPoints;i++)
fprintf(fTraceFile,"\tAmplitude of point[%d] = %.2lf
dBm\n",i+1,adTraceArray[i]);
fclose(fTraceFile);
/*print message to the standard output*/
PSA Programming Examples
printf("The %d trace points were saved to C:\\Trace.txt
file\n\n",lNumberPoints);
/* Send message to standard output */
printf("\nPress Enter to set analyzer’s input port back to RF.\n");
scanf("%c",&dummyvar);
/* set the input port to RF */
viPrintf(viPSA, "feed rf\n");
/* Close session */
viClose (viPSA);
viClose (defaultRM);
}
290
Chapter 18
PSA Programming Examples
Using C to Make a Power Calibration Measurement for a GSM Mobile
Handset
Using C to Make a Power Calibration
Measurement for a GSM Mobile Handset
This C programming example (powercal.c) can be found on the
Documentation CD.
This program uses Basic mode which is optional -B7J- in the PSA
Series spectrum analyzers and is standard in the E4406A Vector Signal
Analyzer. It uses the Waveform measurement with the
CALC:DATA2:COMP? DME command to return the power of 75
consecutive GSM/EDGE bursts. The DME (dB Mean) parameter
returns the average of the dB trace values. The DME parameter is only
available in later version of instrument firmware ≥ A.05.00 for PSA and
≥ A.07.00 for VSA. Earlier instruments see the “Using C with the
CALCulate:DATA:COMPress? RMS Command” example.
This program also demonstrates how to serial poll the "Waiting for
Trigger" status bit to determine when to initiate the GSM phone. The
data results are placed in an ASCII file (powercal.txt).
The program can also be adapted to perform W-CDMA Downlink Power
Control measurements in the code domain power Symbol Power view.
In essence, you can average any stepped power measurement trace
using this method.
*
powercal.c
*
Agilent Technologies 2003
*
*
This program demonstrates the process of using the Waveform
*
measurement and the CALC:DATA2:COMP? DME command to return the power
*
of 75 consecutive GSM/EDGE bursts.
*
The DME (db Mean) parameter returns the average of the dB trace values.
*
*
This program also demonstrates how to serial poll the "Waiting
*
for Trigger" Status bit to determine when to initiate the GSM phone
*
The data results are placed in an ASCII file, powercal.txt
*
*
This program can also be adapted to perform W-CDMA Downlink PowerControl
*
measurements in the Code Domain Power Symbol Power View.
*
you can average any stepped power measurement trace using this method.
In essence,
*
Chapter 18
291
PSA Programming Examples
/********************************************************************************
PSA Programming Examples
Using C to Make a Power Calibration Measurement for a GSM Mobile
Handset
*
Instrument Requirements:
*
E444xA with option B7J and firmware version >= A.05.00 or
*
E4406A with firmware version >= A.07.00 or
*
*
Signal Source Setup:
*
Set up GSM/EDGE frame for either 1, 2, 4, or eight slots per frame.
*
When configuring two slots per frame, turn on slots 1 and 5
*
When configuring four slots per frame, turn on slots 1,3,5, and 7.
*
Set frame repeat to Single.
*
Set the signal amplitude to -5 dBm.
*
Set the signal source frequency to 935.2 MHz
*
*
*
CALC:DATA2:COMP? DME parameters:
soffset = 25us (This avoids averaging data points when the burst
*
is transitioning on.)
*
length = 526us (Period over which the power of the burst is averaged)
*
roffset = 4.6153846 ms / slots per frame (Repitition interval of burst)
PSA Programming Examples
**********************************************************************************
****/
#include <stdio.h>
#include <stdlib.h>
#include <windows.h>
#include <math.h>
#include "c:\program files\visa\winnt\include\visa.h"
void main ()
{
/*program variable*/
ViSession defaultRM, viVSA;
ViStatus viStatus= 0;
ViUInt16 stb;
FILE *fDataFile;
long lthrowaway,lbursts;
long lNumberPoints= 0;
long lNumberBytes= 0;
long lLength
= 0;
292
Chapter 18
PSA Programming Examples
Using C to Make a Power Calibration Measurement for a GSM Mobile
Handset
long i
= 0;
long lOpc = 0L;
double sweeptime
= 0;
double burstinterval= 0;
unsigned long lBytesRetrieved;
ViReal64 adDataArray[100];
char sBuffer[80]= {0};
char *basicSetup = // measurement setup commands for VSA/PSA
":INST:SEL BASIC;"// Put the instrument in Basic Mode
"*RST; "// Preset the instrument
"*CLS;
"//Clear the status byte
":STAT:OPER:ENAB 32;"
//Enable Status Operation
":DISP:ENAB 0;"// Turn the Display off (improves Speed)
":FORM REAL,64;"// Set the ouput format to binary
":FORM:BORD SWAP;"// set the binary byte order to SWAP (for PC)
":CONF:WAV;"// Changes measurement to Waveform
":INIT:CONT 0;"// Puts instrument in single measurement mode
":CAL:AUTO OFF;"//Turn auto align off
PSA Programming Examples
":FREQ:CENTER 935.2MHz;"//Set Center Freq to 935.2MHz
":WAV:ACQ:PACK MED;"//Set DataPacking to Medium
":WAV:BAND:TYPE FLAT;"//Select Flattop RBW Filter
":WAV:DEC:FACT 4;"//Set Decimation Factor to 4
":WAV:DEC:STAT ON;"//Turn Decimation On
":DISP:WAV:WIND1:TRAC:Y:RLEV 5;" //Set referance level to 5 dBm
":WAV:BWID:RES 300kHz;"//Set Res bandwith filter to 300kHz
":POW:RF:ATT 5;"//Set 5dB of internal attenuation
":WAV:ADC:RANG P0;"//Set ADC Range to P0, This is
//necessary to prevent autoranging
":WAV:TRIG:SOUR IF;"//Set Trigger source to IF burst
":TRIG:SEQ:IF:LEV -20;";//Set IF Trig level to -20dB
/*open session to GPIB device at address 18 */
viStatus=viOpenDefaultRM (&defaultRM);
viStatus=viOpen (defaultRM, "GPIB0::18", VI_NULL,VI_NULL,&viVSA);
Chapter 18
293
PSA Programming Examples
Using C to Make a Power Calibration Measurement for a GSM Mobile
Handset
/*check opening session sucess*/
if(viStatus)
{
printf("Could not open a session to GPIB device at address 18!\n");
exit(0);
}
/* Set I/O timeout to ten seconds */
viSetAttribute(viVSA,VI_ATTR_TMO_VALUE,10000);
viClear(viVSA);//send device clear to instrument
/*print message to the standard output*/
printf("Enter number of bursts per frame (1,2,4 or 8): ");
scanf( "%ld",&lbursts);
/* Send setup commands to instrument */
PSA Programming Examples
viPrintf(viVSA,"%s\n",basicSetup);
/* Calculate sweep time and set it*/
burstinterval = 4.6153846 / 1000.00 / lbursts;
sweeptime= burstinterval * 75.0;
viPrintf(viVSA,":WAV:SWE:TIME %fs\n",sweeptime);
/* Clear status event register */
viQueryf(viVSA,"STAT:OPER:EVENT?\n","%ld",<hrowaway);
/* Initiate the waveform measurement and get the instrument ready
to calculate the mean RMS I/Q voltage in each burst
(We will convert these discreate values into Mean dBm Power values) */
viPrintf(viVSA,"INIT:IMM\n");
/* Serial poll the instrument to determine when it is waiting for
trigger and the GSM phone can be told to send its 75 bursts. */
294
Chapter 18
PSA Programming Examples
Using C to Make a Power Calibration Measurement for a GSM Mobile
Handset
while(1)
{
viReadSTB(viVSA,&stb);
//read status byte
if (stb & 128) break;
//look for "waiting for trigger" bit
printf("Waiting on Analyzer...\n");
Sleep (50); // wait 50 ms between each serial poll
}
/*print message to the standard output*/
printf("Analyzer is Ready!\n\nWaiting for phone to trigger...\n\n");
/*Querry for Operation Complete */
viQueryf(viVSA,"*OPC?\n", "%d", &lOpc);
/*Use the CALC:DATA0:COMP command to return the average power in each burst*/
viPrintf(viVSA,":CALC:DATA2:COMP? DME,25E-6,526E-6,%f\n",burstinterval);
/* get number of bytes in length of postceeding data and put this in sBuffer*/
viRead (viVSA,(ViBuf)sBuffer,2,&lBytesRetrieved);
PSA Programming Examples
printf("Getting the burst data in binary format...\n\n");
/* Put the returned data into sBuffer */
viRead (viVSA,(ViBuf)sBuffer,sBuffer[1] - ’0’,&lBytesRetrieved);
/* append a null to sBuffer */
sBuffer[lBytesRetrieved] = 0;
/* convert sBuffer from ASCII to integer */
lNumberBytes = atoi(sBuffer);
/*calculate the number of returned values given the number of bytes.
REAL 64 binary data means each number is represented by 8 bytes */
lNumberPoints = lNumberBytes/sizeof(ViReal64);
/*get and save returned data into an array */
viRead (viVSA,(ViBuf)adDataArray,lNumberBytes,&lBytesRetrieved);
Chapter 18
295
PSA Programming Examples
Using C to Make a Power Calibration Measurement for a GSM Mobile
Handset
/* read the terminator character and discard */
viRead (viVSA,(ViBuf)sBuffer,1, <hrowaway);
/*print message to the standard output*/
printf("Querying instrument to see if any errors in Queue.\n");
/* loop until all errors read */
do
{
viPrintf (viVSA,"SYST:ERR?\n");
/* check for errors */
viRead (viVSA,(ViBuf)sBuffer,80,&lLength);/* read back last error message */
sBuffer[lLength] = 0;
printf("%s\n",sBuffer);
/* append a null to byte count */
/* print error buffer to display */
} while (sBuffer[1] != ’0’);
/* Turn the Display of the instrument back on */
PSA Programming Examples
viPrintf(viVSA,"DISP:ENAB 1\n");
/*save result data to an ASCII file*/
fDataFile=fopen("powercal.txt","w");
fprintf(fDataFile,"powercal.exe Output\nAgilent Technologies 2003\n\n");
fprintf(fDataFile,"Power of %d GSM/EDGE bursts:\n",lNumberPoints);
fprintf(fDataFile,"(%d burst(s) per frame):\n\n",lbursts);
for (i=0;i<lNumberPoints;i++)
{
fprintf(fDataFile,"\tPower of burst[%d] = %.2lf dBm\n",i+1,adDataArray[i]);
}
fclose(fDataFile);
/*print message to the standard output*/
printf("The %d burst powers were saved to powercal.txt
file.\n\n",lNumberPoints);
viClose (viVSA);
viClose (defaultRM);
}
296
Chapter 18
PSA Programming Examples
Using C with the CALCulate:DATA:COMPress? RMS Command
Using C with the CALCulate:DATA:COMPress?
RMS Command
This C programming example (calcomp.c) can be found on the
Documentation CD.
This program uses the CALCulate:DATA:COMPress? RMS command to
average the voltage trace data to calculate power of consecutive GSM
bursts. Older instrument firmware does not support the newer DME
parameter described in the previous example. You will have to use the
technique in this example to calculate the dB mean. This example uses
the Waveform measurement in the Basic mode. Basic mode is optional
-B7J- in the PSA Series spectrum analyzers and is standard in the
E4406A Vector Signal Analyzer.
The CALC:DATA2:COMP? RMS command is used to return the power of 1
to 150 consecutive GSM/EDGE bursts. The RMS parameter returns the
average of the voltage trace values. These measured values are then
converted to dBm values.
This program also demonstrates how to serial poll Serial poll the
instrument to determine when the Message Available status bit is set.
/**************************************************************************
calcomp.c
Agilent Technologies 2001
PSA Programming Examples
*
*
*
This program demonstrates the process of using the Waveform
*
measurement and the CALC:DATA0:COMP? RMS command to return the power
*
of 1 to 450 consecutive GSM/EDGE bursts (one burst per frame).
*
The data results are placed in an ASCII file, C:\calccomp.txt
*
*
Instrument Requirements:
*
E444xA with option B7J and firmware version >= A.02.00 or
*
E4406A with firmware version >= A.05.00 or
*
*
Signal Source Setup:
*
Turn on 1 slot per GSM/EDGE frame.
*
Set frame repeat to Continous.
*
Set the signal amplitude to -5 dBm.
*
Set the signal source frequency to 935.2 MHz
*
Chapter 18
297
PSA Programming Examples
Using C with the CALCulate:DATA:COMPress? RMS Command
*
*
CALC:DATA0:COMP? RMS parameters:
soffset = 25us (This avoids averaging data points when the burst
*
is transitioning on.)
*
length = 526us (Period over which the power of the burst is averaged)
*
roffset = 4.165 ms (Repition interval of burst.
*
For this example
it is equal to one GSM frame: 4.165 ms.)
*****************************************************************************/
#include <stdio.h>
#include <stdlib.h>
#include <windows.h>
#include <math.h>
#include "visa.h"
void main ()
{
/*program variable*/
ViSession defaultRM, viPSA;
ViStatus viStatus= 0;
PSA Programming Examples
ViUInt16 stb;
FILE *fDataFile;
long lthrowaway,lbursts;
long lNumberPoints= 0;
long lNumberBytes= 0;
long lLength
= 0;
long i
= 0;
long lOpc = 0L;
double sweeptime
= 0;
unsigned long lBytesRetrieved;
ViReal64 adDataArray[500];
ViReal64 adPowerArray[500];
char sBuffer[80]= {0};
char *basicSetup = // measurement setup commands for VSA/PSA
":INST:SEL BASIC;"// Put the instrument in Basic Mode
"*RST;"// Preset the instrument
"*CLS;"
//Clear the status byte
298
Chapter 18
PSA Programming Examples
Using C with the CALCulate:DATA:COMPress? RMS Command
":DISP:ENAB 0;"// Turn the Display off (improves Speed)
":FORM REAL,64;"// Set the ouput format to binary
":FORM:BORD SWAP;"// set the binary byte order to SWAP (for PC)
":CONF:WAV;"// Changes measurement to Waveform
":INIT:CONT 0;"// Puts instrument in single measurement mode
":CAL:AUTO OFF;"//Turn auto align off
":FREQ:CENTER 935.2MHz;"//Set Center Freq to 935.2MHz
":WAV:ACQ:PACK MED;"//Set DataPacking to Medium
":WAV:BAND:TYPE FLAT;"//Select Flattop RBW Filter
":WAV:DEC:FACT 4;"//Set Decimation Factor to 4
":WAV:DEC:STAT ON;"//Turn Decimation On
":DISP:WAV:WIND1:TRAC:Y:RLEV 5;" //Set referance level to 5 dBm
":WAV:BWID:RES 300kHz;"//Set Res bandwith filter to 300kHz
":POW:RF:ATT 5;"//Set 5dB of internal attenuation
":WAV:TRIG:SOUR IF;"//Set Trigger source to IF burst
":TRIG:SEQ:IF:LEV -20;";//Set IF Trig level to -20dB
/*open session to GPIB device at address 18 */
viStatus=viOpenDefaultRM (&defaultRM);
PSA Programming Examples
viStatus=viOpen (defaultRM, "GPIB0::18", VI_NULL,VI_NULL,&viPSA);
/*check opening session sucess*/
if(viStatus)
{
printf("Could not open a session to GPIB device at address 18!\n");
exit(0);
}
/* Set I/O timeout to ten seconds */
viSetAttribute(viPSA,VI_ATTR_TMO_VALUE,10000);
viClear(viPSA);//send device clear to instrument
/*print message to the standard output*/
printf("Enter number of bursts (1 to 450) to calculate mean power for:
");
scanf( "%ld",&lbursts);
Chapter 18
299
PSA Programming Examples
Using C with the CALCulate:DATA:COMPress? RMS Command
/* Send setup commands to instrument */
viPrintf(viPSA,"%s\n",basicSetup);
/* Calculate sweep time and set it*/
sweeptime=4.6153846*lbursts;
viPrintf(viPSA,":WAV:SWE:TIME %fms\n",sweeptime);
/* Clear status event register */
viQueryf(viPSA,"STAT:OPER:EVENT?\n","%ld",<hrowaway);
/* Initiate the waveform measurement */
viPrintf(viPSA,"INIT:IMM\n");
/* Query the instrument for Operation complete */
viQueryf(viPSA,"*OPC?\n", "%d", &lOpc);
/* Have the instrument calculate the mean RMS I/Q voltage in each burst
PSA Programming Examples
(We will convert these discreate values into Mean dBm Power values) */
viPrintf (viPSA, ":CALC:DATA0:COMP? rms,25E-6,526E-6,4.61538461538E-3\n");
/* Serial poll the instrument to determine when Message Available
Status Bit is set.
The instrument’s output buffer will then
contain the measurement results*/
i=0;
while(1)
{
i++;
viReadSTB(viPSA,&stb);
//read status byte
if (stb & 16) break;
//look for message available bit
Sleep (20);
// wait 100ms before polling again
}
/*print message to the standard output*/
printf("\nMessage Available statuts bit set after %ld serial poles.\n\n",i);
printf("Getting the burst data in binary format...\nPlease wait...\n\n");
300
Chapter 18
PSA Programming Examples
Using C with the CALCulate:DATA:COMPress? RMS Command
/* get number of bytes in length of postceeding data
and put this in sBuffer*/
viRead (viPSA,(ViBuf)sBuffer,2,&lBytesRetrieved);
/* Put the returned data into sBuffer */
viRead (viPSA,(ViBuf)sBuffer,sBuffer[1] - ’0’,&lBytesRetrieved);
/* append a null to sBuffer */
sBuffer[lBytesRetrieved] = 0;
/* convert sBuffer from ASCII to integer */
lNumberBytes = atoi(sBuffer);
/*calculate the number of returned values given the number of bytes.
REAL 64 binary data means each number is represented by 8 bytes */
lNumberPoints = lNumberBytes/sizeof(ViReal64);
/*get and save returned data into an array */
PSA Programming Examples
viRead (viPSA,(ViBuf)adDataArray,lNumberBytes,&lBytesRetrieved);
/* read the terminator character and discard */
viRead (viPSA,(ViBuf)sBuffer,1, <hrowaway);
/*print message to the standard output*/
printf("Querying instrument to see if any errors in Queue.\n");
/* loop until all errors read */
do
{
viPrintf (viPSA,"SYST:ERR?\n");
/* check for errors */
viRead (viPSA,(ViBuf)sBuffer,80,&lLength);/* read back last error message */
sBuffer[lLength] = 0;
printf("%s\n",sBuffer);
/* append a null to byte count */
/* print error buffer to display */
} while (sBuffer[1] != ’0’);
Chapter 18
301
PSA Programming Examples
Using C with the CALCulate:DATA:COMPress? RMS Command
/* Turn the Display of the instrument back on */
viPrintf(viPSA,"DISP:ENAB 1\n");
/*save result data to an ASCII file*/
fDataFile=fopen("C:\\calccomp.txt","w");
fprintf(fDataFile,"Calccomp.exe Output\nAgilent Technologies 2001\n\n");
fprintf(fDataFile,"Power of %d GSM/EDGE bursts:\n\n",lNumberPoints);
for (i=0;i<lNumberPoints;i++)
{
/* Convert RMS voltage for each burst to Mean Power in dBm */
adPowerArray[i]=10*log10(10*adDataArray[i]*adDataArray[i]);
fprintf(fDataFile,"\tPower of burst[%d] = %.2lf
dBm\n",i+1,adPowerArray[i]);
}
fclose(fDataFile);
/*print message to the standard output*/
PSA Programming Examples
printf("The %d burst powers were saved to C:\\calccomp.txt
file.\n\n",lNumberPoints);
viClose (viPSA);
viClose (defaultRM);
}
302
Chapter 18
PSA Programming Examples
Using C Over Socket LAN (UNIX)
Using C Over Socket LAN (UNIX)
This C programming example (socketio.c) compiles in the HP-UX UNIX
environment. It is portable to other UNIX environments with only
minor changes.
In UNIX, LAN communication via sockets is very similar to reading or
writing a file. The only difference is the openSocket() routine, which
uses a few network library routines to create the TCP/IP network
connection. Once this connection is created, the standard fread() and
fwrite() routines are used for network communication.
In Windows, the routines send() and recv() must be used, since
fread() and fwrite() may not work on sockets.
The program reads the analyzer’s host name from the command line,
followed by the SCPI command. It then opens a socket to the analyzer,
using port 5025, and sends the command. If the command appears to be
a query, the program queries the analyzer for a response, and prints the
response.
This example program can also be used as a utility to talk to your
analyzer from the command prompt on your UNIX workstation or
Windows 95 PC, or from within a script.
This program is also available on your documentation CD ROM.
PSA Programming Examples
/***************************************************************************
*
$Header: socketio.c,v 1.5 96/10/04 20:29:32 roger Exp $
*
$Revision: 1.5 $
*
$Date: 96/10/04 20:29:32 $
*
*
$Contributor:
LSID, MID $
$Description:
Functions to talk to an Agilent E4440A spectrum
*
*
*
analyzer via TCP/IP.
Uses command-line arguments.
*
*
A TCP/IP connection to port 5025 is established and
*
the resultant file descriptor is used to "talk" to the
*
instrument using regular socket I/O mechanisms. $
*
*
*
*
E4440A Examples:
Chapter 18
303
PSA Programming Examples
Using C Over Socket LAN (UNIX)
*
*
*
Query the center frequency:
lanio 15.4.43.5 ’sens:freq:cent?’
*
* Query X and Y values of marker 1 and marker 2 (assumes they are on):
*
lanio myinst ’calc:spec:mark1:x?;y?; :calc:spec:mark2:x?;y?’
*
*
Check for errors (gets one error):
*
lanio myinst ’syst:err?’
*
*
*
Send a list of commands from a file, and number them:
cat scpi_cmds | lanio -n myinst
*
****************************************************************************
*
*
PSA Programming Examples
*
This program compiles and runs under
- HP-UX 10.20 (UNIX), using HP cc or gcc:
*
+ cc -Aa
-O -o lanio
lanio.c
*
+ gcc -Wall -O -o lanio
lanio.c
*
*
- Windows 95, using Microsoft Visual C++ 4.0 Standard Edition
*
- Windows NT 3.51, using Microsoft Visual C++ 4.0
*
+ Be sure to add
WSOCK32.LIB
to your list of libraries!
*
+ Compile both lanio.c and getopt.c
*
+ Consider re-naming the files to lanio.cpp and getopt.cpp
*
*
*
Considerations:
- On UNIX systems, file I/O can be used on network sockets.
*
This makes programming very convenient, since routines like
*
getc(), fgets(), fscanf() and fprintf() can be used.
*
routines typically use the lower level read() and write() calls.
These
*
*
- In the Windows environment, file operations such as read(), write(),
*
and close() cannot be assumed to work correctly when applied to
*
sockets.
Instead, the functions send() and recv() MUST be used.
*/
304
Chapter 18
PSA Programming Examples
Using C Over Socket LAN (UNIX)
/* Support both Win32 and HP-UX UNIX environment */
#ifdef _WIN32
#
/* Visual C++ 4.0 will define this */
define WINSOCK
#endif
#ifndef WINSOCK
#
ifndef _HPUX_SOURCE
#
define _HPUX_SOURCE
#
endif
#endif
#include <stdio.h>
/* for fprintf and NULL
*/
#include <string.h>
/* for memcpy and memset */
#include <stdlib.h>
/* for malloc(), atol() */
#include <errno.h>
/* for strerror
*/
#ifdef WINSOCK
PSA Programming Examples
#include <windows.h>
#
ifndef _WINSOCKAPI_
#
include <winsock.h>
#
endif
// BSD-style socket functions
#else /* UNIX with BSD sockets */
#
include <sys/socket.h>
/* for connect and socket*/
#
include <netinet/in.h>
/* for sockaddr_in
*/
#
include <netdb.h>
/* for gethostbyname
*/
#
define SOCKET_ERROR (-1)
#
define INVALID_SOCKET (-1)
typedef
int SOCKET;
Chapter 18
305
PSA Programming Examples
Using C Over Socket LAN (UNIX)
#endif /* WINSOCK */
#ifdef WINSOCK
/* Declared in getopt.c.
See example programs disk. */
extern char *optarg;
extern int
optind;
extern int getopt(int argc, char * const argv[], const char* optstring);
#else
#
include <unistd.h>
/* for getopt(3C) */
#endif
#define COMMAND_ERROR
#define NO_CMD_ERROR
#define SCPI_PORT
(1)
(0)
5025
#define INPUT_BUF_SIZE (64*1024)
PSA Programming Examples
/**************************************************************************
* Display usage
**************************************************************************/
static void usage(char *basename)
{
fprintf(stderr,"Usage: %s [-nqu] <hostname> [<command>]\n", basename);
fprintf(stderr,"
%s [-nqu] <hostname> < stdin\n", basename);
fprintf(stderr,"
-n, number output lines\n");
fprintf(stderr,"
-q, quiet; do NOT echo lines\n");
fprintf(stderr,"
-e, show messages in error queue when done\n");
}
#ifdef WINSOCK
int init_winsock(void)
{
WORD wVersionRequested;
306
Chapter 18
PSA Programming Examples
Using C Over Socket LAN (UNIX)
WSADATA wsaData;
int err;
wVersionRequested = MAKEWORD(1, 1);
wVersionRequested = MAKEWORD(2, 0);
err = WSAStartup(wVersionRequested, &wsaData);
if (err != 0) {
/* Tell the user that we couldn’t find a useable */
/* winsock.dll.
*/
fprintf(stderr, "Cannot initialize Winsock 1.1.\n");
return -1;
}
return 0;
}
int close_winsock(void)
{
WSACleanup();
PSA Programming Examples
return 0;
}
#endif /* WINSOCK */
/***************************************************************************
*
> $Function: openSocket$
*
* $Description:
open a TCP/IP socket connection to the instrument $
*
* $Parameters:
*
$
(const char *) hostname . . . . Network name of instrument.
*
*
This can be in dotted decimal notation.
(int) portNumber
. . . . . . . The TCP/IP port to talk to.
*
Use 5025 for the SCPI port.
Chapter 18
307
PSA Programming Examples
Using C Over Socket LAN (UNIX)
*
* $Return:
(int)
. . . . . . . . A file descriptor similar to open(1).$
*
* $Errors:
returns -1 if anything goes wrong $
*
***************************************************************************/
SOCKET openSocket(const char *hostname, int portNumber)
{
struct hostent *hostPtr;
struct sockaddr_in peeraddr_in;
SOCKET s;
memset(&peeraddr_in, 0, sizeof(struct sockaddr_in));
/***********************************************/
/* map the desired host name to internal form. */
/***********************************************/
PSA Programming Examples
hostPtr = gethostbyname(hostname);
if (hostPtr == NULL)
{
fprintf(stderr,"unable to resolve hostname ’%s’\n", hostname);
return INVALID_SOCKET;
}
/*******************/
/* create a socket */
/*******************/
s = socket(AF_INET, SOCK_STREAM, 0);
if (s == INVALID_SOCKET)
{
fprintf(stderr,"unable to create socket to ’%s’: %s\n",
hostname, strerror(errno));
return INVALID_SOCKET;
}
308
Chapter 18
PSA Programming Examples
Using C Over Socket LAN (UNIX)
memcpy(&peeraddr_in.sin_addr.s_addr, hostPtr->h_addr, hostPtr->h_length);
peeraddr_in.sin_family = AF_INET;
peeraddr_in.sin_port = htons((unsigned short)portNumber);
if (connect(s, (const struct sockaddr*)&peeraddr_in,
sizeof(struct sockaddr_in)) == SOCKET_ERROR)
{
fprintf(stderr,"unable to create socket to ’%s’: %s\n",
hostname, strerror(errno));
return INVALID_SOCKET;
}
return s;
}
/***************************************************************************
*
PSA Programming Examples
> $Function: commandInstrument$
*
* $Description:
send a SCPI command to the instrument.$
*
* $Parameters:
$
*
(FILE *) . . . . . . . . . file pointer associated with TCP/IP socket.
*
(const char *command)
* $Return:
. . SCPI command string.
(char *) . . . . . . a pointer to the result string.
*
* $Errors:
returns 0 if send fails $
*
***************************************************************************/
int commandInstrument(SOCKET sock,
const char *command)
{
int count;
Chapter 18
309
PSA Programming Examples
Using C Over Socket LAN (UNIX)
/* fprintf(stderr, "Sending \"%s\".\n", command);
*/
if (strchr(command, ’\n’) == NULL) {
fprintf(stderr, "Warning: missing newline on command %s.\n", command);
}
count = send(sock, command, strlen(command), 0);
if (count == SOCKET_ERROR) {
return COMMAND_ERROR;
}
return NO_CMD_ERROR;
}
/**************************************************************************
* recv_line(): similar to fgets(), but uses recv()
**************************************************************************/
char * recv_line(SOCKET sock, char * result, int maxLength)
PSA Programming Examples
{
#ifdef WINSOCK
int cur_length = 0;
int count;
char * ptr = result;
int err = 1;
while (cur_length < maxLength) {
/* Get a byte into ptr */
count = recv(sock, ptr, 1, 0);
/* If no chars to read, stop. */
if (count < 1) {
break;
}
cur_length += count;
/* If we hit a newline, stop. */
310
Chapter 18
PSA Programming Examples
Using C Over Socket LAN (UNIX)
if (*ptr == ’\n’) {
ptr++;
err = 0;
break;
}
ptr++;
}
*ptr = ’\0’;
if (err) {
return NULL;
} else {
return result;
}
#else
/***********************************************************************
* Simpler UNIX version, using file I/O.
recv() version works too.
PSA Programming Examples
* This demonstrates how to use file I/O on sockets, in UNIX.
***********************************************************************/
FILE * instFile;
instFile = fdopen(sock, "r+");
if (instFile == NULL)
{
fprintf(stderr, "Unable to create FILE * structure : %s\n",
strerror(errno));
exit(2);
}
return fgets(result, maxLength, instFile);
#endif
}
/***************************************************************************
Chapter 18
311
PSA Programming Examples
Using C Over Socket LAN (UNIX)
*
> $Function: queryInstrument$
*
* $Description:
send a SCPI command to the instrument, return a response.$
*
* $Parameters:
$
*
(FILE *) . . . . . . . . . file pointer associated with TCP/IP socket.
*
(const char *command)
*
(char *result) . . . . . . where to put the result.
*
(size_t) maxLength . . . . maximum size of result array in bytes.
. . SCPI command string.
*
* $Return:
(long) . . . . . . . The number of bytes in result buffer.
*
* $Errors:
returns 0 if anything goes wrong. $
*
***************************************************************************/
long queryInstrument(SOCKET sock,
const char *command, char *result, size_t maxLength)
PSA Programming Examples
{
long ch;
char tmp_buf[8];
long resultBytes = 0;
int command_err;
int count;
/*********************************************************
* Send command to analyzer
*********************************************************/
command_err = commandInstrument(sock, command);
if (command_err) return COMMAND_ERROR;
/*********************************************************
* Read response from analyzer
********************************************************/
count = recv(sock, tmp_buf, 1, 0); /* read 1 char */
312
Chapter 18
PSA Programming Examples
Using C Over Socket LAN (UNIX)
ch = tmp_buf[0];
if ((count < 1) || (ch == EOF)
|| (ch == ’\n’))
{
*result = ’\0’;
/* null terminate result for ascii */
return 0;
}
/* use a do-while so we can break out */
do
{
if (ch == ’#’)
{
/* binary data encountered - figure out what it is */
long numDigits;
long numBytes = 0;
/* char length[10]; */
count = recv(sock, tmp_buf, 1, 0); /* read 1 char */
PSA Programming Examples
ch = tmp_buf[0];
if ((count < 1) || (ch == EOF)) break; /* End of file */
if (ch < ’0’ || ch > ’9’) break;
/* unexpected char */
numDigits = ch - ’0’;
if (numDigits)
{
/* read numDigits bytes into result string. */
count = recv(sock, result, (int)numDigits, 0);
result[count] = 0;
/* null terminate */
numBytes = atol(result);
}
if (numBytes)
{
resultBytes = 0;
Chapter 18
313
PSA Programming Examples
Using C Over Socket LAN (UNIX)
/* Loop until we get all the bytes we requested. */
/* Each call seems to return up to 1457 bytes, on HP-UX 9.05 */
do {
int rcount;
rcount = recv(sock, result, (int)numBytes, 0);
resultBytes += rcount;
result
+= rcount;
/* Advance pointer */
} while ( resultBytes < numBytes );
/************************************************************
* For LAN dumps, there is always an extra trailing newline
* Since there is no EOI line.
For ASCII dumps this is
* great but for binary dumps, it is not needed.
***********************************************************/
if (resultBytes == numBytes)
{
char junk;
count = recv(sock, &junk, 1, 0);
PSA Programming Examples
}
}
else
{
/* indefinite block ... dump til we read only a line feed */
do
{
if (recv_line(sock, result, maxLength) == NULL) break;
if (strlen(result)==1 && *result == ’\n’) break;
resultBytes += strlen(result);
result += strlen(result);
} while (1);
}
}
else
{
/* ASCII response (not a binary block) */
*result = (char)ch;
314
Chapter 18
PSA Programming Examples
Using C Over Socket LAN (UNIX)
if (recv_line(sock, result+1, maxLength-1) == NULL) return 0;
/* REMOVE trailing newline, if present.
And terminate string. */
resultBytes = strlen(result);
if (result[resultBytes-1] == ’\n’) resultBytes -= 1;
result[resultBytes] = ’\0’;
}
} while (0);
return resultBytes;
}
/*************************************************************************
*
> $Function: showErrors$
*
PSA Programming Examples
* $Description: Query the SCPI error queue, until empty.
Print results. $
*
* $Return:
(void)
*
*************************************************************************/
void showErrors(SOCKET sock)
{
const char * command = "SYST:ERR?\n";
char result_str[256];
do {
queryInstrument(sock, command, result_str, sizeof(result_str)-1);
/******************************************************************
* Typical result_str:
*
-221,"Settings conflict; Frequency span reduced."
*
+0,"No error"
Chapter 18
315
PSA Programming Examples
Using C Over Socket LAN (UNIX)
* Don’t bother decoding.
******************************************************************/
if (strncmp(result_str, "+0,", 3) == 0) {
/* Matched +0,"No error" */
break;
}
puts(result_str);
} while (1);
}
/***************************************************************************
*
> $Function: isQuery$
*
* $Description: Test current SCPI command to see if it a query. $
*
PSA Programming Examples
* $Return:
(unsigned char) . . . non-zero if command is a query.
0 if not.
*
***************************************************************************/
unsigned char isQuery( char* cmd )
{
unsigned char q = 0 ;
char *query ;
/*********************************************************/
/* if the command has a ’?’ in it, use queryInstrument.
*/
/* otherwise, simply send the command.
*/
/* Actually, we must a little more specific so that
*/
/* marker value queries are treated as commands.
*/
/* Example:
*/
SENS:FREQ:CENT (CALC1:MARK1:X?)
/*********************************************************/
if ( (query = strchr(cmd,’?’)) != NULL)
{
/* Make sure we don’t have a marker value query, or
316
Chapter 18
PSA Programming Examples
Using C Over Socket LAN (UNIX)
* any command with a ’?’ followed by a ’)’ character.
* This kind of command is not a query from our point of view.
* The analyzer does the query internally, and uses the result.
*/
query++ ;
/* bump past ’?’ */
while (*query)
{
if (*query == ’ ’) /* attempt to ignore white spc */
query++ ;
else break ;
}
if ( *query != ’)’ )
{
q = 1 ;
}
}
return q ;
}
PSA Programming Examples
/***************************************************************************
*
> $Function: main$
*
* $Description: Read command line arguments, and talk to analyzer.
Send query results to stdout. $
*
* $Return:
(int) . . . non-zero if an error occurs
*
***************************************************************************/
int main(int argc, char *argv[])
{
SOCKET instSock;
Chapter 18
317
PSA Programming Examples
Using C Over Socket LAN (UNIX)
char *charBuf = (char *) malloc(INPUT_BUF_SIZE);
char *basename;
int chr;
char command[1024];
char *destination;
unsigned char quiet = 0;
unsigned char show_errs = 0;
int number = 0;
basename = strrchr(argv[0], ’/’);
if (basename != NULL)
basename++ ;
else
basename = argv[0];
while ( ( chr = getopt(argc,argv,"qune")) != EOF )
switch (chr)
PSA Programming Examples
{
case ’q’:
quiet = 1; break;
case ’n’:
number = 1; break ;
case ’e’:
show_errs = 1; break ;
case ’u’:
case ’?’:
usage(basename); exit(1) ;
}
/* now look for hostname and optional <command> */
if (optind < argc)
{
destination = argv[optind++] ;
strcpy(command, "");
if (optind < argc)
{
while (optind < argc) {
/* <hostname> <command> provided; only one command string */
strcat(command, argv[optind++]);
if (optind < argc) {
318
Chapter 18
PSA Programming Examples
Using C Over Socket LAN (UNIX)
strcat(command, " ");
} else {
strcat(command, "\n");
}
}
}
else
{
/* Only <hostname> provided; input on <stdin> */
strcpy(command, "");
if (optind > argc)
{
usage(basename);
exit(1);
}
}
}
else
PSA Programming Examples
{
/* no hostname! */
usage(basename);
exit(1);
}
/**********************************************/
/* open a socket connection to the instrument */
/**********************************************/
#ifdef WINSOCK
if (init_winsock() != 0) {
exit(1);
}
#endif /* WINSOCK */
instSock = openSocket(destination, SCPI_PORT);
if (instSock == INVALID_SOCKET) {
Chapter 18
319
PSA Programming Examples
Using C Over Socket LAN (UNIX)
fprintf(stderr, "Unable to open socket.\n");
return 1;
}
/* fprintf(stderr, "Socket opened.\n"); */
if (strlen(command) > 0)
{
/********************************************************/
/* if the command has a ’?’ in it, use queryInstrument. */
/* otherwise, simply send the command.
*/
/********************************************************/
if ( isQuery(command) )
{
long bufBytes;
bufBytes = queryInstrument(instSock, command,
charBuf, INPUT_BUF_SIZE);
if (!quiet)
{
PSA Programming Examples
fwrite(charBuf, bufBytes, 1, stdout);
fwrite("\n", 1, 1, stdout) ;
fflush(stdout);
}
}
else
{
commandInstrument(instSock, command);
}
}
else
{
/* read a line from <stdin> */
while ( gets(charBuf) != NULL )
{
if ( !strlen(charBuf) )
continue ;
320
Chapter 18
PSA Programming Examples
Using C Over Socket LAN (UNIX)
if ( *charBuf == ’#’ || *charBuf == ’!’ )
continue ;
strcat(charBuf, "\n");
if (!quiet)
{
if (number)
{
char num[10];
sprintf(num,"%d: ",number);
fwrite(num, strlen(num), 1, stdout);
}
fwrite(charBuf, strlen(charBuf), 1, stdout) ;
fflush(stdout);
}
if ( isQuery(charBuf) )
{
PSA Programming Examples
long bufBytes;
/* Put the query response into the same buffer as the
* command string appended after the null terminator.
*/
bufBytes = queryInstrument(instSock, charBuf,
charBuf + strlen(charBuf) + 1,
INPUT_BUF_SIZE -strlen(charBuf) );
if (!quiet)
{
fwrite("
", 2, 1, stdout) ;
fwrite(charBuf + strlen(charBuf)+1, bufBytes, 1, stdout);
fwrite("\n", 1, 1, stdout) ;
fflush(stdout);
}
}
else
Chapter 18
321
PSA Programming Examples
Using C Over Socket LAN (UNIX)
{
commandInstrument(instSock, charBuf);
}
if (number) number++;
}
}
if (show_errs) {
showErrors(instSock);
}
#ifdef WINSOCK
closesocket(instSock);
close_winsock();
#else
close(instSock);
#endif /* WINSOCK */
PSA Programming Examples
return 0;
}
/* End of lanio.c */
322
Chapter 18
PSA Programming Examples
Using C Over Socket LAN (Windows NT)
Using C Over Socket LAN (Windows NT)
This C programming example (getopt.c) compiles in the Windows NT
environment. In Windows, the routines send() and recv() must be
used, since fread() and fwrite() may not work on sockets.
The program reads the analyzer’s host name from the command line,
followed by the SCPI command. It then opens a socket to the analyzer,
using port 5025, and sends the command. If the command appears to be
a query, the program queries the analyzer for a response, and prints the
response.
This example program can also be used as a utility to talk to your
analyzer from the command prompt on your Windows NT PC, or from
within a script.
/***************************************************************************
getopt(3C)
getopt(3C)
NAME
getopt - get option letter from argument vector
PSA Programming Examples
SYNOPSIS
int getopt(int argc, char * const argv[], const char *optstring);
extern char *optarg;
extern int optind, opterr, optopt;
DESCRIPTION
getopt returns the next option letter in argv (starting from argv[1])
that matches a letter in optstring.
optstring is a string of
recognized option letters; if a letter is followed by a colon, the
option is expected to have an argument that may or may not be
separated from it by white space.
optarg is set to point to the start
of the option argument on return from getopt.
getopt places in optind the argv index of the next argument to be
processed.
The external variable optind is initialized to 1 before
Chapter 18
323
PSA Programming Examples
Using C Over Socket LAN (Windows NT)
the first call to the function getopt.
When all options have been processed (i.e., up to the first non-option
argument), getopt returns EOF.
The special option -- can be used to
delimit the end of the options; EOF is returned, and -- is skipped.
***************************************************************************/
#include <stdio.h>
/* For NULL, EOF */
#include <string.h>
/* For strchr() */
char
*optarg;
/* Global argument pointer. */
int
optind = 0;
/* Global argv index. */
static char
*scan = NULL;
/* Private scan pointer. */
int getopt( int argc, char * const argv[], const char* optstring)
PSA Programming Examples
{
char c;
char *posn;
optarg = NULL;
if (scan == NULL || *scan == ’\0’) {
if (optind == 0)
optind++;
if (optind >= argc || argv[optind][0] != ’-’ || argv[optind][1] == ’\0’)
return(EOF);
if (strcmp(argv[optind], "--")==0) {
optind++;
return(EOF);
}
scan = argv[optind]+1;
324
Chapter 18
PSA Programming Examples
Using C Over Socket LAN (Windows NT)
optind++;
}
c = *scan++;
posn = strchr(optstring, c);
/* DDP */
if (posn == NULL || c == ’:’) {
fprintf(stderr, "%s: unknown option -%c\n", argv[0], c);
return(’?’);
}
posn++;
if (*posn == ’:’) {
if (*scan != ’\0’) {
optarg = scan;
scan = NULL;
} else {
optarg = argv[optind];
optind++;
PSA Programming Examples
}
}
return(c);
}
Chapter 18
325
PSA Programming Examples
Using Java Programming Over Socket LAN
Using Java Programming Over Socket LAN
This Java programming example (ScpiDemo.java) demonstrates simple
socket programming with Java and can be found on the Documentation
CD. It is written in Java programming language, and will compile with
Java compilers versions 1.0 and above.
import java.awt.*;
import java.io.*;
import java.net.*;
import java.applet.*;
// This is a SCPI Demo to demonstrate how one can communicate with the
// E4440A PSA
with a JAVA capable browser.
// Main class for the SCPI Demo.
This is the
This applet will need Socks.class to
// support the I/O commands and a ScpiDemo.html for a browser to load
// the applet.
// To use this applet, either compile this applet with a Java compiler
// or use the existing compiled classes.
copy ScpiDemo.class,
PSA Programming Examples
// Socks.class and ScpiDemo.html to a floppy.
// your instrument.
Insert the floppy into
Load up a browser on your computer and do the
// following:
//
1. Load this URL in your browser:
//
//
ftp://<Your instrument’s IP address or name>/int/ScpiDemo.html
2. There should be two text windows show up in the browser:
//
The top one is the SCPI response text area for any response
//
coming back from the instrument.
//
to enter a SCPI command.
//
If the command expects a response, it will show up in the top
//
window.
The bottom one is for you
Type in a SCPI command and hit enter.
public class ScpiDemo extends java.applet.Applet implements Runnable {
Thread
responseThread;
Socks
sck;
URL
appletBase;
TextField
scpiCommand = new TextField();
TextArea
scpiResponse = new TextArea(10, 60);
Panel
southPanel = new Panel();
326
Chapter 18
PSA Programming Examples
Using Java Programming Over Socket LAN
Panel
p;
// Initialize the applets
public void init() {
SetupSockets();
SetupPanels();
// Set up font type for both panels
Font font = new Font("TimesRoman", Font.BOLD,14);
scpiResponse.setFont(font);
scpiCommand.setFont(font);
scpiResponse.appendText("SCPI Demo Program:
Response messages\n");
scpiResponse.appendText("--------------------------------------------\n");
}
// This routine is called whenever the applet is actived
public void start() {
// Open the sockets if not already opened
PSA Programming Examples
sck.OpenSockets();
// Start a response thread
StartResponseThread(true);
}
// This routine is called whenever the applet is out of scope
// i.e. minize browser
public void stop() {
// Close all local sockets
sck.CloseSockets();
// Kill the response thread
StartResponseThread(false);
}
// Action for sending out scpi commands
// This routine is called whenever a command is received from the
// SCPI command panel.
Chapter 18
327
PSA Programming Examples
Using Java Programming Over Socket LAN
public boolean action(Event evt, Object what) {
// If this is the correct target
if (evt.target == scpiCommand) {
// Get the scpi command
String str = scpiCommand.getText();
// Send it out to the Scpi socket
sck.ScpiWriteLine(str);
String tempStr = str.toLowerCase();
// If command str is "syst:err?", don’t need to send another one.
if ( (tempStr.indexOf("syst") == -1) ||
(tempStr.indexOf("err") == -1)
) {
// Query for any error
sck.ScpiWriteLine("syst:err?");
}
return true;
}
return false;
PSA Programming Examples
}
// Start/Stop a Response thread to display the response strings
private void StartResponseThread(boolean start) {
if (start) {
// Start a response thread
responseThread = new Thread(this);
responseThread.start();
}
else {
// Kill the response thread
responseThread = null;
}
}
// Response thread running
public void run() {
String str = "";
328
// Initialize str to null
Chapter 18
PSA Programming Examples
Using Java Programming Over Socket LAN
// Clear the error queue before starting the thread
// in case if there’s any error messages from the previous actions
while ( str.indexOf("No error") == -1 ) {
sck.ScpiWriteLine("syst:err?");
str = sck.ScpiReadLine();
}
// Start receiving response or error messages
while(true) {
str = sck.ScpiReadLine();
if ( str != null ) {
// If response messages is "No error", do no display it,
// replace it with "OK" instead.
if ( str.equals("+0,\"No error\"") ) {
str = "OK";
}
// Display any response messages in the Response panel
scpiResponse.appendText(str+"\n");
}
PSA Programming Examples
}
}
// Set up and open the SCPI sockets
private void SetupSockets() {
// Get server url
appletBase = (URL)getCodeBase();
// Open the sockets
sck = new Socks(appletBase);
}
// Set up the SCPI command and response panels
private void SetupPanels() {
// Set up SCPI command panel
southPanel.setLayout(new GridLayout(1, 1));
p = new Panel();
p.setLayout(new BorderLayout());
Chapter 18
329
PSA Programming Examples
Using Java Programming Over Socket LAN
p.add("West", new Label("SCPI command:"));
p.add("Center", scpiCommand);
southPanel.add(p);
// Set up the Response panel
setLayout(new BorderLayout(2,2));
add("Center", scpiResponse);
add("South", southPanel);
}
}
//
Socks class is responsible for open/close/read/write operations
//
from the predefined socket ports.
//
the only port used is 5025 for the SCPI port.
For this example program,
class Socks extends java.applet.Applet {
// Socket Info
PSA Programming Examples
// To add a new socket, add a constant here, change MAX_NUM_OF_SOCKETS
// then, edit the constructor for the new socket.
public final int SCPI=0;
private final int MAX_NUM_OF_SOCKETS=1;
// Port number
// 5025 is the dedicated port number for E4440A Scpi Port
private final int SCPI_PORT = 5025;
// Socket info
private URL appletBase;
private Socket[] sock = new Socket[MAX_NUM_OF_SOCKETS];
private DataInputStream[] sockIn = new DataInputStream[MAX_NUM_OF_SOCKETS];
private PrintStream[] sockOut = new PrintStream[MAX_NUM_OF_SOCKETS];
private int[] port = new int[MAX_NUM_OF_SOCKETS];
private boolean[] sockOpen = new boolean[MAX_NUM_OF_SOCKETS];
// Constructor
330
Chapter 18
PSA Programming Examples
Using Java Programming Over Socket LAN
Socks(URL appletB)
{
appletBase = appletB;
// Set up for port array.
port[SCPI] = SCPI_PORT;
// Initialize the sock array
for ( int i = 0; i < MAX_NUM_OF_SOCKETS; i++ ) {
sock[i] = null;
sockIn[i] = null;
sockOut[i] = null;
sockOpen[i] = false;
}
}
//***** Sockects open/close routines
// Open the socket(s) if not already opened
public void OpenSockets()
PSA Programming Examples
{
try {
// Open each socket if possible
for ( int i = 0; i < MAX_NUM_OF_SOCKETS; i++ ) {
if ( !sockOpen[i] ) {
sock[i] = new Socket(appletBase.getHost(),port[i]);
sockIn[i] = new DataInputStream(sock[i].getInputStream());
sockOut[i] = new PrintStream(sock[i].getOutputStream());
if ( (sock[i] != null) && (sockIn[i] != null) &&
(sockOut[i] != null) ) {
sockOpen[i] = true;
}
}
}
}
catch (IOException e) {
System.out.println("Sock, Open Error "+e.getMessage());
Chapter 18
331
PSA Programming Examples
Using Java Programming Over Socket LAN
}
}
// Close the socket(s) if opened
public void CloseSocket(int s)
{
try {
if ( sockOpen[s] == true ) {
// write blank line to exit servers elegantly
sockOut[s].println();
sockOut[s].flush();
sockIn[s].close();
sockOut[s].close();
sock[s].close();
sockOpen[s] = false;
}
}
catch (IOException e) {
PSA Programming Examples
System.out.println("Sock, Close Error "+e.getMessage());
}
}
// Close all sockets
public void CloseSockets()
{
for ( int i=0; i < MAX_NUM_OF_SOCKETS; i++ ) {
CloseSocket(i);
}
}
// Return the status of the socket, open or close.
public boolean SockOpen(int s)
{
return sockOpen[s];
}
332
Chapter 18
PSA Programming Examples
Using Java Programming Over Socket LAN
//************* Socket I/O routines.
//*** I/O routines for SCPI socket
// Write an ASCII string with carriage return to SCPI socket
public void ScpiWriteLine(String command)
{
if ( SockOpen(SCPI) ) {
sockOut[SCPI].println(command);
sockOut[SCPI].flush();
}
}
// Read an ASCII string, terminated with carriage return from SCPI socket
public String ScpiReadLine()
{
try {
if ( SockOpen(SCPI) ) {
PSA Programming Examples
return sockIn[SCPI].readLine();
}
}
catch (IOException e) {
System.out.println("Scpi Read Line Error "+e.getMessage());
}
return null;
}
// Read a byte from SCPI socket
public byte ScpiReadByte()
{
try {
if ( SockOpen(SCPI) ) {
return sockIn[SCPI].readByte();
}
}
Chapter 18
333
PSA Programming Examples
Using Java Programming Over Socket LAN
catch (IOException e) {
System.out.println("Scpi Read Byte Error "+e.getMessage());
}
return 0;
}
PSA Programming Examples
}
334
Chapter 18
PSA Programming Examples
Using the VXI Plug-N-Play Driver in LabVIEW®
Using the VXI Plug-N-Play Driver in
LabVIEW®
This example shows how to use the VXI plug and play driver over LAN
in LabVIEW 6. The vi file (lan_pnp.vi) can be found on the
Documentation CD.
You must have Version K of the Agilent IO libraries installed on your
PC, either alone or installed side-by-side with the National Instruments
IO libraries. Also, you must first import the VXI plug and play driver
into LabVIEW before running this example. The instrument drivers are
available at:
http://www.agilent.com/find/iolib (Click on instrument drivers.)
This example:
1. Opens a VXI 11.3 Lan connection to the instrument
2. Sets the Center Frequency to 1 GHz
3. Queries the instrument’s center frequency
4. Closes the Lan connection to the instrument
NOTE
Chapter 18
PSA Programming Examples
Substitute your instruments I.P. address for the one used in the
example.
335
PSA Programming Examples
Using LabVIEW® 6 to Make an EDGE GSM Measurement
Using LabVIEW® 6 to Make an EDGE GSM
Measurement
This is a LabVIEW 6 example that uses SCPI commands instead of the
instrument driver. It demonstrates reading ASCII trace points of entire
EDGE waveform data in the Power Vs. Time measurement over LAN.
This program uses the optional GSM/EDGE personality in the PSA
Series Spectrum Analyzers and in the E4406A Vector Signal Analyzer.
The vi file (epvt.vi) can be found on the Documentation CD.
This example:
1. Opens a VXI 11.3 Lan connection to the instrument
2. Changes the data format to ASCII.
3. Initiates a power vs. time measurement and reads the results.
PSA Programming Examples
4. The comma separated ASCII results string is converted to an array
of values.
336
Chapter 18
PSA Programming Examples
Using LabVIEW® 6 to Make an EDGE GSM Measurement
PSA Programming Examples
Chapter 18
337
PSA Programming Examples
Using Visual Basic® .NET with the IVI-Com Driver
Using Visual Basic® .NET with the IVI-Com
Driver
This example uses Visual Basic .NET with the IVI-Com driver. It makes
a time domain (Waveform) measurement using the Basic mode. Basic
mode is standard in the E4406A Vector Signal Analyzer and is optional
(B7J) in the PSA Series Spectrum Analyzers. The vb file
(vbivicomsa_basicwaveform.vb) and the compiled executable file
(vbivicomsa.exe) can be found on the Documentation CD.
’*************************************************************************
’ VBIviComSA_BasicWaveform.vb, August 5, 2003
’ This example demonstrates the use of the IVI-COM driver in VB.NET
’ through an interop assembly.
The Raw I/Q trace data from the Waveform
’ measurement in Basic Mode is queried and printed to the screen.
’
PSA Programming Examples
’ Requirements:
’
1) E4406A or PSA Series Spectrum Analyzer with Option B7J
’
2) Latest AgilentSa IVI-COM driver
’
You may download it here: http://www.agilent.com/find/inst_drivers
’
This example was tested with version 2.1.0.0 of the driver
’
3) Create a new project and add the References to this module
’
and to the the IVI-COM driver dlls:
’
For .NET, right click on Reference, choose Add Reference
’
and then click on Browse and directly link the DLLs in the directory:
’
C:\Program Files\IVI\Bin\Primary Interop Assemblies
’
Agilent.AgilentSa.Interop.dll
’
Agilent.AgilentSaAppBasic.Interop.dll
’
Agilent.Itl.Interop
’
IviDriverLib.dll
’
IviSpecAnLib.dll
’
’ THIS CODE AND INFORMATION ARE PROVIDED "AS IS" WITHOUT WARRANTY OF ANY
’ KIND, EITHER EXPRESSED OR IMPLIED, INCLUDING BUT NOT LIMITED TO THE
’ IMPLIED WARRANTIES OF MERCHANTABILITY AND/OR FITNESS FOR A
’ PARTICULAR PURPOSE.
’
338
Chapter 18
PSA Programming Examples
Using Visual Basic® .NET with the IVI-Com Driver
’ Copyright (c) 2003. Agilent Technologies, Inc.
’*************************************************************************
Option Strict On
Imports Agilent.TMFramework
Imports Agilent.AgilentSa.Interop
Imports Ivi.Driver.Interop
Imports System.Runtime.InteropServices
Module ConsoleApp
Sub Main()
’ Prompt the user for the address of the instrument
Dim address As String
Console.WriteLine("Enter address of the instrument " & vbCrLf & _
"(ex: GPIB0::18::INSTR or TCPIP0::192.168.100.2::inst0::INSTR):")
address = Console.ReadLine()
’ Create an instance of the driver, connection to the instrument
’ is not established here, it is done by calling Initialize
Dim instr As New AgilentSaClass()
’ Establish the connection to the instrument
’ Last parameter (DriverSetup) is optional, VB could omit it (but not C#)
’ Important: Close must be called to release resources used by the driver
instr.Initialize(address, False, False, "")
Try
’ INHERENT CAPABILITIES
’ Note that it is not necessary to program against the IIviDriver
’ interface, the same can be achieved by using the class directly
’ Using the IIviDriver interface gives us interchangeable code
Dim inherent As IIviDriver = instr
Chapter 18
339
PSA Programming Examples
Try
PSA Programming Examples
Using Visual Basic® .NET with the IVI-Com Driver
Dim manufacturer As String
Dim model As String
Dim firmware As String
manufacturer = inherent.Identity.InstrumentManufacturer
model = inherent.Identity.InstrumentModel
firmware = inherent.Identity.InstrumentFirmwareRevision
’ Output instrument information to the console
Console.WriteLine("Manufacturer: " + manufacturer)
Console.WriteLine("Model: " + model)
Console.WriteLine("Firmware: " + firmware)
’ Reset the instrument
inherent.Utility.Reset()
’ INSTRUMENT SPECIFIC
’ Using the IAgilentSa interface is not necessary or beneficial
’ at the moment, but in the future if other instruments implement
PSA Programming Examples
’ the IAgilentSa interface, the code that is written to work with
’ that interface can be reused without changes, as opposed to code
’ that is written against the class object directly
Dim sa As IAgilentSa = instr
’ Obtain trace data from the instrument
Dim traceData As Array
sa.Application.Select("Basic")
’sa.Application.Basic.Waveform.Configure()
sa.Application.Basic.Spectrum.Traces.Initiate()
traceData = sa.Application.Basic.Waveform.Traces.Item("RawIQ").Read(10000)
’ Output the trace data to the console
Console.WriteLine("Press ENTER to display trace data.")
Console.ReadLine()
Dim traceValue As Double
For Each traceValue In traceData
Console.WriteLine(traceValue)
340
Chapter 18
PSA Programming Examples
Using Visual Basic® .NET with the IVI-Com Driver
Next
Catch ex As Exception
Console.WriteLine(ex.Message)
Finally
’ Close the connection
instr.Close()
End Try
Catch ex As COMException
Console.WriteLine(ex.Message)
Catch ex As Exception
Console.WriteLine(ex.Message)
End Try
PSA Programming Examples
’ Wait for user input
Console.WriteLine("Press ENTER to end program.")
Console.ReadLine()
End Sub
End Module
Chapter 18
341
PSA Programming Examples
Using Agilent VEE to Capture the Equivalent SCPI Learn String
Using Agilent VEE to Capture the Equivalent
SCPI Learn String
This example shows how to use VEE to emulate the *LRN SCPI
command. The VEE file (lrnstring.vee) can be found on the
Documentation CD.
PSA Programming Examples
This VEE programming example transfers the saved state register (17 in
this example) to the program. The program then copies this register back
into the instrument and recalls the state. This, in many cases, is equivalent
to the *LRN SCPI command.
342
Chapter 18
Index
A
ACPR
C programming example 176
active function position, moving
14
adding limit lines programming
example using C 233
adjacent channel power
measurement 74
Agilent VEE program example
197, 342
alignments
programming example 179
AM demodulation
time-domain demodulation,
manually calculating 157
AM signal demodulation 92
analyzer distortion products 40
attenuation
input, reducing 26
setting automatically 27
setting manually 27
averaging
description 30
types 30
averaging faster programming
example using C 269
B
Bluetooth power measurement 68
burst power measurement 68
D
delta marker 12, 14
Demod key 96
demodulating
AM 92
AM overview 92
FM 98
FM overview 98
TV signals 121
depth of modulation
measurement 126
detectors, average 29
device bandwidth measurement
114, 160
display
active function position, moving
14
distortion measurements
harmonic 45
identifying TOI distortion 42
indentifying distortion products
40
overview 40
distortion products 40
drifting signals 38
E
entering amplitude correction
data programming example
using C 243
equipment 10
error status programming
example using C 247
examples
AM demodulation
ESA built-in AM
demodulation 96
manual demodulation 92
average detector, using 29
averaging, trace 30
distortion
harmonics 45
identify distortion products 40
TOI 42
external mixing
frequency tracking calibration
86
preselected mixers, using 86
unpreselected mixers, using
82
FM demodulation
ESA built-in FM demodulation
98
frequency drift 36
input attenuation, reducing 26
marker counter 32
measuring
low-level signals 29
noise
band power marker 52
channel power, using 54
noise marker 50
overview 48
signal to noise 48
power suite
ACP 74
burst power 68
CCDF 71
multi-carrier power 77
resolution bandwidth, reducing
28
segmented sweep
monitor CDMA band 108
using with limit lines 106
view harmonics 104
signals
low-level, overview 26
off-screen, comparing 15
on-screen, comparing 12, 14
resolving, equal amplitude 17
resolving, small signals hidden
by large signals 20
stimulus response
device bandwidth 114, 160
filter response 116
reflection calibration 118
transmission 112
time gating
343
Index
C
C language
addressing sessions 174
closing sessions 175
compiling and linking 169
creating 167
example 171
opening session 172
sessions 172
using VISA library 167
using VISA transition library
169, 171
C programming, socket LAN,
UNIX 303
C programming, socket LAN,
WIN NT 323
calculate average power of GSM
bursts
programming example 297
calibration
programming example 179
CCDF statistical power
measurement 71
channel power measurement
noise-like signals 54
comparing signals
two signals 12, 14
two signals not on the same
screen 15
compressing measurement data,
programming example 297
Concepts
AM demodulation 157
FM demodulation 157
concepts
gated FFT (PSA) 137
gated LO (PSA) 136
gated video (ESA) 136
harmonic distortion, calculation
132
IF filter, defined 130
resolving signals of equal
amplitude 130
resolving small signals hidden
by large signals 131
stimulus response 158
time gating 133
TV trigger 154
counter resolution, readout 32
Index
ESA-E time gate 64
PSA gated FFT 66
PSA gated sweep 62
trace averaging 30
tracking a signal 38
TV signals
demodulate and view 122
depth of modulation 126
external mixing
entering conversion loss data 85
preselected mixers, using 86
setting mixer bias 84
unpreselected mixers, using 82
F
finding hidden signals 131
FM demodulation
time-domain demodulation,
manually calculating 157
FM signal demodulation 98
frequency readout resolution
increased 32
G
gate delay
setting the gate delay, time
gating 144
gate length
setting the gate length, time
gating 144
gated FFT (PSA), concepts 137
gated LO (PSA), concepts 136
gated video (ESA), concepts 136
GSM mobile power calibation PSA
programming example using
C 291
GSM/EDGE program example,
using LabVIEW 336
Index
H
harmonic distortion
measuring harmonics 132
measuring low-level signals 15
hold, maximum 36
I
identifying distortion products 40
initial setting for time gating 148
input attenuation, reducing 26
intermodulation distortion, third
order 42, 132
internal self alignment
programming example using
C 210
IVI-Com driver program example
using Visual Basic .NET 338
344
J
Java programming, socket LAN
326
L
LabVIEW program example 335,
336
limit lines
entering data 107
low-level signals
harmonics, measuring 15
input attenuation, reducing 26
resolution bandwidth, reducing
28
sweep time, reducing 29
trace averaging 30
M
marker counter example
marker frequency resolution 32
marker delta mode programming
example using C 206
marker peak search programming
example using C 202, 280
markers
band power 52
delta 12, 14
noise marker 49, 50
span pair 52
Max Hold key 36
maximum hold 36
MCP 77
measure harmonic distortion over
GPIB programming example
using C 253
measure harmonic distortion over
RS-232 programming
example using C 261
measure noise programming
example using C 239
measurements
device bandwidth 114, 160
distortion 40
harmonics 45
TOI 42
frequency drift 36, 38
noise
band power marker 52
channel power 54
noise marker 50
overview 48
signal to noise 48
stimulus response 112
filter response 116
time gating 57
ESA-E time gate 64
PSA gated FFT 66
PSA gated sweep 62
TV
depth of modulation 126
fast time-domain sweeps 156
measuring return loss 120
measurments
distortion
identifying 40
moving signals 38
multi-carrier power measurement
77
N
N dB Points key 114, 160
noise measurements
band power marker, using 52
channel power, using 54
noise marker, using 50
overview 48
signal to noise 48
sweep time, reducing 29
normalizating reference position
113, 159
Normalize On Off key 113, 159
O
openSocket 303, 323, 326
overview
stimulus response 112
overviews
distortion 40
low-level signal 26
noise 48
resolving signals 130
time gating 133
P
Plug-N-Play driver program
example 335
positioning the gate, time gating
143
power suite
channel power 54
measurements
ACP or adjacent channel
power 74
burst power 68
CCDF 71
MCP or multi-carrier power 77
power suite measurements 67
program example
Agilent VEE 197, 342
C 176, 179, 182, 303, 323
Index
saving PSA binary trace data,
using C 287
SCPI learn string, using VEE
342
screen image capture 188
SRQ, using 182
system requirements, ESA
examples 201
system requirements, PSA
examples 279
transfer binary trace data 192
transfer trace data, using VEE
197
using C over socket LAN via
UNIX 303
using C over socket LAN via
WIN NT 323
using Java over socket LAN 326
VXI Plug-N-Play driver, using
LabVIEW 335
R
RBW selections 28
read ESA 32-bit trace data over
GPIB programming example
using C 218
read ESA 32-bit trace data over
RS-232 programming
example using C 228
read ESA ASCII trace data over
GPIB programming example
using C 214
read ESA ASCII trace data over
RS-232 programming
example using C 223
reflection calibration and
measurement 118
resloving, equal amplitude 130
resolution bandwidth
adjusting 28
resolving signals 131
resolving signals
small signals hidden by large
signals 131
resolving two signals
equal amplitude 17, 130
return loss
converting to VSWR 160
return loss measurement 120
rules for time gating 147
S
saving and recalling PSA states
programming example using
C 283
saving PSA binary trace data
programming example using
C 287
SCPI learn string using VEE
program example 342
screen image capture
programming example 188
segmented sweep
CDMA example 108
measuring harmonics 104
using with limit lines 106
signal parameters for a
time-gated measurement 141
signal tracking
example 38
marker tracking 22
using to resolve signals 22
signals
low-level, overview 26
off-screen, comparing 15
on-screen, comparing 12, 14
resolving, overview 130
separating, overview 130
socket LAN
Java program example 326
socket LAN, UNIX
C program example 303
socket LAN, WIN NT
C program example 323
Span Zoom key 36
SRQ
programming example 182
stimulus response
measure response of a LP filter
116
stimulus response measurements
112
stimulus response, concepts 158
sweep coupling
stimulus response
measurements 113, 115,
117, 159
sweep time and sensitivity trade
off 28
sweep time for a time-gated
measurement 64, 142
sweep time, changing 29
T
test equipment 10
third order intermodulation
distortion example 42, 45
time gating
description 133
ESA-E time gate, using 64
example 57
gated FFT (PSA), concepts 137
345
Index
C, using ESA 202, 206, 210,
214, 218, 223, 228, 233,
239, 243, 247, 253, 261, 269
C, using PSA 280, 283, 287,
291, 297
IVI-Com driver 338
Java 326
LabVIEW 335, 336
socket LAN, UNIX using C 303
socket LAN, using Java 326
socket LAN, WIN NT using C
323
Visual Basic 188, 192
Visual Basic .NET 338
VXI Plug-N-Play driver 335
programming
example using C language 171
using C language 167
programming example
ACPR measurement 176
adding limit lines, using C 233
alignments 179
calculate average power of GSM
bursts 297
determine if an error occurred,
using C 247
EDGE/GSM using LabVIEW
336
entering amplitude correction
data, using C 243
GSM mobile power calibration
with a PSA, using C 291
internal self-alignment, using C
210
IVI-Com driver, using Visual
Basic .NET 338
list of ESA examples 200
making faster power averaging
measurements, using C 269
marker delta mode, using C 206
marker peak search, using C
202, 280
measure harmonic distortion
over GPIB, using C 253
measure harmonic distortion
over RS-232, using C 261
measure noise, using C 239
read ESA 32-bit trace data over
GPIB, using C 218
read ESA 32-bit trace data over
RS- 232, using C 228
read ESA ASCII trace data over
GPIB, using C 214
read ESA ASCII trace data over
RS- 232, using C 223
saving and recalling PSA states,
using C 283
Index
Index
gated LO (PSA), concepts 136
gated video (ESA), concepts 136
how time gating works 135
initial settings 148
keys 143
positioning the gate 63, 143
PSA gated FFT, using 66
PSA gated sweep, using 62
rules 147
setting sweep time 148
setting the gate length 144
setting the resolution
bandwidth 144, 145
setting the span 143, 146
setting the video bandwidth
144, 146
signal parameters 141
steps for measuring unknown
signals 141
sweep time 64, 142
triggering
edge mode 151
level mode 151
negative edge 151
positive edge 151
troubleshooting 149
time gating measurement 57
tracking generator
normalization 113, 160
reflection calibration
measurement 118
source power control 112
stimulus response 158
stimulus response measurement
112
sweep coupling 113, 115, 117,
159
unleveled condition 158
tracking unstable signals 38
transfer binary trace data
programming example 192
transfer trace data using VEE
program example 197
troubleshooting
time-gated measurements 149
TV picture viewing 121
TV standard setup 154
TV trigger setup 154
U
unstable signals 38
V
VISA library 169, 171
Visual Basic .NET program
example 338
Visual Basic program example
346
screen image capture 188
transfer binary trace data 192
VSWR and return loss 160
VTL, compiling and linking C
language 169
VXI Plug-N-Play driver program
example 335
W
W-CDMA ACP measurement 74
W-CDMA CCDF power
measurement 71
W-CDMA multi-carrier power
measurement 77