1
®
Bay Networks BayStack Hubs
Management Module Guide
Notice
Cabletron Systems reserves the right to make changes in specifications and other information
contained in this document without prior notice. The reader should in all cases consult Cabletron
Systems to determine whether any such changes have been made.
The hardware, firmware, or software described in this manual is subject to change without notice.
IN NO EVENT SHALL CABLETRON SYSTEMS BE LIABLE FOR ANY INCIDENTAL,
INDIRECT, SPECIAL, OR CONSEQUENTIAL DAMAGES WHATSOEVER (INCLUDING BUT
NOT LIMITED TO LOST PROFITS) ARISING OUT OF OR RELATED TO THIS MANUAL OR
THE INFORMATION CONTAINED IN IT, EVEN IF CABLETRON SYSTEMS HAS BEEN
ADVISED OF, KNOWN, OR SHOULD HAVE KNOWN, THE POSSIBILITY OF SUCH
DAMAGES.
Virus Disclaimer
Cabletron has tested its software with current virus checking technologies. However, because no
anti-virus system is 100% reliable, we strongly caution you to write protect and then verify that
the Licensed Software, prior to installing it, is virus-free with an anti-virus system in which you
have confidence.
Cabletron Systems makes no representations or warranties to the effect that the Licensed
Software is virus-free.
Copyright © September, 1998, by Cabletron Systems, Inc. All rights reserved.
Printed in the United States of America.
Order Number: 90302292 E3
Cabletron Systems, Inc.
P.O. Box 5005
Rochester, NH 03866-5005
SPECTRUM, the SPECTRUM IMT/VNM logo, DCM, IMT, and VNM are registered
trademarks, and SpectroGRAPH, SpectroSERVER, Inductive Modeling Technology,
Device Communications Manager, and Virtual Network Machine are trademarks of
Cabletron Systems, Inc.
Ethernet is a trademark of Xerox Corporation.
Bay Networks is a registered trademark, and BayStack is a trademark of Bay Networks.
90302292 E3
i
Restricted Rights Notice
(Applicable to licenses to the United States Government only.)
1. Use, duplication, or disclosure by the Government is subject to restrictions as set forth in
subparagraph (c) (1) (ii) of the Rights in Technical Data and Computer Software clause at
DFARS 252.227-7013.
Cabletron Systems, Inc., 35 Industrial Way, Rochester, New Hampshire 03866-5005.
2. (a) This computer software is submitted with restricted rights. It may not be used,
reproduced, or disclosed by the Government except as provided in paragraph (b) of this
Notice or as otherwise expressly stated in the contract.
(b) This computer software may be:
(c)
(1)
Used or copied for use in or with the computer or computers for which it was
acquired, including use at any Government installation to which such computer or
computers may be transferred;
(2)
Used or copied for use in a backup computer if any computer for which it was
acquired is inoperative;
(3)
Reproduced for safekeeping (archives) or backup purposes;
(4)
Modified, adapted, or combined with other computer software, provided that the
modified, combined, or adapted portions of the derivative software incorporating
restricted computer software are made subject to the same restricted rights;
(5)
Disclosed to and reproduced for use by support service contractors in accordance with
subparagraphs (b) (1) through (4) of this clause, provided the Government makes
such disclosure or reproduction subject to these restricted rights; and
(6)
Used or copied for use in or transferred to a replacement computer.
Notwithstanding the foregoing, if this computer software is published copyrighted
computer software, it is licensed to the Government, without disclosure prohibitions, with
the minimum rights set forth in paragraph (b) of this clause.
(d) Any other rights or limitations regarding the use, duplication, or disclosure of this
computer software are to be expressly stated in, or incorporated in, the contract.
(e) This Notice shall be marked on any reproduction of this computer software, in whole or in
part.
ii
Bay Networks BayStack Hubs
Management Module Guide
Contents
Preface
What Is in This Guide .......................................................................................................... ix
Conventions ............................................................................................................................x
Related SPECTRUM Documentation....................................................................................x
Other Related Documentation ............................................................................................. xi
Chapter 1
Introduction
What Is in This Chapter..................................................................................................... 1-1
Bay Networks BayStack Hubs........................................................................................... 1-1
SPECTRUM Support.......................................................................................................... 1-2
Accessing SPECTRUM Views from the Device Icon .................................................. 1-2
Accessing Module-Specific Subviews .......................................................................... 1-5
Spectrum Views Roadmap ................................................................................................. 1-6
Chapter 2
Device Views
What Is in This Chapter..................................................................................................... 2-1
Logical Device View ............................................................................................................ 2-1
Module Icons ....................................................................................................................... 2-3
Backplane Module Icon................................................................................................ 2-3
ENET Media Icon Subviews Menu ............................................................................. 2-4
ENET Media Icon .................................................................................................. 2-4
Segment Icon.......................................................................................................... 2-4
BayStack Ethernet Chassis Redundancy Table View.......................................... 2-5
Ethernet Backplane Segment Statistics view...................................................... 2-7
Segment Icon Subviews Menu..................................................................................... 2-9
Chassis Icon ...................................................................................................................... 2-10
Chassis Icon Subviews Menu Selections .................................................................. 2-11
Chassis Number Label ........................................................................................ 2-11
Chassis Type Label.............................................................................................. 2-11
Segment Number Label....................................................................................... 2-11
Port Number Label .............................................................................................. 2-11
Port Status Label................................................................................................. 2-12
Port Icon Subviews Menu Selections .................................................................. 2-12
Ethernet Port Redundancy View............................................................................... 2-12
NMM Icon ................................................................................................................... 2-16
NMM Icon Subviews Menu ....................................................................................... 2-17
Module Number Label......................................................................................... 2-17
Module Type Label .............................................................................................. 2-17
NMM Agent Download View ............................................................................... 2-17
90302292 E3
iii
Chapter 2
Device Views (continued)
NMM Trap Receiver View....................................................................................2-19
Trap Receiver Table .......................................................................................2-19
Ethernet NMM Show Nodes Table......................................................................2-20
Ethernet NMM Find Nodes Table .......................................................................2-21
Ethernet NMM Topology Table View ..................................................................2-22
NMM Agent View .................................................................................................2-23
Physical Device View ........................................................................................................2-24
Chapter 3
Configuration Views
What Is in This Chapter .....................................................................................................3-1
Chassis Configuration View................................................................................................3-1
Agent Interface View ....................................................................................................3-2
Port Configuration View .....................................................................................................3-3
Module Configuration View ................................................................................................3-4
Module Attachment Table ............................................................................................3-5
NMM Agent Configuration View ........................................................................................3-6
Ethernet Attachment Configuration View.......................................................................3-10
Chapter 4
Event and Alarm Messages
What Is in This Chapter .....................................................................................................4-1
Device Events and Alarms..................................................................................................4-1
Chapter 5
Application Views
What Is in This Chapter .....................................................................................................5-1
Application View .................................................................................................................5-1
Device Application View ...............................................................................................5-2
Stackable Ethernet Application .........................................................................................5-5
BayStack Common Application ..........................................................................................5-5
Chassis Group View......................................................................................................5-5
BayStack Repeater Application..........................................................................................5-6
Index
iv
Bay Networks BayStack Hubs
Management Module Guide
Figures
Chapter 1
Figure 1-1.
Figure 1-2.
Figure 1-3.
Figure 1-4.
Chapter 2
Figure 2-1.
Figure 2-2.
Figure 2-3.
Figure 2-4.
Figure 2-5.
Figure 2-6.
Chapter 5
Figure 5-1.
Figure 5-2.
Introduction
Using Double-Click Zones to Access SPECTRUM Views ................................... 1-3
Using the Icon Subviews Menu to Access SPECTRUM Views .......................... 1-4
Accessing Module-Specific Subviews ................................................................... 1-5
Spectrum Views Roadmap .................................................................................... 1-6
Device Views
Logical Device View .............................................................................................. 2-2
Module Icons ......................................................................................................... 2-3
Backplane Module Icon ........................................................................................ 2-4
Chassis Icon ....................................................................................................... 2-10
NMM Icon ........................................................................................................... 2-16
Physical Device View .......................................................................................... 2-24
Application Views
Device Application View (Icon Mode) .................................................................. 5-3
Device Application View (List Mode) ................................................................... 5-4
Index
90302292 E3
v
Figures
vi
Bay Networks BayStack Hubs
Management Module Guide
Tables
Chapter 1
Table 1-1.
Chapter 2
Table 2-1.
Table 2-2.
Table 2-3.
Table 2-4.
Table 2-5.
Table 2-6.
Table 2-7.
Table 2-8.
Table 2-9.
Table 2-10.
Table 2-11.
Table 2-12.
Table 2-13.
Table 2-14.
Table 2-15.
Table 2-16.
Table 2-17.
Table 2-18.
Table 2-19.
Chapter 3
Table 3-1.
Table 3-2.
Table 3-3.
Table 3-4.
Table 3-5.
Table 3-6.
Table 3-7.
Table 3-8.
Table 3-9.
Table 3-10.
Table 3-11.
Table 3-12.
Table 3-13.
Introduction
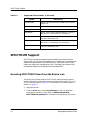
Supported Ethernet Hubs. .................................................................................. 1-1
Device Views
Redundant-capability Values................................................................................ 2-5
Redundancy Mode Values ................................................................................... 2-5
Values That Change Redundancy Mode .............................................................. 2-6
Operational Status Values .................................................................................. 2-6
Chassis Icon Menu Selections............................................................................. 2-11
Port Icon Menu Selections................................................................................... 2-12
Operational Status Values .................................................................................. 2-13
Switchover Status Values ................................................................................... 2-13
Redundant Capability Values ............................................................................. 2-14
Redundancy Mode Values ................................................................................... 2-14
Values That Change Redundancy Mode ............................................................ 2-14
Remote Fault Select Mode Values ...................................................................... 2-15
Transmit Mode Values ........................................................................................ 2-15
NMM Icon Menu Selections ................................................................................ 2-17
Valid Flag Status Values .................................................................................... 2-18
Write Configuration Settings to NVRAM Status Values .................................. 2-19
Receiver Status .................................................................................................... 2-20
Operational Status of MAC Address .................................................................. 2-21
NMM Agent View Subviews Menu Selections ................................................... 2-23
Configuration Views
Partition Status Values......................................................................................... 3-3
Link Status Values ................................................................................................ 3-4
Jabber Status Values ............................................................................................ 3-4
Configuration Source Values ................................................................................ 3-5
Initial Boot Info Source Entries............................................................................ 3-7
Configuration Load Source Values ....................................................................... 3-7
Current Protocol Status Values ............................................................................ 3-8
Next Boot Protocol Values..................................................................................... 3-8
Last Boot Image Save Status Values ................................................................... 3-8
Next Boot Image Load Source Values ................................................................. 3-9
Next Boot Image Save Mode Values..................................................................... 3-9
Write Configuration Settings to NVRAM .......................................................... 3-10
Reboot Agent Values ........................................................................................... 3-10
90302292 E3
vii
Chapter 4
Table 4-1.
Chapter 5
Table 5-1.
Table 5-2.
Table 5-3.
Event and Alarm Messages
Events and Alarms.................................................................................................4-2
Application Views
BayStack ENET Icon Subviews Menu..................................................................5-5
BayStack Common Icon Subviews Menu .............................................................5-5
BSEnetRptr Application Icon Subviews Menu.....................................................5-6
Index
Tables
viii
Bay Networks BayStack Hubs
Management Module Guide
Preface
Use this guide as a reference for the Bay Networks BayStack Hub’s
management software. Before using this guide, you should be familiar with
SPECTRUM’s functions and navigational techniques as described in the
Operations and Administration documentation.
For the purposes of this guide, Bay Networks Baystack Hubs are referred to as
“device.”
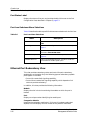
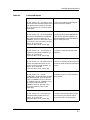
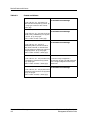
What Is in This Guide
The following outlines the organization of the Bay Networks BayStack
Hubs Management Module Guide:
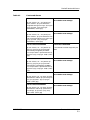
Chapter
Description
Chapter 1
Introduction
Describes the device, the management module
software, and model types. This chapter also
provides information on accessing device-specific
views.
Chapter 2
Device Views
Describes the Device views representing the
device.
Chapter 3
Configuration Views
Describes the Configuration views for the device
and the network management information
provided by the views.
Chapter 4
Event and Alarm Messages
Lists and explains the event and alarm messages
generated in the Event Log or Alarm Manager for
the device.
Chapter 5
Application Views
Describes the Application views and applicationspecific information for this device.
90302292 E3
ix
Conventions
Conventions
This guide uses the following conventions:
• Menu selections and buttons referenced in text appear in bold; for
example, Configuration or Detail.
• Button names appear in shadowed boxes when introducing paragraphs
describing their use; for example:
Help
• Menu navigation appears in order of selection; for example, Icon
Subviews -> Utilities -> Application.
• Referenced chapter titles and section headings appear in italics.
• Referenced documents appear in bold italics.
• References in blue italics are hypertext links for on-line documents.
Related SPECTRUM Documentation
When using this guide, you should have a clear understanding of SPECTRUM
functionality and navigation techniques as described in Operation,
Administration, and the following documentation:
Report Generator User’s Guide
Getting Started with SPECTRUM for Operators
Getting Started with SPECTRUM for Administrators
How to Manage Your Network with SPECTRUM
Preface
x
Bay Networks BayStack Hubs
Management Module Guide
Other Related Documentation
Other Related Documentation
Refer to the following documentation for more information on managing TCP/
IP-based networks:
Martin, James, Kathleen Kavanagh Chapman, Joe Leben. Local Area
Networks: Architectures and Implementations, 2d ed. Englewood Cliffs,
NJ: Prentice Hall, 1994.
Rose, Marshall T. The Simple Book: An Introduction to Management of
TCP/IP-based Internets. Englewood Cliffs, NJ: Prentice Hall, 1991.
Stallings, William. Data and Computer Communications, 4th ed. New
York: Macmillan Publishing Company, 1994.
Tanenbaum, Andrew S. Computer Networks, 3d ed. Englewood Cliffs, NJ:
Prentice Hall, 1996.
90302292 E3
Preface
xi
Other Related Documentation
Preface
xii
Bay Networks BayStack Hubs
Management Module Guide
Chapter 1
Introduction
What Is in This Chapter
This chapter introduces the SPECTRUM management module for Bay
Networks Baystacks Hubs. It describes the following:
• Bay Networks BayStack Hubs
• SPECTRUM Support
- Accessing SPECTRUM Views from the Device Icon
- Accessing Module-Specific Subviews
• SPECTRUM Views Roadmap
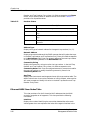
Bay Networks BayStack Hubs
Bay Networks Baystack Hubs are a series of stackable hubs managed through
Simple Network Managment Protocol (SNMP) Agents. These devices provide
network connectivity, via up to 24 RJ-45 connectors, two media adapter slots,
which provide fiber, coaxial, UTP, and AUI interfaces, and network
managment capabilitiy, via an NMM (Network Management Module) slot.
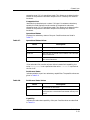
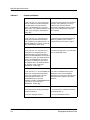
Table 1-1 provides a list of the supported models and their descriptions.
Table 1-1.
Supported Ethernet Hubs.
Model
Description
BayStack10BT-12
10Base-T 12 port chassis with 1 NMM slot and 2 Media
Adpater slots.
BayStack10BT-24
10Base-T 24 port chassis with 1 NMM slot and 2 Media
Adapter slots.
90302292 E3
1-1
SPECTRUM Support
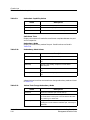
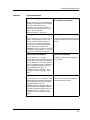
Table 1-1.
Supported Ethernet Hubs. (Continued)
Model
Description
BayStack100BT
100Base-T 12 port chassis with 1 NMM slot and 1 Media
Adapter slot.
BayStack100-TX
100Base-TX Media Adapter for the BayStack100BT.
BayStack100-FX
100Base-FX Fiber Media Adapter for the BayStack100BT.
BayStack150
10BaseT 24 port chassis (BayStack10BT-24) - contains 1
NMM built-in, 1 recessed AUI port, and 24 ports.
BayStack151
10BaseT 24 port chassis (BayStack10BT-24) - contains 24
ports and 1 recessed AUI port.
BayStack152
10BaseT 12 port chassis (BayStack10BT-12) - contains 1
NMM built-in, 1 recessed AUI port, and 12 ports.
BayStack153
10BaseT 12 port chassis (BayStack10BT-12) - contains 12
ports and 1 recessed AUI port.
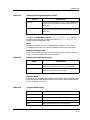
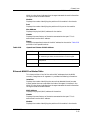
SPECTRUM Support
SPECTRUM management modules enable modeling of a physical device
(hubs, routers, etc.) by providing model types. A model type is a template that
specifies attributes, actions, and associations for a particular device. These
models are graphically represented as icons. The model type names for this
management module are HubBaySt10 and HubBaySt100.
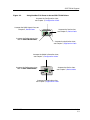
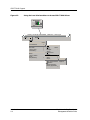
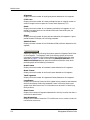
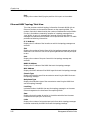
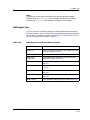
Accessing SPECTRUM Views from the Device Icon
The Device icon provides access to SPECTRUM views that display devicespecific information. Access these views using double-click zones (Figure 1-1)
or Icon Subviews menus (Figure 1-2). To access the Icon Subviews menu as
shown in Figure 1-2:
1. Highlight the icon.
2. From the View menu, select Icon Subviews or click the applicable
mouse button (middle or right). Refer to Getting Started with
SPECTRUM for Operators for information on configuring your mouse.
Introduction
1-2
Bay Networks BayStack Hubs
Management Module Guide
SPECTRUM Support
Figure 1-1.
Using Double-Click Zones to Access SPECTRUM Views
Accesses the Configuration view;
see Chapter 3, Configuration Views.
Accesses the NMM Agent View; see
Chapter 2, Device Views.
Model Name
Accesses the Device view;
see Chapter 2, Device Views.
HubBaySt10
Accesses the Performance view;
refer to SPECTRUM Views.
Accesses the Application view;
see Chapter 5, Application Views.
Accesses the Model Information view;
see Chapter 3, Configuration Views.
Accesses the Performance view;
refer to SPECTRUM Views.
Model Name
Accesses the Device view;
see Chapter 2, Device Views.
HubBaySt10
Accesses the Application view;
see Chapter 5, Application Views.
90302292 E3
Introduction
1-3
SPECTRUM Support
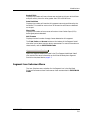
Figure 1-2.
Using the Icon Subviews Menu to Access SPECTRUM Views
Model Name
HubBaySt10
Primary Landscape 0x00400000 - VNM Host - LAN of type
*
File
View
Help?
Go Back
Ctrl+b
Go Up
Icon Subviews
View Path
New View
Jump to View
View History...
Current View Information...
Notes
Jump by Name...
Zoom
Map Hierarchy
Introduction
1-4
Close
Alt+F4
ctrl+c
Navigate
Alarms
Performance
Notes...
Utilities
Zoom
Device
Acknowledge
Flash Green Enabled
Application
Model Information
Primary Application
Logical
Physical
Bay Networks BayStack Hubs
Management Module Guide
SPECTRUM Support
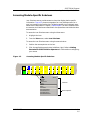
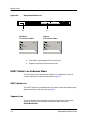
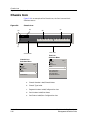
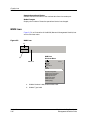
Accessing Module-Specific Subviews
Accessing Module-Specific Subviews
Icon Subviews menus provide access to views that display device-specific
information. Figure 1-3 shows an example of an Icon Subviews menu for a
port icon located in the Device view. The device-specific Icon Subview’s menu
selections are described in Chapter 2, Device Views. The menu selections that
are common to all devices are described in the Operations and Administration
documentation.
To access the Icon Subviews menu using the View menu:
1. Highlight the icon.
2. From the View menu, select Icon Subviews.
To access the Icon Subviews menu using the mouse button:
1. Position the mouse pointer on the icon.
2. Click the applicable mouse button (middle or right). Refer to Getting
Started with SPECTRUM for Operators for information on configuring
your mouse.
Figure 1-3.
Accessing Module-Specific Subviews
1
NLNK
3
PART
5
NLNK
7
NLNK
9
NLNK
11
NLNK
13
NLNK
15
NLNK
17
NLNK
19
NLNK
21
NLNK
23
NLNK
2
LINK
4
NLNK
6
NLNK
8
NLNK
10
NLNK
12
NLNK
14
NLNK
16
NLNK
18
NLNK
20
NLNK
22
NLNK
24
NLNK
Close
Navigate
Alarms
Performance
Notes...
Utilities
Zoom
Port Notes
Port Configuration
Port Performance
Port Redundancy
Enable/Disable Port
90302292 E3
Alt+F4
Common
Device-Specific
Introduction
1-5
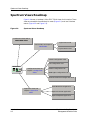
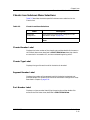
Spectrum Views Roadmap
Spectrum Views Roadmap
Figure 1-4 shows a “roadmap” of the SPECTRUM views for this device. These
views are accessible from double-click zones (Figure 1-1) and Icon Subviews
menus (Figure 1-2 and Figure 1-3).
Figure 1-4.
Spectrum Views Roadmap
Performance View; refer to
SPECTRUM Views.
Logical Device View
Device Views; see Chapter 2,
Device Views.
Physical Device View
Chassis Configuration View
Port Configuration View
Model Name
HubBaySt10
Configuration Views; see
Chapter 3, Configuration
Views.
Module Configuration View
NMM Agent Configuration View
Ethernet Attachment Configuration View
Stackable Ethernet application
Application Views; see
Chapter 5, Application
Views.
BayStack Common application
BayStack Repeater application
Introduction
1-6
Bay Networks BayStack Hubs
Management Module Guide
Chapter 2
Device Views
What Is in This Chapter
This chapter describes the following views for the Bay Networks BayStack
Hub’s Management Module.
• Logical Device view
• Physical Device view
For more information on Accessing SPECTRUM Views from the Device Icon,
see Chapter 1, page 1-2 and Accessing Module-Specific Subviews, page 1-5.
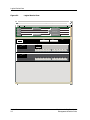
Logical Device View
This view displays a logical representation of the modules installed in the hub.
The logical module representation provides information about the individual
modules installed in the hub. If the configuration changes during the polling
cycle SPECTRUM modifies the Device view, after the next polling cycle, to
reflect the new configuration. Figure 2-1 shows an example of the Logical
Device view.
90302292 E3
2-1
Logical Device View
Figure 2-1.
Logical Device View
DVBANNER View - of type HubBaySt10
* File
View
Model
Help?
System Up Time
Network Address
Manufacturer
Contact
Device Type
Description
Location
Serial Number
Primary Application
SEG 1
ENET
5
SEG 3
8
10BT-24
10BTaNMM
S2
10
SEG 2
1
Nlink
3
Part
5
Link
7
Nlink
9
2
Nlink
4
Nlink
6
Nlink
8
Nlink
10
1
Nlink
3
Nlink
5
Nlink
7
Nlink
9
2
Nlink
4
Nlink
6
Nlink
8
Nlink
10
Nlink
11 Nlink 13 Nlink 15 Nlink 17 Nlink 19 Nlink 21 Nlink 23 Nlink
14 Nlink 16 Nlink 18 Nlink 20 Nlink 22 Nlink 24 Nlink
Nlink 12 Nlink
10BT-24
S2
Device Views
2-2
Nlink
11 Nlink 13 Nlink 15 Nlink 17 Nlink 19 Nlink 21 Nlink 23 Nlink
14 Nlink 16 Nlink 18 Nlink 20 Nlink 22 Nlink 24 Nlink
Nlink 12 Nlink
Bay Networks BayStack Hubs
Management Module Guide
Module Icons
Backplane Module Icon
Module Icons
Figure 2-2 shows an example of the Module icons that comprise the device.
This example contains a Chassis Module icon, a Backplane Module icon and
an NMM (Network Management Module) icon. This example and all of its
parts are described in this chapter.
Figure 2-2.
Module Icons
Backplane Module Icon
SEG 1
ENET
5
SEG 2
SEG 3
8
10BT-24
10BTaNMM
S2
1
Nlink
3
Part
5
Link
7
Nlink
9
2
Nlink
4
Nlink
6
Nlink
8
Nlink
10
Nlink
11 Nlink 13 Nlink 15 Nlink 17 Nlink 19 Nlink 21 Nlink 23 Nlink
14 Nlink 16 Nlink 18 Nlink 20 Nlink 22 Nlink 24 Nlink
Nlink 12 Nlink
NMM Icon
Chassis Module Icon
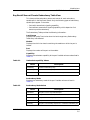
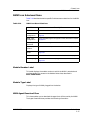
Backplane Module Icon
Figure 2-3 is an example of the Backplane Module icon. This Icon contains an
Enet Media icon and three Segment icons. In addition, the subviews menus
for these icons are included.
90302292 E3
Device Views
2-3
Module Icons
ENET Media Icon Subviews Menu
Figure 2-3.
Backplane Module Icon
SEG 1
ENET
SEG 2
SEG 3
(b)
(a)
Enet Media
Icon Subviews Menu
Close
Navigate
Alarms
Performance
Notes...
Utilities
Redundancy Table
Ctrl+c
Segment
Icon Subviews Menu
Close
Navigate
Alarms
Performance
Notes...
Utilities
Segment Performance
Ctrl+c
a. Enet Media Icon/Backplane Performance View.
b. Segment Icon/Ethernet Performance View
ENET Media Icon Subviews Menu
The Enet Media Icon Subviews menu selection is the BayStack Ethernet
Chassis Redundancy Table View, described on page 2-5.
ENET Media Icon
The ENET Media icon provides double-click access to the Ethernet Backplane
Segment Statistics view, described on page 2-7.
Segment Icon
This icon identifies which segment the device is attached to and provides
double-click access to the Ethernet Performance View, described in
SPECTRUM Views.
Device Views
2-4
Bay Networks BayStack Hubs
Management Module Guide
Module Icons
ENET Media Icon Subviews Menu
BayStack Ethernet Chassis Redundancy Table View
This view provides redundancy status and control for each redundancycapable port in the BayStack chassis. Only the following types of redundancycapable ports appear in the table:
• Ports with remote fault signaling capability
• Ports without remote fault signaling capability which depend on link
status to provide redundancy
The Redundancy Table provides the following information:
Last Change
Displays the “sysUpTime” value when the last change to any Redundancy
Table entry was detected.
Module
Displays the slot in the chassis containing the module on which the port is
located.
Port
Displays the number of the port on the module.
Capability
Displays the redundant-capability of the port. Possible values are described in
Table 2-1.
Table 2-1.
Redundant-capability Values
Value
Description
hwRedOnly
hardware redundancy only
swRedOnly
software redundancy only
hwAndswRed
both hardware and software redundancy
Redundancy Mode
Displays the redundancy mode of the port. Possible values are listed in
Table 2-2.
Table 2-2.
Redundancy Mode Values
Value
90302292 E3
Description
standalone
The port is not in any redundant pair.
hwActive
The port is the active companion in a hardware-redundant pair.
hwStandby
The port is the standby companion in a hardware-redundant pair.
swActive
The port is the active companion in a software-redundant pair.
swStandy
The port is the standby companion in a software-redundant pair.
Device Views
2-5
Module Icons
ENET Media Icon Subviews Menu
Values that can be written to the device to change redundancy mode are
described in Table 2-3.
Table 2-3.
Values That Change Redundancy Mode
Value
Description
standalone
Causes the redundant pair to be broken up.
hwActive
If the previous value was hwStandby, this value causes the port to
become the active port in the hardware-redundant pair, resulting
in a switchover.
hwStandby
If the previous value was hwActive, this value causes the port to
become the standby port in the hardware-redundant pair,
resulting in a switchover.
swActive
If the previous value was swStandby, this value causes the port to
become the active port in the software-redundant pair, resulting
in a switchover.
swStandy
If the previous value was swActive, this value causes the port to
become the standby port in the hardware-redundant pair,
resulting in a switchover.
Changing the Redundancy Mode to hwActive or hwStandby, creates a
hardware-redundant pair. Changing this field to swActive or swStandby,
creates a software-redundant pair.
Operational Status
Displays the redundancy status of the port. Possible values and their
descriptions are listed in Table 2-4.
Table 2-4.
Operational Status Values
Value
Description
other
None of the following.
ok
No faults detected.
localFault
The local port has sensed a fault condition. This value will
cause a switchover.
remoteFault
The remote port has sensed a fault condition. This value
will cause a switchover.
If the redundant link consists of ports without remote fault capability, the
value remoteFault is not reported and the value localFault implies that
the link is off.
Device Views
2-6
Bay Networks BayStack Hubs
Management Module Guide
Module Icons
Faults
Displays the number of local or remote faults on this port. This counter
increments whenever there is a transition between a fault and no-fault state.
Companion Module
Identifies the redundant module slot. If this port is hardware-redundant
capable, this field displays the slot number of the potential redundant
companion even if it is in standalone mode. This allows you to determine the
location of the potential redundant companion as it is fixed by the board’s
hardware.
Companion Port
Identifies the redundant port number. If this port is hardware-redundant
capable, this field displays the slot number of the potential redundant
companion even if it is in standalone mode. This allows you to determine the
location of the potential redundant companion as it is fixed by the board’s
hardware.
Ethernet Backplane Segment Statistics view
This view provides statistical data on all backplane traffic for the device. It
contains the following:
Update
Click this button to update the table information.
Totals
CLick this button to display the total errors as described below.
Set/Clear Filter
Allows you to toggle between set filter and clear filter.
Sort Up/Down/Unsort
Allows sorting of the table, based on the values in a selected column.
Src Index
Displays the index of the entry in the table.
Good Frames
Displays the total number of good frames detected on this segment.
Collisions
Displays the total number of collisions detected on this segment.
90302292 E3
Device Views
2-7
Module Icons
Alignment
Displays the total number of misaligned packets detected on this segment.
FCS Errors
Displays the total number of frames received that are an integral number of
octets in length but do not pass the Frame Check Sequence (FCS).
Runts
Displays the total number of runt packets received by this segment. A runt
packet is one byte less than the standard Ethernet frame of 64 bytes, not
including preamble.
Giants
Displays the total number of giant packets received by this segment. A giant
packet exceeds 1518 bytes, not including preamble.
OOW Collisions
Displays the total number of Out Of Window (OOW) collisions detected on this
segment.
Segment Detail
Selecting a segment and clicking this buttons opens the Segment Detail View
for that segment . The Segment Detail View displays graphs of the same
information displayed in the Ethernet Backplane Segment Statistics view,
described on page 2-7, as well as a button for Additional Statistics. The
Additional Statistics button opens the Additional Statistics view, which
provides graphs of the following information:
Bcast Frames
Displays the total number of broadcast frames detected on this segment.
Mcast Frames
Displays the total number of multicast frames detected on this segment.
TotalFragments
Displays the total number of fragmented frames detected on this segment.
Long Events
Displays the number of times that MAU jabber lockup protection was detected
due to transmission of data that exceeded 5 msec in duration (Octet count
greater than MaxFrame size). This information can be useful in identifying
faulty stations.
Short Events
Displays the number of fragments detected with Activity Duration less than a
minimum threshold value.
Rate Mismatches
Displays the number of times the FIFO buffer over-runs or under-runs due to
transmission rate errors.
Device Views
2-8
Bay Networks BayStack Hubs
Management Module Guide
Module Icons
Backoff Fails
Displays the number of times a frame was received on this port with collision
and port activity time of a value greater than 552 to 560 bit time.
Auto Partitions
Displays the number of times that this segment was auto-partitioned by the
hardware. This condition occurs when 32 consecutive collisions are detected
on the port.
Short IPGs
Displays the number of occurrences of too short Inter-Packet Gaps (IPGs)
before good packets detected.
Null Frames
Displays the total number of empty frames detected on this segment.
The Total, Delta, and Accum buttons at the bottom of the Segment Detail
view allow you to select how the data is represented. For more information on
these buttons, refer to SPECTRUM Views.
Segment Additional Detail
Opens the Segment Additional Detail view. The Segment Additional Detail
view contains the same information as the Ethernet Backplane Segment
Statistics view, described on page 2-7.
Segment Icon Subviews Menu
The Icon Subviews menu selection for the Segment icon is the BayStack
Ethernet Performance view. Performance views are described in SPECTRUM
Views.
90302292 E3
Device Views
2-9
Chassis Icon
Segment Icon Subviews Menu
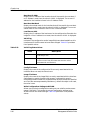
Chassis Icon
Figure 2-4 is an example of the Chassis icon, the Port icons and their
Subviews menus.
Figure 2-4.
Chassis Icon
(b)
(a)
10
(e)
(d)
10BT-24
S2
1
Nlink
3
Nlink
5
Nlink
7
Nlink
9
2
Nlink
4
Nlink
6
Nlink
8
Nlink
10
Nlink
11 Nlink 13 Nlink 15 Nlink 17 Nlink 19 Nlink 21 Nlink 23 Nlink
14 Nlink 16 Nlink 18 Nlink 20 Nlink 22 Nlink 24 Nlink
Nlink 12 Nlink
(c)
Port Icons
Chassis Icon
Port Icon
Subviews Menu
Chassis Icon
Subviews Menu
Close
Ctrl+c
Navigate
Alarms
Performance
Notes...
Utilities
Attachment Configuration
Chassis Notes
Close
Navigate
Alarms
Performance
Notes...
Utilities
Port Notes
Port Configuration
Port Performance
Port Redundancy
Enable/Disable Port
Ctrl+c
a. Chassis Number Label/Chassis Notes.
b. Chassis Type Label
c.
Segment Number Label/Configuration view
d. Port Number Label/Port Notes
e.
Device Views
2-10
Port Status Label/Port Configuration view
Bay Networks BayStack Hubs
Management Module Guide
Chassis Icon
Chassis Icon Subviews Menu Selections
Chassis Icon Subviews Menu Selections
Table 2-5 describes the device-specific Subviews menu selections for the
Chassis icon.
Table 2-5.
Chassis Icon Menu Selections
Menu
Description
Attachment
Configuration
Opens the Ethernet Attachment Configuration View
described in Chapter 3, page 3-10.
Chassis Notes
Opens the Chassis Notes view, described in SPECTRUM
Views.
Chassis Number Label
Displays the index number of the chassis and provides double-click access to
the Chassis Notes view, described in SPECTRUM Views. Note that chassis
are counted in increments of 5, and are numbered beginning with 5.
Chassis Type Label
Displays the type of chassis to which the device is attached.
Segment Number Label
Displays the number of the segment to which the device is attached and
provides double-click access to the Ethernet Attachment Configuration View,
described in Chapter 3, page 3-10.
Port Number Label
Displays a unique number identifying the port and provides double-click
access to the Port Notes view, described in SPECTRUM Views.
90302292 E3
Device Views
2-11
Chassis Icon
Ethernet Port Redundancy View
Port Status Label
Displays the status of the port and provides double-click access to the Port
Configuration View, described in Chapter 3, page 3-3.
Port Icon Subviews Menu Selections
Table 2-6 descibes the device-specific Subviews menu selections for the Port icon.
Table 2-6.
Port Icon Menu Selections
Menu
Description
Port Notes
Opens the Port Notes view, described in SPECTRUM
Views.
Port Configuration
Opens the Port Configuration view, described in Chapter 3,
page 3-3.
Port Performance
Opens the BayStack Ethernet Port Performance view,
described in SPECTRUM Views.
Port Redundancy
Opens the Ethernet Port Redundancy view, described on
page 2-12.
Enable/Disable Port
Displays the Enable/Disable Port view which allows the
user to enable or disable specific ports
Ethernet Port Redundancy View
This view provides redundancy status and control for each redundancycapable port on the device. Only the following types of redundancy-capable
ports appear in the table:
• Ports with remote fault signaling capability.
• Ports without remote fault signaling capability which depend on link
status to provide redundancy.
In addition, this view provides the following information:
Module
Displays the slot in the hub containing the module on which the port is
located.
Port
Displays a unique number identifying the module port.
Companion Module
Identifies the redundant module slot. If this port is hardware-redundant
capable, this field displays the slot number of the potential redundant
Device Views
2-12
Bay Networks BayStack Hubs
Management Module Guide
Chassis Icon
Ethernet Port Redundancy View
companion even if it is in standalone mode. This allows you to determine the
location of the potential redundant companion as it is fixed by the module’s
hardware.
Companion Port
Identifies the redundant port number. If this port is hardware-redundancy
capable, this field displays the slot number of the potential redundant
companion even if it is in standalone mode. This allows you to determine the
location of the potential redundant companion as fixed by the module’s
hardware.
Operational Status
Displays the redundancy status of the port. Possible values are listed in
Table 2-7.
Table 2-7.
Operational Status Values
Value
Description
other
Does not belong top a redundant pair.
ok
No faults detected.
localFault
The local port has sensed a fault condition. This value will
cause a switchover.
remoteFault
The remote port has sensed a fault condition. This value
will cause a switchover.
If the redundant link consists of ports without remote fault capability, the
value remoteFault is not reported and the value localFault implies that
the link is off.
Switchover Status
Indicates whether a port has redundancy capabilities. The possible values are
given in Table 2-8.
Table 2-8.
Switchover Status Values
Value
Description
other
An unknown or other state.
timedSwitchover
The port is active and another port is in standby. if the
active port fails a timed switchover between the two ports
occurs.
Capability
Indicates the redundant-capability of the port. Possible values are described
in Table 2-9.
90302292 E3
Device Views
2-13
Chassis Icon
Ethernet Port Redundancy View
Table 2-9.
Redundant Capability Values
Value
Description
hwRedOnly
hardware redundancy only
swRedOnly
software redundancy only
hwAndswRed
both hardware and software redundancy
Switchover Time
Displays the amount of time before a switchover completes between the port
and its companion.
Redundancy Mode
Displays the redundancy mode of the port. Possible values are listed in
Table 2-10.
Table 2-10.
Redundancy Mode Values
Value
Description
standalone
The port is not in any redundant pair.
hwActive
The port is the active companion in a hardware-redundant
pair.
hwStandby
The port is the standby companion in a hardwareredundant pair.
swActive
The port is the active companion in a software-redundant
pair.
swStandy
The port is the standby companion in a software-redundant
pair.
Values that can be written to the device to change redundancy mode are listed
in Table 2-11.
Table 2-11.
Values That Change Redundancy Mode
Value
Device Views
2-14
Description
standalone
Causes the redundant pair to be broken up.
hwActive
If the previous value was hwStandby, this value causes the
port to become the active port in the hardware-redundant
pair, resulting in a switchover.
hwStandby
If the previous value was hwActive, the port becomes the
standby port in the hardware-redundant pair, resulting in a
switchover.
Bay Networks BayStack Hubs
Management Module Guide
Chassis Icon
Ethernet Port Redundancy View
Table 2-11.
Values That Change Redundancy Mode
Value
Description
swActive
If the previous value was swStandby, the port becomes the
active port in the software-redundant pair, resulting in a
switchover.
swStandy
If the previous value was swActive, the port becomes the
standby port in the hardware-redundant pair, resulting in a
switchover.
Changing the Redundancy Mode to hwActive or hwStandby, creates a
hardware-redundant pair. Changing this field to swActive or swStandby,
creates a software-redundant pair.
Faults
Displays the number of local or remote faults on this port. This counter
increments when there is a transition between a fault and no-fault state.
Remote Fault Slect Mode
The set of local modes that contain fault events that will cause a switchover.
Table 2-12 lists the modes and their descriptions.
Table 2-12.
Remote Fault Select Mode Values
Mode
Description
standard
Contains the standard set of fault events: link-off, low light,
jabber, Rx invalid idle, Tx dark, and Tx remote fault.
synoptics
Incorporates the standard set of faults, in addition to autopartition and network partition events.
Transmit Mode
Displays which type of explorer packet will be transmitted by the standby port
to the active port to determine if the active port is still alive. Possible values
for this are given in Table 2-13.
Table 2-13.
Transmit Mode Values
Value
90302292 E3
Description
autocfg
The port is in automatic configuration.
fl
The port is configured in 10 BaseFL mode.
fb
The port is configured in 10 BaseFB mode.
other
None of the above: the port is not a fiber port.
Device Views
2-15
Chassis Icon
NMM Icon
Remote Operational Status
Reflects the real time status of the received data from the remote port.
Mode Changes
Displays the number of times the operational status has changed.
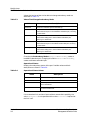
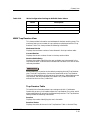
NMM Icon
Figure 2-5 is an illustration of the NMM (Network Management Module) icon
and its Subviews menu.
Figure 2-5.
NMM Icon
(a)
8
10BTaNMM
NMM Icon
Subviews Menu
(b)
NMM Icon
Close
Ctrl+c
Navigate
Alarms
Performance
Notes...
Utilities
Module Notes
Module Configuration
NMM Agent Configuration
NMM Agent Download
NMM Trap Receiver
NMM Show Nodes
NMM Find Nodes
NMM Topology
a. Module Number Label/ Module Notes View
b. Module Type Label
Device Views
2-16
Bay Networks BayStack Hubs
Management Module Guide
Chassis Icon
NMM Icon Subviews Menu
NMM Icon Subviews Menu
Table 2-14 descibes the device-specific Subviews menu selections for the NMM
icon.
Table 2-14.
NMM Icon Menu Selections
Menu
Description
Module Notes
Opens the Module Notes view, described in SPECTRUM Views.
Module
Configuration
Opens the Module Configuration View, described in Chapter 3,
page 3-4.
NMM Agent
Configuration
Opens the NMM Agent Configuration View, described in Chapter
3, page 3-6.
NMM Agent
Download
Opens the NMM Agent Download View, described on page 2-17.
NMM Trap
Receiver
Opens the NMM Trap Receiver View, described on page 2-19.
NMM Show
Nodes
Opens the ENET NMM Show Nodes Table, described on
page 2-20.
NMM Find Nodes Opens the ENET NMM Find Nodes Table, described on page 2-21.
NMM Topology
Opens the ENET NMM Topology Table View, described on
page 2-22.
Module Number Label
This label displays the module number to which the NMM is attached and
provides double-click access to the Module Notes view, described in
SPECTRUM Views.
Module Type Label
Displays the type of NMM plugged into the device.
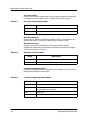
NMM Agent Download View
This view enables you to download the agent that will be used by the NMM.
The Agent Download view provides the following information:
90302292 E3
Device Views
2-17
Chassis Icon
NMM Icon Subviews Menu
Next Boot IP Addr
Displays the IP address of the interface that will be used for the next boot. If
no IP address is used, then the value is 0.0.0.0. is displayed. The current IP
address for the interface is found in the IP Address Table.
Next Boot Net Mask
Displays the subnet mask for the interface that will be used for the next boot.
If no subnet mask is used, then the value is 0.0.0.0. is displayed. The current
subnet mask for the interface is found in the IP Address Table.
Load Server Addr
Displays the IP address of the load server for the configuration file and/or the
image file. If the IP address is not used, then the value is 0.0.0.0. is displayed.
Valid Flag
Indicates if the configuration and/or image file(s) were downloaded from this
interface and if the file names have not been changed. Table 2-15 provides a
list of possible values.
Table 2-15.
Valid Flag Status Values
Value
Description
valid
Configuration and/or image file(s) downloaded from this interface
are currently in use.
invalid
Configuration and/or image files downloaded from this interface
are not in use (this may also mean that there are no files
downloaded from this interface).
Config File Name
Displays the name of the configuration file currently associated with the
interface. When not used, the value is zero.
Image File Name
Displays the name of the image file(s) currently associated with the interface.
Some agents in special situations may support a value which contains
multiple file names instead of a single file name. Multiple names are specified
as a list of file names separated by semicolons (;). When this object is not used,
the value is zero.
Write Configuration Settings to NVRAM
Allows you to write the configuration settings to non-volatile random access
memory (NVRAM). This causes the current configuration settings to be
written to local non-volatile storage. Table 2-16 provides a list of possible
values.
Device Views
2-18
Bay Networks BayStack Hubs
Management Module Guide
Chassis Icon
NMM Icon Subviews Menu
Table 2-16.
Write Configuration Settings to NVRAM Status Values
Value
Description
valid
contents valid
write
write configuration settings to local storage (such as NVRAM)
other
unknown or other state
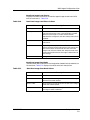
NMM Trap Receiver View
This view provides information and addresses for devices receiving traps. The
maximum and current number of trap receivers are displayed with the Trap
Receiver Table. This view provides the following information:
Maximum Entries
Displays the maximum number of rows allowed in the trap receiver table.
Current Entries
Displays the current number of rows in the trap receiver table.
Next Available Entry
Displays the number identifying the next available row to be created in the
trap receiver table. A value of zero indicates that the table is full and no more
rows may be added.
Add Receiver
Allows addition of a receiver to the table by accessing the Add Trap Receiver
view. The Add Trap Receiver view has the same fields as the Trap Receiver
Table, but allows addition of information for the new entry. When adding a new
trap receiver, the value displayed in the Next Entry Index field must be
entered into the Use Entry Index field.
Trap Receiver Table
This table lists information about trap receivers and their IP addresses.
Double-click an entry in this table to open the Trap Receiver Entry view, which
allows modification of values for the selected trap receiver. The Trap Receiver
table provides the following information:
Receiver
Displays the number identifying the row in the table.
Receiver Status
Displays the status of the row in the Trap Receiver Table. In the Add Trap
90302292 E3
Device Views
2-19
Chassis Icon
NMM Icon Subviews Menu
Receiver and Trap Receiver Entry views, this field corresponds to the Status
button, which allows creation or deletion entries for the table. Table 2-17
provides a list of possible values.
Table 2-17.
Receiver Status
Value
Description
Valid
Read-only status indicating the row exists and is valid.
Delete
Writeable value that deletes the row ( Trap Receiver Entry view
only).
Create
Writeable value that creates a new row (Add Trap Receiver view
only).
Other
Read-only status indicating the row is unknown, or some other
case exists.
Address Type
Displays the type of network address for the agent’s trap receiver (i.e., IP).
Network Address
Displays the network address of the SNMP manager that will receive the traps.
In the Add Trap Receiver and Trap Receiver Entry views, this field corresponds
to the Net Address field. Enter the network address of the new trap receiver
or modify the existing address in the Net Address field.
Community String
Displays the community string to use for the trap receiver. In the Add Trap
Receiver and Trap Receiver Entry views, this field corresponds to the
Community Name field. Enter the assigned community name to be used for
the new trap receiver or modify the existing community name in the
Community Name field.
Age Time
Displays the time interval used to age entries out of the trap receiver table. The
default value is zero. A zero value indicates an infinite timeout, where entries
will never be aged out. Modify this value in the Add Trap Receiver and Trap
Receiver Entry views.
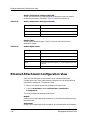
Ethernet NMM Show Nodes Table
This view provides a list of all the active MAC addresses that the NMM
currently recognizes on all segments. This view provides the following
information:
Interface
Displays the number identifying the source that detected the active node.
Values greater than zero represent the index of the agent’s interface in the
Device Views
2-20
Bay Networks BayStack Hubs
Management Module Guide
Chassis Icon
NMM Icon Subviews Menu
NMM. A value of zero indicates that the agent detected the node information
through the best available method.
Module
Displays the number identifying the position of this module in the chassis.
Port
Displays the number identifying the position of this port on the module.
Mac Address
Displays the physical (MAC) address for the station.
Vendor
Displays the manufacturer of the device connected to that port. This is
determined from the MAC address.
Status
Displays the operational status of the MAC address for the station. Table 2-18
provides a list of possible values.
Table 2-18.
Operational Status of MAC Address
Value
Description
active
The station has sent a frame within the required time period, or
for Token Ring or FDDI, that the station is in the ring poll.
inactive
The station is idle, having sent no frames within the required
time period.
other
The address is unknown or in some other state.
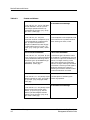
Ethernet NMM Find Nodes Table
This view provides a list of all the active MAC addresses that the NMM
currently recognizes on all segments. It provides the following information:
Interface
Displays the number identifying the source that detected the active node.
Values greater than zero represent the index of the agent’s interface in the
NMM. A value of zero indicates that the agent detected the node information
through the best available method.
MAC Address
Displays the physical (MAC) address of the station.
Vendor
Displays the manufacturer of the device connected to that port. This is
determined from the MAC address.
Module
Displays the number identifying the position of this module in the chassis.
90302292 E3
Device Views
2-21
Chassis Icon
NMM Icon Subviews Menu
Port
Displays the number identifying the position of this port on the module.
Ethernet NMM Topology Table View
This view provides a table of topology information from each NMM with an
Ethernet interface on the same flat network as the reporting NMM. The
number of entries is determined by the number of detected and active NMMs.
Entries in the table are created by reception of a topology message from a
“new” NMM. An entry is automatically removed from the table after no
messages are received from the NMM in the required time interval. This table
provides the following information:
IF IP Address
Displays the IP address of the interface on which the topology message was
received.
Slot
Displays the number of the slot from which the topology message was received.
Note: there is an artificial 'row' for the reporting NMM with slot and port equal
to zero.
Port
Displays the number of the port from which the topology message was
received.
NMM IP Address
Displays the IP address of the NMM that sent the topology message.
MAC Address
Displays the MAC address of the NMM agent that sent the topology message.
Chassis Type
Displays the chassis type of the concentrator containing the NMM that sent
the topology message.
Backplane Type
Displays the backplane type of the concentrator containing the NMM that
sent the topology message.
Local Seg
Indicates whether the NMM that sent the topology message is on the same
Ethernet segment as the interface of the reporting NMM.
Seen
Displays the total number of entries in the table reachable from the same
interface and slot-port pair as this entry.
Links
Displays the number of unique slot-port pairs from which topology messages
have been received by the NMM that sent the topology message.
Device Views
2-22
Bay Networks BayStack Hubs
Management Module Guide
Chassis Icon
NMM Icon Subviews Menu
State
Displays the current state of the NMM that sent the topology message.
Possible values are: topChanged if the topology information has recently
changed and heartbeat if the topology information is unchanged.
NMM Agent View
This is a container view which displays all NMM Agent modules contained
within the chassis. Table 2-19 lists all of the specific Subviews menu selections
for this agent. To access this view see Accessing SPECTRUM Views from the
Device Icon, described in Chapter 1, page 1-5.
Table 2-19.
NMM Agent View Subviews Menu Selections
Menu
90302292 E3
Description
Application
Opens an application view specific to the NMM Agent. See
Chapter 5, Application Views.
Primary Appliction
Updates the primary application view to MIB II.
NMM Agent
Configuration
Opens the BayStack NMM Agent Configuration View,
described in Chapter 3, page 3-6.
NMM Agent Download
Opens the NMM Agent Download View, described on
page 2-17.
NMM Trap Receiver
Opens the NMM Trap Receiver View, described on
page 2-19.
NMM Show Nodes
Opens the ENET NMM Show Nodes Table, described on
page 2-20.
NMM Find Nodes
Opens the ENET NMM Find Nodes Table, described on
page 2-21.
NMM Topology
Opens the ENET NMM Topology, described on page 2-22.
Device Views
2-23
Physical Device View
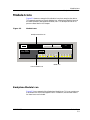
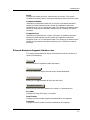
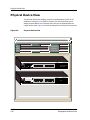
Physical Device View
The physical device view displays a physical representation of each of the
modules in the device. If an NMM is present, this view also allows you to
access the same NMM Icon Subviews menu that can be accessed from the
Logical Device view. Figure 2-6 shows an example of the Physical Device view.
Figure 2-6.
Physical Device View
DVBANNER View - of type HubBaySt10
* File
View
Help?
Model
System Up Time
Network Address
Contact
Manufacturer
Description
Device Type
Location
Serial Number
Primary Application
Bay Networks
Baystack
13
1
Expansion Slot
comm Port
10BASET Hub
23
11
12
2
14
24
A----Media Adapter ---- B
Bay Networks
Bay Networks BayStack
BayStack
NMM
13
1
Expansion Slot
comm Port
10BASET Hub
23
11
12
2
14
24
A----Media Adapter ---- B
Device Views
2-24
Bay Networks BayStack Hubs
Management Module Guide
Chapter 3
Configuration Views
What Is in This Chapter
This chapter describes the following Configuration views available for Bay
Networks Baystack Hubs. These views display network configuration and
operating information for the device and its interfaces.
•
•
•
•
•
Chassis Configuration
Port Configuration
Module Configuration
NMM Agent Configuration
Attachment Configuration
Chassis Configuration View
This view contains detailed network configuration information for the chassis.
It provides configuration information on the device model in the VNM database
and the device’s firmware configuration.
Chassis Version
Displays the current version of the chassis.
Chassis Serial Number
Displays the serial number of the chassis. A value of zero indicates the serial
number is unknown or unavailable.
Chassis Type
Displays a description of the chassis type.
90302292 E3
3-1
Chassis Configuration View
Chassis Contact
Allows you to enter or modify the contact information for the person
responsible for the chassis.
Chassis Description
Displays a physical description of the chassis.
Chassis Location
Allows you to modify the description of the physical location of the chassis
(e.g., fourth floor wiring closet).
Total Physical Changes
Displays the total number of physical changes (i.e., the addition or removal of
a component or sub-component) that have been detected in the chassis since
the start of the agent.
Last Physical Change
Displays the value of the sysUpTime variable when the last physical change
(i.e., addition or removal of a module) was detected in the chassis.
Total Attachment Changes
Displays the total number of attachment changes across all modules in the
chassis that have been detected since the start of the agent.
Last Attachment Change
Displays the value of the sysUpTime variable when the last attachment
change on any module in the chassis was detected.
Total Configuration Changes
Displays the total number of configuration changes (other than attachment
changes, physical additions or removals) across all modules in the chassis that
have been detected since the start of the agent.
Last Configuration Change
Displays the value of the sysUpTime variable when the last configuration
change (other than attachment changes or physical additions or removals) on
any module in the chassis was detected.
Agent Interface
Accesses the Agent Interface View, described on page 3-2.
Agent Interface View
This view contains the Agent IF Table, which provides information about each
interface for each agent in the chassis. The number of entries in the table is
determined by the number of agents in the chassis. The Agent IF Table
provides the following configurable information:
Configuration Views
3-2
Bay Networks BayStack Hubs
Management Module Guide
Port Configuration View
Component Index
Displays the number of the module containing the agent.
Interface Index
Displays the index number of the interface.
IP Address
Displays the IP address of the interface. A value of 0.0.0.0. indicates the IP
address is unknown or unused.
Port Configuration View
This view provides information on the configuration of the selected port. To
access this view:
1. Within the Logical Device view, highlight the Port icon.
2. From the View Menu select Icon Subviews > Port Configuration.
This view provides the following information:
Module
Displays the number specifying the location in the hub of the module the port
is on.
Port
Displays the number uniquely identifying the selected port on the module.
Part Status
Allows you to change the partition status of the selected port. The possible
values are listed in Table 3-1.
Table 3-1.
Partition Status Values
Status
Description
other
partition status is unknown (Read Only)
enabled
port is enabled (Read-Write)
partition
port is partitioned (Read-Write)
autopartition
port is auto-partitioned by the hardware (Read Only)
timedPartition
port is configured for timed partitioning (Read-Write)
Part Time (secs)
Displays the length of time to keep the port partitioned when a timed
partition is done to the port. This value can only be written in the same
request that sets the status of the port to TimedPartition. Afterwards, it
indicates the amount of time left before the timed partition is completed, at
90302292 E3
Configuration Views
3-3
Module Configuration View
which time the part status is changed to enabled. This value is zero if the port
is not timed partitioned or the amount of time is not available.
Link Status
Displays whether the port is receiving link status. The possible values are
detailed in Table 3-2.
Table 3-2.
Link Status Values
Value
Description
other
returned for AUI
off
link is not connected, applies to 10BASE-T and Fiber ports
only
on
link is connected; applies to 10BASE-T and Fiber ports only
Jabber Status
Displays the jabber status of the end node or nodes connected to the port. The
possible values are shown in Table 3-3.
Table 3-3.
Jabber Status Values
Value
Description
other
unknown or other condition
jabbering
port is receiving jabber
ok
port is not detecting any jabber
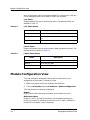
Module Configuration View
This view provides an attachment table as well as information on the
configuration of the module. To access this view:
1. Within the Logical Device view, highlight the NMM icon.
2. From the View Menu select Icon Subviews > Module Configuration.
This view provides the following information:
Module
Displays the number specifying the location of the module in the hub.
Manufacture Date
Displays, in ASCII, the date of manufacture of the module following the
format: yyyymmdd. For example, the value for April 13, 1993 is 19930413. If
the date is not available, a zero is displayed.
Configuration Views
3-4
Bay Networks BayStack Hubs
Management Module Guide
Module Configuration View
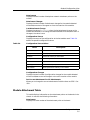
Module Attachment Table
Attachments
Displays the total number of backplane network attachment points on the
module.
Attachment Changes
Displays the total number of attachment changes for the module detected
since cold/warm start of the agent or since the insertion of the module.
Last Attachment Change
Displays the value of SysUpTime when the last attachment change on the
module was detected. If no change has been detected since cold/warm start of
the agent, the value is zero.
Configuration Source
Displays the source of the configuration at the last module reset. Table 3-4
details the possible configuration values.
Table 3-4.
Configuration Source Values
Value
Description
other
unknown or some other value
dfltJmpr
default jumpers
prmMem
permanent memory on the module
brdCfg
saved configuration on the module
sm
supervisor
smDfltJmpr
SM and default jumpers
smPrmMem
SM and permanent memory on the module
Configuration Changes
Displays the total number of configuration changes for the module detected
since the cold/warm start of the agent or since the insertion of the module.
Set Current Attachment For All Attachments
Allows you to change the current attachments. Posible values are SEG 1-3 or
ISOL.
Module Attachment Table
This table displays information on the attachment points on the boards in the
chassis. It contains the following information:
Attachment
Displays the index number of the attachment point on the board.
90302292 E3
Configuration Views
3-5
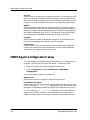
NMM Agent Configuration View
Current
Displays the current setting for the attachment point. The slot position of the
board, the setting of the backplane divider switch(es), and the mode setting
affect which backplane networks are valid values. Also, some boards may put
limitations on which backplane network(s) or local channel(s) may be used.
Default
Displays the default setting for the attachment point. An attachment point
may be attached to a local channel, not attached to any backplane network, or
attached to a media specific backplane network. (The valid choices depend on
each specific attachment point.) NOTE: This value will always be valid and
may change when the backplane divider switch setting is changed.
Changes
Displays the total number of attachment changes for the attachment point
that have been detected since cold/warm start of the agent.
Last Change
Displays the time since the last reset at which the most recent attachment
change for the attachment point was detected. If none have been detected
since restart of the agent, then the value is zero.
NMM Agent Configuration View
This view displays and provides detailed information on the configuration of
the agent, including the initial boot information. To access this view:
1. Within the Logical Device view, highlight the NMM icon.
2. From the View Menu, select Icon Subviews > NMM Agent
Configuration.
This view provides the following information:
RAM Version
Displays the version of the agent for the RAM of the module.
Initial Boot Info Source
Displays the source for initial protocol configuration information at next boot.
For IP, a setting of net using bootp means that BOOTP will be used to get
the agent’s IP address(es), load server address, and configuration file name.
For IPX, a setting of net using bootp means SAP will be used to get the
agent’s Novell network number(s), and the configuration filename will be
loaded from local storage. The load server address is not configurable and is
Configuration Views
3-6
Bay Networks BayStack Hubs
Management Module Guide
NMM Agent Configuration View
not available on a Novell network. Table 3-5 lists all valid entries:
Table 3-5.
Initial Boot Info Source Entries
Value
Description
local
Don't use the network.
net using bootp
Try using the network and if that fails then use protocol
configuration information from local storage.
other
Not applicable or some other case.
Local Storage Version
Displays the version of the agent saved in local storage (such as flash
memory). If not known or not available the value is zero.
Configuration Load Source
Displays the source from which to load configuration information at the next
boot. The values are given in Table 3-6.
Table 3-6.
Configuration Load Source Values
Value
Description
local only
get from local storage
net only
load from the network
net with local backup
try using network and if it fails then use local information
other
not applicable or some other case
When local only is specified, the configuration information is loaded from
local storage. If the local configuration is not valid, then BOOTP is used for
the IP stack.
In IPX only mode, the IP address could be 0.0.0.0; IPX does not rely on the IP
address. The agent checks the IPX address, and if the network number of the
IPX address is equal to 0 the agent uses SAP.
When net only is specified, the configuration information will be
downloaded from the network only. The configuration information will never
be loaded from local storage, even if downloading fails and the local
configuration information exists.
When net with local backup is specified, a download of the configuration
information will be tried over the network. If the network download fails, then
the configuration information will be loaded from local storage.
Current Gateway
Displays the IP address of the current default gateway (router). If not used,
this object has the value of 0.0.0.0.
90302292 E3
Configuration Views
3-7
NMM Agent Configuration View
Current Protocol
Displays the transport protocol over which the agent image and configuration
information were last loaded. Table 3-7 details all valid status values.
Table 3-7.
Current Protocol Status Values
Value
Description
ipOnly
gotten from the network using a load protocol over IP
other
unknown or some other protocol
Next Boot Gateway
Displays the IP address of the default gateway (router) for the agent to use
after the next boot. If not used, this object has the value of 0.0.0.0.
Next Boot Protocol
Displays the transport protocol(s) which the agent uses to load the
configuration information and the agent image at the next boot of the agent.
The values are given in Table 3-8.
Table 3-8.
Next Boot Protocol Values
Value
Description
ipOnly
use load protocol over IP
other
unknown or some other protocol
Last Boot Image Save Status
Indicates what happened to the image file on the last boot. Table 3-9 lists all
possible values and their descriptions.
Table 3-9.
Last Boot Image Save Status Values
Value
Description
the save operation is not available
noSave
image not saved since image was not asked to be saved, or image
was not loaded from the network
saved
image saved
saveFailed
tried to save image, but failed
Configuration Views
3-8
notAvail
Bay Networks BayStack Hubs
Management Module Guide
NMM Agent Configuration View
Next Boot Image Load Source
Displays the source from which to load the agent image at next boot. Valid
entries are shown in Table 3-10.
Table 3-10.
Next Boot Image Load Source Values
Value
Description
local only
Get from local storage.
net only
Load from the network, cannot be changed to “local only” or
“net with local backup” until a valid image file is loaded.
When the local image is not valid and the network
download of the image fails, the entire boot process will be
repeated.
net with local backup
Load from the network and if that fails, use local
information.
net if newer
Try loading the image over the net. If successful, it will
then be compared to the image stored in local storage. The
most recent version of the two will be used. If the local
image is not valid, the network will always be used. If the
network download fails then the image is loaded from the
local storage.
other
Not applicable or some other case.
Next Boot Image Save Mode
Indicates what will be done with the image (when loaded from the network) on
the next boot. Table 3-11 displays the values and their descriptions.
Table 3-11.
Next Boot Image Save Mode Values
Value
90302292 E3
Description
not available
the write operation is not available
write if different
write image to local storage at the next boot if the image is
different from saved contents
write if newer
write image to local storage at the next boot if the image is
newer than saved contents
no write
do not write image to local storage at the next boot, even if
the image is newer or different
Configuration Views
3-9
Ethernet Attachment Configuration View
Write Configuration Settings to NVRAM
Allows you to write the current configuration settings to local non-volatile
random access memory (NVRAM). Table 3-12 lists all valid entries.
Table 3-12.
Write Configuration Settings to NVRAM
Value
Description
valid
contents valid
write
write configuration settings to local storage
other
some unknown or other state
Reboot Agent
Allows you to reboot the agent. Table 3-13 lists all valid entries and a
description of each.
Table 3-13.
Reboot Agent Values
Value
Description
other
agent in unknown or other state
running
agent running
restart
restart agent (i.e., jump to beginning of agent code)
reboot
start boot sequence for agent (i.e., jump to beginning of boot
firmware)
reset
do a hardware reset
Ethernet Attachment Configuration View
Each of the attachments on the module has an Ethernet Attachment
Configuration view. These views provide information on the configuration of
each specific attachment. To access this view:
1. Within the Logical Device view, highlight the Chassis icon.
2. From the View Menu, select Icon Subviews > Attachment
Configuration.
This view provides the following information:
Module
Displays the number specifying the location in the hub of the module having
the attachment.
Attachment
Displays the number specifying the location of the attachment on the module.
Configuration Views
3-10
Bay Networks BayStack Hubs
Management Module Guide
Ethernet Attachment Configuration View
Current Attachment
Displays and provides configuration of the current setting for the attachment
point.
Last Change
Displays the value of SysUpTime when the last attachment change for the
attachment point was detected. If no change has been detected since cold/
warm start of the agent, the value is zero.
90302292 E3
Configuration Views
3-11
Ethernet Attachment Configuration View
Configuration Views
3-12
Bay Networks BayStack Hubs
Management Module Guide
Chapter 4
Event and Alarm Messages
What Is in This Chapter
This chapter lists the types of events and alarms generated by the Bay
Networks BayStack Hub and provides any probable cause messages
corresponding to these alarms.
Device Events and Alarms
Table 4-1 lists the SPECTRUM database directory paths (in bold) and the
messages displayed for the Event Log and Alarm Manager when applicable.
90302292 E3
4-1
Device Events and Alarms
Table 4-1.
Events and Alarms
CsEvFormat/Event01020001
No Probable cause message.
{d "%w- %d %m-, %Y - %T"} A "hot swap"
has been detected in slot {O 2} (slot is
second digit). Operational state is {T
Syn5OpTable 3}. {t} (name - {m }). (Trap
type : 0x01) - (event [{e}])
CsEvFormat/Event01020002
CsPCause/Prob01020002
{d "%w- %d %m-, %Y - %T"} The
operational condition of component {O 2}
is {T Syn5OpTable 3}. [component first
digit - (1) Supervisory Module (2)
Backplane (3) Module (4) Power Supply
(5) Temp Sensor (6) Fan (7) Clock ]. {t}
(name - {m }). (Trap type : 0x02) - (event
[{e}])
1) The component or sub-component listed
in the event file has a problem condition,
either warning, non-fatal, or fatal.
CsEvFormat/Event01020003
CsPCause/Prob01020003
{d "%w- %d %m-, %Y - %T"} DCE {O 4} on
ring {I 3} (ring ID {I 1}) whose last NAUN
is {X 5} has detected a beaconing station.
The beacon type is {T S5TRBeaconType
7}. {t} (name - {m}). (Trap type :
0x01020003) - (event [{e}])
1) The beacon type indicates the reason
for the beacon. If reconfiguration, the ring
will recover. If signal loss, the beaconing
station is no longer receiving a valid
signal. If bit-streaming, the beaconing
station is no longer receiving a valid token
or frame but is receiving a valid signal. If
contention streaming, the station is
indicating that monitor contention could
not be resolved within one second.
CsEvFormat/Event01020004
CsPCause/Prob01020004
{d "%w- %d %m-, %Y - %T"} DCE {O 4} has 1) A lobe splitter is interfering with
detected a splitter on ring {I 3} (ring ID {I normal ring operation.
1}). {t} (name - {m}). (Trap type : 0x08) (event [{e}])
CsEvFormat/Event01020005
No Probable cause message.
{d "%w- %d %m-, %Y - %T"} DCE {O 4} has
detected a new active monitor (MAC
address - {X 7}) on ring {I 1}. The last
Nearest Upstream Neighbor Address
(NAUN) is {X 5}. {t} (name - {m}). (Trap
type : 0x08) - (event [{e}])
Event and Alarm Messages
4-2
Bay Networks BayStack Hubs
Management Module Guide
Device Events and Alarms
Table 4-1.
Events and Alarms
CsEvFormat/Event01020006
No Probable cause message.
{d "%w- %d %m-, %Y - %T"} DCE {O 4}
(MAC Address - {X 5}) has detected a
bridge deinserting from ring {I 3} (ring ID
{I 1}). {t} (name - {m}). (Trap type :
0x01020006) - (event [{e}])
CsEvFormat/Event01020007
No Probable cause message.
{d "%w- %d %m-, %Y - %T"} DCE {O 4}
(MAC Address - {X 5}) has detected a new
source routing bridge on ring {I 3} (ring ID
{I 1}). {t} (name - {m}). (Trap type :
0x01020007) - (event [{e}])
CsEvFormat/Event01020008
CsPCause/Prob01020008
{d "%w- %d %m-, %Y - %T"} Station {O
1) The element has been wrapped by the
4}on ring {I 3} (ring ID {I 1}) has been
NMM.
automatically wrapped by the NMM.
Current port state is {T S5TPortStatus 5}.
{t} (name - {m}). (Trap type : 0x08) - (event
[{e}])
CsEvFormat/Event01020009
No Probable cause message.
{d "%w- %d %m-, %Y - %T"} Station {O
4}on ring {I 3} (ring ID {I 1}) has been
automatically unwrapped by the NMM.
Current port state is {T S5TPortStatus 5}.
{t} (name - {m}). (Trap type : 0x08) - (event
[{e}])
CsEvFormat/Event01020010
No Probable cause message.
{d "%w- %d %m-, %Y - %T"} DCE {O 4} has
detected MAC address {X 5} inserting into
ring {I 1}. {t} (name - {m}). (Trap type :
0x08) - (event [{e}])
CsEvFormat/Event01020011
No Probable cause message.
{d "%w- %d %m-, %Y - %T"} DCE {O 4} has
detected MAC address {X 5} deinserting
from Ring {I 1}. {t} (name - {m}). (Trap
type : 0x08) - (event [{e}])
90302292 E3
Event and Alarm Messages
4-3
Device Events and Alarms
Table 4-1.
Events and Alarms
CsEvFormat/Event01020012
CsPCause/Prob01020012
{d "%w- %d %m-, %Y - %T"} A port autopartition condition has been detected on
{O 2} (board.port). The port partition
status is {T S5EPortPartS 1}. The port
jabber status is {T S5EPortJabberS 3}. {t}
(name - {m}). (Trap type : 0x01020012) (event [{e}])
1) The port has a faulty device, excessive
collisions, DTE jabbering, or a wiring
problem. This could include bad
connections, topological loops or protocol
issues, such as broadcast or multicast
echo requests.
CsEvFormat/Event01020013
CsPCause/Prob01020013
{d "%w- %d %m-, %Y - %T"} Port {O 2}
1) An Ethernet port has been flagged as
(board.port) has detected an Ethernet
jabbering. Jabbering occurs when a
DTE is jabbering. The jabber status is {T station continues to transmit a signal.
S5EPortJabberS 1}. {t} (name - {m}). (Trap
type : 0x01020013) - (event [{e}])
CsEvFormat/Event01020014
CsPCause/Prob01020014
{d "%w- %d %m-, %Y - %T"} Port {O 2}
1) An Ethernet port that is in a redundant
(board.port) in a redundant pair has
pair has developed a fault.
developed a fault. The port operational
status is {T S5ERedPtOperS 1}. The port's
companion is {I 3}.{I 5}. The port partition
status is {T S5EPortPartS 7}. The port
link status is {T S5EPortLinkS 9}. The
port jabber status is {T S5EPortJabberS
11}. {t} (name - {m}). (Trap type :
0x01020014) - (event [{e}])
CsEvFormat/Event01020015
CsPCause/Prob01020015
{d "%w- %d %m-, %Y - %T"} The NMM has
detected an invalid remote operational
status on {O 2} (board.port). The port
remote operational status is {T
S5ERedRemOperS 1}. The port
redundancy mode is {T S5ERedPtRedunM
3}. {t} (name - {m}). (Trap type :
0x01020015) - (event [{e}])
1) A status of tenBaseFLPortUp was
detected on a port set for hardware
redundancy. 2) A status of Unknown was
detected and the companion port has a
good link.
CsEvFormat/Event01020017
CsPCause/Prob01020017
***The above file is called by EventDisp,
but does not exist.***
***The above file is called by EventDisp,
but does not exist.***
***Let your developer know.***
***Let your developer know.***
Event and Alarm Messages
4-4
Bay Networks BayStack Hubs
Management Module Guide
Device Events and Alarms
Table 4-1.
Events and Alarms
CsEvFormat/Event36000115
No Probable cause message.
{d "%w- %d %m-, %Y - %T"} FDDI logical
topology change notification. The number
of Primary ring changes is {I 1},
Secondary ring is {I 2}. The number of
logical path topology changes is {I 3}. {t}
(name - {m }). (Trap type:
1.3.6.1.4.1.45.6.36) - (event [{e}]).
CsEvFormat/Event36000116
CsPCause/Prob36000116
{d "%w- %d %m-, %Y - %T"} The link error 1) There is a connection problem with the
monitor has observed a link error rate
transceiver and/or the wiring connected to
cutoff or alarm threshold condition on
the port.
port {O 2}. The long term average link
error rate is {I 5}. The estimate greater
than or equal alarm condition is {T
T36000116_LCon 1}. Cutoff is {I 3}. Alarm
Threshold is {I 4}. {t} (name - {m }). (Trap
type: 1.3.6.1.4.1.45.6.37) - (event [{e}]).
CsEvFormat/Event36000117
CsPCause/Prob36000117
{d "%w- %d %m-, %Y - %T"} An
1) Twisted ring error. 2) Local connection
undesirable or illegal connection attempt policy violation.
was detected on port {O 2}. The connection
was {T T36000117_ACPT 6}. The port PC
type is {T T36000117_PCTy 1}. The port's
connect state is {T T36000117_PCSt 4}.
The neighbor port PC type is {T
T36000117_PCTy 3}. {t} (name - {m }).
(Trap type: 1.3.6.1.4.1.45.6.38) - (event
[{e}]).
CsEvFormat/Event36000118
CsPCause/Prob36000118
{d "%w- %d %m-, %Y - %T"} Two or more 1) Two or more stations on the network
stations with the same MAC address have have the same MAC address.
been detected on the network. The RMT
Duplicate Address Flag is {T
T36000118_DAFl 1}. The SMT address is
{S 3}. The Upstream Neighbor Address is
{S 5} with a Duplicate Address Flag of {T
T36000118_DAFl 4}. {t} (name - {m }).
(Trap type: 1.3.6.1.4.1.45.6.39) - (event
[{e}]).
90302292 E3
Event and Alarm Messages
4-5
Device Events and Alarms
Table 4-1.
Events and Alarms
CsEvFormat/Event36000119
CsPCause/Prob36000119
{d "%w- %d %m-, %Y - %T"} The bad FDDI
MAC frames threshold was exceeded for
{X 2}. The frame error condition is {T
T36000119_FCon 1}. Frame count is {I 3}.
Error count is {I 4}. Lost count is {I 5}. {t}
(name - {m }). (Trap type:
1.3.6.1.4.1.45.6.40) - (event [{e}]).
1) There may be a problem between this
station and its upstream neighbor. The
upstream neighbor may be transmitting
errors or leaving the ring.
CsEvFormat/Event3600011a
CsPCause/Prob3600011a
{d "%w- %d %m-, %Y - %T"} Station {X 2} 1) A station is experiencing local buffer
is experiencing local buffer congestion.
congestion.
The Not Copied Condition is {T
T3600011a_CCon 1}. The Not Copied
count is {I 3}. The {O 5} frames sucessfully
received count is {I 4}. {t} (name - {m }).
(Trap type: 1.3.6.1.4.1.45.6.41) - (event
[{e}]).
CsEvFormat/Event3600011b
No Probable cause message.
{d "%w- %d %m-, %Y - %T"} A change was
detected in upstream or downstream
neighbors for station {X 2}. The Upstream
Neighbor is now {S 1}, it was {S 3}. The
Downstream Neighbor is now {S 4}, it was
{S 6}. {t} (name - {m }). (Trap type:
1.3.6.1.4.1.45.6.42) - (event [{e}]).
CsEvFormat/Event3600011c
CsPCause/Prob3600011c
{d "%w- %d %m-, %Y - %T"} Port {O 2} has 1) A station may be transmitting frames
exhibited elasticity buffer errors. The
that are too long. 2) A station may be
elasticity buffer error count is {I 1}. {t}
using a clock that is out of tolerance.
(name - {m }). (Trap type:
1.3.6.1.4.1.45.6.43) - (event [{e}]).
CsEvFormat/Event3600011d
CsPCause/Prob3600011d
{d "%w- %d %m-, %Y - %T"} The {T
T3600011d_RING 3} dual ring peer wrap
flag is {T T3600011d_PEER 4} at a
station. Attachment configuration for the
station is {T T3600011d_TCFS 1}. SMT
entry number is {O 2}. {t} (name - {m }).
(Trap type: 1.3.6.1.4.1.45.2.7.0.6.1) (event [{e}]).
1) The dual ring is wrapped at a station
(wrapA or wrapB). Note that this is a
legal configuration and may be
intentional.
Event and Alarm Messages
4-6
Bay Networks BayStack Hubs
Management Module Guide
Device Events and Alarms
Table 4-1.
Events and Alarms
CsEvFormat/Event3600011e
CsPCause/Prob36000118
{d "%w- %d %m-, %Y - %T"} Two or more 1) Two or more stations on the network
stations with the same MAC address have have the same MAC address.
been detected on the network. {t} (name {m }). (Trap type: 1.3.6.1.4.1.45.2.7.0.6.2) (event [{e}]).
CsEvFormat/Event3600011f
CsPCause/Prob36000119
{d "%w- %d %m-, %Y - %T"} The bad FDDI
MAC frames threshold was exceeded for
{0 2}. The frame error condition is {T
T3600011f_FCon 1}. Frame count is {I 3}.
Error count is {I 4}. Lost count is {I 5}. {t}
(name - {m }). (Trap type:
1.3.6.1.4.1.45.2.7.0.6.3) - (event [{e}]).
1) There may be a problem between this
station and its upstream neighbor. The
upstream neighbor may be transmitting
errors or leaving the ring.
CsEvFormat/Event36000120
CsPCause/Prob3600011a
{d "%w- %d %m-, %Y - %T"} A station is
experiencing local buffer congestion. {t}
(name - {m }). (Trap type:
1.3.6.1.4.1.45.2.7.0.6.4) - (event [{e}]).
1) A station is experiencing local buffer
congestion.
CsEvFormat/Event36000121
CsPCause/Prob36000116
{d "%w- %d %m-, %Y - %T"} The link error 1) There is a connection problem with the
monitor has observed a link error rate
transceiver and/or the wiring connected to
cutoff or alarm threshold condition. {t}
the port.
(name - {m }). (Trap type:
1.3.6.1.4.1.45.2.7.0.6.5) - (event [{e}]).
90302292 E3
CsEvFormat/Event36000122
CsPCause/Prob36000117
{d "%w- %d %m-, %Y - %T"} An
undesirable or illegal connection attempt
was detected on port {O 2}. The port PC
type is {T T36000117_PCTy 1}. The port
PC neighbor type is {T T36000117_PCTy
3}. The port's connect state is {T
T36000117_PCSt 4}. {t} (name - {m }).
(Trap type: 1.3.6.1.4.1.45.2.7.0.6.6) (event [{e}]).
1) Twisted ring error. 2) Local connection
policy violation.
CsEvFormat/Event36000123
CsPCause/Prob3600011c
{d "%w- %d %m-, %Y - %T"} A port has
exhibited elasticity buffer errors. {t}
(name - {m }). (Trap type:
1.3.6.1.4.1.45.2.7.0.6.7) - (event [{e}]).
1) A station may be transmitting frames
that are too long. 2) A station may be
using a clock that is out of tolerance.
Event and Alarm Messages
4-7
Device Events and Alarms
Table 4-1.
Events and Alarms
CsEvFormat/Event36000124
No Probable cause message.
{d "%w- %d %m-, %Y - %T"} MAC has
been inserted into the path. {t} (name - {m
}). (Trap type: 1.3.6.1.4.1.45.2.7.0.6.8) (event [{e}]).
CsEvFormat/Event36000125
No Probable cause message.
{d "%w- %d %m-, %Y - %T"} Port {O 2} has
moved to the {T T36000125_CurP 1} path.
{t} (name - {m }). (Trap type:
1.3.6.1.4.1.45.2.7.0.6.9) - (event [{e}]).
CsEvFormat/Event36000126
No Probable cause message.
{d "%w- %d %m-, %Y - %T"} A {T
T3600011d_RING 1} station has either
been moved, inserted, or removed from
the ring, either by a software or a physical
change. {t} (name - {m }). (Trap type:
1.3.6.1.4.1.45.1.3.4.0.6.1) - (event [{e}]).
CsEvFormat/Event36000127
CsPCause/Prob36000127
{d "%w- %d %m-, %Y - %T"} The dual ring
is wrapped at a concentrator. {t} (name {m }). (Trap type:
1.3.6.1.4.1.45.1.3.4.0.6.2) - (event [{e}]).
1) The dual ring is wrapped at a
concentrator (wrapA or wrapB). Note that
this is a legal configuration and may be
intentional.
CsEvFormat/Event36000128
No Probable cause message.
{d "%w- %d %m-, %Y - %T"} A port on this
concentrator was part of a trace. {t} (name
- {m }). (Trap type:
1.3.6.1.4.1.45.1.3.4.0.6.3) - (event [{e}]).
Event and Alarm Messages
4-8
Bay Networks BayStack Hubs
Management Module Guide
Chapter 5
Application Views
What Is in This Chapter
This chapter describes the Bay Networks BayStack Hub’s device-specific
applications listed below. The corresponding application model type is in
parentheses.
• Stackable Ethernet Application (BSEnetApp)
• BayStach Repeater Application (BSEnetRptr)
• BayStack Common Application (BSCommonApp)
Application View
This view displays information on all applications supported by the device.
Each application appears as an icon in the Application view. Access
application-specific Model Information Views, Performance Views, and Detail
Views from these icons. Depending on the specific application, various
additional views are also available and discussed in this section.
Within the Application view, there are two special Edit menu options. These
options interact with the device modeled and are as follows:
Poll Time
Allows you to configure the time, in seconds, when the SpectroSERVER polls a
device and reads all the device attributes marked as POLLED.
Reconfigure
Polls the device to discover the applications supported by the firmware and
reconfigures the Application view accordingly. Use this option to recover
destroyed application icons.
90302292 E3
5-1
Application View
Device Application View
Device Application View
This view shows the common and device-specific applications supported by
this device and provides access to application-specific information.
For more information on Accessing SPECTRUM Views from the Device Icon,
see Chapter 1, page 1-2, and Accessing Device-Specific Submenus., page 1-5.
Figure 5-1 shows an example of an Application view in the Icon mode.
Figure 5-2 shows an example of an Application view in the List mode.
To change the display mode, select View > Mode > List or Icon.
Application Views
5-2
Bay Networks BayStack Hubs
Management Module Guide
Application View
Device Application View
Figure 5-1.
Device Application View (Icon Mode)
BANNERView of type HubBaySt10
*
File
View
Help?
Model Name
Network Address
Sys Up Time
Contact
Manufacturer
Description
Device Type
Location
Primary Application
Serial Number
Model Name
HubBaySt10
ack Common
BSCommonApp
BSCommonApp
Stack Enet
ENET
BSEnetApp
BP_SEG_1
BSEnetRptr
BP_SEG_2
BSEnetRptr
90302292 E3
Application Views
5-3
Application View
Figure 5-2.
Device Application View (List Mode)
BannerView of type HubBaySt10
*
File
Model Name
View
Help?
Network Address
Contact
Manufacturer
Description
Location
Sys Up Time
Device Type
Primary Application
Serial Number
HubBaySt10
BSCommonApp
BSEnetApp
BSEnetRptr
BSEnetRptr
Application Views
5-4
Bay Networks BayStack Hubs
Management Module Guide
Stackable Ethernet Application
Stackable Ethernet Application
This application provides access to stackable ethernet functionality for this
device. The model type for this application is BayStack Enet. Table 5-1
describes each of the application-specific Icon Subviews menu selections
available for the Stackable ethernet application.
Table 5-1.
BayStack ENET Icon Subviews Menu
Menu
Description
Redundancy Table
Opens the BayStack Ethernet Chassis Redundancy Table
View, described in Chapter 2, page 2-5.
Model Information
For more information on the Model Information view, refer
to SPECTRUM Views.
BayStack Common Application
This application supplies three application specific views: Chassis
Configuration, Chassis Group, and Model Information. Table 5-2 describes
each Icon Subview menu option.
Table 5-2.
BayStack Common Icon Subviews Menu
Menu
Description
Chassis Configuration
Opens the Chassis Configuration View, described in
Chapter 3, page 3-1.
Chassis Group
Opens the Chassis View Group, described on page 5-5.
Model Information
Opens the Model Information View, refer to SPECTRUM
Views.
Chassis Group View
This view contains the Chassis Group Table which provides the following
information:
Index
Shows the index for the Chassis Group Table.
Description
Displays a description of the Chassis Group.
Max Comps
The maximum number of components a group can have.
90302292 E3
Application Views
5-5
BayStack Repeater Application
Chassis Group View
Num Comps
The actual number of components a group has.
Physical Changes
The number of physical changes made to the group components.
Last Change
The last time a component change was made to a group.
BayStack Repeater Application
This application is the Repeater Application for the device. Table 5-3 describes
each Icon Subview menu selection for this application.
Table 5-3.
BSEnetRptr Application Icon Subviews Menu
Menu
Application Views
5-6
Description
Device
Opens the Logical Device View, described in Chapter 2,
page 2-1.
DevTop
Opens the DevTop view, refer to SPECTRUM Views.
Model Information
Opens the Model Information view, refer to SPECTRUM
Views.
Bay Networks BayStack Hubs
Management Module Guide
Index
A
Accessing Device-Specific Subviews 1-5
Accessing SPECTRUM Views 1-2
Address 2-21
Address Type 2-20
Agent
IF Table 3-2
Interface
Button 3-2
View 3-2
alarm
messages 4-1
Application View 5-1
Attachment 3-10
Changes 3-5
Attachment Configuration 3-1
Attachments 3-5
AUI 3-4
AutoPartition 3-3
B
Backplane Module Icon 2-3
Backplane Type 2-22
BayStack Ethernet Chassis Redundancy
Table View 2-5
BayStack100BT 1-2
BayStack100-FX 1-2
BayStack100-TX 1-2
BayStack10BT-12 1-1
BayStack10BT-24 1-1
BayStack150 1-2
BayStack151 1-2
BayStack152 1-2
BayStack153 1-2
BrdCfg 3-5
BSCommonApp 5-1
C
Chassis
Configuration View 3-1
Contact 3-2
Description 3-2
Location 3-2
Serial Number 3-1
Type 3-1
Version 3-1
Chassis # Label/Chassis Notes 2-11
Chassis Configuration 3-1, 5-5
Chassis Device View 2-2
Chassis Group 5-5
Chassis Icon 2-10
Chassis Icon Subviews Menu Selections 2-11
Chassis Manager Application View 5-4
Chassis Type 2-22
Chassis Type Label 2-11
Community
String 2-20
Component
Index 3-3
Configuration
Changes 3-5
Load Source 3-7
Configuration Source 3-5
Configuration View 3-1
Create 2-20
Current
Attachment 3-11
Entries 2-19
Gateway 3-7
Protocol 3-8
D
Default
Jumpers 3-5
Delete 2-20
Description 5-5
Device 5-6
Device Application View
Icon mode 5-2
List mode 5-2
Device Views 2-1
banner 2-2
90302292 E3
1
DevTop 5-6
DfltJmpr 3-5
documentation
conventions x
organization ix
E
EMM Agent View 2-23
Enabled 3-3
ENET Media Icon 2-4
ENET Media Icon Subviews Menu 2-4
ENET NMM Find Nodes Table 2-21
ENET NMM Show Nodes Table 2-20
ENET NMM Topology Table View 2-22
ENET(BSEnetApp) 5-1
Environmental
Device View
Accessing 2-2
Ethernet Backplane Segment Statistics
view 2-7
Ethernet Port Redundancy View 2-12
event
messages 4-1
F
Fast Ethernet Application 5-5
Firmware
Configuration 3-1
L
Last
Attachment Change 3-2, 3-5
Change 3-11
Configuration Change 3-2
Physical Change 3-2
Last Boot
Image Save Status 3-8
Last Change 2-5, 5-6
Link Status 3-4
Links 2-22
local 3-7
local only 3-7, 3-9
Local Seg 2-22
Local Storage Version 3-7
Logical Device View 2-1
M
MAC Address 2-21, 2-22
Manufacture Date 3-4
Max Comps 5-5
Maximum Entries 2-19
Model Information 5-5, 5-6
Module 2-5, 2-21, 3-3, 3-4, 3-10
Configuration
View 3-4
Module # Label 2-17
Module Configuration 3-1
Module Icons 2-3
Module Type Label 2-17
I
IF IP Address 2-22
Index 5-5
Initial Boot Info Source 3-6
Interface 2-20, 2-21
Index 3-3
Interface Icon, Device View 2-2
IP
Address 3-3
ip 3-8
ipOnly 3-8
J
Jabber Status 3-4
jabbering 3-4
Index
2
N
net if newer 3-9
net only 3-7, 3-9
net using bootp 3-7
net with local backup 3-7, 3-9
Network
Address 2-20
Next
Available Entry 2-19
Next Boot
Gateway 3-8
Image
Load Source 3-9
Save Mode 3-9
Protocol 3-8
NMM
Bay Networks BayStack Hubs
Management Module Guide
Trap Receiver
View 2-19
NMM Agent Configuration 3-1
NMM Agent Download View 2-17
NMM Icon 2-16
NMM Icon Subviews Menu 2-17
NMM IP Address 2-22
NMM Trap Receiver View 2-19
no write 3-9
noSave 3-8
not available 3-9
notAvail 3-8
Notice i
Num Comps 5-6
O
odule Icons 2-3
Off 3-4
Ok 3-4
On 3-4
Other 2-20, 2-21, 3-3, 3-4, 3-5
other 3-7, 3-8, 3-9, 3-10
Other Related Documentation xi
P
Part
Status 3-3
Time 3-3
Part Status 3-3
Partition 3-3
Permanent Memory 3-5
Physical Changes 5-6
Physical Device View 2-24
Poll Time 5-1
Port 2-21, 2-22, 3-3
Configuration
View 3-3
Port Icon Subviews Menu Selections 2-12
Port Status Label/Port Configuratin
view 2-12
Port# Label/Port Notes view 2-11
PortConfiguration 3-1
PrmMem 3-5
reboot 3-10
Reboot Agent 3-10
Receiver
Status 2-19
Reconfigure 5-1
Redundancy Table 5-5
Related Reading xi
reset 3-10
restart 3-10
Restricted Rights Notice ii
running 3-10
S
saved 3-8
saveFailed 3-8
Seen 2-22
Segment # Label 2-11
Segment Icon 2-4
Segment Icon Subviews Menu 2-9
Slot 2-22
Sm 3-5
SmDfltJmpr 3-5
SmPrmMem 3-5
Stackable Repeater(BSEnetRptr) 5-1
State 2-23
Status 2-21
Supervisor 3-5
T
TCP/IP Based Networks xi
TimedPartition 3-3
Total
Attachment Changes 3-2
Configuration Changes 3-2
Physical Changes 3-2
Trademarks i
Trap Receiver Table 2-19
U
Unknown 3-3, 3-4, 3-5
V
R
RAM Version 3-6
90302292 E3
Valid 2-20
valid 3-10
Vendor 2-21
Index
3
Virus Disclaimer i
VNM 3-1
W
write 3-10
Write Configuration Settings to
NVRAM 2-18, 3-10
write if different 3-9
write if newer 3-9
Index
4
Bay Networks BayStack Hubs
Management Module Guide