1
DA2_FX7400G_01.qxd 2/14/07 3:55 PM Page 23
Note 1R • Bar Graphs (continued)
fx-7400G Plus
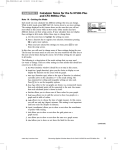
Setting the VIEW WINDOW Values
Press
SHIFT [SET UP].
With S-Wind highlighted, press F2 (Man) QUIT . Press
SHIFT [V-Window] and enter the following values into the View Window
screen. Press EXE after each entry.
Xmin: 1
(This value is automatically set for all bar graphs.)
max: 14.6
(This value is automatically set for all bar graphs.)
scl: 0
(This value is automatically set for all bar graphs.)
Toggle the arrow key down to get the y-values.
Ymin: 1
(A negative value allows you to see the x-axis at the bottom of
the screen.)
max: 7
(This value is a number slightly greater than the maximum data
value in the list.)
scl: 1
(This number is the distance between tick marks on the y-axis.
The number you choose will depend on the Ymax value. If your
scl value is too small, the y-axis will appear too thick.)
Press QUIT when you are done entering values. The view window shown is
[1, 14, 6.0, 1, 7, 1].
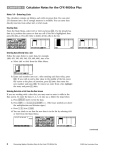
Displaying the Bar Graph
a. Press F1 (GRPH) ˛ F4 (SET) to set up the graph.
b. Press F1 (GPH1).
c. Highlight G-Type. Press ˛ four times. Press F1 (Bar). Choose List 1
for Data.
d. Press QUIT .
e. Press F1 (GRPH) and choose F1 (GPH1), or whichever graph you used.
Tracing on a Bar Graph
Press SHIFT [Trace] and use the arrow key to move from category to category.
The x-value identifies the category number, that is, the position in your
list. The y-value displays the value of the category.
Errors
A Dim ERROR message indicates that you have too many values in your list.
A bar graph is limited to 14 list values.
©2008 Key Curriculum Press
Discovering Algebra Calculator Notes for the Casio fx-7400G Plus
23