1
DA2_FX7400G_01.qxd 2/14/07 3:55 PM Page 13
Note 1D • Box Plots (continued)
fx-7400G Plus
Setting the VIEW WINDOW Values
Press
SHIFT [SET UP],
highlight S-Wind, and press
F2 (Man) QUIT
.
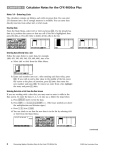
Press SHIFT [V-Window] and input the following values on the View Window
screen. Press EXE after each entry.
Xmin: 300
max: 500
scl: 1
(This value is a number slightly less than the minimum
of the data.)
(This value is a number slightly greater than the maximum
of the data.)
(This number does not affect a box plot.)
Toggle the arrow key down to get to the y-values.
Ymin: 0
max: 10
scl: 0
(This number is not important for a box plot.)
(This number does not affect a box plot.)
Press QUIT or EXE when you are done entering values. The view window
shown is [300, 500, 1, 0, 10, 0].
Displaying the Box Plot
This example uses the data in List 1, but you can choose any list.
a. Press F1 (GRPH) ˛ F4 (SET) to set up the graph.
b. Press F1 (GPH1).
c. Highlight G-Type. Press ˛ F2 (Box). Choose List 1 for XList and 1 for
Freq. Press QUIT .
d. Press F1 (GRPH) and choose F1 (GPH1).
e. Press
QUIT
to leave the graph screen.
Tracing on a Box Plot
With the graph on the screen, press SHIFT [Trace]. The trace option allows
you to see the five summary values for the box plot by toggling the arrow
key left and right. When you toggle the arrow key up and down, you move
from one box plot to another. (See the Graphing More Than One Box Plot
section that follows.) Look in the upper-left corner of the calculator screen
to see which graph the calculator is tracing. The calculator will trace a
statistical graph even if the graph is not visible in the current window. Be
sure to turn off any graphs you do not want to see or trace.
(continued)
©2008 Key Curriculum Press
Discovering Algebra Calculator Notes for the Casio fx-7400G Plus
13