1
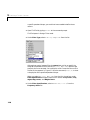
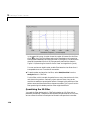
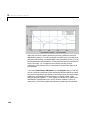
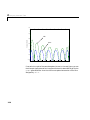
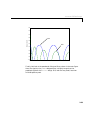
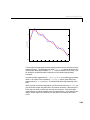
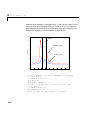
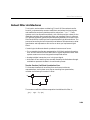
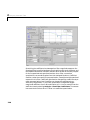
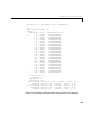
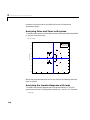
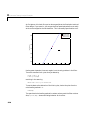
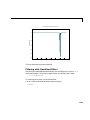
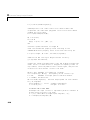
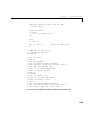
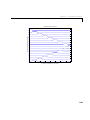
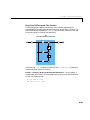
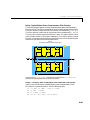
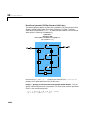
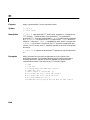
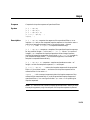
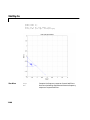
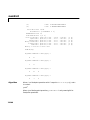
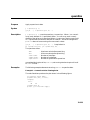
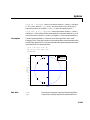
Getting Started with the Toolbox
Getting Started with the Toolbox
This section provides an example to get you started using Filter Design
Toolbox. You can run the code in this example from the Help browser (select
the code, right-click the selection, and choose Evaluate Selection from the
context menu) or you can enter the code on the command line. This exercise
also introduces Filter Design and Analysis Tool (FDATool). You use it to design
and analyze filters, and to quantize filters.
As you follow the example, you are introduced to some of the basic tasks of
designing a filter and using FDATool. You will engage some of the quantization
capabilities of the toolbox, and a few of the filter design architectures provided
as well.
Before you begin this example, start MATLAB and verify that you have
installed Signal Processing and Filter Design Toolboxes (type ver at the
command prompt). You should see Filter Design Toolbox, version 2.0 and
Signal Processing Toolbox, version 5.0, among others, in the list of installed
products.
Example - Creating a Quantized IIR Filter
Example Background. Wireless communications technologies, such as cellular
telephones, need to account for the receiver’s motion relative to the transmitter
and for path changes between the stations. To model the channel fading and
frequency shifting that occurs when the receiver is moving, wireless
communications models apply a lowpass filter to the transmitted signal. With
a narrow passband of 0 to 40Hz that modifies the transmitted signal, the
lowpass filter simulates the Doppler shift caused by the motion between the
transmitter and receiver. As the lowpass filter requires a rather peculiar rising
shape across the passband and an extremely sharp transition region, designing
and quantizing the filter presents an interesting study in filter design. In
Figure 1-2, you see the frequency response curve for the RFC filter. Notice the
narrow passband with the rising shape and the sharp cutoff transition. Also
note that the y-axis is a linear scale that dramatizes the shape of the passband.
1-15