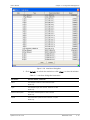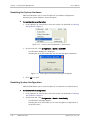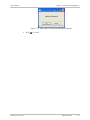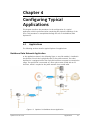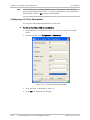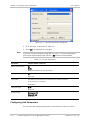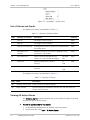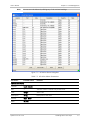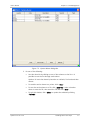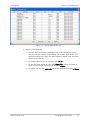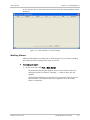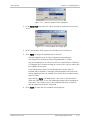
1
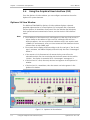
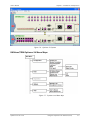
RADview/TDM
Network Management System
Optimux-34
© 1994–2008 RAD Data Communications
Publication 01/08
Contents
Chapter 1. Introduction
1.1
1.1
Optimux-34 Overview.................................................................................................1-1
RADview/TDM Optimux-34 Overview ..........................................................................1-1
Chapter 2. Installation and Operation
2.1
2.2
2.3
2.4
Pre-configuring Optimux-34 for Network Management ...............................................2-1
Connecting Optimux-34 to the Management Station ..................................................2-1
Launching Optimux-34 ...............................................................................................2-1
Using the Graphical User Interface (GUI) .....................................................................2-2
Optimux-34 View Window .......................................................................................2-2
Title Bar .............................................................................................................2-3
Menu Bar ...........................................................................................................2-3
Toolbar ..............................................................................................................2-3
Status Bar ..........................................................................................................2-4
Optimux-34 System ................................................................................................2-4
RADview/TDM Optimux-34 Menu Maps....................................................................2-5
Selecting the System ..............................................................................................2-7
Discovering the Device .......................................................................................2-7
Selecting Ports........................................................................................................2-8
Optimux-34 Front Panel Connectors........................................................................2-8
Optimux-34 Indicators ............................................................................................2-9
Port Status Indicators.........................................................................................2-9
Agent Status Indicators ....................................................................................2-10
Power Supply LEDs and Indicators ....................................................................2-11
Optimux-34 LEDs .............................................................................................2-12
Chapter 3. Configuration Management
3.1
3.2
3.3
Configuring Optimux-34 for Network Management .....................................................3-1
Viewing and Configuring System Information...........................................................3-1
Configuring System Parameters...............................................................................3-3
Configuring Operational Parameters ...........................................................................3-5
Viewing and Configuring Port Parameters ................................................................3-6
Viewing and Configuring Ethernet Port Parameters ..................................................3-6
Configuring V.35 Port Parameters .........................................................................3-10
Configuring E1 Channel Port Parameters ...............................................................3-11
Configuring E3 Link Parameters.............................................................................3-13
Additional Tasks.......................................................................................................3-14
Viewing System Interfaces ....................................................................................3-14
Resetting the System Hardware ............................................................................3-16
Resetting System Configuration ............................................................................3-16
Chapter 4. Configuring Typical Applications
4.1
4.2
Applications ...............................................................................................................4-1
Backbone Data Network Application........................................................................4-1
E1 Fan-Out over Satellite Link Application ...............................................................4-2
Configuring Optimux-34 .............................................................................................4-2
Configuring System Information ..............................................................................4-2
Optimux-34 Ver. 2.81
i
Table of Contents
4.3
4.4
4.5
User's Manual
Configuring System Parameters...............................................................................4-4
Configuring SNMP ...................................................................................................4-6
Management Access...........................................................................................4-7
Connecting Optimux-34 to the Management Station ..................................................4-7
Configuring Port Parameters ...................................................................................4-7
Configuring V.35 Port Parameters .........................................................................4-10
Configuring E1 Channel Port Parameters ...............................................................4-11
Configuring Link Parameters..................................................................................4-12
Configuring Security Management ............................................................................4-14
Polling the Agent ..................................................................................................4-14
Resetting the System Hardware ............................................................................4-15
Resetting System Configuration ............................................................................4-15
Configuration Sequence ...........................................................................................4-15
Chapter 5. Performance Management
5.1
5.2
Introduction...............................................................................................................5-1
Polling the Agent .......................................................................................................5-1
Chapter 6. Security Management
6.1
6.2
Configuring SNMP ......................................................................................................6-1
Configuring Management Access ................................................................................6-3
Chapter 7. Fault Management
7.1
7.2
7.3
7.4
ii
Managing System Alarms............................................................................................7-1
Handling Alarms and Traps .........................................................................................7-1
List of Alarms and Events........................................................................................7-2
Viewing All Active Alarms.........................................................................................7-2
Viewing System Alarms ...........................................................................................7-4
Viewing Alarm History in the System Alarm Buffer ...................................................7-6
Clearing Alarms in the Alarm Buffer .........................................................................7-8
Masking Alarms.......................................................................................................7-9
Managing Port Alarms ..............................................................................................7-11
Viewing Port Alarms ..............................................................................................7-11
Performing Loopback Tests ......................................................................................7-16
Optimux-34 Ver. 2.81
Chapter 1
Introduction
This chapter provides an overview for managing Optimux-34 using the
RADview/TDM SNMP Optimux-34 management solution. It introduces the
graphical user interface. It is assumed that you are familiar with basic
RADview/TDM operations. For more information about basic RADview-NMS
operations, refer to the RADview/TDM (PC) or (UNIX) User's Manual.
1.1
Optimux-34 Overview
Optimux-34 provides a simple, flexible, and cost-effective solution for
transporting multiple E1 channels, high-speed, and Ethernet traffic over an E3 link
to distances of up to 110 km (68 miles). The E3 link is available with multimode,
single mode fiber, single mode over single fiber, or SFP-based interfaces. It
supports redundant and modular main links and power supplies.
Optimux-34 provides 16 E1 channels, high speed and Ethernet traffic, into one E3
copper or fiber optic link.
Optimux-34 provides optional wide-range modular redundant power supplies. The
optional second main link provides backup using automatic switchover upon link.
The optional second power supply provides power redundancy for fail-safe
operation.
Optimux-34 has various optical interfaces (based on SFP interfaces) available for
both active and backup main link(s).
Optimux-34 transmits the clock of each E1 channel independently.
As a local device, Optimux-34 can be connected to an Optimux-34 device or to
Optimux-XLE1.
1.1
RADview/TDM Optimux-34 Overview
This chapter explains the steps required to get the RADview/TDM SNMP
management system for Optimux-34 version 1.0 up and running. It describes the
graphical user interface, configurations, security and fault management. Specific
tasks possible with RADview/TDM Optimux-34 are dealt with in the subsequent
chapters in this manual. All the configurations and management support in this
manual are tasks that can be performed with RADview only and not with the
terminal.
The RADview/TDM SNMP management system for Optimux-34 provides you with
all the tools necessary to monitor the performance and configure the device
parameters for its local and remote devices.
Optimux-34 Ver. 2.81
RADview/TDM Optimux-34 Overview
1-1
Chapter 1 Introduction
User’s Manual
The RADview/TDM management system for Optimux-34 local and remote units is
accessed in two levels:
•
System Level
•
Port Level:
E1 port
E3 Link port
MNG-ETH port
USER-ETH port
V.35 port.
Table 1-1 presents the list of tasks that can be performed through the
RADview/TDM Optimux-34 both in the system and the port levels.
Table 1-1. RADview/TDM Optimux-34 System and Port Levels Tasks
Task Description
System Level
Configuring and viewing system information
√
Configuring and viewing system parameters
√
Configuring and viewing port parameters
√
Viewing system interfaces
√
Defining manager list
√
Setting management access
√
Polling agent
√
Managing alarms
√
Listing alarm history log
√
Clearing alarm history log
√
Masking alarms
√
Performing loopback tests
1-2
√
Resetting hardware
√
Resetting hardware configuration
√
RADview/TDM Optimux-34 Overview
Port Level
(MNG-ETH,
USER-ETH, V.35,
E1, E3 Link)
Optimux-34 Ver. 2.81
Chapter 2
Installation and Operation
This chapter explains the installation and operation required to get the
RADview/TDM system for Optimux-34 up and running. It also describes the
RADview/TDM Optimux-34 graphic user interface (GUI) and how to select the
system and its ports.
This chapter covers the following tasks:
•
Launching RADview/TDM Optimux-34
•
Using the RADview/TDM Optimux-34 View window.
2.1
Pre-configuring Optimux-34 for Network
Management
For complete details on pre-configuring Optimux-34 for network management,
refer to Chapter 3 of the Optimux-34 Installation and Operation Manual
(hardware manual).
2.2
Connecting Optimux-34 to the Management
Station
For complete details on how to connect Optimux-34 to a management station,
refer to Interfaces and Connections under Section 2.5 of the Optimux-34
Installation and Operation Manual hardware manual.
2.3
Launching Optimux-34
Begin using Optimux-34 by launching the Optimux-34 View window.
To launch the Optimux-34 View window:
•
On the map, select and double-click the Optimux-34 icon.
The Optimux-34 View window opens. You can now perform configuration
and monitoring functions in the entire Optimux-34 system.
Optimux-34 Ver. 2.81
Launching Optimux-34
2-1
Chapter 2 Installation and Operation
2.4
User’s Manual
Using the Graphical User Interface (GUI)
From the Optimux-34 View window, you can configure and monitor the entire
Optimux-34 system elements.
Optimux-34 View Window
The RADview/TDM SNMP for Optimux-34 View window displays a dynamic
graphical representation of a local Optimux-34 front panel and a connected
remote Optimux-34 standalone front panel. The view includes the links/ports,
their operational and communication status, and the device’s LED indicators’
status.
Note
• The IP Address of the Remote unit, which appears at the top of the screen, is
shown similar to the address of the Local unit, although each unit has a
different address. You can see different addresses only in the caption under
a SNMPc (PC environment), after you have connected a link between the two
relevant icons on the SNMPc map.
• The remote device display will be according to the far-end type. If the far-end
type is unknown, the NMS will display a box with only the word “Unmanaged”
within it.
• If the remote unit is disconnected, all remote device ports will not be
selectable and the line icon connecting the local and remote devices will be
“broken”, the display is zoomed with an “Unmanaged” message on it.
• If the local unit is a card, then only the local unit appears in the Optimux-34
window.
• If the local unit is a standalone, then the remote unit also appears in the
Optimux-34 window.
Figure 2-1. Optimux-34 View Window
2-2
Using the Graphical User Interface (GUI)
Optimux-34 Ver. 2.81
User’s Manual
Chapter 2 Installation and Operation
The Optimux-34 View window contains the following elements:
•
Title bar
•
Main menu bar
•
Toolbar
•
Optimux devices
•
Status bar.
Title Bar
Figure 2-2. Title Bar
The title bar (at the top of the View window) displays the name or IP address of
the local Optimux-34 and the connection status between it and the remote
device. “Connected” appears in the title bar (see Figure 2-2), if a connection
exists between the Optimux-34 and the remote device. “Disconnected” appears
in the title bar, if, there is no connection between the Optimux-34 and the
remote device.
Menu Bar
Figure 2-3. Main Menu Bar
The main menu bar has drop-down sub-menus. Click a menu to display all the
items in that menu. The menu items allow you to perform operations related to
the selected elements in the Optimux-34 system. The menus are context
sensitive; menu items are enabled or disabled as applicable to the selected
element.
In addition to using the menu bar, operations related to specific elements can
also be performed using pop-up menus activated by right-clicking the mouse over
the selected element.
Toolbar
System Level
E1 and E3 Port Toolbar
MNG-ETH and USER-ETH
Port Toolbar
Figure 2-4. Toolbars
Below the menu bar appears toolbar icons that allow you to perform specific
Optimux-34 operations related to the selected elements in the Optimux-34
system with a single mouse-click. This toolbar is context sensitive; the icons
displayed change depending on the Optimux-34 element currently selected.
Optimux-34 Ver. 2.81
Using the Graphical User Interface (GUI)
2-3
Chapter 2 Installation and Operation
User’s Manual
Table 2-1. Toolbar Buttons
Icon
Name
Function
System Info
Displays system info
Reset
Resets the system’s default settings
Poll Agent
Poll system or selected device
Parameters
Displays the parameters of the selected device
Loopback Test
Runs loopback test(s) on the selected device
Status Bar
Figure 2-5. Optimux-34 Status Bar
The Optimux-34 status bar appears at the bottom of the View window and
indicates the current state of the system, as summarized in Table 2-2.
Table 2-2. Status Types and Descriptions
Status
Description
Working
Connection to the device is in progress
Waiting
Waiting for connection to the device
Interrupted
Connection to the device failed (time-out)
Ready
Connection to the device is successful
Polling
Device polling is in progress.
Optimux-34 System
The main, central workspace of the View window is a dynamic graphical
representation of the front panels of the local and remote Optimux-34 devices. In
this workspace you can select links, ports, and ports to invoke specific menu
commands to perform activities, such as system configuration and performance
monitoring.
Note that you can right-click the mouse over selected elements to invoke the
relevant menu commands.
When you perform certain activities, such as clicking the System Information
button, a dialog box is displayed (in a secondary window) on top of the
Optimux-34 View window.
2-4
Using the Graphical User Interface (GUI)
Optimux-34 Ver. 2.81
User’s Manual
Chapter 2 Installation and Operation
Figure 2-6. Optimux-34 System
RADview/TDM Optimux-34 Menu Maps
Figure 2-7. System Level Menu Map
Optimux-34 Ver. 2.81
Using the Graphical User Interface (GUI)
2-5
Chapter 2 Installation and Operation
User’s Manual
Figure 2-8. System Level Pop-Up Menu Map
Figure 2-9. E1, E3, V.35 Ports and Links Menu Map
Figure 2-10. E1, E3, V.35 Ports Pop-Up Menu Map
Figure 2-11. MNG-ETH/USER-ETH Level Menu Map
2-6
Using the Graphical User Interface (GUI)
Optimux-34 Ver. 2.81
User’s Manual
Chapter 2 Installation and Operation
Figure 2-12. MNG-ETH/USER-ETH Pop-Up Menu Map
Selecting the System
Before you can perform system operations, you must first select the system in
the Optimux-34 View window.
Two types of elements may be selected:
•
Ports
•
Links
•
All other areas that are not ports represent the system and a frame around
the panel is displayed.
The default selection is the system.
To select the system:
•
Click inside the Optimux-34 View window without selecting a device. Ensure
that no border surrounds any of the port or modem cards in the window.
A blue border outlines both the Local and Remote Optimux-34 devices,
indicating that the whole system is selected.
Figure 2-13. Optimux-34 System Selected in the View Window
The main view includes the local device and the remote device.
Discovering the Device
The Optimux-34 application opens with a specific IP address. The NMS discovers
the device by:
•
Recognizing the IP address it was designated
•
Identifying the virtual modules, slots, and LEDs that exist
•
Determines which device is the Remote device.
Optimux-34 Ver. 2.81
Using the Graphical User Interface (GUI)
2-7
Chapter 2 Installation and Operation
User’s Manual
Selecting Ports
Before you can perform port operations, you must first select a port in the
Optimux-34 View window (see Selecting the System on page 2-7 for available
Optimux-34 ports).
To select a port:
•
In the Optimux-34 View window, click a port to select it.
A blue border outlines the selected port, indicating it is selected.
Figure 2-14. Optimux-34 Front Panel
Optimux-34 Front Panel Connectors
Table 2-3 lists the ports and connectors of Optimux-34.
Table 2-3. Optimux-34 Ports and Connectors
Name
Number of Ports
Connector Type
Control
1
DB9
MNG-ETH
1
RJ-45
USER-ETH
1
RJ-45
E3 (Link)
2
SFP
E1
16
RJ-45 or 2 BNC
V.35
1
DB25
Power Supply
2
AC/DC
Note
The SFP connector looks different when an optic module exists. The agent
receives a message when no connector exists at all.
2-8
Using the Graphical User Interface (GUI)
Optimux-34 Ver. 2.81
User’s Manual
Chapter 2 Installation and Operation
The following ordering options are available for Optimux-34:
•
USER-ETH port
•
V.35 port
•
One or two Uplinks
•
Alarms connector.
Optimux-34 Indicators
This section provides lists and color/status descriptions of the Optimux-34 device
LED indicators.
The Optimux-34 View window uses the standard RAD color codes to indicate
operational and communication status of the agent, links/ports and power
supply.
The first upper half of the system in the window contains the local LEDs and the
second lower half contains the remote LEDs. The order of the LEDs in Optimux-34
unit is as follows:
1. Sync Loss Link A
2. Sync Loss Link B
3. System Flt
4. Power A
5. Power B
6. AIS Link A
7. AIS Link B
8. 100 MNG-ETH
9. Link/Act MNG-ETH
10. 100 User-ETH
11. Link/ACT USER-ETH
12. System-TST
Port Status Indicators
Operational status for ports will be indicated by color within the port itself. The
port status is color-coded in gray, magenta, or blue. Table 2-4 lists and describes
the port status colors.
There is no indication for the Control and Alarm ports.
Figure 2-15. Port Status (Blue)
Optimux-34 Ver. 2.81
Using the Graphical User Interface (GUI)
2-9
Chapter 2 Installation and Operation
User’s Manual
Table 2-4. Port Status Indicators
Port
Color
Description
MNG-ETH
Magenta
Errors exist
Gray
No errors exist and no tests are
running
Magenta
Errors exist
Gray
No errors exist and no tests are
running
Magenta
When line status experiences Loss of
Signal or any other failure
Blue
The loopback test is running.
Gray (in all other cases)
If the line status has no alarm
Magenta
When line status experiences Loss of
Signal or any other failure
Blue
The loopback test is running.
Gray (in all other cases)
If the line status has no alarm
Magenta
When line status experiences Loss of
Signal or any other failure
Blue
The loopback test is running.
Gray (in all other cases)
When line status experiences no alarm
USER-ETH
E1
V.35
E3 Link
Note
When a port may contain several statuses, only the most severe status color is
displayed. (Magenta is most severe, then blue, then gray.)
Agent Status Indicators
The Optimux version name on the front panel of both Local and Remote devices
are framed with a thin colored frame in green, white, or red. This frame indicates
the agent status, as summarized in Table 2-5 below.
Figure 2-16. Agent Status Indicator
2-10
Using the Graphical User Interface (GUI)
Optimux-34 Ver. 2.81
User’s Manual
Chapter 2 Installation and Operation
Table 2-5. Agent Status Indicators
Location
Color
Description
Local device
Green
Connected
White
Disconnected
Red
No Connection
Local Optimux only
Remote device
Green
Connected
White
Disconnected
Power Supply LEDs and Indicators
There are four power supply unit representations for both local and remote
devices when both devices are present in the window.
Figure 2-17. Power Supply Status LEDs and Indicators
The LED colors and descriptions for both power supplies on both local and
remote units are as shown in Table 2-6.
Table 2-6. Power Supply Indicators
Power Supply
Color
Description
Local Device Power A
Gray
Power supply active
Magenta
Power supply fault
Gray
Power supply active
Magenta
Power supply fault
Gray
Power supply active
Magenta
Power supply Fault
Gray
Power supply active
Magenta
Power supply fault
Local Device Power B
Remote Device Power A
Remote Device Power B
When power supply B is not available for the local unit (including its operating
switch), then power supply B does not exist on the remote device.
If the remote device is disconnected, the power supply LED colors are as last
displayed. If it goes on for the first time, the color is green.
Optimux-34 Ver. 2.81
Using the Graphical User Interface (GUI)
2-11
Chapter 2 Installation and Operation
User’s Manual
Optimux-34 LEDs
RADview/TDM for Optimux-34 displays LED indicators in real-time as they actually
appear on the device. The LED indications describe communication and operation
status of Optimux-34 and its links (see Table 2-7, below).
Table 2-7. Optimux-34 LED Summary
Name
Color
LED On
LED Off
Power A
Green
Power Supply A is active
Power is Off on both
Power Supplies A and B
Red
Power Supply A fault, or
Power Supply is Off on
both Power Supplies A
and B
Power Supply B is On
and Power Supply A is
Off
Power B
Green
Power Supply B is active
Power is Off on both
Power Supplies A and B
Red
Power Supply B fault, or
Power Supply is Off on
both Power Supplies A
and B
Power Supply A is On
and Power Supply B is
Off
System FLT
Red
System Fault (Self-test
fail, Agent fault)
System TST
Yellow
System on test (any kind
of loop)
Sync Loss A
Red
Signal Loss is detected
on the main link
AIS A
2-12
Yellow
Blinking
If the following
conditions occurs at the
same time:
•
Redundancy mode is
defined as Manual
•
Link A is defined as
main link
•
Link A is OK (No
Signal Loss or AIS)
•
Link B is active.
AIS is detected on the
main link
Using the Graphical User Interface (GUI)
Optimux-34 Ver. 2.81
User’s Manual
Chapter 2 Installation and Operation
Name
Color
LED On
Sync Loss B
Red
Signal Loss detected on
the main link
LED Off
If the following
conditions occur at the
same time:
AIS B
Yellow
AIS is detected on the
main link.
MNG-ETH:
100
Green
100M mode
10M mode
MNG-ETH:
Link/Act
Yellow
Management Ethernet
link is up
Management Ethernet
link is down
USER-ETH:
100
Green
100M mode
10M mode
USER-ETH:
Link/Act
Yellow
User Ethernet link is up
Data Ethernet link is
down
Sync Loss
on E1 ports
Red
Signal Loss is detected
on the respective E1
port
Port not in use or the
port is not physically
connected
AIS on E1
ports
Yellow
AIS is detected on
respective E1 port
Optimux-34 Ver. 2.81
Blinking
•
Redundancy mode is
defined as Manual
•
Link B is defined as
the main link.
•
Link B is OK (no
Signal Loss or AIS)
•
Link A is active.
Management Ethernet
link is up and the Rx/Tx
frames are transmitted
User Ethernet link is up
and Rx/Tx frames are
transmitted
Using the Graphical User Interface (GUI)
2-13
Chapter 2 Installation and Operation
2-14
Using the Graphical User Interface (GUI)
User’s Manual
Optimux-34 Ver. 2.81
Chapter 3
Configuration
Management
This chapter discusses how to configure the Optimux-34 management system
using RADview/TDM.
Managing the system includes the following tasks:
•
Viewing and modifying system configuration
•
Viewing and modifying system parameters
•
Configuring Ethernet, V.35, E1, and E3 Link, and port parameters
•
Viewing system interfaces
•
Resetting system hardware
•
Resetting system configuration.
3.1
Configuring Optimux-34 for Network
Management
RADview/TDM allows you to view and modify Optimux-34 configuration. The
Configuration menu provides access to system level configuration.
Figure 3-1. System Level Configuration Menu
Viewing and Configuring System Information
The System Info command enables you to view and set physical information
about the Optimux-34.
To view and configure Optimux-34 system information:
1. In the Optimux-34 View window, select the system.
Optimux-34 Ver. 2.81
Configuring Optimux-34 for Network Management
3-1
Chapter 3 Configuration Management
User’s Manual
2. On the menu bar, click Configuration > System Info.
Figure 3-2. System Information Dialog Box
3. Fill in the fields, as described in Table 3-1.
4. Click <Set> to implement the changes.
Table 3-1. System Information Dialog Box Parameters
Parameter
Possible Values / Remarks
Description
The description of the device, including the full name and version identification of
the device’s hardware type and software operating-system.
Read-Only
Object ID
The system identification number
Read-Only
Name
System name
Format: String (12 characters)
Read-Write
Contact
Name of the contact person for this system
Format: String (32 characters)
Read-Write
Location
Physical location of the device
Format: String (32 characters)
Read-Write
3-2
Configuring Optimux-34 for Network Management
Optimux-34 Ver. 2.81
User’s Manual
Chapter 3 Configuration Management
Parameter
Possible Values / Remarks
System Up Time
The length of time the system has been running.
Format: d: days, hh:mm:ss
Read-Only
Default Gateway
The IP address of the default gateway
Read-Only
Number of Interfaces
The number of network interfaces present in the system.
Read-Only
Note
The System Information Name, Contact, and Location dialog box fields are
enabled, regardless whether there is communication with the agent.
Configuring System Parameters
RADview/TDM allows you to view and configure the system parameters of both
the local and the remote devices.
To view and configure general Optimux-34 system parameters:
1. In the Optimux-34 View window, select the system (as described in Selecting
the System in Chapter 2).
2. On the menu bar, click Configuration > System.
The System Parameters dialog box appears. It contains configuration
parameters for local and remote devices. The System Parameters dialog
box is divided into two columns: the first column shows the local device
and the second column shows the remote device. The parameter names
are common to both columns.
Optimux-34 Ver. 2.81
Configuring Optimux-34 for Network Management
3-3
Chapter 3 Configuration Management
User’s Manual
Figure 3-3. System Parameters Dialog Box
3. Fill in the fields, as described in Table 3-2.
4. Click <Set> to implement the changes.
Table 3-2. System Dialog Box Parameters (Local/Remote)
Parameter
Possible Values / Remarks
Type
Indicates the Optimux-34 device type.
Read-Only
HW Version
The hardware version number of the Optimux-34 device.
Read-Only
SW Version
The software version number of Optimux-34 device.
Read-Only
Power Supply Main
The operating status of the main power supply.
Active
Fault
None
Unknown
Read-Only
Power Supply Backup
The operating status of the backup power supply.
Active
Fault
None
Unknown
Read-Only
3-4
Configuring Optimux-34 for Network Management
Optimux-34 Ver. 2.81
User’s Manual
Chapter 3 Configuration Management
Parameter
Possible Values / Remarks
Redundancy
The availability of redundancy on the local/remote device.
Available
Not Available
Read-Only
Redundancy Mode
The redundancy manner of operation:
Off
Auto
Manual
Read-Write
If the Redundancy Mode is set to ‘Manual’, you should manually request the
SNMP agent to configure the optSelectLink to ‘Main’ or ‘Back’ after the link has
switched from main to backup because when the Redundancy Mode is set to
‘Manual’ it means that there was a problem on the main that has been just fixed.
Note: This parameter is available only when the device has two links and
Redundancy is available.
Default Main Link
Link A
Link B
Read-Write
Link Active
Link A
Link B
Read-Only
Clock Source
Internal
LBT
Changing the Clock Source from Internal to LBT takes about 2 minutes. A
confirmation message is displayed announcing “Changing Clock Source to LBT
may take about 2 minutes”, click <OK> or <Cancel> to acknowledge.
Read-Write for the Local device
Note
If the Remote device is disconnected, the fields concerning the remote device will
be displayed as“ - - “ (N/A value).
3.2
Configuring Operational Parameters
This section discusses how to manage Optimux-34 ports for operation using
RADview/TDM Optimux-34.
Managing ports includes the following tasks:
•
Selecting the port
•
Viewing and modifying port parameters, including:
E1 port parameters
Optimux-34 Ver. 2.81
Configuring Operational Parameters
3-5
Chapter 3 Configuration Management
User’s Manual
E3 Link port parameters
MNG-ETH port parameters
USER-ETH port parameters.
Additional port operations are discussed in the following chapters:
•
Managing port faults (see Managing Port Alarms in Chapter 7).
•
Monitoring port performance and diagnostics (see Performance Monitoring in
Chapter 6).
Viewing and Configuring Port Parameters
RADview/TDM allows you to view and modify Optimux-34 E1, E3 Link, and
Ethernet port parameters.
The Configuration menu provides port level configuration information.
Figure 3-4. Port Level Configuration Menu
Viewing and Configuring Ethernet Port Parameters
You can view and configure Ethernet port parameters.
Note
The USER-ETH port is enabled only per valid license key.
To view and modify Ethernet port parameters:
1. In the Optimux-34 View window, select an Ethernet port (MNG-ETH or
USER-ETH) on the local or remote device.
2. On the menu bar, click Configuration > System Parameters.
3-6
Configuring Operational Parameters
Optimux-34 Ver. 2.81
User’s Manual
Chapter 3 Configuration Management
Figure 3-5. MNG-ETH Port Dialog Box
Optimux-34 Ver. 2.81
Configuring Operational Parameters
3-7
Chapter 3 Configuration Management
User’s Manual
Figure 3-6. USER-ETH Port Dialog Box
3. Fill in the fields, as described in Table 3-3.
4. Click <Set> to implement the changes.
3-8
Configuring Operational Parameters
Optimux-34 Ver. 2.81
User’s Manual
Chapter 3 Configuration Management
Table 3-3. Ethernet Port Parameters
Parameter
Possible Values / Remarks
Port Type
Fast Ethernet
Read-Only
Administrative Status
Up, Down
Port status
Selecting Down disables the remaining fields in this dialog box and any changed
values of RW fields will not be sent the agent
Relevant only for USER-ETH port
User Name
Ethernet port name, up to 15 characters
Connector Type
RJ-45
Read-Only
Port Status
Available: indicates that the link, light, or loopback is normal
NotAvailable: indicates link loss, low light, or no loopback
Read-Only
Auto Negotiation
Enabled (checked)
Disabled (unchecked)
Read-Write
Auto Negotiation Status
Configuring
Completed
Disabled
Read-Only
Flow Control
Enabled (checked)
Disabled (unchecked)
Read-Write
Ethernet Mode
Half-Duplex
Full-Duplex
Note: This field is Read-Write only if Autonegotiation is disabled.
Rate (Mbps)
10
100
Note: This field is enabled only if Autonegotiation is disabled.
Read-Write/Read-Only
Rate Limitations (Mbps)
For E1 channels:
0, 8, 16, 24, 32
Rate limitation is configurable in multiples of 8Mbps.
Relevant only for USER-ETH port
USER-ETH speed is dependent in the rate limitation configured
Optimux-34 Ver. 2.81
Configuring Operational Parameters
3-9
Chapter 3 Configuration Management
User’s Manual
Configuring V.35 Port Parameters
You can view and configure parameters for V.35 ports.
To view and configure V.35 port parameters:
1. In the Optimux-34 View window, select a V.35 port on the local or remote
device.
2. On the menu bar, click Configuration > Parameters.
Figure 3-7. V.35 Port Parameters Dialog Box
3. Fill in the fields, as described in Table 3-4.
4. Click <Set> to implement the changes.
3-10
Configuring Operational Parameters
Optimux-34 Ver. 2.81
User’s Manual
Chapter 3 Configuration Management
Table 3-4. V.35 Port Parameters
Parameter
Possible Values / Remarks
Administrative Status
Up, Down
Port status
Selecting Down disables the remaining fields in this dialog box and any changed
values of RW fields will not be sent the agent
Port Type
V.35
Read-Only
User Name
V.35 port name, up to 15 characters
Connector Type
DB25
Read-Only
Clock Source
LBT (Default)
Internal
External
CTS
ON (Default)
RTS
DCD
Link OK
ON
Enable DTW Loop
No (Default
Yes
Configuring E1 Channel Port Parameters
You can view and configure parameters for the E1 channels.
To view and configure E1 port parameters:
1. In the Optimux-34 View window, select an E1 channel port (ports 1-16 from
either the local or remote unit).
2. On the menu bar, click Configuration > Parameters.
Optimux-34 Ver. 2.81
Configuring Operational Parameters
3-11
Chapter 3 Configuration Management
User’s Manual
Figure 3-8. E1 Channel Parameters Dialog Box
3. Fill in the fields, as described in Table 3-5.
4. Click <Set> to implement the changes.
Note
If the User-ETH port has been configured to a rate > 0, the corresponding E1
ports fields will be all Read-Only, and the <Set> button will be disabled.
Table 3-5. E1 Port Parameters
Parameter
Possible Values / Remarks
Administrative Status
Up
Down
Read-Write (Read-Only, see Note above)
Port Type
E1
Read-Only
User Name
The name for the interface as specified by the network manager.
String of up to 15 characters
Read-Write
Connector Type
RJ-45
Read-Only
Interface Type
Unbalanced: 75Ω
Balanced: 120Ω
Read-Write
3-12
Configuring Operational Parameters
Optimux-34 Ver. 2.81
User’s Manual
Chapter 3 Configuration Management
Configuring E3 Link Parameters
You can view and configure parameters for the E3 link ports (Link A or Link B).
To view and configure E3 link port parameters:
1. In the Optimux-34 View window, select an E3 link port (Link A or Link B) on
the local or remote device.
2. On the menu bar, click Configuration > Parameters.
Figure 3-9. E3 Link Port Parameters Dialog Box
3. Fill in the fields, as described in Table 3-6.
4. Click <Set> to implement the changes.
Optimux-34 Ver. 2.81
Configuring Operational Parameters
3-13
Chapter 3 Configuration Management
User’s Manual
Table 3-6. E3 (Link) Port Parameters
Parameter
Possible Values / Remarks
Line Type
Other
Framed
Read-Only
User Name
The name for the interface as specified by the network manager.
String of up to 15 characters
Read-Write
Connector Type
For Coax: 2 Mini BNCs
For Fiber: SFP (In)
SFP (Out)
Read-Only
Line Coding
For Coax: HDB3
For Fiber: Other
Read-Only
3.3
Additional Tasks
Viewing System Interfaces
RADview/TDM allows you to view details about the system interfaces of the local
and remote Optimux-34 devices.
To view system interfaces:
1. In the Optimux-34 View window, select the system (as described in Selecting
the System in Chapter 2).
2. On the menu bar, click Configuration > Interfaces.
Note
3-14
Clicking on one of the column headings in the Interfaces dialog box sorts the
entries according to that sort-method.
Additional Tasks
Optimux-34 Ver. 2.81
User’s Manual
Chapter 3 Configuration Management
Figure 3-10. Interfaces Dialog Box
3. Click <Refresh> to refresh the statistics or click <Close> to close the window.
Table 3-7. Interfaces Dialog Box Parameters
Parameter
Possible Values / Remarks
Index
The link/port number in the Interface table
Read-Only
Type
The link/port type, such as DS1, Ethernet or SLIP
Read-Only
Name & Description
The name and description of the interface
Read-Only
Speed
The connection speed for this interface, in bytes
Read-Only
Optimux-34 Ver. 2.81
Additional Tasks
3-15
Chapter 3 Configuration Management
User’s Manual
Resetting the System Hardware
RADview/TDM allows you to reset the Optimux-34 hardware configuration.
Resetting the system hardware resets the Agent.
To reset hardware configuration:
1. In the Optimux-34 View window, select the system (as described in Selecting
the System in Chapter 2).
Figure 3-11. System Level Configuration > Reset Menu
2. On the menu bar, click Configuration > Reset > Reset HW.
A confirmation dialog box is displayed.
Selecting this entry will enable the user to reset the agent’s hardware.
Figure 3-12. Reset Agent Confirmation Message Dialog Box
3. Click <OK> to reset.
Resetting System Configuration
RADview/TDM allows you to reset the Optimux-34 parameters to default values.
To reset hardware configuration:
1. In the Optimux-34 View window, select the system (as described in Selecting
the System in Chapter 2).
2. On the menu bar, click Configuration > Reset > Reset Config.
A confirmation message appears.
Selecting this entry will enable you to reset the agent's configuration to
its default values.
3-16
Additional Tasks
Optimux-34 Ver. 2.81
User’s Manual
Chapter 3 Configuration Management
Figure 3-13. Reset Agent Confirmation Message Dialog Box
3. Click <OK> to reset.
Optimux-34 Ver. 2.81
Additional Tasks
3-17
Chapter 3 Configuration Management
3-18
Additional Tasks
User’s Manual
Optimux-34 Ver. 2.81
Chapter 4
Configuring Typical
Applications
This chapter describes the procedure for the configuration of a typical
application, which is performed after completing the physical installation of the
units. This procedure is accomplished through the use of the RADview/TDM
Optimux-34.
4.1
Applications
The following sections describe typical Optimux-34 applications.
Backbone Data Network Application
In the application shown in the following figure, a coax link module is installed in
the Optimux-34 unit that is physically close to the public network. The other
Optimux-34 is equipped with a fiber optic link interface to extend its transmission
range. The optical link is connected to a fiber optic modem (FOM) with an E3
interface, which is coupled to the public network via a coaxial cable.
Figure 4-1. Optimux-34 Backbone Access Application
Optimux-34 Ver. 2.81
Applications
4-1
Chapter 4 Configuring Typical Applications
User’s Manual
E1 Fan-Out over Satellite Link Application
An E1 fan-out over satellite link application shown in Figure 4-2 is a satellite link
connecting two Optimux-34 units. The Optimux-34 unit can be connected to a
Megaplex-2100 unit and a network management service (NMS). A coax link
module is installed in each of the Optimux-34 unit that is physically close to the
satellite device.
Figure 4-2. E1 Fan-Out over Satellite Link Application
4.2
Configuring Optimux-34
You can use the following procedures to configure Optimux-34.
Configuring System Information
You can configure system information.
To configure system information:
1. In the Optimux-34 View window, select the system.
2. On the menu bar, click Configuration > System Info (see Figure 3-1).
4-2
Configuring Optimux-34
Optimux-34 Ver. 2.81
User’s Manual
Chapter 4 Configuring Typical Applications
Figure 4-3. System Information Dialog Box
3. Fill in the fields, as described in Table 4-1.
4. Click <Set> to implement the changes.
Table 4-1. System Information Dialog Box Parameters
Parameter
Possible Values / Remarks
Description
The description of the device, including the full name and version identification of
the device’s hardware type and software operating-system.
Read-Only
Object ID
The system identification number
Read-Only
Name
System name
Format: String (12 characters)
Read-Write
Contact
Name of the contact person for this system
Format: String (32 characters)
Read-Write
Location
Physical location of the device
Format: String (32 characters)
Read-Write
Optimux-34 Ver. 2.81
Configuring Optimux-34
4-3
Chapter 4 Configuring Typical Applications
Parameter
Possible Values / Remarks
System Up Time
The length of time the system has been running.
User’s Manual
Format: d: days, hh:mm:ss
Read-Only
Default Gateway
The IP address of the default gateway
Read-Only
Number of Interfaces
The number of network interfaces present in the system.
Read-Only
Note
The System Information Name, Contact, and Location dialog box fields are
enabled, regardless whether there is communication with the agent.
Configuring System Parameters
You can configure system parameters.
To configure system parameters:
1. On the menu bar, click Configuration > System Parameters (see Figure 3-1).
The System Parameters dialog box appears. It contains configuration
parameters for local and remote devices. The parameter names are
common to both columns.
Figure 4-4. System Parameters Dialog Box
2. Fill in the fields, as described in Table 4-2.
4-4
Configuring Optimux-34
Optimux-34 Ver. 2.81
User’s Manual
Chapter 4 Configuring Typical Applications
3. Click <Set> to implement the changes.
Table 4-2. System Dialog Box Parameters (Local/Remote)
Parameter
Possible Values / Remarks
Type
Indicates the Optimux-34 device type.
Read-Only
HW Version
The hardware version number of the Optimux-34 device.
Read-Only
SW Version
The software version number of Optimux-34 device.
Read-Only
Power Supply Main
The operating status of the main power supply.
Active
Fault
None
Unknown
Read-Only
Power Supply Backup
The operating status of the backup power supply.
Active
Fault
None
Unknown
Read-Only
Redundancy
The availability of redundancy on the local/remote device.
Available
Not Available
Read-Only
Redundancy Mode
The redundancy manner of operation:
Off
Auto
Manual
Read-Write
If the Redundancy Mode is set to ‘Manual’, you should manually request the
SNMP agent to configure the optSelectLink to ‘Main’ or ‘Back’ after the link has
switched from main to backup because when the Redundancy Mode is set to
‘Manual’ it means that there was a problem on the main that has been just fixed.
Note: This parameter is available only when the device has two links and
Redundancy is available.
Default Main Link
Link A
Link B
Read-Write
Link Active
Link A
Link B
Read-Only
Optimux-34 Ver. 2.81
Configuring Optimux-34
4-5
Chapter 4 Configuring Typical Applications
User’s Manual
Parameter
Possible Values / Remarks
Clock Source
Internal
LBT
Changing the Clock Source from Internal to LBT takes about 2 minutes. A
confirmation message is displayed announcing “Changing Clock Source to LBT
may take about 2 minutes”, click <OK> or <Cancel> to acknowledge.
Read-Write for the Local device
Configuring SNMP
You can configure SNMP settings to specify the management station(s) that can
transmit or receive Optimux-34 traps.
To configure SNMP:
1. On the menu bar, click Options > Manager List (see Figure 3-4).
Figure 4-5. Manager List Dialog Box
2. Change the IP addresses, as required.
3. You can elect not to send traps to a selected address by clearing the relevant
Send Traps check box adjacent to that address.
4. Click <Set> to implement the change.
4-6
Configuring Optimux-34
Optimux-34 Ver. 2.81
User’s Manual
Chapter 4 Configuring Typical Applications
Management Access
To enable/disable Telnet and Web management accesses:
1. On the menu bar, click Options > Management Access (see Figure 3-4).
Figure 4-6. Management Access Dialog Box
2. Select Enable or Disable for Telnet Access, as required.
3. Select Enable or Disable for Web Access, as required.
4. Click <Set> to implement the change(s).
4.3
Connecting Optimux-34 to the Management
Station
You can perform the following parameters to connect Optimux-34 to the
management station.
Configuring Port Parameters
You can configure Optimux-34 port parameters.
To configure port parameters:
1. In the Optimux-34 View window, select an E1 (Ports 1-16), E3 Link (A or B)),
or MNG-ETH, or USER-ETH port from either the local or remote unit.
2. On the menu bar, click Configuration > Parameters (see Figure 3-7).
Optimux-34 Ver. 2.81
Connecting Optimux-34 to the Management Station
4-7
Chapter 4 Configuring Typical Applications
User’s Manual
Figure 4-7. USER-ETH Port Dialog Box
3. Fill in the fields, as described in Table 4-3.
4. Click <Set> to implement the changes.
4-8
Connecting Optimux-34 to the Management Station
Optimux-34 Ver. 2.81
User’s Manual
Chapter 4 Configuring Typical Applications
Table 4-3. Ethernet Port Parameters
Parameter
Possible Values / Remarks
Port Type
Fast Ethernet
Read-Only
Administrative Status
Up, Down
Port status
Selecting Down disables the remaining fields in this dialog box and any changed
values of RW fields will not be sent the agent
Relevant only for USER-ETH port
User Name
Ethernet port name, up to 15 characters
Connector Type
RJ-45
Read-Only
Port Status
Available: indicates that the link, light, or loopback is normal
NotAvailable: indicates link loss, low light, or no loopback
Read-Only
Auto Negotiation
Enabled (checked)
Disabled (unchecked)
Read-Write
Auto Negotiation Status
Configuring
Completed
Disabled
Read-Only
Flow Control
Enabled (checked)
Disabled (unchecked)
Read-Write
Ethernet Mode
Half-Duplex
Full-Duplex
Note: This field is Read-Write only if Autonegotiation is disabled.
Rate (Mbps)
10
100
Note: This field is enabled only if Autonegotiation is disabled.
Read-Write/Read-Only
Rate Limitations (Mbps)
For E1 channels:
0, 8, 16, 24, 32
Rate limitation is configurable in multiples of 8Mbps.
Relevant only for USER-ETH port
USER-ETH speed is dependent in the rate limitation configured
Optimux-34 Ver. 2.81
Connecting Optimux-34 to the Management Station
4-9
Chapter 4 Configuring Typical Applications
Note
User’s Manual
•
The USER-ETH port is available/enabled only per valid license. If the USER-ETH
port has been configured to a rate > 0, the corresponding E1 ports fields will be
all Read-Only, and the <Set> button will be disabled.
Configuring V.35 Port Parameters
You can view and configure parameters for V.35 ports.
To view and configure V.35 port parameters:
1. In the Optimux-34 View window, select a V.35 port on the local or remote
device.
2. On the menu bar, click Configuration > Parameters.
Figure 4-8. V.35 Port Parameters Dialog Box
3. Fill in the fields, as described in Table 4-4.
4. Click <Set> to implement the changes.
4-10
Connecting Optimux-34 to the Management Station
Optimux-34 Ver. 2.81
User’s Manual
Chapter 4 Configuring Typical Applications
Table 4-4. V.35 Port Parameters
Parameter
Possible Values / Remarks
Administrative Status
Up, Down
Port status
Selecting Down disables the remaining fields in this dialog box and any changed
values of RW fields will not be sent the agent
Port Type
V.35
Read-Only
User Name
V.35 port name, up to 15 characters
Connector Type
DB25
Read-Only
Clock Source
LBT (Default)
Internal
External
CTS
ON (Default)
RTS
DCD
Link OK
ON
Enable DTW Loop
No (Default
Yes
Configuring E1 Channel Port Parameters
You can view and configure parameters for the E1 channels.
To view and configure E1 port parameters:
1. In the Optimux-34 View window, select an E1 channel port (ports 1-16 from
either the local or remote unit).
2. On the menu bar, click Configuration > Parameters.
Optimux-34 Ver. 2.81
Connecting Optimux-34 to the Management Station
4-11
Chapter 4 Configuring Typical Applications
User’s Manual
Figure 4-9. E1 Channel Parameters Dialog Box
3. Fill in the fields, as described in Table 4-5.
4. Click <Set> to implement the changes.
Note
If the User-ETH port has been configured to a rate > 0, the corresponding E1
ports fields will be all Read-Only, and the <Set> button will be disabled.
Table 4-5. E1 Port Parameters
Parameter
Possible Values / Remarks
Administrative Status
Up
Down
Read-Write (Read-Only, see Note above)
Port Type
E1
Read-Only
User Name
The name for the interface as specified by the network manager.
String of up to 15 characters
Read-Write
Connector Type
RJ-45
Read-Only
Interface Type
Unbalanced: 75
Balanced: 120
Read-Write
Configuring Link Parameters
You can view and configure parameters for the link ports (Link A or Link B).
4-12
Connecting Optimux-34 to the Management Station
Optimux-34 Ver. 2.81
User’s Manual
Chapter 4 Configuring Typical Applications
To view and configure link port parameters:
1. In the Optimux-34 View window, select a link port (Link A or Link B) on the
local or remote device.
2. On the menu bar, click Configuration > Parameters.
Figure 4-10. Link Port Parameters Dialog Box
3. Fill in the fields, as described in Table 4-6.
4. Click <Set> to implement the changes.
Optimux-34 Ver. 2.81
Connecting Optimux-34 to the Management Station
4-13
Chapter 4 Configuring Typical Applications
User’s Manual
Table 4-6. E3 (Link) Port Parameters
Parameter
Possible Values / Remarks
Line Type
Other
Framed
Read-Only
User Name
The name for the interface as specified by the network manager.
String of up to 15 characters
Read-Write
Connector Type
For Coax: 2 Mini BNCs
For Fiber: SFP (In)
SFP (Out)
Read-Only
Line Coding
For Coax: HDB3
For Fiber: Other
Read-Only
4.4
Configuring Security Management
You can configure security management for RADview/TDM Optimux-34.
To configure security management:
5. Add/Create users as required. For details on how to add users in Optimux-34,
see Chapter 4, RADview Functions Security in the RADview-EMS/TDM (PC)
documentation.
1. Change user Names as required.
For details on how to change a user name in Optimux-34, see Chapter 4,
RADview Functions Security in the RADview-EMS/TDM (PC) documentation.
2. Change passwords as required.
For details on how to change passwords in Optimux-34, see Chapter 4,
RADview Functions Security in the RADview-EMS/TDM (PC) documentation.
Polling the Agent
You can poll the agent to update the Optimux-34 device status.
To poll the agent:
1. In the Optimux -34 View window, select the Optimux-34 system.
2. On the menu bar, click Configuration > Poll Agent.
The components are polled and their status is updated immediately.
4-14
Configuring Security Management
Optimux-34 Ver. 2.81
User’s Manual
Chapter 4 Configuring Typical Applications
Resetting the System Hardware
RADview/TDM allows you to reset the Optimux-34 hardware configuration.
Resetting the system hardware resets the Agent.
To reset hardware:
1. In the Optimux-34 View window, select the system.
2. On the menu bar, click Configuration > Reset > Reset HW.
3. Click <OK> to reset the agent's hardware.
Resetting System Configuration
RADview/TDM allows you to reset the Optimux-34 hardware configuration.
Resetting the system hardware resets the Agent.
To reset system configuration:
1. In the Optimux-34 View window, select the system.
2. On the menu bar, click Configuration > Reset > Reset Config.
3. Click <OK> to reset the agent's configuration to its default values.
4.5
Configuration Sequence
The following describes the step-by-step configuration sequence for the
Optimux-34 local and remote units through the RADview/TDM Optimux-34.
Table 4-7. RADview/TDM Optimux-34 Configuration Sequence
Task Description
System Level
Configuring and viewing system information
√
Configuring and viewing system parameters
√
Configuring and viewing port parameters
√
Viewing system interfaces
√
Defining manager list
√
Setting management access
√
Polling agent
√
Managing alarms
√
Listing alarm history log
√
Clearing alarm history log
√
Optimux-34 Ver. 2.81
Port Level
(MNG-ETH,
USER-ETH, V.35,
E1, Link)
Configuration Sequence
4-15
Chapter 4 Configuring Typical Applications
Task Description
Masking alarms
User’s Manual
System Level
√
Performing loopback tests
4-16
√
Resetting hardware
√
Resetting hardware configuration
√
Configuration Sequence
Port Level
(MNG-ETH,
USER-ETH, V.35,
E1, Link)
Optimux-34 Ver. 2.81
Chapter 5
Performance Management
5.1
Introduction
This chapter discusses how to monitor the performance of the Optimux-34
system using RADview/TDM Optimux-34.
5.2
Polling the Agent
Polling the agent updates the Optimux-34 device status. You can execute either
manual or automatic polling of the Optimux-34 system. Device components are
automatically polled once every minute. However, you can also manually poll and
update the status of the components.
To manually poll the agent components:
1. In the Optimux-34 View window, select the Optimux-34 system (as described
in Selecting the System in Chapter 2).
2. On the menu bar, click Configuration > Poll Agent.
The components are polled and their status is updated immediately.
Selecting this entry will cause immediate polling of the Agent.
Optimux-34 Ver. 2.81
Polling the Agent
5-1
Chapter 5 Performance Management
5-2
Polling the Agent
User’s Manual
Optimux-34 Ver. 2.81
Chapter 6
Security Management
This chapter discusses how to manage security through assigning access
authorizations for the Optimux-34 system using RADview/TDM.
The basic tasks involved in security management or access authorization
management are:
•
Configuring SNMP
•
Configuring Management Access.
RADview/OV on Unix supports the Security feature. Security defines different
types of users:
•
Administrator
•
Operator
•
Technician
•
Monitor.
Each user type has different access permission(s) to the product's application
data. Some of them have Read-Write access to all or part of the menus and
dialog boxes; others have only Read-Only access to part of the menus/dialog
boxes. The menu looks the same for all users. If you are a user that has only
Read-Only access and attempts to enter a dialog box, select a menu entry that
you do not have permission to, or to press the <Set> button (or a similar ReadWrite one), a message box will then be displayed stating that you have no access
to the selected entry/dialog box/operation.
When a Read-Write menu entry or a dialog box is allowed (to be <Set>) for a
Technician, the paragraph detailing this entry/dialog box will include (T) at the
end.
When a Read-Write menu entry or dialog box is allowed (to be Set) for a Monitor,
the paragraph detailing this entry/dialog box, will include at the end: (M). In this
case, Technician is also allowed to perform Set.
<Print> and <Refresh> are buttons that are enabled for Monitor users.
6.1
Configuring SNMP
RADview/TDM allows you to view and modify SNMP settings; enabling you to
specify the management station(s) that can transmit or receive Optimux-34
traps. There may be between one to ten management stations defined.
You cannot change the number of management stations, or the Manager IDs, but
you can change the IP address/es.
Optimux-34 Ver. 2.81
Configuring SNMP
6-1
Chapter 6 Security Management
User’s Manual
To view or specify the management station IP address to which to send traps:
1. In the Optimux-34 View window, select the system.
Figure 6-1. Manager List and Management Access Sub-Menus
2. On the menu bar, click Options > Manager List.
Figure 6-2. Manager List Dialog Box
3. Change the IP addresses, as required.
4. You can elect not to send traps to a selected address by clearing the relevant
Send Traps check box adjacent to that address.
5. Click <Set> to implement the change.
6-2
Configuring SNMP
Optimux-34 Ver. 2.81
User’s Manual
Chapter 6 Security Management
6.2
Configuring Management Access
RADview/TDM Optimux-34 enables/disables you to access Telnet and Web
management access.
To enable/disable Telnet and Web management accesses:
1. In the Optimux-34 View window, select the system.
2. On the menu bar, click Options > Management Access.
Figure 6-3. Management Access Dialog Box
3. Select Enable or Disable for Telnet Access, as required.
4. Select Enable or Disable for Web Access, as required.
5. Click <Set> to implement the change(s).
Table 6-1. Management Access Parameters
Parameter
Possible Values / Remarks
Telnet Access
Enable
Disable
Read-Write
Web Access
Enable
Disable
Read-Write
Optimux-34 Ver. 2.81
Configuring Management Access
6-3
Chapter 6 Security Management
6-4
Configuring Management Access
User’s Manual
Optimux-34 Ver. 2.81
Chapter 7
Fault Management
This chapter discusses how to manage faults for the entire Optimux-34 system
using RADview/TDM Optimux-34.
RADview/TDM allows you to manage Optimux-34 system and port alarms.
Managing faults includes the following tasks:
•
Managing system alarms
•
Managing the following port alarms:
E1
E3 Link
MNG-ETH
USER-ETH
V.35.
•
Performing loopback tests.
7.1
Managing System Alarms
RADview/TDM allows you to manage Optimux-34 system alarms.
Basic tasks include:
•
Viewing all active alarms
•
Viewing system alarms
•
Viewing alarm history in the System Alarm Buffer
•
Clearing alarms in the System Alarm Buffer
•
Masking port alarms.
7.2
Handling Alarms and Traps
The Fault menu provides access to the system alarm options. You can view alarm
severity as well as clear alarms.
Optimux-34 Ver. 2.81
Handling Alarms and Traps
7-1
Chapter 7 Fault Management
User’s Manual
Figure 7-1. Fault Menu – System Level
List of Alarms and Events
The Optimux-34 alarms are described in Table 7-1.
Table 7-1. Optimux-34 System Alarms
Code
Message on terminal
Description
Severity
1
PS A fail
No voltage in power supply A.
Major
2
PS B fail
No voltage in power supply B.
Major
3
Remote connection FAIL
A managment connection could not be established with
the remote device.
Major
4
Redundancy not
available
Redundancy mode is set to AUTO or MANUAL but the
second link is not installed.
Major
30
ETH Integrity fail
Failure in Ethernet management port
integrity or in the fast Ethernet integrity.
ETH-MNG
Major
Signal loss detected on uplinks or
channels.
E1
Received AIS on the uplinks or the
channels.
E1
31
33
Signal Loss
Rx AIS
ETH
Major
LINK
Minor
LINK
The Optimux-34 events are described in Table 7-2.
Table 7-2. Optimux-34 Events
Code
Event
Description
100
Software process failed
Failed to process software download.
101
Buffer overflow
The event log buffer exceeded its maximum size and new events are
written over the old ones.
Viewing All Active Alarms
The All Active Alarms command enables you to view all active alarms of the local
and remote devices in the system.
To view all active alarms for the system:
1. In the RADview/TDM Optimux-34 window, select the system.
2. On the menu bar, click Fault > All Active Alarms.
7-2
Handling Alarms and Traps
Optimux-34 Ver. 2.81
User’s Manual
Note
Chapter 7 Fault Management
You can sort the Alarms by clicking any of the column headings.
Figure 7-2. All Active Alarms Dialog Box
Table 7-3. All Active Alarms Parameters
Parameter
Possible Values
Remarks
System Level Alarms
Location
Local, Remote
Port
--
The Port column is relevant only for Port level.
Code
Integer
Alarm code
Description
String
Description of the alarm
Severity
Major, Minor
Mask
No, Yes
Optimux-34 Ver. 2.81
Handling Alarms and Traps
7-3
Chapter 7 Fault Management
Parameter
Possible Values
User’s Manual
Remarks
Port Level Alarms
Location
Local, Remote
Port
Channel 1-4, 5-8,
9-12, 13-16
Link A,
Link B
MNG-ETH
USER-ETH
V.35
Code
Integer
Active Alarm code
Description
String
Description of the active alarm
Severity
Major, Minor
Mask
No, Yes
[Done]
Click <Done> to close the All Active Alarms Dialog Box
[Print]
Click <Print> to print the active alarms
[Save To File]
Click <Save To File> to save the active alarms. The Save dialog box
appears. In the File Name field, enter the name of the file. In the
File of type field, select Acrobat (*pdf) or HTML (*.htm). Click Save
[Refresh]
Click <Refresh> to update the active alarms
Viewing System Alarms
RADview/TDM allows you to view all the active alarms of both the local and
remote devices. The window displays a list of current Optimux-34 system alarms,
their code and severity related to the system level.
You can sort the alarm list by clicking on any column you wish to sort.
To view system alarms:
1. In the Optimux-34 View window, select the system.
2. On the menu bar, click Fault > Alarms.
7-4
Handling Alarms and Traps
Optimux-34 Ver. 2.81
User’s Manual
Chapter 7 Fault Management
Figure 7-3. System Alarms Dialog Box
3. Do one of the following:
Sort the alarm list by clicking on one of the columns on the list. It is
possible to sort the list through each column.
Optimux-34 sorts the alarms by location as a default; first local and then
remote
To send the active alarms to a printer, click <Print>.
To save the active alarms to a file, click <Save File>, select a location
where to save the file, then name the file and click <Save>.
To exit this window, click <Close> or update the window by clicking
<Refresh>.
Optimux-34 Ver. 2.81
Handling Alarms and Traps
7-5
Chapter 7 Fault Management
User’s Manual
Table 7-4. System Alarm Parameters
Parameter
Possible Values / Remarks
Location
Indicates the location where the alarm occurred
Local
Remote
Read-Only
Code
The code for the specific alarm
1…40
Read-Only
Description
The description of the alarm corresponding to the specified code
Read-Only
Severity
The alarm severity
Major
Minor
Read-Only
Mask
Masks system alarms
Yes
No
Viewing Alarm History in the System Alarm Buffer
RADview/TDM Optimux-34 allows you to view a history log of all the alarms listed
in the Optimux-34 System Alarm Buffer. The System Alarm Buffer contains all the
unmasked alarms recorded for the whole device.
To view the System Alarm Buffer List:
1. In the Optimux-34 window, select the system.
2. One the menu bar, click Fault > History Log > List.
7-6
Handling Alarms and Traps
Optimux-34 Ver. 2.81
User’s Manual
Chapter 7 Fault Management
Figure 7-4. System Alarm Buffer List
3. Do one of the following:
Sort the alarm buffer list by clicking on one of the columns on the list.
You can sort each column independently. The System Alarm Buffer list is
sorted according to the Date and Time column by default with the oldest
shown on the first line.
To send the alarm buffer to a printer, click <Print>.
To save the alarm buffer to a file, click <Save File>, select a location to
where to save the file, name the file and click <Save>.
To update the list, click <Refresh> or exit the window by clicking <Close>.
Optimux-34 Ver. 2.81
Handling Alarms and Traps
7-7
Chapter 7 Fault Management
User’s Manual
Table 7-5. System Alarm Buffer Parameters
Parameter
Possible Values / Remarks
Code
The code number for the alarm that occurred
1…120
Read-Only
Description
The description of the alarm corresponding to the specified code
Read-Only
Location
The device where the alarm ocurred
Local
Remote
Read-Only
Slot
Slot or link where the alarm occurred (if applicable)
Link A
Link B
Read-Only
Port
Indicates the port number this alarm refers to (if applicable)
Link A
Link B
Channels 1-16
MNG-ETH
USER-ETH
V.35
Read-Only
State
Indicates the alarm type
Off: Disappearance of an alarm
Event: Occurrence of an event
Major: Appearance of a major problem
Minor: Appearance of a minor problem
Read-Only
Date & Time
The date and time the alarm occurred
Date format: yyyy-mm-dd
Time format: hh:mm:ss
Read-Only
Clearing Alarms in the Alarm Buffer
You can clear the alarm history log contained in the Optimux-34 Alarm Buffer.
Selecting this entry will clear all the entries of the Alarm Buffer.
To clear all alarms in the Alarm Buffer:
•
On the menu bar, click Fault > History Log > Clear.
The History Log is cleared. No user confirmation is provided.
7-8
Handling Alarms and Traps
Optimux-34 Ver. 2.81
User’s Manual
Chapter 7 Fault Management
In the History Log List, only alarms that occurred after the Clear operation will be
displayed.
Figure 7-5. Alarm Buffer List after Clearing
Masking Alarms
RADview/TDM Optimux-34 allows you to mask Optimux-34 port alarms. Masking
port alarms prevents sending alarm traps to this slot.
To mask a port alarm:
1. On the menu bar, click Fault > Mask Alarms.
The Mask Alarms dialog box appears. After a few moments (when the
dialog box status bar indicates “Working…”, a table of ports per slot
appears.
The Mask Alarms dialog box is divided into two groups: Local Device and
Remote Device. The Remote Device area appears only if the remote
device is connected.
Optimux-34 Ver. 2.81
Handling Alarms and Traps
7-9
Chapter 7 Fault Management
User’s Manual
Figure 7-6. Mask Alarms Dialog Box
2. Select the relevant check boxes adjacent to the port slots for which you want
to mask the alarms.
Each port has a respective check box. When the check box is checked, you
are selecting a port alarm to be masked and vice versa.
3. To select all check boxes, click <Select All> to select all check boxes.
4. To clear all check boxes, click <Clear All>.
5. Do one of the following:
Click <Set> to implement the updated list of masks.
Click <Cancel> to exit the Mask Alarms window or click <Refresh> to
display an updated Mask Alarms window.
7-10
Handling Alarms and Traps
Optimux-34 Ver. 2.81
User’s Manual
Note
Chapter 7 Fault Management
1. For each inactive port, its check box is disabled. The value displayed in the
check box will be the last configured value.
2. The Remote Connection Fail is an alarm in System level. It exists only for Local
devices.
3. The bit order defined above is independent on the existence of the USER-ETH
port and/or a second link. That is, the bit order is permanent.
7.3
Managing Port Alarms
RADview/TDM allows you to manage Optimux-34 port alarms for selected ports
including:
•
E1 channel: RADview/TDM Optimux-34 has 16 E1 ports: (Ports 1 to 8 above
and Ports 9 to 16 below) on each Local/Remote unit.
•
E3 (Link: RADview/TDM Optimux-34 has two Link ports (ports A and B) on
each Local/Remote unit.
•
MNG-ETH: RADview/TDM Optimux-34 has one MNG-ETH port on each
Local/Remote unit.
•
USER-ETH: RADview/TDM Optimux-34 has one USER-ETH port on each
Local/Remote unit.
•
V.35: RADview/TDM Optimux-34 has one V.35 port on each Local/Remote
unit.
Viewing Port Alarms
RADview/TDM Optimux-34 allows you to view a list of current Optimux-34 port
alarms, their codes and severities.
To view port alarms:
1. In the Optimux-34 View window, select the relevant E1 (ports 1-16), V.35,
Link (A or B), or Ethernet (MNG-ETH or USER-ETH) port in the local or remote
unit.
2. On the menu bar, click Fault > Alarms (see Figure 7-7).
Note that the sub-menu changes according to the selected item.
Figure 7-7. Fault Menu – Port Level
The relevant Port Alarms dialog box appears, displaying whether the port
alarm is masked (in the Mask field), and lists the current port alarms,
codes, and severities.
Optimux-34 Ver. 2.81
Managing Port Alarms
7-11
Chapter 7 Fault Management
User’s Manual
Figure 7-8. E1 Port Alarms Dialog Box
7-12
Managing Port Alarms
Optimux-34 Ver. 2.81
User’s Manual
Chapter 7 Fault Management
Figure 7-9. Link Port Alarms Dialog Box
Optimux-34 Ver. 2.81
Managing Port Alarms
7-13
Chapter 7 Fault Management
User’s Manual
Figure 7-10. USER-ETH Port Alarms Dialog Box
3. You can do one of the following:
To send the active alarms to a printer, click <Print>.
To save the active alarms to a desired file, click <Save File>, then drill
down to the required file location on your computer and click <Save>.
To update the list, click <Refresh> or exit the window by clicking <Close>.
7-14
Managing Port Alarms
Optimux-34 Ver. 2.81
User’s Manual
Chapter 7 Fault Management
Table 7-6. Port Alarms Dialog Box Parameters
Parameter
Possible Values / Remarks
Code
The code for the specific alarm.
1…40
Read-Only
Description
The description of the alarm corresponding to the specified code.
Read-Only
Severity
The alarm severity.
Major
Minor
Read-Only
e
Figure 7-11. USER-ETH Port Alarms Dialog Box
Optimux-34 Ver. 2.81
Managing Port Alarms
7-15
Chapter 7 Fault Management
User’s Manual
4. You can do one of the following:
To send the active alarms to a printer, click <Print>.
To save the active alarms to a desired file, click <Save File>, then drill
down to the required file location on your computer and click <Save>.
To update the list, click <Refresh> or exit the window by clicking <Close>.
7.4
Performing Loopback Tests
Optimux-34 allows you to run local and remote diagnostic loopback testing for
ports.
Monitoring performance in the Optimux-34 consists of performing diagnostics or
loopback tests. You can perform loopback tests on Optimux-34 ports.
The Diagnostics menu provides access to the port level diagnostic test options.
You can run loopback tests for the following types of ports:
•
E1 channel
•
Link
•
V.35.
Figure 7-12. Port Level Diagnostics Menu
The Loopback Test command enables you to:
•
View all loopback tests that are currently running on the local and remote
devices
•
Run a loopback test on a link.
You cannot run:
•
A loopback test on a channel if a loopback test is already running on a link
•
A loopback test on a link if a loopback test is already running on a channel
•
A remote loopback test on a channel if a remote loopback test is already
running at the opposite end of the channel.
To run a loopback test:
1. In the Optimux-34 window, select the relevant (E1. Link, or V.35) port on the
local or remote device.
2. On the menu bar, click Diagnostics > Loopback Test.
The Loopback dialog box appears, showing the current loopback status of
the selected port.
7-16
Performing Loopback Tests
Optimux-34 Ver. 2.81
User’s Manual
Chapter 7 Fault Management
Figure 7-13. Channel Loopback Test Dialog Box
3. In the Select Test drop down list, select the type of loopback test you want
to run.
Figure 7-14. Link Loopback Test Dialog Box
4. In the Test Duration field, type the test duration time (in minutes).
5. Click <Apply> to begin the loopback test on the port.
The new loopback status of the port appears in the dialog box.
This dialog will be updated by traps and polling while it is open.
Only one loopback test at a time may exist on a specified port. Therefore,
if a loopback test is already running on a specific port, you can select only
No Loopback for this port.
If the Administrative Status of the selected port is down, then no
loopback will be available. A message will be displayed at the status bar
saying “Diagnostics are not available for interface that its Administrative
Status is Down.”
Upon clicking <Apply>, the NMS checks if the value of Test Duration is
within the valid range. If not, the following message will be displayed on
Status Bar: "Test Duration (min.) value should be between 1 and 255"
and the operation will not be performed.
6. Click <Close> to close the Port Loopback Test dialog box.
Optimux-34 Ver. 2.81
Performing Loopback Tests
7-17
Chapter 7 Fault Management
7-18
Performing Loopback Tests
User’s Manual
Optimux-34 Ver. 2.81
Index
—A—
Access
authorization, 6-1
management, 6-3
permission, 6-1
Telnet, 6-3
Web, 6-3
Administrator, 6-1
Agent
configuration, 4-14, 5-1
polling, 4-14, 5-1
status, 2-11
AIS
link A, 2-9
link B, 2-9
Alarm
active, 7-4
buffer, 7-8
code, 7-6
connector, 2-9
date, 7-8
history, 7-6
management, 7-1
mask, 7-9
severity, 7-15
slot, 7-8
system, 7-1
time, 7-8
unmasked, 7-6
Alarms
active, 7-2
Alarms and Events, 7-2
AIS, 7-2
PS1 failure, 7-2
PS2 failure, 7-2
redundancy not available, 7-2
remote connection fail, 7-2
signal loss, 7-2
Application
backbone data network, 4-1
E1 fan-out over satellite link, 4-2
Autonegotiation, 3-9, 4-9
—B—
Balanced, 3-12, 4-12
Bar
main menu, 2-3
title, 2-3
BNC, 2-8
—C—
Channel
Optimux-34 Ver. 2.81
E1, 1-1
Channel parameters
configuring, 3-11, 4-11
Clock source, 3-5, 4-6
Coding
line, 3-14, 4-14
Configuration
port level, 3-6
SNMP, 6-1
system, 3-1
system level, 3-1
Connector
coax, 3-14, 4-14
fiber, 3-14, 4-14
RJ-45, 3-12, 4-12
type, 3-12, 4-12
Control, 2-8
—D—
DB9, 2-8
Device
local, 3-3
remote, 3-3
Device level
configuration, 3-6
Diagnostics
link level, 7-16
Discovery, 2-7
—E—
E1
channel, 1-1
pop-up menu map, 2-6
port, 1-2
port parameters, 3-5, 3-11, 4-11
toolbar, 2-3
E3
pop-up menu map, 2-6
toolbar, 2-3
E3 Link
port, 1-2
port parameters, 3-6, 3-13
Ethernet
mode, 3-9, 4-9
port parameters, 3-6
—F—
Fault
management, 7-1
Faults
system level, 7-1
Flow control, 3-9, 4-9
I-1
Index
FOM, 4-1
—G—
Gateway
default, 3-3, 4-4
Graphical User Interface (GUI)
using, 2-2
view window, 2-2
—H—
Hardware
configuration, 3-16
reset, 3-16, 4-15
History
log, 7-6
—I—
Index, 3-15
Indicators, 2-9
Interface
balanced, 3-12, 4-12
type, 3-12, 4-12
unbalanced, 3-12, 4-12
Introduction, 1-1
—L—
Launching
RADview/TDM Optimux-34, 2-1
LEDs, 2-7, 2-12
agent status, 2-10
color, 2-9
E1, 2-10
E3, 2-10
indicators, 2-9
MNG-ETH, 2-10
power supply, 2-11
status, 2-9
User-ETH, 2-10
Level
port, 1-2
system, 1-2
Link, 2-7
active, 3-5, 4-5
E3, 1-1
loopback test, 7-16
parameters, 4-12
port parameters, 4-13
Link A
AIS, 2-9
sync loss, 2-9
Link B
AIS, 2-9
sync loss, 2-9
Link level
diagnostics, 7-16
Loopback
status, 7-16
tests, 7-16
Loopback test, 7-16
link, 7-16
I-2
User’s Manual
—M—
Main menu
bar, 2-3
Management
access, 6-3
alarm, 7-1
fault, 7-1
network, 2-1, 3-1
security, 6-1
station, 2-1, 4-7, 6-1
Mask
alarms, 7-9
Menu map
E1, 2-6
E3, 2-6
MNG-ETH/USER-ETH, 2-6
system level, 2-5
V.35, 2-6
MNG-ETH
pop-up menu map, 2-7
port, 1-2
port parameters, 3-6
toolbar, 2-3
MNG-ETH/USER-ETH
menu map, 2-6
Mode
Ethernet, 3-9, 4-9
redundancy, 3-5, 4-5
Module
virtual, 2-7
Monitor, 6-1
user, 6-1
—N—
Network
management, 2-1, 3-1
—O—
Object ID, 3-2, 4-3
Operational parameters
configuring, 3-5
Operator, 6-1
Overview
Optimux-34, 1-1
—P—
Parameters
E1 channel, 3-11, 4-11
E1 port, 3-5
operational, 3-5
system, 3-1, 4-2, 4-4
V.35 port, 3-10, 4-10
Password
changing, 4-14
Permission
access, 6-1
Polling, 2-4
agent, 4-14, 5-1
automatic, 5-1
manual, 5-1
status, 5-1
Pop-up menu map
system level, 2-6
Optimux-34 Ver. 2.81
User’s Manual
Port
alarms, 7-1
E1, 1-2
E3, 1-2
inactive, 7-11
level, 1-2
links, 2-7
MNG-ETH, 1-2
operations, 3-6
parameters, 3-6, 4-7
selecting, 2-8
status, 3-9, 4-9
type, 3-12, 4-12
Port Alarms
managing, 7-11
vewing, 7-11
Port level
configuration, 3-6
Port status
LEDs, 2-9
Power supply, 3-4, 4-5
backup, 3-4, 4-5
—R—
Rate, 3-9, 4-9
limitation, 3-9, 4-9
Redundancy
mode, 3-5, 4-5
Refresh, 3-15
Reset, 2-4
hardware, 3-16
system, 3-16
RJ-45, 2-8, 3-12, 4-12
—S—
Security
feature, 6-1
management, 4-14
Severity, 7-6
SFP, 2-8, 3-14, 4-14
Slots, 2-7
SNMP
configuration, 6-1
configuring, 4-6
Speed, 3-15
Station
management, 2-1, 4-7
Status
administrative, 3-12, 4-12, 7-17
autonegotiation, 3-9, 4-9
Sync loss
link A, 2-9
link B, 2-9
System, 2-4
alarm buffer, 7-6
alarms, 7-2
configuration, 3-1
information, 3-1
interfaces, 3-14
level, 1-2
managing alarms, 7-1
parameters, 3-3, 4-4
reset, 3-16, 4-15
selecting, 2-7
Optimux-34 Ver. 2.81
Index
System information
configuring, 3-1, 4-2
System level
configuration, 3-1
faults, 7-1
menu map, 2-5
pop-up menu map, 2-6
—T—
Task
port level, 1-2
system level, 1-2
Technician, 6-1
Telnet
access, 6-3
Test
loopback, 7-1
Testing
link, 7-16
Title
bar, 2-3
Toolbar
E1, 2-3
E3, 2-3
MNG-ETH, 2-3
system level, 2-3
User-ETH, 2-3
Traps, 6-1
—U—
Unbalanced, 3-12, 4-12
Uplinks, 2-9
User
adding, 4-14
administrator, 6-1
monitor, 6-1
operator, 6-1
technician, 6-1
User name
changing, 4-14
User-ETH
port, 3-12, 4-10, 4-12
toolbar, 2-3
USER-ETH, 7-11
port parameters, 3-6
—V—
V.35
pop-up menu map, 2-6
port parameters, 3-10, 4-10
V.35 port parameters
configuring, 3-10, 4-10
View window
local device, 2-3
main menu bar, 2-3
Optimux-34, 2-2
remote device, 2-3
status bar, 2-3
title bar, 2-3
toolbar, 2-3
Virtual modules, 2-7
I-3
Index
—W—
I-4
User’s Manual
Web
access, 6-3
Optimux-34 Ver. 2.81