1
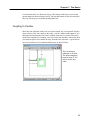
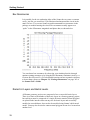
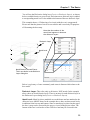
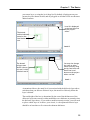
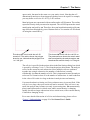
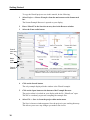
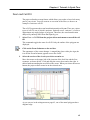
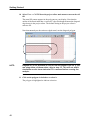
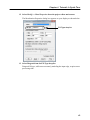
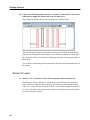
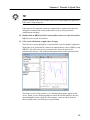
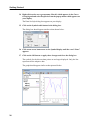
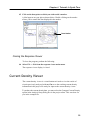
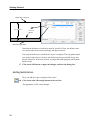
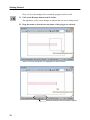
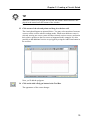
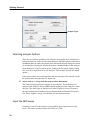
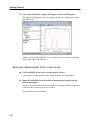
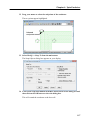
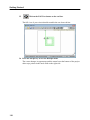
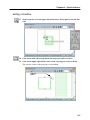
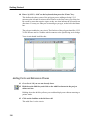
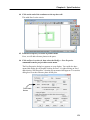
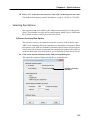
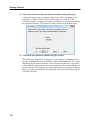
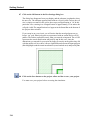
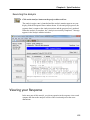
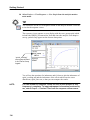
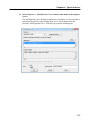
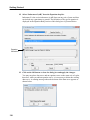
Chapter 4 Tutorial: A Quick Tour Displaying a Smith Chart 28 Change the plot to a Smith Chart by selecting Graph Type Smith from the response viewer main menu. The plot is changed to a Smith chart of “filtwall.son” which appears on your display. Again, the curve group filtwall with the [S11] curve is displayed. This curve group is the default displayed upon startup. TIP You can right-click on most parts of the response viewer window to invoke popup menus. For example, right clicking in the plot window and selecting Type Smith from the pop-up window also displays a Smith Chart. Selecting Another Curve for Display You may display multiple curves from multiple files simultaneously. Curve groups contain one or more measurements. To add a different measurement for display in a curve group, perform the following. 29 Select Graph Type Cartesian from the main menu. This changes the plot back to a Cartesian graph. 53