1
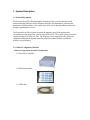
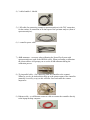
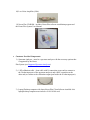
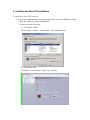
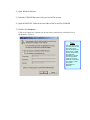
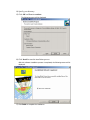
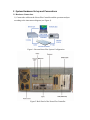
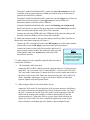
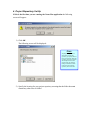
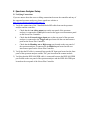
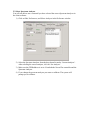
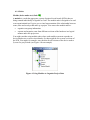
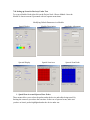
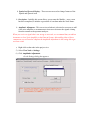
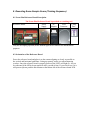
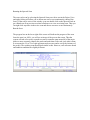
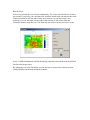
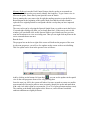
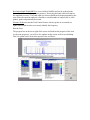
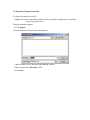
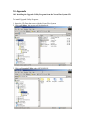
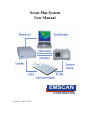
Nexus Plus System User Manual EMSCAN CORPORATION Version 2.1 July 25, 2007 Table of Content 1. System Description ......................................................................................................... 4 1.1 General Description ................................................................................................ 4 1.2 Cable & Component Checklist ............................................................................... 4 2. Installing the Nexus Plus Software ................................................................................. 7 3. System Hardware Set up and Connections ................................................................... 13 3.1 Hardware Connections.......................................................................................... 13 3.2 Client to Controller Connection............................................................................ 15 4. Project Repository Set Up............................................................................................. 18 5. Spectrum Analyzer Setup ............................................................................................. 20 5.1 Verifying Connections .......................................................................................... 20 5.2 Select Spectrum Analyzer..................................................................................... 21 5.3 Calibrating the System.......................................................................................... 22 6. Setting up a Project ....................................................................................................... 23 6.1 Starting a New Project .......................................................................................... 23 6.1.1 Project Hierarchies....................................................................................... 23 6.1.2 Project Setup ................................................................................................ 24 6.1.3 Projects......................................................................................................... 25 6.1.4 Nodes ........................................................................................................... 26 7. Executing scans............................................................................................................. 27 7.1 Spatial Scan........................................................................................................... 27 7.1.1 Spatial Overlay............................................................................................. 27 7.2 Spectral Scan......................................................................................................... 29 7.3 Spectral/Spatial Scan ............................................................................................ 30 7.4 Spectral/Spatial Scripting Module ........................................................................ 30 7.5 Note....................................................................................................................... 31 7.6 Spectral Comparison............................................................................................. 31 7.7 Spatial Comparison............................................................................................... 31 7.8 Spectral Overlay.................................................................................................... 32 7.9 Report Generator................................................................................................... 32 7.10 Setting up Scans for Device(s) Under Test......................................................... 33 8. Executing Some Sample Scans (Training Sequence) ................................................... 35 8.1 Nexus Plus Reference Board Descriptions ........................................................... 35 8.2 Orientation of the Reference Board ...................................................................... 35 8.3 Executing a Spectral Scan..................................................................................... 36 8.4 Executing a Spatial Scan....................................................................................... 38 8.5 Executing a Spectral/Spatial Scan ........................................................................ 40 8.6 Spectral Spatial Scripting Module ........................................................................ 42 8.7 Composite Spectral ............................................................................................... 44 8.8 Composite Spatial ................................................................................................. 44 8.9 User Composite Spatial......................................................................................... 45 8.10 Comparisons ....................................................................................................... 46 8.11 Add Report Generator......................................................................................... 48 9. Measurement TIPS........................................................................................................ 49 9.1 Measuring a DUT of unknown a priori (EMC/RFI) performance........................ 49 9.2 Exporting Captured Scan Data.............................................................................. 50 9.3 Scanning your Printed Circuit Packs .................................................................... 51 10. Appendix..................................................................................................................... 53 10.1 Installing the Upgrade Utility Program from the Nexus Plus System CD ......... 53 10.2 Frequently Asked Questions (FAQ) ................................................................... 57 10.3 Interpreting Error Messages................................................................................ 59 CONTACT INFORMATION Emscan Corporation 1, 1715 27th Avenue N.E. Calgary, Alberta, Canada T2E 7E1 Toll Free (North America Only): 1-877-367-2261 Tel: 403-291-0313 Fax: 403-250-8786 Website: www.emscan.com President: David Gregory Office: 403-291-0313 Ext:241 Cell Phone: 250-701-2167 Email: [email protected] North American Sales: Jonathan Voon – Senior Sales Engineer Office: 403-291-0313 Ext:270 Cell Phone: 403-998-8827 Email: [email protected] Technical Support: Ian Nguyen – Technical Support Office: 403-291-0313 Ext: 263 Cell Phone: 403-616-2458 Email: [email protected] 1. System Description 1.1 General Description The Emscan Nexus Plus Electromagnetic Scanning System provides designers with measurement and software tools to diagnose and solve electromagnetic emission and interference (EMI) problems. Our system tools allow you to detect problems and lead to insights regarding their sources. The Emscan Nexus Plus System measures the magnetic near-fields generated by circulating (or point source) RF currents on a PCB or PCP. The system operates over the frequency range of 50 kHz to 4 GHz. The frequency range supported in any particular equipment configuration depends upon the particular scanner module used and the software keys purchased. 1.2 Cable & Component Checklist Emscan Corporation Provided Components: 1) Nexus Plus Controller 2) ISM Scanner tablet 3) GPIB cable 4) 3 cables bundled – labeled 5) 1 RF cable (for connecting scanner to spectrum analyzer) with TNC connection for the scanner, N connection at 50 ohm input of the spectrum analyzer (front of spectrum analyzer). 6) 1 controller power cable 7) 40dB attenuator – necessary when calibrating the Nexus Plus System with spectrum analyzers (such as the HP8560 series). When performing a calibration the client software will prompt you to use the 40 dB attenuator during the calibration process. 8) 25 pin parallel cable – (for connecting from the controller to the scanner). Whatever you do, do not hook this cable up to the printer output of the controller (normally covered by a cap) as this will blow fuses and render the scanner inoperative. 9) Ethernet cable – a red Ethernet crossover cable to connect the controller directly to the laptop/desktop computer. 10) Low Noise Amplifier (LNA) 11) Nexus Plus CD-ROM – includes Nexus Plus software installation program and the Nexus Plus System User Manual. • Customer Provided Components 1) Spectrum Analyzer – must be a spectrum analyzer with the necessary options that is supported by the Nexus Plus System (see Supported Spectrum Analyzers). 2) 1 RF calibration cable – short cable with N connection at one end (to connect to the 50 ohm input port of the spectrum analyzer) and a BNC connection at the other end (to connect to the calibration output port beside the 50 ohm input port). 3) Laptop/Desktop computer with latest Nexus Plus Client Software installed– this laptop/desktop computer must include a LAN 10/100 card. 2. Installing the Nexus Plus Software To install your Nexus Plus software: 1) Log on as an administrative user with permission to write to the Windows registry (verify this with your system administrator). To verify the status of the user: a) For Windows 2000: Click on Start – Setting – Control Panel – Users and Password. b) For Windows XP: Click Start – Control Panel – Check User Account 2) Open Windows Explorer. 3) Insert the CD-ROM that came with your Nexus Plus system. 4) Open the INSTALL folder in the root folder of the Nexus Plus CD-ROM. 5) Double-click Setup.exe. If this screen appears, it means you do not have permission to read and write to the Windows registry: Note: This screen is the result of an issue with the thirdparty utility used to generate the Nexus Plus Setup.exe file. It is not an issue with the Nexus Plus application. Permission to read and write to the Windows registry is required to install and run the Nexus Plus software. Contact your system administrator for assistance. 6) Click OK and contact your system administrator for assistance. If this screen appears, you can continue with the installation: 7) Click Next to continue. The following screen will be displayed: 8) Click Next to continue. The following screen will be displayed: 9) Scroll down the page to read the entire agreement. 10) Select I accept the terms in the license agreement and click Next to continue. The following screen will be displayed: 11) Enter your name and company in the required fields and click Next to continue. The following screen will be displayed: 12) Click Next to accept the default directory as your installation directory. Or: 13) Click Change to identify a different directory. If you have chosen to identify a different directory and the following screen will be displayed: 14) Specify your directory. 15) Click OK and Next to continue. The following screen will be displayed: 16) Click Install to start the installation process. After the software installation process is completed, the following screen will be displayed: 17) Click Finish to complete the installation. 3. System Hardware Set up and Connections 3.1 Hardware Connections 1). Connect the cables on the Nexus Plus Controller and the spectrum analyzer according to the interconnect diagram (see Figure 1). Figure 1: Emscan Nexus Plus System Configuration Figure 2 Back Panel of the Nexus Plus Controller - Using the 3 bundled and labelled cable, connect the Aux video output port on the rear panel of the spectrum analyzer to video port located on the rear interconnect panel on the Nexus Plus Controller. - Using the 3 bundled and labelled cable, connect the external trigger port on the rear panel of the spectrum analyzer to the trigger out port located on the rear interconnect panel on the Nexus Plus Controller. - Using the3 bundled and labelled cable, connect the blanking out or high sweep port located on the rear panel of the spectrum analyzer to the blank in port located on the rear interconnect panel on the Nexus Plus Controller. - Connect one end of the GPIB cable to the GPIB port of the spectrum analyzer and the other end to the GPIB port on the Nexus Plus Controller. 2). Attach the scanner module to the spectrum analyzer and Nexus Plus Controller as shown in the interconnect diagram (see Figure 1). - Connect the TNC end of the RF cable to the RF Output port of the scanner module and the other end to the RF Input port (front) of the spectrum analyzer. - Connect the female (socket) end of the parallel cable to the 25pin port on the scanner module and connect the male (pin) end of the parallel cable to the scanner port at the back of the Nexus Plus Controller. 2.1) when using a low noise amplifier (optional) make sure that it is connected as follows: a. Note: It is recommended that you use a surge suppresser on the power connection for the Emscan Nexus Plus system to avoid any damage to equipment or loss of data in the event of a power surge. HF Instruments LNA (blue box) connect the RF N to BNC cable between the spectrum analyzer 50 ohm input port to the BNC ‘out’ port on the LNA. Connect the BNC ‘in’ port on the LNA to the TNC port on the scanner board. Connect the LNA to a power outlet and switch on the power switch on the LNA. Make sure that you register the value of the LNA in the ‘Amplitude Adjustment’ set up of your Project, Module or individual Spectral, Spatial or Spectral/Spatial Scans. b. When using the Mitec LNA (small in-line device): connect the LNA to the 50 ohm input port of the spectrum analyzer (should have an N male connection or be adapted to an N male connection on the ‘out’ end of the LNA). Connect the ‘in end of the LNA to the N male connection of the RF cable from the scanner (that normally would be connected directly into the spectrum analyzer). Connect the LNA to a power outlet. Make sure that you register the value of the LNA in the ‘Amplitude Adjustment’ set up of your Project, Module or individual Spectral, Spatial or Spectral/Spatial Scans. 3). Plug in and power up all devices in the Emscan Nexus Plus system in the following order: - First, turn on the Nexus Plus controller, you will hear a “Beep” from the controller indicating that it has booted properly. - Second, turn on the Spectrum Analyzer. 3.2 Client to Controller Connection. There are two options: a direct connection or a networked (LAN based) connection Direct Client Connection The Controller is preconfigured with a start up default IP address of 172.16.1.148 - The client IP address must be set up as follows (for Windows 2000): • • Set the network configuration of the Client Work Station (follow steps below) o Click Start, Settings, Network and Dial up connection o Double click on Local Area Connection o Select Properties o Double click on the Internet Protocol (TCP/IP) o Click on Use the following IP address o Set the IP Address to: 172.16.1.99 o Set the Subnet Mask Address to: 255.255.0.0 o Set Gateway Address to Default o Click OK to accept the changes and select OK again to finish network configuration of the Client Workstation Close any open windows on your desktop - The client IP address must be set up as follows (for Windows XP): • • Set the network configuration of the Client Work Station (follow steps below) o Click Start, and control panel, Network connections o Double click on Local Area Connection o Click on Properties o Double click on the Internet Protocol (TCP/IP) o Select use the following IP address o Set the IP Address to: 172.16.1.99 o Set the Subnet Mask Address to: 255.255.0.0 o Set Gateway Address to Default o Click OK to accept the changes and select OK again to finish network configuration of the Client Workstation Close any open windows on your desktop Networked Client Connection (the other connection choice) The currently designed controller can not acquire an IP address dynamically from a DHCP server. Therefore it must be assigned a static IP address in the DHCP server. This assignment will likely be made by the Network Administrator. Once this static IP address is assigned, the default IP address in the controller must be modified. Changes (or the need for changes) in the Client are dependant upon the previous network configuration programmed. In addition the new IP address of the controller must be registered with the client - Verify (or reset) the Network Configuration of the Client (for Windows 2000): • Reset the network configuration of the Client Work Station (follow steps below) o Click Start, Settings, Network and Dial up connection o Double click on Local Area Connection o Click Properties o Double click on the Internet Protocol (TCP/IP) o Select Obtain an IP address automatically o Click OK to accept the changes and select OK again to finish network configuration of the Client Workstation - Verify (or reset) the Network Configuration of the Client (for Windows XP): • Reset the network configuration of the Client Work Station (follow steps below) o Click Start, and Control Panel, Settings, Network and Dial up connection o Double click on Network Connection and Local Area Connection o Click on Properties o Double click on the Internet Protocol (TCP/IP) o Select Obtain an IP address automatically o Click OK to accept the changes and select OK again to finish network configuration of the Client Workstation To change the default IP address of the Controller the Nexus Plus Upgrade Utility is used. Do the following to change the controller’s default IP address: • Install the Upgrade Utility Program from the Nexus Plus System CD • • Installation process of Upgrade Utility Program (see Appendix 9.1) Connect the Crossover Ethernet cable from the Ethernet port on the Customer Workstation directly to the Ethernet Port on the Nexus Controller Make sure that the Workstation is configured for direct client connection. (see section 3.2) Power up the Nexus Controller Start all program Emscan Upgrade Utility • • • • • • • • • • • Enter IP Address 172.16.1.148 in the controller IP Address and click the Connect Button to connect to the Nexus Controller. The Set button under configuration will become enabled Change the IP Address, Gateway and Net Mask under IP configuration to the Static IP Address that your Network Administrator has assigned for the controller Click Set Button to send these changes to the Nexus Controller. This should take about 5 seconds then the Nexus Controller will reboot by itself Close the Upgrade Utility program Close any open windows on your desktop Remove the cross over Ethernet Cable (orange color) You will require two straight Ethernet cables to connect the client workstation and the Nexus Plus controller to network hub Start up the Nexus Plus Program and change the IP Address in the Edit Preferences/IP Address to the Static IP address that your Network Administrator assigned for the controller 4. Project Repository Set Up If this is the first time you are running the Nexus Plus application the following screen will appear: 1) Click OK. The following screen will be displayed: Note: All project and preferences data will be stored in the repository you specify the first time you start Nexus Plus. This repository will now be used for all subsequent sessions and projects until you explicitly change. Performance will be improved if you locate the repository on the local disk 2) Specify the location for your project repository ensuring that the folder does not contain any other files or folders. 3) You can either select an existing folder or create a new folder - To create a new folder: Click New Folder. The following screen will be displayed: 4) Enter a new folder name (e.g. Nexus Plus Data) and click OK. The Nexus Plus main window will be displayed and you can start using the system 5. Spectrum Analyzer Setup 5.1 Verifying Connections If you are unsure about the correct cabling connections between the controller and any of the supported spectrum analyzers, please consult our website at http://www.emscan.com/index.php?page=27 1) Verify the connections of the 3 bundled labeled RF cables between the spectrum analyzer and the controller: a. Check that the Aux video output port on the rear panel of the spectrum analyzer is connected to Video port located on the upper rear interconnect panel on the Nexus Plus Controller. b. Check that the External trigger input port on the rear panel of the spectrum analyzer is connected to the Trigger out port located on the rear interconnect panel on the Nexus Plus Controller. c. Check that the Blanking out or High sweep port located on the rear panel of the spectrum analyzer is connected to the Blank in port located on the rear interconnect panel on the Nexus Plus Controller. 2) Verify that the RF cable is connected between the RF Input port located on the front panel of the spectrum analyzer and the TNC port located on the scanner module. 3) Verifying that the IEEE-488 GPIB cable: is connected between the IEEE-488 GPIB port located on the rear panel of the spectrum analyzer and the IEEE-488 GPIB port located on the rear panel of the Nexus Plus Controller. 5.2 Select Spectrum Analyzer You will not able to run a scan until you have selected the correct Spectrum Analyzer in the client software: 1) Click on Edit, Preferences, and Select Analyzer in the Preference window 2) Select the Spectrum Analyzer from the drop down list under ‘Current Analyzer’. After selecting the correct analyzer, click on ‘Set Analyzer’. 3) Make sure the GPIB address is set to 18 on both the Nexus Plus controller and the Spectrum Analyzer. 4) If you change the spectrum analyzer you must re-calibrate. The system will prompt you to calibrate. 5.3 Calibrating the System 1) To calibrate, disconnect the RF cable from the scanner and connect the TNC end (in some models it is a BNC) to the Cal Out port (beside the 50 ohm input port) on the front of most spectrum analyzers with the other end still connected to the 50 ohm input port of the spectrum analyzer. Click on set analyzer. Watch the spectrum analyzer display; it should step up from the bottom until you have a flat line at the top of the screen. Some spectrum analyzers internally calibrate without the need to connect the cal out port to the 50 ohm input port (if there is no cal out port this is the case). Please check our website for connections of all supported spectrum analyzers http://www.emscan.com/index.php?page=27. 2) Disconnect the RF cable from the Cal Out port and reconnect to the scanner before scanning (this is very important – if you forget to do this – processed scanning data will be incorrect). When calibrating the system, listen for the clicking sound from the Spectrum Analyzer. This indicates there is communication with the controller, and the Spectrum Analyzer screen setting has changed. Watch for a horizontal line that starts roughly at the second line from the bottom of the screen and stair-steps up to the top right. An abnormal calibration may result a horizontal line that starts at the bottom of the screen then jumps to the top or does not move. 6. Setting up a Project 6.1 Starting a New Project 6.1.1 Project Hierarchies The Client Software file hierarchy is important as you are allowed to set preferences in projects, and subsequent nodes (modules and scans, comparisons…) that are inherited by subsequent scan settings. All modules and scans are called nodes. You can add different types of nodes to the project tree, each with a different purpose. The Nexus Plus Project Hierarchy is organized as a set of nodes at different levels in the hierarchy: Project (aggregation or related data) - Module Node (Device Under Test - DUT): the Module node is optional and is normally used when multiple DUTs are involved - Scan Node (e.g. Spatial, Spectral, Spectral/Spatial) - Comparison Node (e.g. Spectral Comparison, Spatial Comparison, Spectral Overlay) Notes Node & some other nodes (Spectral/Spatial Scripting Module, and Report Generator) can be added at any level. 6.1.2 Project Setup 1). Start Nexus Plus. From the Nexus Plus main window do one of: 2). Click File-New Project. Or: Press <CTRL> + <n>. Or; Click on the menu bar. When this window appears; 3). Enter a project name in the text field. 4). Click OK. 5). The following Hint Window will appear, Click OK for now. The Spectral/Spatial Scripting Module will be described in more detail later. 6.1.3 Projects Projects are used to organize the data that accumulates when testing a printed circuit board (PCB) or module (group of PCBs). Project information can include: - scan data - comparisons of scan data - printed circuit board representations that can be overlaid on spatial views of scan data - textual notes that annotate scan data information Projects are displayed in a tree structure (see Figure 3) similar to the directory tree used in Windows Explorer. Figure 3 A Project Tree 6.1.4 Nodes Module (device under test) Node A module is a node that aggregates a group of printed circuit boards (PCBs) that are being scanned individually or together as a unit. The module node is designed to be used as an organizational tool. It gives you a visual representation of the relationship between scans, notes and overlays that make up a project. You can use the module node to: • organize scan group information • separate and organize scans from different revisions of the hardware in a logical manner under one project tree You might consider using module nodes where each module represents a product or device that has two or more circuit boards. Or, there might be two or more revisions of the PCB. You might, for example, store the data for all revisions of the device under a System One project node (see Figure 4 for an example). Figure 4: Using Modules to Organize Project Data 7. Executing scans 7.1 Spatial Scan A spatial scan measures the magnetic field of radiated electromagnetic emissions from the DUT at a single frequency as a function of position. The spatial node contains all the information necessary to: • perform spatial scans • display spatial scans It can exist as part of a project, as sub-section of a module node. You can override any of the inherited display parameters to any of the following: • grid lines showing the cell boundaries • colour spectrum • display units • manual or auto scaling of displayed data • overlay to be used • interpolation, i.e., degree of data smoothing in the image These features are available on the Spatial Display page of View Node-Settings dialogue. 7.1.1 Spatial Overlay Spatial overlay is a graphical image of the device under test that can be superimposed onto a spatial scan to help determine the actual physical sources of signal emission. Often this graphical image is a circuit board layout. The spatial overlay node allows you to place the PCB layout over spatial data acquired by Nexus Plus System. Using the spatial overlay node, you can: • correlate spatial features in scan data with physical components and locations on a PCB • invoke the built-in overlay viewer to: import an HPGL file, which EMSCAN IV saves as a representation inside the overlay node and recalls whenever the viewer is invoked rotate, mirror, translate and scale overlays to a desired position and size The location of spatial overlay nodes in the project tree with respect to spatial nodes determines which overlay Nexus Plus System will display. You can move overlay nodes to different locations to select which overlay applies. This allows you to specify how you want to have spatial overlays displayed by Nexus Plus System, including: • • • one overlay for a single spatial node one overlay for many spatial nodes a single overlay for an entire project Note: A link between nodes is a special representation that does not contain any data itself. It is only a placeholder. All changes made to the display or scan settings are actually performed on the original node. Unlinked placeholder children have grey icons. Linked placeholder children have coloured icons. If you have a Gerber or HPGL file, it is a good idea to import the overlay at this point and attach it as a sub node to the Module. This way it is visible in all Spatial Views (Spatial and Spectral/Spatial Scans) within the Module. The Gerber format that is acceptable to the Nexus Plus client software is the RS-274x standard Gerber format. The extension is not important. HPGL files are also acceptable to Nexus Plus client software. HPGL2 files can not directly import into Nexus Plus client software. Please contact Emscan for conversion instructions. The method for importing a Gerber file or an HPGL file is as follows: Right click on the Module and choose - Add Node, choose Spatial Overlay, name the Spatial Overlay (ie top, bottom, ground plane, power plane etc.). Adding the Spatial Overlay Node Naming the Node Go back into the Module (in the Project view) – double left click to see the Node Settings, then choose the Spatial Display window, uncheck the Grid From the Display Options, then left click on the Current Overlay button in the bottom left, then locate the Gerber or HPGL file. In the file folder where you put the reference board Gerber file after it was sent to you by email. Spatial Display Window Locate the Gerber or HPGL file Once the Gerber file is loaded (it is imported in actual size), it must be moved to the grid to correspond to placement of the board under test (mirror vertically or horizontally if necessary). 7.2 Spectral Scan Spectral scan samples a frequency spectrum from each selected cell in the scan area. The spectral node contains all the information necessary to: • perform spectral scans • display spectral scans It can exist as part of a project or as sub-section of a module node. You can override any of the inherited display parameters to any of the following: • grid lines showing what is displayed on the spectral amplitude versus frequency graph • display units • manual or auto scaling of frequency • manual or auto scaling of amplitude • display peak markers These features are available on the Spectral Display page of View Node-Settings dialogue 7.3 Spectral/Spatial Scan A spectral/Spatial scan measures the magnetic field of radiated electromagnetic emissions from an object as a function of both frequency and position. The spectral/spatial scan collects a series of spatial scans over the entire frequency range of interest as opposed to a spatial scan (which gathers data at single frequency) or a spectral scan (which saves only the composite data set). Using the viewers included in spectral/spatial nodes, you can: • view spectral data on a cell or group of cells • view spatial data at a single frequency or several different frequencies • link together data from the two views; i.e., any cell or collection of cells in a spatial view can be selected and the composite spectral can be displayed 7.4 Spectral/Spatial Scripting Module Emscan has developed the Spectral/Spatial Scripting Module so that any new user can begin scanning quickly and easily. This is also a very efficient way to process to configure and I initiate a number of consecutive scans The Spectral/Spatial Scripting module allows the user to gather all of the frequency, amplitude, location and time based activity for a device with a minimum of setup. The Spectral/Spatial Scripting Module can be invoked in two ways: • When a new project is opened, a screen appears asking the user if he wishes to begin a Scripting Module (Spectral/Spatial Scripting Module) The user can start the Spectral/Spatial Scripting Module by selecting the Spectral/Spatial Scripting Module option and click OK. • The Scripting Module can alternatively be involved by adding it as a node under a project or module 7.5 Note A note node allows you to enter textual observations into the Emscan Nexus Plus System as you run your scans. You can: • attach the note node to the scanning node to relate the notes to the specific scan they refer to • edit your notes 7.6 Spectral Comparison Spectral comparison is a quantitative comparison between two frequency spectra. It is generated by subtracting the values of one spectrum from the values of the second spectrum at each frequency. The spectral comparison node allows you to observe and compare two spectral scans with the same frequency and bandwidth at the same time. The spectral comparison node always has two child nodes. The two nodes of the spectral comparison: • act as placeholders for the two spectral scans that will be compared • cannot be moved or deleted • are linked to the spectral comparison and behave like a single object in the project tree • can be linked to spectral nodes elsewhere on the project tree • reflect immediately in the placeholder node any operation performed on the spectral scan that the placeholder is linked to 7.7 Spatial Comparison Spatial comparison is a quantitative comparison between two spatial scans that is generated by subtracting the values of one scan from the values of the second scan cell by cell. The spatial comparison node allows you to see the difference between two spatial scans with the same frequency. The spatial comparison node always has two spatial nodes: The two nodes of the spatial comparison: • act as placeholders for the two spatial scans that will be compared • cannot be moved or deleted • are linked to the spatial comparison and behave like a single object in the project tree • can be linked to spatial nodes elsewhere on the project tree • reflect immediately in the placeholder node any operation performed on the spatial scan that the placeholder is linked to 7.8 Spectral Overlay Spectral overlay is a qualitative comparison of two frequency spectra. It is generated by displaying one frequency spectrum over the other. The spectral overlay node allows you to view two spectral scans with the same frequency range and bandwidth at the same time. The spectral overlay node always has two child nodes. The two nodes of the spectral overlay: • act as placeholders for the two spectral scans that will be compared • cannot be moved or deleted • are linked to the spectral overlay and behave like a single object in the project tree • can be linked to spectral nodes elsewhere on the project tree so that any two spectral scans can be viewed simultaneously • reflect immediately in the placeholder node any operation performed on the spectral scan that the placeholder is linked to 7.9 Report Generator The Report Generator Node allows the user to generate standard scan reports by exporting the scans into Microsoft Word for Windows report template. 7.10 Setting up Scans for Device(s) Under Test To set up a Module Node right click on the Project Node. Choose Module. Once the Module is chosen a menu is presented with six separate menu items. Modifying Default Parameters in a Module Spatial Display Module Description Amplitude Adjustment Spectral Display Spatial Scan Area Spectral Scan Probe ¾ Spatial Scan Area and Spectral Scan Probes These menus allow you to select the probes under the device and cables being tested. By limiting the scan area you reduce the scan time. In the case of spectral scans, make sure you have at least 6 probes highlighted under the device under test ¾ Spatial and Spectral Display – These screens are used to change features of the Spatial and Spectral scan. ¾ Description – Initially this screen allows you to name the Module – once a scan has been completed, it includes a great deal of scan data under the Node Name. ¾ Amplitude Adjustment - This screen is used when it is desired or necessary to add a low noise amplifier or an attenuator to increase or decrease the signals coming from the scanner to the spectrum analyzer. When you receive a signal that is too strong or too weak, we recommend that you add an Attenuator or Low Noise Amplifier to the Emscan System. After adding either of these components you will need to complete the Amplitude Adjustment in the setting tab to get accurate result. 1) Right-click on the node in the project view. 5) Select View Node-> Settings. 6) Click Amplitude Adjustment. On the Settings dialog that appears: 8. Executing Some Sample Scans (Training Sequence) 8.1 Nexus Plus Reference Board Description The Nexus Plus Reference Board is provided as a training tool. Reference Board Power Supply AC Adaptor 9 Pin Connector 3 Amp Fuse Only the decoupling capacitor on the furthest right can be removed for demonstration purposes. 8.2 Orientation of the Reference Board Power the reference board and place it on the scanner aligning as closely as possible to the vertical and horizontal guidelines. Lining up squarely assists you when importing overlays. Once the reference board is properly powered, the LED’s will light up – do not be concerned if the LEDs do not remain lit after a period of time. If you wish to see if it is still powered please push the black button at the bottom left of the reference board PCB. 8.3 Executing a Spectral Scan To do a Spectral Scan go to the Project View. Highlight the Project or Module by left clicking the mouse then right click the mouse and choose Spectral Scan from the menu offered. Add a Spectral Node Spectral Menu The Spectral Menu appears - enter 10 (10.000 MHz) as the Start Frequency and 100 (100 MHz) as the Stop Frequency to identify the span of the Spectral Scan to be implemented. The Centre Frequency and span are set automatically. To scan the reference board no other input is required. Apply – (Always click on Apply after making a change and before exiting the screen). As a precaution, the system will beep if the cursor leaves the activity box prior to apply being activated. Click OK to exit the screen. Resolution Band Width (RBW) is set at a default 100 KHz and can be reduced to the lowest level allowed by the spectrum analyzer. Decreasing the band width will improve the amplitude accuracy. The band width you choose should not be disproportionate to the span. Span/RBW should be < 10,000 (10 KHz band width with a 100 MHz span, 100 KHz band width with a 1 GHz span). Since the spectrum analyzer is limited to a small number of outputs (400 to 1600 points), peaks can potentially be missed. Peak Hold: is a very important feature as it allows you to run a Spectral Scan continually replacing the peak amplitude at each location with each successive higher measurement. This is an excellent way to find the frequency of an intermittent or random signal. Measure Peaks: activates the Peak Control feature whereby peaks are rescanned at a tighter band width in order to accurately identify the frequency. Running the Spectral Scan The scan can be run by selecting the Spectral Scan you wish to run in the Project View and right clicking will allow you to choose run once or run continuously (choose Run Once). If the scan is active in the window (you can double click on the Spectral Node to get a blank scan if no previous scan has been done or to view an existing scan. Then you can right click anywhere in the active scan and choose run once or run continuously. Run the Scan The progress bar on the lower right of the screen will indicate the progress of the scan. Once the scan is at 100%, you will see an image of the scan on the screen. Then the system will take a few more seconds to rescan at a smaller span around all of the major peaks to more accurately identify the peaks and mark them with a red circle (this is done to overcome the 1% to 2% of span spectrum analyzer error and to verify the existence of the peaks). The resulting scan should look similar to this. However, each reference board and ambient conditions are slightly different. 8.4 Executing a Spatial Scan To set up a Spatial Scan that links with the information gathered by the above Spectral Scan, right click the Spectral Scan node in the Project View at the left of the screen. Left click to select Add Node then left click to select Spatial Scan. The following Spatial Menu screen appears. You can select a frequency from the pull down menu of the Peak Marker List or you can set the frequency manually. Add a Spatial Node Enter Center Frequency From Pull Down Menu Go to the Peak Marker List and choose a marked frequency. Choose the 11.067 MHz frequency by left clicking on the value in the pull down menu. This is the fundamental of the reference board (the frequency varies from meter to meter). The Centre Frequency will be set automatically to the chosen frequency. To scan the reference board no other input is required (we previously set the default parameters in the Module Node). Apply (Always click on Apply after making a change and before exiting the screen). As a precaution, the system will beep if the cursor leaves the activity box prior to Apply being activated. Click OK to exit the screen. Peak Hold is a very important feature as it allows you to run a Spatial Scan continually replacing the peak amplitude at each location with each successive higher measurement. This is an excellent way to find the location of an intermittent signal at a single frequency. Running the Spatial Scan The scan can be run by selecting the Spatial Scan you wish to run in the Project View and right clicking will allow you to choose run once or run continuously (choose Run Continuously). Run the Scan After a few seconds the scan will run continuously. The screen will refresh 4 to 10 times per second. If you wish, you could move the reference board to the side and see the result of the movement in real time (the overlay does not move as you have fixed it to a position). You can select the red stop sign in the icon bar or select Stop from the Controller Menu to stop the scan. You must stop one scan to run any successive scans. At the 11 MHz fundamental with the decoupling capacitor removed the scan should look similar to the image above. By sliding the Set Color Threshold, you can increase or decrease the contrast to more clearly identify current loops and peak locations. 8.5 Executing a Spectral/Spatial Scan Previously we used a Spectral Scan to detect the frequencies of interest then individual Spatial Scans to gather data about each frequency of interest. In a sweep that takes no longer than a Spectral Scan, a Spectral/Spatial Scan collects all of the frequency, amplitude and location data at the same time. This results in a large data base of information that can be manipulated. To set up a Spectral Spatial, Scan right clicks the Project View at the left of the screen. Left click on the Module then right click and select Add Node then left click to select Spectral Spatial Scan. The following Spectral Spatial Menu screen appears. Add a Spectral Spatial Node Enter Start and Stop Frequencies Enter 10 (10.000 MHz) as the Start Frequency and 100 (100 MHz) as the Stop Frequency to identify the span of the Spectral Scan to be implemented. The Centre Frequency will be set automatically as will the Span. To scan the reference board no other input is required (we previously set the default parameters in the Module Node). Apply (always click on Apply after making a change and before exiting the screen). As a precaution, the system will beep if the cursor leaves the activity box prior to Apply being activated. Click OK to exit the screen. Resolution Band Width (RBW) is set at a default 100 KHz and can be reduced to the lowest level allowed by the spectrum analyzer. Decreasing the band width will improve the amplitude accuracy. The band width you choose should not be disproportionate to the span. Since the spectrum analyzer is limited to a small number of outputs (400 to 1600 points), peaks can potentially be missed. Measure Peaks activates the Peak Control feature whereby peaks are rescanned at a tighter band width in order to accurately identify the frequency. To get a better view in between the peaks, Nexus Plus System provides zoom in feature. Prior to running the scan, remove the far right decoupling capacitor as per the Reference Board diagram at the beginning of this guide. Make sure that the reference board is replaced to its original position to correspond with the overlay that you have imported previously. The scan can be run by selecting the Spectral Spatial Scan you wish to run in the Project View and right clicking will allow you to choose Run Once. If the scan is active in the window (you can double click on the Spectral Node to get a blank scan if no previous scan has been done or to view an existing scan. Then you can right click anywhere in the active scan and choose run once. Run the Scan The progress bar on the lower right of the screen will indicate the progress of the scan. As the scan progresses, you will see live updates on the screen as the scan is building. This live update can be seen in the spectral view as follows: , you can see the updates in the spatial And by clicking on the bottom left icon above view as the scan progresses from cell to cell gathering data. Once the scan is at 100%, the system will take a few more seconds to rescan at a smaller span around all of the major peaks to more accurately identify the peaks and mark them with a red circle (this is done to overcome the 1% to 2% of span spectrum analyzer error). The resulting scan should look similar to this. However, each reference board and ambient conditions are slightly different. 8.6 Spectral Spatial Scripting Module To set up a Spectral Spatial Scripting Module, right clicks the Project View at the left of the screen. Left click on the Spectral Spatial Scripting Module. The following Spectral Spatial Menu screen appears. Add a Spectral Spatial Scripting Module Spectral Spatial Scripting Module Menu These menus allow you to select the probes under the device and cables being tested. By limiting the scan area you reduce the scan time. Enter 10 (10.000 MHz) as the Start Frequency and 100 (100 MHz) as the Stop Frequency to identify the span of the Spectral Scan to be implemented. To scan the reference board no other input is required. Click Apply (always click on Apply after making a change and before exiting the screen). As a precaution, the system will beep if the cursor leaves the activity box prior to Apply being activated. Click OK to exit the screen. Resolution Band Width (RBW) is set at a default 100 KHz and can be reduced to the lowest level allowed by the spectrum analyzer. Decreasing the band width will improve the amplitude accuracy. The band width you choose should not be disproportionate to the span. Since the spectrum analyzer is limited to a small number of outputs (400 to 1600 points), peaks can potentially be missed. Measure Peaks activates the Peak Control feature whereby peaks are rescanned at a tighter band width in order to accurately identify the frequency. Run the Scan The progress bar on the lower right of the screen will indicate the progress of the scan. As the scan progresses, you will see live updates on the screen as the scan is building. This live update can be seen in the spectral view as follows: 8.7 Composite Spectral The resulting scan is a Composite Spectral Scan as shown below. On the surface it looks like a normal Spectral Scan. However, the Composite Spectral Scan is a gateway to archived spatial data for each frequency. Composite Spectral View Composite Spatial View 8.8 Composite Spatial If you click upon the icon while in the Spectral Spatial Scan, a Composite Spatial View will appear on the screen. If you do so while the Spectral Spatial Scan is running you will see an active spatial build up. The frequency listed below the image shows Composite Frequency (10 MHz to 100 MHz). The second reports. from the left is a 2D to 3D conversion that is sometimes used for 8.9 User Composite Spatial By left clicking the first icon from the left in the Composite Spatial View the icon becomes a . In this view the highlighted frequency (the peak marked by an ‘x’ on the Composite Spectral) is displayed. The resulting User Spatial is then displayed for the marked frequency (in this case the 11 MHz fundamental). The User Composite View shows the peak amplitude at the chosen frequency at each cell location (the Composite Spatial View shows the peak amplitude at any frequency at each location). Composite Spectral View User Composite Spatial View Multiple peaks can be marked and viewed against the Composite Spatial (toggle between User Spatial (multiple frequencies) and Composite Spatial). 8.10 Comparisons Nexus Plus has several comparison tools; however, one of the best methods of comparing two spatial scans is to view them side by side with the same scale. For example: we may want to see the difference made by inserting the decoupling capacitor back into its socket in the reference board. To do this, we want to create a new spatial scan with the decoupling capacitor inserted. Then we Edit the Node Setting of the new scan to set the amplitude scale to be the same as the scale for the scan with the decoupling capacitor removed (Edit Node Preferences/Spatial Display). Hint: If you are going to set up a scan that has the identical settings of a previous scan, then simply press Control and hold down the left mouse button on the previous scan (in the project view) and drag the cursor on to the module where you wish to place the new scan (if there are no modules, drag to the project) then release and the scan is copied. This is convenient if you change the DUT as in the case of the reference board where a decoupling capacitor has been removed. At the 11 MHz fundamental the resulting Spatial Scans should look very similar to this. Spatial Scan at 11 MHz – Decoupling Capacitor Removed Spatial Scan at 11 MHz – Decoupling Capacitor In Place Comparison - Spectral Overlay (changed picture) Highlight the Project or Module where you wish to create the Comparison Node, then right click the mouse and choose Add Node, then select Spectral Overlay from the pull down menu. Once a Spectral Overlay node is selected a node is presented with two blank sub-nodes called ‘Test’ and ‘Reference’. The ‘Test’ sub-node will usually contain the scan of a DUT after some corrective measure has been taken. The ‘Reference’ sub-node will usually contain the scan of the DUT before such corrective action was taken. To fill the ‘Test’ placeholder simply drag the spectral scan with the decoupling cap to the Test’ placeholder. To fill the ‘Reference’ placeholder simply drag the spectral scan with the decoupling cap removed to the ‘Reference’ placeholder. The Spectral Overlay should look like this: By clicking on the left button of the mouse, zoom the image around the fundamental to get a good impression of the emissions that were removed by the addition of the decoupling cap. 8.11 Add Report Generator To create a report, please right click the Project View at the left of the screen. Left click on the Add Node, and then left click on Report Generator. The following Report Generator screen appears. Add Report Generator Report Generator Menu You have two options when creating a report, which are select specific scans, or select all open scans. After choose one of the options, left click on Create Report, and then choose the location where you want to store your report at in your computer. 9. Measurement TIPS 9.1 Measuring a DUT of unknown a priori (EMC/RFI) performance When analyzing the emissions produced by a printed circuit board or device under test (DUT), verify that signals are actually being emitted from the DUT and not ambient background signals being received: 1) Run a spectral scan over the frequency range of interest with no PCB present. To eliminate the possibility that the DUT is acting like an antenna or signal conduit for non-local sources: 2) Run further scans on the unpowered DUT positioned on the scanner module. 3) Perform a wide-frequency range spectral/spatial scan or several spectral/spatial scans to cover the entire frequency range of interest. 4) Review the resulting data to identify frequencies that have emissions emanating from the DUT. 5) Compare the powered and unpowered scans taken with the DUT in the identical positions and with identical scanning parameters. To determine the significant emission areas on the DUT at the frequencies of interest: 6) Run spatial scans at the same frequencies used in Steps 1 through 5. If the peaks have not been measured accurately (peak measures showing): 7) Run narrow spectral scans so that the frequency error of the spectrum analyzer is less than the bandwidth used for the spatial scan; e.g., for a spectrum analyzer with a frequency error of 1% of a scan, a spectral scan with a span of less than 10 MHz should be used for a spatial scan using a bandwidth of 100 kHz. Once the spectral and spatial data has been acquired: 8) Obtain and import a Hewlett Packard Graphics Language (HPGL) graphic file of the layout of the DUT to be used for the spatial overlays 9.2 Exporting Captured Scan Data To export scan data to a text file: 1) Right-click on the scan display window (or any of the three comparison or scan node types in the project tree). From the menu that appears: 2) Click Export. From the Export Scan Data window that appears: 3) Indicate where to save the data in the Save in: window. 4) Enter a name in the File name: field. 5) Click Save. 9.3 Scanning your Printed Circuit Packs 1) Choosing which scan to use. Is the device expected to have continuous emissions or intermittent activity? All devices have software based activity and Nexus Plus’s ability to capture time based phenomena can be very helpful. a. If the device has some intermittent activity choose to do a Spectral Scan followed by a Continuous Spatial Scan with Peak Hold applied for each of the frequencies of interest. b. If the device is continuous wave, choose to do a Spectral/Spatial Scan. Then later do a Continuous Spatial Scan at the main frequency of interest just to demonstrate the difference due to time based activity (software activities). 2) Choosing Spans and Resolution Band widths (RBW). It is recommended that you scan with small spans and resolution band widths from 100 KHz to 10 KHz as it provides you with more immediate feedback. Nexus Plus System has the capability of scanning all 1280 probes at a large span and a tight RBW but the scans can take a long time to complete 3) Tips: c. Take extra care during the set up of the DUT to ensure that the DUT is fully exercised in the fashion that will be sent off to test site (although it may not be in the final packaging). d. Import a Gerber or HPGL overlay whenever possible. Carefully locate the overlay to coincide with the DUT as slight variations can be very misleading. Make sure that the overlay is properly oriented. If the overlay file will be added afterward take careful notes regarding the DUT placement on the scanner (coordinates), its orientation and the side of the DUT being scanned. e. Set up a separate module or project for your DUT and use the ‘Description’ portion of the setup to quickly and easily identify the purpose of the scan. f. Use the note facility for descriptions and possible explanations for emissions on the DUT. This could come in very handy later when writing a follow up report. g. If you already have visited a compliance facility and have a report, it is a good idea to include this data in the notes and conduct the Nexus Plus scans at the same frequencies. There will be differences in the far field and near field resultant values but they will be relative. h. If the scan amplitudes are below 20 dBuV and the noise floor is high, use a low noise amplifier (your own or one provided by Emscan) and reduce the resolution band width. i. We take measures to compensate for spectrum analyzer noise. j. Make special note of low amplitude current loops that are coupling onto the connectors. k. Conduct Spatial Scans using continuous scan and peak hold at some of the frequencies of interest, even if a Spectral/Spatial Scan was used. The continuous spatial with peak hold will almost always provide a different picture than a single Spatial or a single User Spatial of a Spectral/Spatial Scan (as all boards have time variances). The ability to capture time based events is a benefit unique to Nexus Plus System. l. If you have a very strong intentional radiator, it may be advantageous to either conduct scans excluding this frequency (a scan below the frequency and a scan above the frequency) or add a filter (customer provided) that selectively excludes this frequency. m. If you are scanning very high amplitude intentional radiator an attenuator may be required. 10. Appendix 10.1 Installing the Upgrade Utility Program from the Nexus Plus System CD To install Upgrade Utility Program: 1. Insert the CD-Dom that came with the Nexus Plus System 2. Click on Folders, this screen will be displayed: 3. Click on Upgrade Utility under NEXUSPLUS 4. Double Click on UpgradeUtility Setup.exe 5. This screen will be displayed: 6. Click Next, this screen will be displayed: 7. Click Next, this screen will be displayed: 8. Click Install, to start copying Nexus Plus Files, then this screen will be displayed: 9. Click Finish to complete this Installation 10.2 Frequently Asked Questions (FAQ) What if I see a number of peaks with Nexus Plus that are not appearing on my Far Field Report? 1. The PCB may be placed in a very effective shield that does not allow the PCB emissions to reach the far field. 2. Nexus Plus system results can be viewed in two formats – compensated (default) and uncompensated (optional). Nexus Plus compensates for probe response and probe to probe variations over the frequency range of the scanner. The compensation is done so that a constant amplitude source across a range of frequencies and at different areas on the scanner will result in a constant measurement by Nexus Plus at all probes and at all frequencies. To provide the most meaningful data possible, Nexus Plus System only compensates perceived signals and does not compensate spectrum analyzer noise. As such, Nexus Plus sets a default threshold of 5 dB above the noise floor as the demarcation between signals and noise. As each venue has different ambient conditions this threshold may be too low and some noise may be above the threshold and therefore compensated. If you are seeing peaks that you do not believe belong to the DUT, please increase the threshold as follows. Highlight the Spectral Scan where you wish to modify the threshold, right click, choose View Node/Settings, then choose the Spectral Display Menu and manually enter a different value for the Peak Threshold Above setting. What if I do not see peaks with Nexus Plus that are appearing on my Far Field Report? There are a number of possible alternatives as to how the radiation is reaching the far field. 1. Directly from the PCB to the far field – Nexus Plus System will be able to show these emissions. 2. A resonant or ineffective shield – Nexus Plus System will be able to show these emissions. 3. Signals coupled onto cables – a current clamp will be necessary to prove that the emissions are on the cables and an Nexus Plus System can show how the emissions are getting onto the connectors and therefore onto the cables. Low amplitude currents on the PCB can couple to the connectors and cause large problems in the far field as the cable acts as a very large antenna. To best view these low amplitude emissions, quite often (deleted) a low noise amplifier is inserted in series between the scanner and the spectrum analyzer and the resolution band width is reduced to increase the dynamic range to allow you to differentiate emissions from the noise floor. 10.3 Interpreting Error Messages You might encounter the following error messages while working with Nexus Plus System. Explanations and methods for addressing errors are included in this table. Table A-1: Error Message Descriptions and Recommendations If you receive some other error message please contact Emscan Technical Support Client Program Possible Causes Action Pop up Error Messages Error #101: Spectrum analyzer must be present when calibrating. This occurs when calibrating the system with the spectrum analyzer. The spectrum analyzer is not turned on or the address is not set to 18 or is disconnected. Connect and/or power on the spectrum analyzer, verify the address and retry the calibration. Error #102: Spectrum analyzer must be present when running a scan. This occurs when running a scan. The spectrum analyzer is not turned on or the address is not set to 18 or is disconnected. Connect and/or power on the spectrum analyzer, verify the address and rerun the scan. Error #151: Error communicating with the Nexus Controller GPIB card. This occurs when running a scan. The Nexus Controller uses a General Purpose Interface Bus (GPIB) card to communicate with the spectrum analyzer. An error has occurred in this card. Disconnect the Nexus Client application from the Controller. Cycle the power on the Controller. Reconnect the Nexus application to the Controller. If the problem persists contact Emscan Technical Support. Error #201: Error calibrating the system with the spectrum analyzer. The Cal Out cable might be not connected to the RF input or the Video output, or External Trigger Input or High Sweep is not connected properly. Confirm the Calibration, Video Output, External Trigger Input and High Sweep are connected properly. Error #202: Error calibrating the spectrum analyzer. The Cal Out cable might be not connected to the RF input or the Video output, or External Trigger Input or High Sweep is not connected properly. Confirm the Calibration, Video Output, External Trigger Input and High Sweep are connected properly. Error #251: Communication with Spectrum Analyzer failed. An unknown error has occurred while running a scan. Check if the correct Spectrum Analyzer in the Preferences setting is selected. If so Restart the controller and spectrum analyzer Error #252: Communication with Spectrum Analyzer failed. An unknown error has occurred while running a scan. Check if the correct Spectrum Analyzer in the Preferences setting is selected. If so Restart the controller and spectrum analyzer Error #253: No External Trigger Input The External Trigger Input not connected or missing. Check that the External Trigger Input and Blank Pulse cables are connected correctly. Error #254: DAQ driver unavailable. The SCSI cable on the back of the controller may be loose Check the SCSI ribbon cable in the back and make sure it is connected properly. Restart the controller and try again. If the problem persists call Emscan Technical support. Error #255: Generic or No scanner An older model scanner module is used or no scanner module is connected. Verify whether an older model scanner is used or whether the serial cable connector between the controller and scanner is loose. Error #302: Nexus Controller A/D set up error. This occurs when running a scan. There has been an error setting up the A/D converter in the Controller. Disconnect the Nexus application from the Controller. Cycle the power on the controller. Reconnect the Nexus application to the Controller. Error #303: Spectrum Analyzer Driver unavailable. The driver might have been corrupted or not initialized properly Restart the controller and try again. Error #304: Scanner Driver unavailable. The driver might have been corrupted or not initialized properly Restart the controller and try again. Error #305: DAQ Driver unavailable. The driver might have been corrupted or not initialized properly Restart the controller and try again. Error #308: occurred while performing a scan. An unknown error has occurred while running a scan. Disconnect the Nexus application from the Controller. Check the Controller, spectrum analyzer, and scanner module connections. Cycle the power on the Controller. Reconnect the Nexus application to Controller. If the problem persists, contact the EMSCAN technical support. Error #323: Unable to copy file: <filename> -> <filename>.1 This occurs when you are saving a project, opening a view on scan data, or exporting scan data. Call Emscan Technical Support Error #324: Unable to create mapping for file: <filename>.1 Make sure that there is sufficient disk space. This occurs when you are opening a view on or exporting a spectral/spatial scan. Make sure that you have at least 100 Mbytes of available unused storage capacity Error #335: Error writing to file: <filename>.1 This occurs when you are performing a Save or Save As. Make sure that you have at least 100 Mbytes of available unused storage capacity Error #337: Number of points is not the same. For two spectral scans to be Edit your scan settings and compared or overlaid, the reset the frequencies to the number of frequencies same number. sampled for each of the scans must be identical. See Conforming Comparison Data in Section 6.3. Error #338: The requested bandwidth is outside the capabilities of the attached spectrum analyzer. <detailed bandwidth information>1 The attached spectrum analyzer is not capable of analyzing the requested resolution bandwidth. The <detailed bandwidth information>1 details what has been requested and the bandwidth capabilities of the attached spectrum analyzer. Edit the scan options tab for the node in question and rerun the scan. Error #340: The requested frequency range is outside the capabilities of the attached spectrum analyzer <detailed range information>1. The attached spectrum analyzer is not capable of analyzing the requested frequencies. The <detailed range information>1 details what has been requested and the frequency capabilities of the attached spectrum analyzer. Edit the scan options tab for the node in question and rerun the scan. Error #342: <project name>1 is not a valid project name. You might have specified a project name that already exists in the repository, tried to use “Untitled” (which is not valid) or tried to include invalid characters in the project name. Verify that the project name doesn’t already exist, contains only valid characters and is not “Untitled.” Error #343: The selected path is invalid. You have specified something that isn’t a path, e.g., “My Computer” or some network object like a domain or a computer. Specify an actual path. Error #344: This operation cannot be performed in this state. The application must be connected and idle. Error #345: <Spectrum analyzer name>1: Missing calibration preparation message <calibration preparation ID>.1 Check the status indicator at the bottom of the main window. It must say “Connected” before you can initiate a new operation. The Registry may not have been installed properly Contact EMSCAN technical support. Error #346: <Spectrum analyzer name>1: Missing driver <driver ID>.1 The Registry may not have been installed properly Contact EMSCAN technical support. Error #347: Cannot find device information for spectrum analyzer driver with driver ID <driver ID>1. Please contact Emscan technical support. The Registry may not have been installed properly Contact EMSCAN technical support. Error #348: No device information found in registry key “<registry key name>.” 1 Please contact Emscan technical support. The Registry may not have been installed properly Contact EMSCAN technical support. Error #349: No address specified. The error appears when the client workstation is trying to establish a connection with the Nexus Controller. The client workstation does not know the IP address of the Nexus Controller. Edit the IP address from the Analyzer tab of the Preferences settings dialog and retry the connect operation. Error #350: No project repository has been selected or the selected repository cannot be located. Push OK to select a repository now or Cancel to Exit. 1) Click OK to select a repository. 2) To use this repository in its new location, click OK and select the repository directory. To use the repository in its previous location, restore the repository to its previous location, click OK and select the repository directory. If the user has no interest in the previous directory, select a new repository directory and continue. Error #354: No overlay node found. The rules to find an overlay for this node have been applied, but no overlay was found. Check the overlay search rules in the user guide (see Section 6.4) or see online help. Make sure that the overlay you’d like to use is in the appropriate position in the hierarchy based on these rules. Error #355: Calibration instructions for this spectrum analyzer cannot be found. Please contact Emscan technical support. The registry may not have been installed properly Contact EMSCAN technical support. Error #359: No project found with the name <project name>1. When attempting to delete or open a project, you have typed the name of a project that doesn’t exist. Verify the project name and retry the operation. Error #364: Project could not be saved. This occurs when you are performing a Save or Save As. This message is only shown in conjunction with one of the other messages in this list. See the remedial action for the accompanying error message. Error #367: You must indicate which spectrum analyzer to use before running a scan. Please edit the Preferences and try again. The system cannot run a scan Go to the Analyzer tab if the spectrum analyzer has from the Preferences not been specified. settings dialog box. Set the spectrum analyzer and recalibrate the system before rerunning the scan. Error #501: Insufficient Nexus Controller memory. This occurs when running a scan. The user has attempted to collect too many points in a spectral or spectral/spatial scan. The number of points collected is determined by the resolution bandwidth and the span. Decrease the number of points collected by increasing the resolution bandwidth or decreasing the span. Rerun the scan. Error #502: Insufficient Nexus Controller shared memory for the defined scan. This occurs when running a scan. The user has attempted to collect too many points in a spectral or spectral/spatial scan. The number of points collected is determined by the resolution bandwidth and the span. Decrease the number of points collected by increasing the resolution bandwidth or decreasing the span. Rerun the scan. Error #503: Could not get handle for Nexus Controller shared memory. This occurs when running a scan. Insufficient system resources remain in the Nexus Controller to start the scan. Disconnect the Nexus application from the Controller. Cycle the power on the controller. Reconnect the Nexus application to the Controller. Rerun the scan. Error #600: Unable to update license. This occurs when updating the license. License has been downloaded once. Please contact Emscan