1
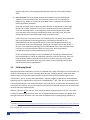
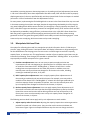
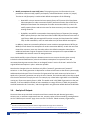
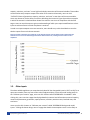
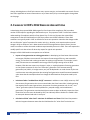
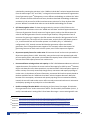
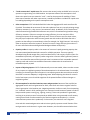
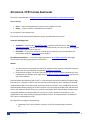
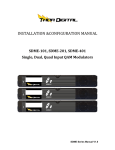
Clean Power Plan Planning Tool User Manual November 17, 2014 AUTHOR Pat Knight 485 Massachusetts Avenue, Suite 2 Cambridge, Massachusetts 02139 617.661.3248 | www.synapse-energy.com C ONTENTS INTRODUCTION........................................................................................................ 1 1. WALKTHROUGH ............................................................................................... 2 1.1. Setting Basic Assumptions ................................................................................................3 1.2. Calibrating Model ............................................................................................................6 1.3. Manipulate Unit-Level Data .............................................................................................7 1.4. Analysis of Outputs ..........................................................................................................9 1.5. Other Inputs .................................................................................................................. 10 2. CHANGES TO EPA’S 2012 BASELINE ASSUMPTIONS ................................................ 11 3. CHECKLIST OF CONSIDERATIONS WHEN USING CP3T .............................................. 13 APPENDIX A. CP3T LICENSE AGREEMENT .................................................................... 18 APPENDIX B. ESTIMATING GWH SAVINGS FROM SAVINGS AS A PERCENT OF SALES ................ 20 INTRODUCTION This user manual serves as documentation for the Clean Power Plan Planning Tool (“CP3T”). The CP3T model is used to analyze the cost and emission impacts of compliance with EPA’s Clean Power Plan, guidelines proposed under section 111(d) of the Clean Air Act. In CP3T, users set up a scenario by selecting a state, and adjust generation, emission rates, and capacity factors until peak demand requirements, annual generation requirements, and emission rate requirements per EPA are met. Users may increase capacity factors, enter unit retirements, add energy efficiency or renewables, and/or add new generation from Clean Power Plan-exempt natural gas-fired combined cycle or combustion turbine generators. Users then evaluate peak demand and generation requirements in each year of the study period (2013-2030) to ensure reliability requirements are met. Finally, users evaluate the emission rates and emissions that result in each year to ensure the scenario complies with the target emission rates and emissions proposed by EPA. This tool is intended to give users the greatest flexibility possible in the creation of their scenarios. Although this guide details the general ways most users will want to make changes to the model, CP3T is completely open-source; users are free to make any changes to any of the formulas and/or inputs that they wish.1 In this document, we discuss: (1) preliminary instructions for operating CP3T, (2) changes to EPA’s 2012 baseline assumptions, and (3) preliminary considerations that a user should be aware of when using CP3T and interpreting CP3T’s outputs. 1 See Appendix A for additional information on open source and how it relates to CP3T’s license agreement. Synapse Energy Economics, Inc. Clean Power Planning Tool User Manual 1 1. WALKTHROUGH This section provides an overview for operating CP3T. Before running CP3T, users should be aware of the following requirements: CP3T requires that the user have Excel 2007 or newer. This includes Excel 2007, Excel 2010, and Excel 2013. CP3T will not function correctly on older versions of Excel. CP3T requires that Macros be enabled. Users should select “Enable Content” from the yellow “Security Warning” banner that appears at the top of their screen.2 In addition, users may click the “Developer” button on the ribbon, select “Macro Security” from the list of available options, then click the radio button “Enable all macros” from the list of available options. Users should set Excel calculations to “Automatic” to ensure that CP3T is updating when any changes are made. This can be done by selecting the “Formulas” button from the ribbon, clicking “Calculation Options” from the “Calculation” section, and selecting “Automatic” from the dropdown that appears. Selecting “Automatic” may result in slowdown for users on older machines. Users may then instead choose “Manual” calculation so that the workbook does not continuously calculate. In this case, users must take care to press the “Calculate Now” or F9 on their keyboards after each change made to CP3T. Each workbook (i.e., copy of the CP3T file) represents a single scenario. Most user-driven analyses will require at least two scenario workbooks: (1) a base scenario and (2) a scenario representing any adjustments to the base scenario, for example, a different composition of renewables or energy efficiency. Once the user has decided on a scenario pathway, he or she should open a copy of CP3T and 3 give a name to the scenario. Users may also view this user manual or CP3T’s license agreement. Each scenario in CP3T is constructed using the following steps: (1) setting basic assumptions, (2) calibrating the state electric system, (3) manipulating unit-level data, and (4) analyzing outputs. See Figure 1 for a schematic of the model. Note that it is expected that each scenario will require numerous iterations of input adjustments before the model requirements are satisfied. 2 3 This “Security Warning” banner typically only appears the first time CP3T is opened on a user’s computer. Users may also elect to click the button “Restore typical Excel functionality.” Some basic Excel functionality has been disabled in CP3T in order to facilitate a guided model walkthrough. Clicking this button will reveal the worksheets that make up CP3T, including the sheets discussed in the following section, and other sheets that feed background data into the model. Synapse Energy Economics, Inc. Clean Power Planning Tool User Manual 2 Figure 1. Schematic of CP3T. The following sections detail each of the steps outlined in Figure 1. 1.1. Setting Basic Assumptions In these steps, the user may enter a number of basic assumptions (each step corresponds to a step in the CP3T workbook in which users can set the appropriate assumptions): 1. State: Users select from the list of states on which to perform their analysis. After selecting a state, a script in the model pulls information on unit-specific data for that state only. 2. Incremental renewable energy: Users can choose EPA’s Clean Power Plan assumptions or enter a user input for the total amount of generation from renewables in each year. Users then input their own information on the percent of renewable generation coming from each resource (as shares) and can either choose from default values or enter their own values for capacity factors by generation type. Note that existing renewable generation is separately accounted for elsewhere in CP3T. Also note that incremental hydroelectric generation is not included as an option due to its relatively low potential compared to other resource types. Users may note that for some states (Iowa, Maine, Minnesota, and South Dakota), the 111(d) default values shown are negative. This results from the way EPA calculated renewable potential regionally, which causes the 2017 renewable generation for these states to decrease compared to actual 2012 generation. Synapse Energy Economics, Inc. Clean Power Planning Tool User Manual 3 3. Cumulative energy efficiency: Users can choose EPA’s Clean Power Plan assumptions or enter a user input for an energy efficiency trend. Values entered are interpreted to be net cumulative GWh savings.4 Note that as in EPA’s formulation for each state’s Clean Power Plan target rate, energy efficiency savings are de-rated according to the proportion of in-state generation to in-state sales. For example, if a state only generates 60 percent of its required sales (i.e., it is a net importer), the model will only count 60 percent of the energy efficiency savings, and assumes the remaining energy efficiency savings displace generation from out of state. If a state instead generates 100 percent of its required sales, or if it is a net exporter and generates more energy than it consumes, then the model counts 100 percent of the energy efficiency savings in that state. Also on the energy efficiency page, users may set a trend for program administrator costs. Program Administrator or “PA” costs are those costs incurred by the administrator of the energy efficiency program, often the utility. EPA estimates in its Clean Power Plan GHG Abatement supplemental documents that these costs are typically 50 percent of the total cost of energy efficiency measures.5 Users can either set their own trend, or choose between three different default trends: "111(d) Low" and "111(d) High" costs are provided by EPA in the Clean Power Plan GHG Abatement 6 supplemental documents. Synapse estimates energy efficiency costs to be lower than either of these estimates. Figure 2 displays the difference between the costs in each trend. 4 5 6 Users may use the EPA’s technical support documents to estimate a level of net cumulative GWh savings from an annual savings-as-a-percent-of-sales trend. More information can be found in Appendix B. Available at: http://www2.epa.gov/sites/production/files/2014-06/20140602tsd-ghg-abatement-measures-scenario1.xlsx. Available at: http://www2.epa.gov/sites/production/files/2014-06/20140602tsd-ghg-abatement-measures-scenario1.xlsx. Synapse Energy Economics, Inc. Clean Power Planning Tool User Manual 4 Figure 2. Energy efficiency program administrator costs. Program administrator costs are assumed to be 50 percent of the total cost of implementing an EE measure. On this page, users can also select a forecast for load growth. The default trend is the growth rate associated with the state’s region from the Annual Energy Outlook 2014, but users can enter their own. Note that the AEO 2014 load growth forecast for each region includes some non-explicit assumptions for energy efficiency. Users should review the AEO 2014 assumptions and attempt to take these into account when developing their energy efficiency savings trends to avoid double counting.7 4. Non-111(d) generation: Users can enter annual values to add 111(d)-exempt generating capacity (i.e., new natural gas-fired combined cycle or combustion turbine generators). More information on this topic is available in section 1.3. Users can create assumptions for net imports and net exporters. When a state is selected, values for the net GWh imports and net GWh exports in 2012 are automatically calculated and inserted in this sheet. Users can either choose to maintain this level of imports and exports over the study period, or enter their own GWh trends. States that were net importers in 2012 can only reduce their level of imports to 0 GWh; they cannot become net exporters. The reverse is true for states that net exported electricity in 2012; they can only reduce net exports to zero and cannot become net importers. 5. Displacement order: Users can select a displacement order for resources in their state from a list of coal, oil and gas steam, existing NGCC, under-construction NGCC, imports, and new 111(b) NGCCs. A default order is provided according to typical economic 7 Available at: http://www.eia.gov/forecasts/aeo/assumptions/. Synapse Energy Economics, Inc. Clean Power Planning Tool User Manual 5 dispatch, but users are encouraged to develop their own state- and scenario-specific order. 6. Enter CO2 price: Users can choose between three default CO2 prices developed by Synapse or enter one of their own. CO2 prices may reflect costs from existing CO2 programs (e.g., RGGI), or a future CO2 price adder used to incentivize low-emissions electric generation in dispatch. Note that entering a CO2 price does not impact dispatch or displacement. Users might expect that in reality, enactment of a CO2 price could drive the economic dispatch of resources and could result in a rearrangement of the resource displacement order. Users may wish to first construct a displacement order, then select a CO2 price that would ultimately force the displacement order previously chosen. CP3T’s CO2 prices are meant to serve as an indicator of the incremental costs associated with running affected CO2-emitting generation. CP3T does not account for any redistribution of the costs associated with CO2 prices. Most proposed polices for CO2 prices assume all costs are redistributed, resulting in a net policy cost of zero dollars. If the user is not separately accounting for the redistribution of the costs associated with a CO2 price, he or she should select “None” for a CO2 price, which could then be interpreted to imply a net zero redistribution of CO2 costs. Finally, note that the Synapse CO2 prices available to be selected only reflect expected polices regarding CO2, and do not attempt to reflect the social cost of carbon. Users can enter their own trends to forecast the social cost of carbon if they have such trends available. More information about the inputs used to create the Synapse CO2 forecast can be found on the Synapse website.8 1.2. Calibrating Model After setting the basic assumptions, the user is presented with a page informing him or her whether the model has encountered any errors in meeting peak demand, annual generation, Clean Power Plan emission rates, or Clean Power Plan emissions. Note that meeting the peak demand goal is not a “requirement,” per se. As many states participate in regional reliability organizations, peak demand is frequently met on a regional basis, rather than a statewide basis.9 Thus, CP3T will run successfully even if the peak demand goal is not achieved. Similarly, the model will run if Clean Power Plan emission rates or emissions are not met; an error will simply be returned if the statewide emission rate or emissions do not meet the limits specified by EPA. However, CP3T will not run correctly if the annual generation requirements are not met. Users must increase the potential generation for each year until potential generation is equal to or greater than sales plus exports for that state. Users can make this adjustment by increasing energy efficiency or 8 Available at http://www.synapse-energy.com/sites/default/files/SynapseReport.2013-11.0.2013-Carbon-Forecast.13-098.pdf. 9 The peak demand goal is using the estimated peak demand plus a reserve margin. Reserve margins are assumed on a regional basis using NERC data. Specific reserve margins and a detailed source are available on the “RefTables” tab of CP3T. Synapse Energy Economics, Inc. Clean Power Planning Tool User Manual 6 renewables, increasing imports or decreasing exports, or by making unit-level adjustments (see section 1.3 for more information). Once these adjustments have been made, CP3T will then be able to properly displace generation (in the user-specified order) until the projected level of sales and exports is reached (see section 1.3 for more detail on how this displacement occurs). For many states, implementing the EPA building blocks as set out in the Clean Power Plan may not result in that state meeting the emission rate target, despite the target being calculated by the EPA using the very same building blocks. While counter-intuitive, this incongruity is mainly caused by two factors: (1) CP3T, unlike EPA’s target rate calculation, accounts for load growth and (2) CP3T assumes fossil units will be displaced by renewables, energy efficiency, and new nuclear units, unlike EPA’s Clean Power Plan. Both the growth in generation (and accompanying emissions) and the shift from carbon-emitting generation to fossil-free generation greatly affect a state’s ability to match the EPA target goals – some states end up over-complying, while some states end up under-complying. 1.3. Manipulate Unit-Level Data One option for calibrating the model is to manipulate unit-level information. On the “Calibrate your scenario” page, clicking the button “Unit-Specific Data” will display information on all generating units for the selected state. On this page, users can retire units or make changes to each unit’s capacity, capacity factor, or emissions rate. This page features a number of pre-set options typical users may be interested in evaluating. These changes are intended to replicate EPA’s “building blocks” or to provide a way to quickly set default assumptions for a given scenario: a) Emission rate adjustments: Users can use a pre-set option to apply emission rate improvements to coal units beginning in a specified year. For example, users may want to model the Clean Power Plan’s “Building Block 1,” wherein all coal units in a state undergo heat rate improvements on the order of 6 percent. In addition, users can manually enter unit-by-unit heat rate changes for all the units in the state, including natural gas combined cycle units, in all years. b) NGCC capacity factor adjustments: Users can apply capacity factor adjustments to all the natural gas combined cycle units within the state. For example, users may wish to model the Clean Power Plan’s “Building Block 2,” wherein all natural gas combined cycle units have capacity factors increased to 70 percent. Users can also manually enter unitby-unit capacity factor changes for all the units in the state, in all years. c) Nuclear capacity factor adjustments: Users can apply capacity factor adjustments to all the nuclear units within the state. Note that the target assumptions set out by the Clean Power Plan assume nuclear units will be able to generate at a level of 90 percent in all future years. Users can also manually enter unit-by-unit capacity factor changes for all the units in the state, in all years. The following sections detail how to apply unit-by-unit adjustments to each variable: Adjust capacity values for each unit: Adjusting the capacity impacts the maximum generation possible from each unit in future years. Users can also use this section to indicate unit retirements. Figure 3 gives an example of different ways the user can change each unit’s Synapse Energy Economics, Inc. Clean Power Planning Tool User Manual 7 capacity. In this example, the unit Carbon 1 is modified so that it retires in year 2020. Entering a year between 2013 and 2030 in the “Enter Retirement Year” field automatically fills in zeroes for capacity in all the relevant years. By leaving a cell blank, as is shown for 2013 through 2023 for Carbon 1, users implicitly assume no changes to capacity during that year. Also in this example, the unit Carbon 2 is modified so that its capacity decreases to 100 MW from a 2012 baseline of 114 MW beginning in year 2016. Modifications must be entered in each year that modification is desired; if “100” were only entered in 2016 with no other changes, Carbon 2 would return to a capacity of 114 MW in 2017 and all subsequent years (note that this figure shows data only through 2023 as an example). If the user does not make any changes, the 2012 values are assumed automatically for each unit for each future year. Figure 3. Example of changes to capacity values. Adjust capacity factors for each unit: Just like with capacity, users can make revisions to each unit’s capacity factor. Figure 4 shows an example where the unit Carbon 1 has its capacity factor reduced to a maximum of 50 percent in 2013 and all subsequent years through 2030. If the user does not make any changes, the 2012 capacity factors are assumed automatically for each unit for each future year, as is the case with Carbon 2. Figure 4. Example of changes to capacity factors. Adjust emission rate values for each unit: Finally, users can modify the CO2 emissions rate associated with each unit. In Figure 5, an example is shown where the emission rate for unit Carbon 1 is decreased by 6 percent. If the user does not make any changes, the 2012 emission rates are assumed automatically for each unit for each future year. Figure 5. Example of changes to emission rates. Synapse Energy Economics, Inc. Clean Power Planning Tool User Manual 8 Modify assumptions for new 111(b) units: This page brings over the information the user provided on new non-111(d) capacity and imports, as described above in section 1.1 (step 4). The data on 111(b) capacity is combined with default assumptions of the following: o New NGCC units are assumed to have capacity factors of 55 percent (the Clean Power Plan assumption for under-construction NGCCs) and have emission rates of 907 lbs per 10 MWh (the Clean Power Plan assumption for under-construction NGCCs). Users can modify capacity factors and emission rates for these resources just as they would with existing resources. o By default, new NGGTs are assumed to have capacity factors of 6 percent (the average NGGT capacity factor per the Clean Power Plan’s eGRID TSD) and have emission rates of 1,467 lbs per MWh (the average NGGT emission rate per the Clean Power Plan’s eGRID TSD). As with new NGCCs, users can make edits to any of these default assumptions. In addition, imports are assumed by default to have an emission rate equivalent to 907 lbs per MWh (the Clean Power Plan assumption for under-construction NGCCs). As with the non-Clean Power Plan resources, users may also make edits to this default assumption. Note that no additional attributes are given to exports. Emission rate assumptions for exported GWh are embedded in the emission rates of in-state generators. Users should carefully review all inputs in between scenario runs to ensure that the given run only includes the desired modifications, rather than holdover assumptions from previous runs. We recommend starting new scenarios from an unchanged “master” version of the tool—with all of the original default assumptions in place—whenever possible. Note that the changes to the unit-level data only affect “potential” generation and “potential” emissions—in the model, generation is displaced on a resource-level basis so that electric system supply and demand are balanced. This will cause the final generation from each resource to be less than or equal to the “potential” generation set up by the user. Likewise, final emissions will be less than or equal to the level of emissions set up by the user. For example, say a state had a single NGCC unit of 100 MW, running at a 70 percent capacity factor in 2020. This would result in 615 GWh of generation in that year. However, if the user added in 10 GWh of new renewables or energy efficiency in 2020, this generation would be assumed to be “must-take,” and the single NGCC unit generation would decrease to 605 GWh. 1.4. Analysis of Outputs Once users have set up unit-level assumptions and have ensured that peak demand, generation, emission rate, or emissions requirements are met, scenario results can be accessed by pressing buttons on the “Calibrate your scenario” page. Users can click “OUTPUTS: Tabular summary of generation, 10 U.S. EPA. June 2014. Goal Computation Technical Support Document. Pages 12-13. Available at: http://www2.epa.gov/sites/production/files/2014-06/documents/20140602tsd-goal-computation.pdf. Synapse Energy Economics, Inc. Clean Power Planning Tool User Manual 9 capacity, emissions, and costs” to see high-level tabular summaries of the stated variables. These tables can be used to easily compare outputs from other CP3T scenarios. Alternately, users can click “OUTPUTS: Charts of generation, capacity, emissions, and costs” to see charts of the same variables. Users may choose to use the charts to assist in calibrating their scenario. Figure 6 provides an example in which the scenario’s calculated Clean Power Plan emission rate is not in compliance with the EPA target. Users can use this output to gain an understanding of which years require modifications to their inputs to achieve a future in which compliance is attained. In order to compare outputs across two scenarios, users should set up a third workbook to store the tabular outputs from each relevant scenario. Figure 6. Example of emissions rate comparison. In this example scenario, the calculated scenario Clean Power Plan emissions rate is in excess of the EPA target Clean Power Plan emissions rate, meaning that this scenario is not in compliance. 1.5. Other Inputs The above walkthrough does not comprehensively detail all the changeable inputs in CP3T. As CP3T is an open-source model, users are free to alter other background data, or even the model coding itself. On the “Calibrate your scenario” page, users can click a button called “REFERENCES: Core Model.” After clicking this, users can view a page that displays detailed, resource-level information on annual capacity, resource displacements, generation, capacity factors, emissions, emission rates, levelized costs, and total costs. Users can also click a button on “Calibrate your scenario” called “REFERENCES: Background model inputs.” Clicking this button brings users to a page that details the assumptions users are less likely to Synapse Energy Economics, Inc. Clean Power Planning Tool User Manual 10 change, including data on fossil fuel resource costs, reserve margins, and renewable cost trends. If users have more applicable or better information on any of these items, they are encouraged to change data on this page. 2. CHANGES TO EPA’S 2012 BASELINE ASSUMPTIONS In developing the proposed 2020-2030 targets for Clean Power Plan compliance, EPA has made a number of assumptions regarding the 2012 baseline year. The purpose of CP3T is to facilitate a better understanding of compliance with the Clean Power Plan. To this end, Synapse has revised EPA’s assumptions so that the 2012 baseline in CP3T best reflects actual 2012 conditions. These 2012 conditions are typically used in CP3T as defaults for future unit operation. Note that the changes made do not reflect the “typical” operation for certain units (e.g., whether a unit experienced an unusual outage in 2012 or whether a unit is determined to have an average lifetime capacity factor), but are made in an effort to reflect the actual conditions experienced by that unit in 2012. Users are expected to modify specific unit data to best fit what they expect for typical unit operation. Changes to EPA’s 2012 baseline assumptions are as follows: Impact of new generation on existing generation: In developing its Clean Power Plan emission rate targets, EPA does not account for the impact of new energy efficiency, new renewable energy, or new fossil and nuclear generation on existing unit generation. For example, in each state, EPA assumes new renewables and energy efficiency begin coming online in 2020. However, EPA does not assume any changes in sales, or any displacement of existing generation on the system to account for this new “must-take” generation. CP3T assumes existing generation (coal, NGCC, oil and gas steam, etc.) will be displaced in an order chosen by the user such that new must-take generation plus existing fossil generation equals forecasted statewide sales. Note that this assumption does not change the 2020 baseline assumptions used by the EPA. Inclusion of other “excluded from 111(d)” resources: In addition to new 111(b) resources, CP3T also accounts for generation that is not counted under the Clean Power Plan, including existing low-capacity-factor natural gas turbines, the portion of nuclear generation not “at risk,” and “other” generation (which includes hydroelectric, pumped storage, and miscellaneous generation). The generation associated with these resources does not directly impact the Clean Power Plan emission rates calculated by CP3T, but indirectly affects whether the model is able to meet peak demand and sales in each year. Calculation of EPA "other fossil" emissions for California and Texas: EPA’s Goal Computation technical support document states that the 2012 baseline for “other fossil” emissions are Synapse Energy Economics, Inc. Clean Power Planning Tool User Manual 11 calculated by summing the emissions in the “eGRID unit-level data” technical support document from the turbine types “SST” and “IGCC,”11 along with the emissions attributed to cogeneration from all generation types.12 EPA appears to use a different methodology to calculate the “other fossil” emissions for both California and Texas; the above-described methodology undercounts emissions by 0.21 percent for California and overcounts emissions for Texas by about 2.84 percent. We have corrected these values to use the default methodology for all states. 11 12 13 14 O/G Steam negative values: To determine generation by resource in 2012, EPA sums the generation from all relevant units in the “eGRID unit-level data” technical support document.13 If the sum of generation from all resources of a given type is positive, then EPA assumes this value for the 2012 generation from this resource type. However, if the generation from all resources of a given type is negative, then EPA assumes the value for 2012 generation for this resource type is zero. This only occurs for several states, and only for the O/G Steam resource (i.e., a resource with few units that often operate in a reliability-only, or “mothballed,” configuration). CP3T, instead, assumes 2012 baseline generation reflects actual 2012 generation, even if that generation was negative. This accurately reflects the impact of all generating resources on each state’s electric system, even if those impacts are negative. 90 percent capacity factors for nuclear units: EPA assumes that all nuclear units operated at a 90 percent capacity factor in 2012. Historically, many nuclear units have operated under a 90 percent capacity factor, and several units exceeded this capacity factor in 2012. CP3T’s baseline assumes actual 2012 capacity factors from nuclear units. Present and future existing nuclear unit capacity: In EPA’s GHG Abatement Measures technical support document, EPA outlines the current nuclear fleet capacity for 2012 by state.14 However, the per-unit data source for these capacities is not cited and EPA’s 2012 assumptions appear to reflect a variety of currently announced, though future, retirements and capacity upratings of nuclear units. In the absence of better information, we assume 2012 nuclear capacity based on the data available from the “eGRID unit-level data” technical support document. Note that because of this assumption, retirements and capacity upratings are not assumed as defaults; instead, the user will need to take care to reflect currently announced nuclear unit retirements and capacity upratings in any analysis he or she undertakes. Double-counting of Dresden NGCC: In developing its Clean Power Plan targets, EPA includes future generation from “under-construction” NGCCs. The Ohio NGCC plant Dresden (Units 1, 2, and 3) is counted twice in setting Ohio’s Clean Power Plan target—once as existing NGCC units Available at: http://www2.epa.gov/sites/production/files/2014-06/documents/20140602tsd-goal-computation.pdf. Available at: http://www2.epa.gov/sites/production/files/2014-06/20140602tsd-egrid-methodology_0.xlsx. Available at: http://www2.epa.gov/sites/production/files/2014-06/20140602tsd-egrid-methodology_0.xlsx. Available at: http://www2.epa.gov/sites/production/files/2014-06/documents/20140602tsd-ghg-abatement-measures.pdf, p.4-34. Synapse Energy Economics, Inc. Clean Power Planning Tool User Manual 12 (sourced from the “eGRID Unit-level data” technical support document) and once as “underconstruction” NGCC units (sourced from the EPA’s NEEDs database15). Dresden NGCC units were in operation in 2012; for this reason, we have counted Dresden as an existing resource, and have removed it from the “under-construction” NGCC pool. Kemper IGCC capacity factor and emissions rate: EPA accounts for the generation and emission effects of Mississippi’s Kemper IGCC in its 2012 baseline, but it did not come online until 2014. In its Appendix 1, EPA estimates that this unit will generate 5.8 million MWh in future years, emitting 4.7 billion lbs of CO2 annually.16 EPA’s Goal Computation technical support document states that this unit has a capacity of 582 MW.17 Thus, EPA’s technical support documents imply this unit has a capacity factor of 114 percent and an emissions rate of 806 lbs per MWh. However, this same Goal Computation technical support document states an assumption of a 70 percent capacity factor for this plant along with an emissions rate of 800 lbs per MWh.18 We have assumed Kemper to be a 582 MW plant with an emissions rate of 800 lbs per MWh and 70 percent capacity factor. 3. CHECKLIST OF CONSIDERATIONS WHEN USING CP3T The following list of considerations should be referenced whenever a user designs an analysis and interprets results using CP3T. Note that this list is not exhaustive; users are responsible for ensuring that 2012 baseline data used for their state in CP3T is as accurate as possible, and that all assumptions for future years are reasonable. 15 16 17 18 Nuclear unit capacity and generation: As described above, a number of nuclear units are slated to be retired and several others have received approval from the Nuclear Regulatory Commission (NRC) to expand their generating capacity in future years. The user must ensure that if his or her state contains nuclear units, future capacities reflect all anticipated modifications. Furthermore, while EPA assumes all nuclear units (including those currently under construction) will be able to operate at a 90 percent capacity factor in all future years, it is unlikely that units will actually achieve this level of operation. Accuracy may also be improved by accounting for refueling outages; for example, since plants commonly operate on 18-month refueling cycles, the user could assume a somewhat lower capacity factor in every other year. Available at: http://www.epa.gov/airmarkets/progsregs/epa-ipm/docs/v513/NEEDS_v513.xlsx. Available at: http://www2.epa.gov/sites/production/files/2014-06/20140602tsd-state-goal-data-computation_1.xlsx. Available at: http://www2.epa.gov/sites/production/files/2014-06/documents/20140602tsd-goal-computation.pdf, page 6. Ibid., page 13. Synapse Energy Economics, Inc. Clean Power Planning Tool User Manual 13 “Under-construction” capital costs: EPA assumes that several nuclear and NGCC units not yet in operation are generating in its 2012 baseline. An important effect of this assumption is that these units capital costs are treated as “sunk”—zero for the purposes of modeling. If these plants were treated as still under construction, it would be possible to include their capital costs in modeling depending on the specific assumptions used. Sales assumptions: CP3T includes default 2012 sales data aggregated for each state from EIA Form 861. These data do not account for the sales reductions from any currently existing energy efficiency measures (i.e., they are not “reconstituted” sales). In addition, CP3T includes future sales forecasted using the AEO 2014 reference case, which is formulated using baseline energy efficiency measures. If the user assumes any energy efficiency, the user may be in effect claiming the impacts of this energy efficiency twice. If users choose to use user-input values, they may opt to replace the reference case growth rate with another AEO 2014 case with a growth rate that reflects increased electric sales (for example, the “High Economic” side case) in order to attempt to offset the impact of “business-as-usual” energy efficiency (see section 1.5 for more information about editing detailed background data assumptions). Capacity credits: A capacity credit is the amount of a resource’s peak generating capacity that can count toward peak demand plus reserve for reliability purposes. These are typically developed using forced outage rates, peak coincident factors, and a variety of other inputs. For renewables in particular, the capacity credits assigned to a resource differ significantly state-tostate. Users should be aware of their particular state’s treatment of each renewable resource’s capacity credit and use the best available information to determine the contribution of renewable capacity to peak. Impact of adjusting imports: CP3T is fundamentally a one-state model; it does not take account of any impacts on neighboring states of altered assumptions in the selected state. For example, increasing or decreasing the level of imports in net importing states does not take into account the effect on resource adequacy in neighboring states. When adjusting the values for a state’s level of net imports, users should be cognizant of the potential effects of these changes on neighboring states. EPA assumptions for unit-level emissions rates and generation: Because of the way EPA has aggregated annual unit-level generation for 2012, some fossil units have a negative value for electric generation in the baseline year. Negative generation is often a result of a unit operating in a “mothball” status in 2012, meaning the unit consumed a small amount of power in order to keep essential systems running (e.g., lighting, security). These units produced no generation, resulting in an emissions rate of zero pounds per MWh. Other units generated a small amount, causing a small level of carbon emissions, but had net negative consumption (i.e., the unit consumed more power than it produced). For these units, the emissions rate is negative. Units and their associated generation and emissions typically represent a small fraction of the total generation and emissions in a given state. However, uses should be aware whether their Synapse Energy Economics, Inc. Clean Power Planning Tool User Manual 14 selected state contains these units, and should make adjustments in future years based on whether these units are anticipated to continue to be net negative power producers, or are anticipated to retire. Implementing changes to capacities and capacity factors: CP3T’s default assumption is that the 2012 baseline for capacity, capacity factor, and emissions rate remains constant for each year. Users can affect the future performance of units by applying three different time series to each unit: one that changes a unit’s capacity, one that changes a unit’s capacity factor, and one that changes a unit’s CO2 emissions rate. Each of these changes must be entered for each year it is expected to occur in; for example, if the user anticipates a unit’s capacity factor to decline from its 2012 value of 80 percent to a 50 percent capacity factor beginning in 2020 and extending through 2030, the user must enter “50%” for each year between 2020 and 2030. Note that reducing a unit’s capacity factor to 0 percent is not equivalent to retirement: units with a 0 percent capacity factor will continue to contribute towards the state’s peak demand requirements and will continue to incur fixed costs. Users should model retirement by setting the unit’s capacity (not capacity factor) to zero for every modeled year in which it is retired. Note also that CP3T does not include default assumptions regarding expected fossil plant retirements. Users may enter “0” for any retiring unit’s capacity in each year it is assumed to be retired. Renewable energy costs: Current assumptions for renewable costs in CP3T include construction, operation, and maintenance of the generators themselves, but do not account for integration costs. Note that users should take care to account for integration costs for all new resources, including non-renewables. Users are encouraged to replace the default renewable costs wherever they have more relevant information (see section 1.5 for more information about editing detailed background data assumptions). Note that transmission and integration costs are not included in the renewable energy costs, nor are they included in the costs of constructing new 111(b) NGCC or NGGT generation. Users should adjust all generation costs if they anticipate additional transmission or integration to be a significant component of incremental generation costs. The cost of bundled RECs, on the other hand, do include transmission costs. They are calculated on a regional basis using sum of the regional unbundled REC cost plus the cost of a dedicated transmission line from the selected state’s region to the closest Class V wind resource. Revenue from RECs: While CP3T currently accounts for the costs of procuring out-of-state RECs, it is not currently set up to account for any revenues accrued from the sale of RECs. Mass-based target: As currently proposed, EPA’s Clean Power Plan allows for states to comply using a mass-based target. Current technical support documents do not detail state-specific mass-based targets, nor do they provide an explicit way to develop these targets. Although CP3T Synapse Energy Economics, Inc. Clean Power Planning Tool User Manual 15 does not currently analyze mass-based targets, effort has been taken to ensure future versions of the tool will include this capability. Synapse Energy Economics, Inc. Clean Power Planning Tool User Manual 16 4. NEXT STEPS AND CONTACT Synapse anticipates regular updates to CP3T in coming months. Future versions of CP3T may include the following: Upgrades to usability, model calibration, and model navigation Multi-state compliance Revisions to the dispatch algorithm, including tying together information on carbon prices and the displacement order, or developing a displacement order based on historical marginal emitters Revisions affecting the use of both new and existing “at-risk” nuclear generation for compliance with the Clean Power Plan Deployment of “suggested pathways” for compliance (i.e., a scenario in which EE is used to “fill in” generation gaps, or a scenario that optimizes for least costs) Integration of known historical and anticipated fossil unit retirements Integration of emission target rates and tool planning for U.S. tribes and territories Implementation of a mechanism to allow unit-level fuel-switching Implementation of a mechanism to allow states to switch from being net importers to net exporters and vice-versa To make other suggestions for updates to CP3T, or for technical help in using the tool, please email [email protected] Synapse Energy Economics, Inc. Clean Power Planning Tool User Manual 17 APPENDIX A. CP3T LICENSE AGREEMENT This work is licensed under a Creative Commons Attribution-ShareAlike 4.0 International License. You are free to: Share — copy and redistribute the material in any medium or format Adapt — remix, transform, and build upon the material for any purpose, even commercially. The licensor cannot revoke these freedoms as long as you follow the license terms. Under the following terms: Attribution — You must give appropriate credit, provide a link to the license, and indicate if changes were made. You may do so in any reasonable manner, but not in any way that suggests the licensor endorses you or your use. ShareAlike — If you remix, transform, or build upon the material, you must distribute your contributions under the same license as the original. No additional restrictions — You may not apply legal terms or technological measures that legally restrict others from doing anything the license permits. Notices: You do not have to comply with the license for elements of the material in the public domain or where your use is permitted by an applicable exception or limitation. No warranties are given. The license may not give you all of the permissions necessary for your intended use. For example, other rights such as publicity, privacy, or moral rights may limit how you use the material. The Clean Power Plan Planning Tool (“CP3T”) is a free and open source tool created by Synapse Energy Economics, Inc. (“Synapse”). CP3T is meant as a tool for performing “first-pass” planning of statewide compliance with EPA’s Clean Power Plan (commonly known as “111(d)”). Users should verify all inputs and assumptions before making use of CP3T’s outputs. Users may share and adapt CP3T and derivative work in any medium or format for any use, under the attribution terms outlined above. Synapse is not responsible and does not assume liability for any errors in CP3T’s input data or functions, nor is it responsible for any of the resulting output generated by its users. All responsibility for the validity of CP3T inputs are assumed by the user. By using CP3T, users agree to the following: 1. Reporting of any incorrect data or functions in CP3T to Synapse Energy Economics, Inc. Synapse Energy Economics, Inc. Clean Power Planning Tool User Manual 18 2. Assumption of responsibility for the validity of CP3T inputs. 3. Operation of CP3T under the attribution and ShareAlike terms outlined above. 4. Disclosure of the source of any resulting information (i.e., CP3T) and citation to the creators of the tool (i.e., Synapse). Please use the following citation: Clean Power Plan Planning Tool (“CP3T”). Synapse Energy Economics, Inc. Version 1.0. Available at www.synapse-energy.com. Synapse is not responsible and does not assume liability for any errors in CP3T’s input data or functions, or for any of the resulting output generated by its users. All later versions of CP3T shall contain this license and user agreement unless otherwise stated or modified. Synapse reserves the right to suspend or terminate any or all of this agreement at its own discretion, at any moment and for any reason, with no prior warning or liability. Version November 2014 Synapse Energy Economics, Inc. Clean Power Planning Tool User Manual 19 APPENDIX B. ESTIMATING GWH SAVINGS FROM SAVINGS AS A PERCENT OF SALES When creating an energy efficiency savings trend, users may choose to begin with an input of annual incremental savings as a percent of sales. When doing so, it is important for the user to consider the impacts of load growth and expiring energy efficiency measures. While CP3T does not currently have this capability, users may choose to utilize a document supplied by the EPA in its Clean Power Plan technical support documents. This appendix outlines how a user can use this file to translate annual incremental savings as a percent of sales into net cumulative GWh sales. 19 First, users must download the relevant file. Once it is downloaded, the user can open it and select his or her state. This can be done by going to the “IntermediateData” tab (Step 1), then selecting the user’s state from the dropdown in cell “B2” (Step 2). See Figure 7 for an example where South Carolina is selected. Figure 7. Selecting the desired state in the EPA Clean Power Plan technical support document Step 2 Step 1 Once the user has set the state, he or she can go to the “MainModule” page to adjust the user’s preset first-year savings trends. Edits can be made in row 18, as shown in Figure 8. In the EPA pre-set, 2017 savings start at the 2012 historical level, then increase by 0.20 percent per year until a maximum level of 19 Available at: http://www2.epa.gov/sites/production/files/2014-06/20140602tsd-ghg-abatement-measures-scenario1.xlsx. Synapse Energy Economics, Inc. Clean Power Planning Tool User Manual 20 1.5 percent is achieved. This appendix assumes a different load growth trend than CP3T; users should enter either the regional AEO 2014 trend from CP3T or the same user-defined trend in CP3T in row 12 of the page. Once these inputs are entered, users can then copy net cumulative savings from line 23 into the energy efficiency step of the CP3T workbook. Figure 8. Setting up the energy efficiency annual percentage and load growth trends exporting the net cumulative trend Step 5 Step 4 Step 6 Step 3 Synapse Energy Economics, Inc. Clean Power Planning Tool User Manual 21