1
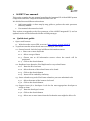
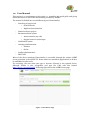
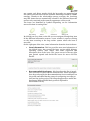
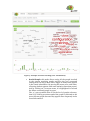
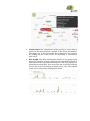
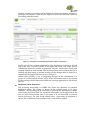
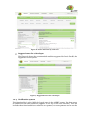
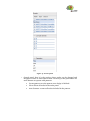
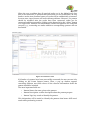
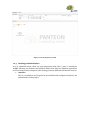
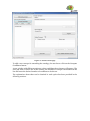
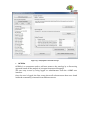
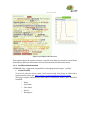
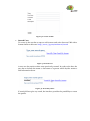
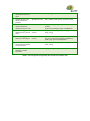
ALERT User Manual Contents Contents............................................................................................................................. 1 1 ALERT User manual ................................................................................................. 2 1.1 Quick start guide ................................................................................................ 2 1.2 User Manual....................................................................................................... 3 1.2.1 Searching of project info ................................................................................ 4 1.2.2 Statistics about a project ........................................................................... 11 1.2.3 Recommendation system .......................................................................... 12 1.2.4 Notification system .................................................................................... 13 1.2.5 Ontology administration ........................................................................... 21 1.2.6 Profiles administration ............................................................................. 29 1.2.7 REST API ................................................................................................... 31 1 ALERT User manual This section contains the user manual regarding the integrated UI of the ALERT system components and other components that have their own UI. It is divided into two different subsections: Quick start guide: A short step-by-step guide to perform the main processes offered by ALERT. User manual: the manual as itself. This section corresponds to the first prototype of the ALERT integrated UI, and an updated version will be delivered with the second prototype. 1.1 Quick start guide 1. Open a web browser. 1.1. Write down the correct URL to access (http://server_ip:port/AlertUI) 2. To perform searches select the tab more according to your needs. 2.1. General search: Look for bugs in different information sources 2.1.1. Enter one or more keywords 2.1.2. Select a range of dates 2.1.3. Choose one to all information sources where the search will be performed 2.1.4. Click on the Search button. 2.2. Duplicate issue detection: Find duplicated or very related issues 2.2.1. Enter the ID of an issue 2.2.2. Select the state of the related issues to be found 2.2.3. Click on the Search button 2.2.4. Issues will be ranked by similarity. 2.3. Issues related to my code: Find issues related to your own submitted code 2.3.1. Select the status of the issues to be found 2.3.2. Click on the Search button. 2.4. Suggest issues for a developer: Look for the most appropriate developer to assign an issue 2.4.1. Enter the developer’s name 2.4.2. Click on the Search button 2.4.3. Select one or more issues from the list that the user might be able to fix. 1.2 User Manual This section is a complement to the section 1.1, extending the quick guide and giving details about how to use all the functionality provided by ALERT. The manual is divided into seven different types of functionality: - Searching of project info o General Search o Duplicate issue detection - Statistics about a project - Recommendation system o Issues related to my code o Suggest issues for a developer - Notification system - Ontology administration o Annotex o Ocelot - Profiles administration - REST API Most of the above mentioned functionality is accessible through the unique ALERT access point that is the ALERT UI. Some others are standalone applications or APIs to be embedded in other tools. For accessing, the user must just open a browser (Chrome is the optimal choice, although Firefox is also acceptable) and type the URL with this format: http://server_ip:port/AlertUI. Following figure shows the ALERT home page. Figure 1: Alert Home Page Following sections detail every of the functional blocks of the system. 1.2.1 Searching of project info The searching mechanisms offered by ALERT includes a general search over all the project items (General Search), but also a focused search to detect potential duplicates by discovering related issues to an specific issue (Duplicate issue detection). General search: In this view (corresponding to the Figure 10 and home page of the UI), a user can perform different searches based on different criteria to look for project information in the different available sources: issue tracker, code repository, forum, mailing lists and wiki. In order to perform a search, the user can do it using all available options or just selecting a few of them. Following a description of different searching items in the screen: o A keyword field (first white box), where a user can introduce some keywords to be matched to keywords and concepts in the posts. For example, a name of a developer, a number of an issue, a programing language, etc o An auto-completion concept field (second white box), where the letters introduced by the user are auto-completed based on the existing concepts in the project knowledge base. o Dating field (Between-and), where a calendar is displayed to facilitate the selection of time framework in which searching for. o Type of information source (Check boxes). The user can mark those information sources she likes to include in her searching: issues, commits, forums, mailing lists or wiki. The Issues check box offers additionally the possibility to filter which type of issues you would like to see, just by clicking on the beside green box. The filtering is done according to the selected Status and Resolution level (see in figure 11 the different status and resolution levels that can be selected). The searching will only show those issues that are in the indicated status and resolution level. o Search button: Once all the searching parameters have been selected, the user clicks on Search green button and the searching results appear in a similar way that is shown in Figure 12. The searching can be sorted by Relevance and Date. The meaning of sorting by Date is trivial, but the sorting by Relevance means that the user will see the found items ordered according to how well the indicated keywords match with every result. This functionality is especially relevant when the set of searching results is so big that it is difficult to find something useful. Bear in mind that the system searches for all the meaning keywords introduced in the keywords boxes (the system discards those useless words such as conjunctions, articles, prepositions, etc, take just those that represent concepts). Additionally, in the popup window a check box is also available for indicating whether all the keywords must be optional or not. By default, all the keywords indicated in the keywords field are considered linked with an AND. By selecting “Keywords are optional”, the keywords are linked with an OR, so not all of them must appear in the searched items. Figure 2: By clicking popups The following picture (Figure 12) shows an example of searching results. It exemplifies a searching of appearances of powerdevil keyword, during last year in all sources except Forums, considering issues that are not closed nor fixed and ordered by relevance. Let’s explain then this view. Figure 3: Example of results searching (view Items) The results view offers two different ways of seeing the results. They are accessible through Items and Visualization tabs. For every kind of searching these two views will be always available. The Items view is shown in Figure 12 and by default. The Visualization view is shown later on in the document. o Items view (figure 12). This view has two areas: on the left part a list of found items resulting from the searching are shown. This list if items do not contain only direct results which the keywords are appearing but also other items inferred from the semantic knowledge stored by ALERT ontology. Thanks to the relationships among concepts, the searching may find items that are semantically related to the indicated keywords and not only restricted to the syntactic appearance of the words. The items are identified by symbols depending on the information source this item is coming from: Bug tracking Forum Subversion Mailing List By clicking on every item on the left you can navigate through that item in the different information sources. A new window is open at clicking on the item accessing to the bug tracker system where the item is recorded. On the right part of the view, some information about the item is shown: Item information: This box provides some met information of the clicked issue: who created the issue, project which belongs, operating system, issue status, date when registered and description text of the issue. The green arrows in the top right part permit expand and shrink the boxes for more and less details. Recommended developers: this box shows the list of people who could solve or deal with the selected issue. These developers have been selected by the Recommendation Service and based on the profile and skills that the system is configuring according to their activity in the project. The followed approach to analize the developers skills and build their profile is depicted in deliverables of WP4. o Related issues: This box lists all the related issues to the selected one. By clicking on each related issue, a new window is open with the searching results about that issue. List of comments: Finally the whole list of comments produced about this issue is listed by author. Visualization view: the system provides an alternative graphical view of the results shown in Figure 13. Three possible visualization modes are available. Figure 4: Example of results searching (view Visualization) Social Graph: this mode allows seeing all the people involved in the current searching results and how they are connected among them. As long a name font is bigger as many times appear in the found information. By moving the mouse over each name, a floating window appears with some statistics about that person. And by clicking on a concrete name, it is highlighted in red and her direct connected people in green. The +/- green symbols allow to fix the level of people relevance, that is, by clicking on minus symbol the graph is restricted to the more relevant people because they appear more frequently in the found information. Word cloud: this visualization mode provides a visual map of which are the most frequent concepts in the found information. The bigger size of the concept the more frequent is the concept. By clicking on one of the words, the searching is restricted to such word. Bar Graph: The third visualization mode is a bar graph which shows the number of posts related to the searched keyword in different periods of the selected timeframe. This view provides an interactive zoom facility. If an area of the bar is selected with the mouse, the zoom is in and more detail can be seen. The original zoom can be restored by clicking Reset Zoom Another example of searching can be looking for all the information related to a developer, for instance, Dario Freddi. Figure 14 shows the obtained results by proceeding with this search. Figure 5: Example of searching information about a developer In this case all the commits submitted by this developer are shown in the left side of the view. For each commit, in the right side of the view, some generic information about the commit is presented, but also all the files, classes and methods related to such commit. The interface allows you to click on the file or method and then seeing in another window all the changes done in that file or method and the people that have been working on it. ALERT thus provides a way of navigating through all the information of a project in an interrelated manner, since all the information sources are related by the ontology which interconnect different concepts appearing in the diverse sources. Duplicate issue detection: The searching mechanism in ALERT also allows the detection of potential duplicated issues. The Figure 15 shows all the related issues to an issue identifier. The searching can be restricted by selecting the Resolution or Status of the issues desired to find. The visualized information on the right side of the view for each found related issue is the same as it was described in General Search previously. For each found related issue, a percentage of similarity is shown. The Visualization tab provides social, word and bar graphs. Figure 6: Duplicate issue detection 1.2.2 Statistics about a project Another view provided by ALERT user interface is under Project Overview tab. This is a view very practical for having a quick and overall view of what is happening in a project at a glance. This view can be useful not only for developers but also for project managers. The view extracts information from code repository and issue tracker and shows several graphics with the number of commits, committers, branches and files from code repository; and the number of opened, closed and changed issues and number of openers, closers and changers from the issue tracker. The data is viewed along the timeline it was produced and moving the mouse over all the graphs a floating window shows the figures of the selected point. Figure 7: Project statistics 1.2.3 Recommendation system The recommendation system extracts information about the developers of a project about the commits they do or the issues they solve, for example, and build a profile for them. Based on this profile, the system is able to suggest issues to the developer and to find all the issues related to his/her code. Thus the two views related to this functionality require the authentication of the user in the ALERT user interface by Login tab. When the user is logged the user’s email is placed in the top right corner of the user interface. Issues related to my code The Figure 17 shows all the issues related to the logged user, the methods that this user modified and stack traces of the code. Figure 8: Issues related to my code view Suggest issues for a developer The Figure 18 shows the recommended modules suggested for Dario Freddi, the logged user in the system. Figure 9: Suggested issues for a developer 1.2.4 Notification system This functionality is only visible for logged users in the ALERT system. For these users an additional tab name Subscribe appears in the top of the user interface. This tab includes three functionalities to subscribe to a pattern, to create patterns and to see the list of notifications for the logged user. A pattern is a way to define an event in the system and associate some action to it. Manage Notifications In this view, if the “all Patterns” check box is selected, the user can see a list of all available patterns in the system. In case “my Patterns” is selected only those patterns which were created by the user are listed. Figure 10: Managing notifications If a user wants to subscribe to a notification pattern he/she has to click on the desired pattern and all its information will be shown in the right side of the screen. For the selected pattern, the user may subscribe or unsubscribe of this pattern and can decide the way in which he/she wants to receive the notification: message, email, instant message or RSS feed. In case the selected option is email, the user has to write the email when he/she wants to receive the notifications. Once finished, just click on the update button to subscribe to the notification pattern. Figure 11: Subscribe to a pattern To check if the subscription has been correctly performed, the user has to check the list of patterns to see if it is marked as subscribed. Message box Here the list of messages for that user is shown. The date/time of the notification, the detected pattern and the content of the message are described for each message. Figure 12: Message box for a user Pattern designer By this tab, the Panteon editor is accessible. Here the user can define new patterns for notification. There are two different tabs to perform the actions: Pattern designer tab, that it is composed of different panels: o Node panel: It is situated on the left side of the screen, where all nodes that can be chosen by a user to create patterns are shown. The node connections are divided into different categories: Events: simple events from source tools, NewCommit, New Issue, NewMail, NewPost, etc. such as Complex Events: events created as a result of the situation of interest defined in Panteon. Complex events can be used as an input for their events as well. Some specific complex events can be used in order to trigger other ALERT components, i.e. for real-time duplicate detection or developer recommendations. Operation: logical connectors. Connectors. Figure 13: Events panel o Central panel, that it is the section where nodes can be dragged and dropped in order to interconnect them. At the top of the panel there are some buttons to operate with patterns: Create pattern: save the pattern once design is finished. Clear: delete all nodes in the main panel. Auto Connect: connect all nodes included in the pattern. Figure 14: Central panel o Suggestion panel: This panel includes some patterns already created that can be useful for users. Figure 15: Suggestion panel In order to create a pattern, the user should drag the nodes to the Main Panel. Figure 16: Pattern Editor Usability One user can add as many nodes as needed in order to create his/her own pattern. Figure 17: Configuring events When the user considers that all required nodes are in the Main Panel, they have to be connected. To perform this action there are two possibilities, do it by hand or use the Auto Connect button, all nodes will be automatically connected. In most cases, Auto Connect will work without problems. However, if a pattern should be modified after the nodes have been connected, nodes can be connected and disconnected by clicking on the button left to the “delete” button of a single node. Panteon will automatically ensure that patterns are connected correctly, e.g., connecting two nodes without a corresponding operator will not be allowed. Figure 18: Connect events If all nodes of a pattern have been successfully connected, the user can save it by clicking on the Create Pattern button. Then, a pop up window appears containing different text fields where all the relevant information about the pattern should be included. The most important fields are: o Pattern Name: the name given to the pattern. o Pattern Description: a short description about the pattern purpose. o Pattern Tags: key words to identify the pattern. This information will be useful to identify the patterns that better fulfil user’s needs while performing a search. Figure 19: Save pattern Search tab: Users can search patterns previously created. In this tab, the user has to include the parameters in order to perform the pattern search. There are different fields where to include different criteria to find a specific pattern. o Pattern Domain: domain related to the pattern. o Priority: priority given to the pattern. o Visibility: visibility of the pattern. o Status: current status of the pattern. o Description: key words to find a pattern which description best fits with them. o Tags: key words. o Dates: interval of time. Figure 20: Search pattern result 1.2.5 Ontology administration As it is explained before, there are two components that allow a user to extend the ALERT ontology: the Annotex and OCELOt. Both tools offer two different approaches for discovering of new concepts for the ontology from the different information sources. Annotex This is a standalone tool required to be installed and configured locally by the administrator of the project. Figure 21: Annotex main page To add a new concept for extending the ontology, the user has to click on the Compute Candidates button. A new window with different options to select candidates from clusters will appear. The user just need to select one of the clusters, the method of concept extraction from the list and insert the desired number of candidates to be shown. The explanation about what can be obtained in each option has been provided in the following sections. Figure 22: Add a new concept Once the method for selecting groups of concept has been chosen, a new pop up window will appear showing a list of tags to be selected that will be taken into account when performing clustering. Figure 23: Select a new concept Once all the desired tags have been selected, the candidate concepts will be shown on the left side of the window. To display all the available information about a concept, just click on it and it will be displayed at the right side of the screen. This information can be extracted automatically or can be added by the user itself. Figure 24: Concept information Once all the fields have been filled up the user just has to click on the Add/update selected concept to add this new concept to the ontology or to update an existing one. Figure 25: Add/update selected concept OCELOt OCELOt is a component used to add new terms to the ontology by a discovering approach based on the analysis of concepts from natural language. The user may access by being logged as administrator from the ALERT user interface. Once the user is logged, the first screen shows all relevant terms that were found inside the community, extracted from different sources. Figure 26: OCELOt terms tag cloud In this tag cloud all discovered terms from the textual information sources are showed, both terms included and not included in the ontology. So the user can decide to include a new term or not, depending on the appearance frequency. To display the information about a term, just click over it and a new table will appear in the right side of the screen. There, the user can see the available information about a concrete term: Name: the name of the selected term Lemma: the lemma of the selected term Occurrence: the number of occurrences found for this term in the different sources Post-tag Potential SameAs relations: a list of links to be selected where possible relations with dbpedia terms are shown. Potential SubClass of In order to add this term to the ontology, the user has to click on the Add button. If the term has been added before, this button will appear disabled. Figure 27: Include a new term If the term has been correctly added, a pop up window will be displayed showing a message. Figure 28: Confirmation window Apart from showing the information about a concrete term, there is another tab where the user can see the number of occurrences of a specific term in concrete dates. Figure 29: Graphic of Occurrences This graphic shows the number of times a specific term has been found in several dates analysing the different information sources, both structured and unstructured. 1.2.6 Profiles administration STARDOM is the component responsible for managing the developers´ profiles. Create Profile To access it, the user has to open a web browser and write down an URL with a format similar to this one: http://server_ip:port/stardom-ui/profile/create This page contains different text fields where information about a user should be included: o Name o Last Name o User Name o E-mail o Description Figure 30: Create Profile Search User To access it, the user has to open a web browser and write down an URL with a format similar to this one: http://server_ip:port/stardom-ui/search Figure 31: Search User A user can also retrieve other users previously created. In order to do that, the user has to include the name or last name of a person which he/she wants to find information about. Figure 32: Search by Name If search did not give any result, the interface provides the possibility to create the profile. Figure 33: User didn't find view The search result will be shown in a table; it will contain the e-mails associated with the user and different metrics about the activity of the user in the project. Figure 34: Search result view 1.2.7 REST API The ALERT's REST API, which has been named Hound (after a special type of dogs frequently used for search tasks), provides a simple search interface to query the information compiled and generated by ALERT about the project(s). Probably, the most powerful feature of this API is that allows to integrate third-party tools with the ALERT platform. For instance, this functionality can be embedded in the bug tracker system of the developer to interact directly with it. To access it, the user has to use the next base URL: http://server_ip:port/hound/search/ This page will show (Figure 44) a basic web form that provides an interface for querying the ALERT platform. The next list shows the different type of information that can be retrieved: Commit information: Descriptive information and references found in issues for that commit, in response to a commit URI. All commits for a product: List and brief description of all commits related to a the product name introduced in the request. Issue information: Descriptive information, as well as references (in commits, forum posts, email messages or other issues) to the issue ID provided in the request. Issues for a product: Response contains the list of issues related to the product name introduced in the request. Issues for a method: List of issues related to the method in source code whose name was provided in the request. Developers for an issue: List of developers suggested to solve the issue with the ID provided in the request. ore than one issue ID is provided, the list of Issues for a developer: List of issues suggested for the developer whose UUID was introduced in the request. Issues similar to a given issue: List of issues and similarity weight (between 0 and 1) similar to the issue with ID introduced in the request. Issues related to keywords: List of issues related to the keywords provided in the request. Requests to the REST API take the form of standard HTTP GET petitions, according to the design principles of RESTful interfaces and the retieved results are in JSON format. The available parameters accepted in the call are: issue_id = numerical id of the issue to be retrieved. commit_uri = URI of the commit to be retrieved. commit_option = string with the type of query related to commits [info|prod] info = get information about a commit. prod = get all commits related to a product. issue_option = string with the type of query related to issues [ext|sim|sug] ◦ ext = get extended information about an issue. ◦ sim = get other issues related to this one. ◦ sug = suggest developers that could work on this issue. keywords = list of related keywords, liked with '+'. method_uri = URI of the method. product = string with the name of the product. developer = UUID of the developer. from_date = filter search results from this starting date. to_date = filter search results up to this end date (still not in use) . Table 2 presents the list of all available requests currently accepted by the REST API, along with an example HTTP GET request for each type. BASE_URL stands for the URL at which the search service can be accessed # Request type Information source Example request 1 Retrieve description and associated information about a commit. Metadata service http://BASE_URL/query/?commit_option=in fo &commit_uri=http://www.alertproject.eu/ontologies/alert_scm.owl#Commit1 2 Retrieve the complete list of all commits related to a product Metadata service http://BASE_URL/query/?commit_option=pr od &product=solid 3 Obtain description, Metadata service http://BASE_URL/query/?issue_option=ext&i and available annotations about an issue ssue_id=55 4 Obtain the list of all issues related to a product Metadata service http://BASE_URL/query/?product=solid 5 Obtain the list of all Metadata service issues related to a method in source code 6 Get list of suggested developers to solve an issue Recommendation http://BASE_URL/query/?issue_option=sug& service issue_id=55 7 Get list of suggested issues for a developer Recommendation http://BASE_URL/query/?developer=ff9dc34 service d-774e-47ad-9eab-07c46ab3e765ff0df1c44c8d-4703-97ea-267d83b4ac08 8 Retrieve list of other issues that are similar to a given issue KEUI http://BASE_URL/query/?issue_option=sim& issue_id=55 9 Retrieve list of issues related to certain keywords KEUI http://BASE_URL/query/?keywords=sound http://BASE_URL/query/?method=http://ww w.alertproject.eu/ontologies/alert.owl#Method1 Table 1: List of requests accepted by the search service REST API Figure 35: Search API web form