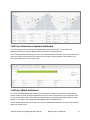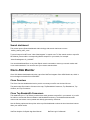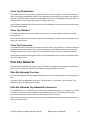
1
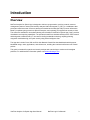
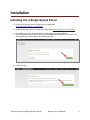
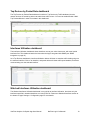
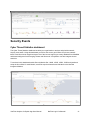
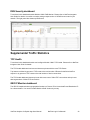
NetFlow Analytics for Splunk User Manual Version 3.5.1 September, 2015 © Copyright 2012-2015 NetFlow Logic Corporation. All rights reserved. Patents Pending. Contents Introduction ................................................................................................................................................. 3 Overview ................................................................................................................................................... 3 Installation ................................................................................................................................................... 4 Installing into a Single Splunk Server ....................................................................................................... 4 Step 1 ................................................................................................................................................. 5 Step 2 ................................................................................................................................................. 6 Installing into a Distributed Splunk Environment ...................................................................................... 7 Configuring Indexers ............................................................................................................................. 7 Configuring Universal Forwarders with NFI .......................................................................................... 8 Configure Universal Forwarder Output (Target Indexers).................................................................. 8 Configure Universal Forwarder Input ................................................................................................. 9 Receiving Syslogs Directly from NFI .................................................................................................. 9 Configuring Universal Forwarder with syslog-ng or rsyslog ............................................................... 9 Administration ........................................................................................................................................... 10 Devices and SNMP polling...................................................................................................................... 10 List of Devices ..................................................................................................................................... 10 SNMP Integration ................................................................................................................................ 10 Configuration ........................................................................................................................................... 10 Configuring Hunk 6.2 ................................................................................................................................ 10 Dashboards ............................................................................................................................................... 11 Access the App NetFlow Analytics for Splunk ........................................................................................ 11 Default Dashboards ................................................................................................................................ 11 Dashboards navigation overview ............................................................................................................ 12 Dashboard overview ............................................................................................................................... 12 NetFlow Logic > Traffic Overview dashboard ......................................................................................... 13 Bandwidth by Hosts ................................................................................................................................ 13 Traffic by Source IP dashboard........................................................................................................... 13 Traffic by Destination IP dashboard .................................................................................................... 14 Traffic by Protocol and Port ................................................................................................................. 15 Traffic by Host Pairs dashboard .......................................................................................................... 15 Reports ................................................................................................................................................ 16 Traffic by Subnets dashboard ............................................................................................................. 16 Traffic by Protocol dashboard ............................................................................................................. 17 Connections dashboards .................................................................................................................... 18 Bandwidth by Network Devices .............................................................................................................. 18 Top Devices by Traffic dashboard ...................................................................................................... 18 Top Devices by Packet Rate dashboard ............................................................................................. 19 Interfaces Utilization dashboard .......................................................................................................... 19 Watched Interfaces Utilization dashboard .......................................................................................... 19 Interface Groups dashboard ............................................................................................................... 20 Services................................................................................................................................................... 20 Service Response Time dashboard .................................................................................................... 20 Asset Access Monitor .......................................................................................................................... 20 NetFlow Analytics for Splunk App User Manual NetFlow Logic Confidential 1 Security Events ....................................................................................................................................... 21 Cyber Thread Statistics dashboard ..................................................................................................... 21 DNS Security dashboard ..................................................................................................................... 22 Supplemental Traffic Statistics ................................................................................................................ 22 TCP Health .......................................................................................................................................... 22 GEO IP Monitor dashboard ................................................................................................................. 22 Traffic by Autonomous Systems dashboard ....................................................................................... 23 Traffic by CBQoS dashboard .............................................................................................................. 23 Search dashboard ............................................................................................................................... 24 Cisco ASA Monitor .................................................................................................................................. 24 Cisco Overview ................................................................................................................................... 24 Cisco Top Bandwidth Consumers ....................................................................................................... 24 Cisco Top Destinations ....................................................................................................................... 25 Cisco Top Violators ............................................................................................................................. 25 Cisco Top Connectors ......................................................................................................................... 25 Palo Alto Networks .................................................................................................................................. 25 Palo Alto Networks Overview .............................................................................................................. 25 Palo Alto Networks Top Bandwidth Consumers ................................................................................. 25 Palo Alto Networks Top Destinations .................................................................................................. 26 Palo Alto Networks Top Violators........................................................................................................ 26 Palo Alto Networks Top Connectors ................................................................................................... 26 Top Applications .................................................................................................................................. 26 Top Applications and Users ................................................................................................................ 26 Resources .................................................................................................................................................. 27 FAQ ......................................................................................................................................................... 27 Getting help ............................................................................................................................................. 27 NetFlow Analytics for Splunk App User Manual NetFlow Logic Confidential 2 Introduction Overview NetFlow Analytics for Splunk App is designed to deliver next generation, real-time, network resource management power to network and security analysts. NetFlow Integrator™ (“NFI”) is a middleware that processes massive amount of flows to stream summarized and meaningful CIM (“Common Information Model”) compliant syslog events into Splunk Enterprise, and, optionally, all original flow records to Hunk. The events are available for immediate indexing and correlation. NetFlow for Splunk App (“App”) provides visualization and reporting capabilities. The operators benefit from detailed visibility to their entire network and being able to address many IT use cases including bandwidth monitoring, capacity planning, congestion troubleshooting, and cyber security using threat intelligence lists. The App also includes Cisco ASA and Palo Alto Network firewall flow data dashboards which present bandwidth usage, users, applications, and violators etc, enabling the continual reinforcement of firewall policies. This guide is intended for network and security analysts who use the App to monitor and investigate problems. For additional NFI information please visit www.netflowlogic.com. NetFlow Analytics for Splunk App User Manual NetFlow Logic Confidential 3 Installation Installing into a Single Splunk Server 1) Download Technology Add-on for NetFlow from Splunkbase https://splunkbase.splunk.com/app/1838/ 2) Download NetFlow Analytics for Splunk from Splunkbase https://apps.splunk.com/app/489/ 3) Depending on the OS of the server that is running Splunk, follow the installation recommendations from the Splunk website to install both Technology Add-on and NetFlow for Splunk application. Restart Splunk after installing the App. 4) Launch the App NetFlow Analytics for Splunk App User Manual NetFlow Logic Confidential 4 5) The first time you run the app from the web UI, you will be presented with a setup screen: If you need to alter the index, please follow these steps: a) Create directory $SPLUNK_ROOT/etc/apps/netflow/local/ if it doesn't exist b) Create file $SPLUNK_ROOT/etc/apps/netflow/local/macros.conf with following lines: [netflow_index] definition = index=your_index sourcetype=flowintegrator c) Save $SPLUNK_ROOT/etc/apps/netflow/local/macros.conf and restart Splunk to changes take effect You can setup this app by following the steps below. Once you have reviewed the setup steps, click on the "Enable" button. Step 1 This App relies on NetFlow Integrator software. To download a free trial of NetFlow Integrator, please visit https://www.netflowlogic.com/downloads/. NetFlow Analytics for Splunk App User Manual NetFlow Logic Confidential 5 Step 2 Get more value out of NetFlow by enabling additional inline analytics in NetFlow Integrator and enabling the corresponding Splunk App panels under Settings > Configuration. NetFlow Analytics for Splunk App User Manual NetFlow Logic Confidential 6 Installing into a Distributed Splunk Environment If you have Splunk distributed environment (separate search heads / indexers / forwarders), install both Technology Add-on and NetFlow for Splunk App on Search Head. Install Technology Add-on on Indexers. Install NetFlow Integrator (and optional syslog-ng or rsyslog) with Universal Forwarder. Configuring Indexers Make sure your Indexers are enabled to receive data from Universal Forwarder: 1. Log into Splunk Web as admin on the Indexer that will be receiving data from a forwarder 2. Click the Settings link at the top of the page 3. Select Forwarding and receiving in the Data area 4. Click Add new in the Receive data section 5. Specify which TCP port you want the receiver to listen on. Default value is 9997 6. Click Save. You must restart the instance to complete the process NetFlow Analytics for Splunk App User Manual NetFlow Logic Confidential 7 Configuring Universal Forwarders with NFI Configure Universal Forwarder Output (Target Indexers) During the installation of the Universal Forwarders a Receiving Indexer can be configured, as it can be seen here: It is an optional step during the installation. If it was not configured or if load balancing is required, additional Receiving Indexers can be added later by adding to the %SPLUNK_HOME%/etc/system/local/outputs.conf file: [tcpout] defaultGroup = default-autolb-group [tcpout:default-autolb-group] server = 10.1.0.100:9997,10.1.0.101:9997 Restart Splunk Universal Forwarder With a setup like this, load balancing is configured, the events are sent to 10.1.0.100:9997 and 10.1.0.101:9997 More info about load balancing : http://docs.splunk.com/Documentation/Splunk/latest/Forwarding/Setuploadbalancingd#How_load_balanci ng_works NetFlow Analytics for Splunk App User Manual NetFlow Logic Confidential 8 Configure Universal Forwarder Input The inputs can be configured in the following file: %SPLUNK_HOME%/etc/system/local/inputs.conf In general there are two options, either to listen directly for netflow events on a specific port or optionally to monitor files created by syslog-ng or rsyslog. Receiving Syslogs Directly from NFI inputs.conf file example (NFI sends data on a UDP port 10514): [udp://10514] sourcetype = flowintegrator index = flowintegrator Configuring Universal Forwarder with syslog-ng or rsyslog In this scenario syslog-ng or rsyslog are configured to listen to syslogs sent by NFI on a UDP port 10514. Syslog-ng or rsyslog are usually writing the logs into configurable directories. In this example we assume that those are written to /var/log/netflow. inputs.conf file example (NFI sends data on a UDP port 10514 to syslog-ng or rsyslog): [monitor:///var/log/netflow] sourcetype = flowintegrator index = flowintegrator N.B. It is very important to set sourcetype=flowintegrator and to point it to the index where Netflow Analytics for Splunk App is expecting it. NetFlow Analytics for Splunk App User Manual NetFlow Logic Confidential 9 Administration Under Settings you may find additional information about various options and configuration of the App. Devices and SNMP polling List of Devices List of devices feature is introduced to improve performance of the App. Every 30 minutes a job runs to create a summary index “flowintegrator_exp_ips”, which is used to populate Device IP drop down on various dashboards in the App. SNMP Integration NetFlow records contain very limited information about network devices and interfaces. This application takes advantage of SNMP information provided by NFI special Module – SNMP Information Monitor, which poles the following information from network devices: device name, name of interfaces and their speed. Once this information is obtained by polling network devices, % of utilization of interfaces is computed and displayed to the users on the application dashboards. Make sure that NFI SNMP Information Monitor Module is enabled. Configuration This screen allows you to enable additional dashboards in the App, and contains description of NFI Modules that need to be enabled to feed data to corresponding dashboards. Configuring Hunk 6.2 1. In Hunk Web, select Manager > Virtual Indexes in the menu bar. 2. Click the Provider tab (if it is not already selected) and click New Provider. 3. Fill in the following fields: Name – any string Java Home - /usr/lib/jvm/jre-1.7.0 Hadoop Home - /opt/Hadoop Hadoop Version – Hadoop 2.x (Yarn) File System – hdfs://%HDPIP%:8020 Resource Manager Address - %HDPIP%:8050 Resource Scheduler Address - %HDPIP%:8030 HDFS Working Directory - /user/root/splunkmr 4. Select Manager > Virtual Indexes in the menu bar. NetFlow Analytics for Splunk App User Manual NetFlow Logic Confidential 10 5. Click the Virtual Index tab (if it is not already selected) and click New Virtual Index. 6. Fill in the following fields: Name – any string Paths - /user/flume/netflow-syslog 7. Click Save to save your index and return to the Virtual Indexes page. Dashboards Access the App NetFlow Analytics for Splunk This guide assumes that Splunk v6.x and NetFlow Analytics for Splunk App v3.5 have been installed on your organization and that you have been assigned a Splunk username and password. It also assumes that NFI and the App have been set up and configured. Contact your system administrators if they have not. 1. Log onto Splunk Web using your Splunk username and password. 2. Click on Splunk Home and click the NetFlow Analytics for Splunk App. You will see the Overview page. The Overview page presents a summary of your network. You can customize any dashboard. See Default Dashboard section. 3. Use the Hosts, Network Devices, Services, Security Events, Other Traffic Statistics, Cisco ASA Monitor, Palo Alto Network dashboards for detailed investigation, filtering and drill-downs. All dashboards in this App are based on Splunk Web Framework using simple XML. Refer to http://docs.splunk.com/Documentation/Splunk/latest/Viz/WebFramework for an overview of Dashboards and Visualization. Default Dashboards When you install and enable the App, several dashboards are available by default. All these dashboards are based on data sent to Splunk by NFI Module 10067: Top Traffic Monitor. They are: NetFlow Logic > Traffic Overview Bandwidth by Hosts > Traffic by Source IP Bandwidth by Hosts > Traffic by Destination IP Bandwidth by Hosts > Traffic by Protocol and Port Bandwidth by Hosts > Traffic by Protocol Bandwidth by Hosts > Reports NetFlow Analytics for Splunk App User Manual NetFlow Logic Confidential 11 Bandwidth by Network Devices > Top Devices by Traffic Bandwidth by Network Devices > Interface Utilization Search > Traffic Timeline Settings You can get more value out of the App by enabling additional dashboards. Go to Settings > Configuration, and place a checkbox for the selected dashboards. Please make sure that the corresponding NFI Modules are enabled and configured. Here are some of the dashboards you will be able to enable. Dashboards navigation overview The application navigation bar is displayed toward the top of the UI and offers drop-down menus. Dashboard overview Every dashboard has different filters at the top of the screen to enable further narrowing of the report. For example, the Traffic by Protocol and Port dashboard can be filtered by the device group, device, source IP/mask, destination IP/mask, protocol, source port, destination port, source DSCP, destination DSCP, input and output interfaces, and time range. NetFlow Analytics for Splunk App User Manual NetFlow Logic Confidential 12 Please note that source and destination IP/mask filters could be specified as subnets (IP/mask), as full IP addresses (199.45.1.45), or as a partial IP address (199.45.1.*). NetFlow Logic > Traffic Overview dashboard The Overview dashboard is the top view, aimed to provide a summary on traffic over a time period. The views can be filtered by the Device Group, Device and Time Range. The panels show Top Traffic by Source IP, Top Traffic by Destination IP, Top Traffic by Protocol and Port, Top Traffic by Protocol, Top Traffic by Protocol, Top Devices by Traffic, Top Interfaces by Traffic by Device. Bandwidth by Hosts This section covers the dashboards and reports for monitoring traffic to and from hosts in your network, such as top talkers, top listeners, top host pairs, and many others. Traffic by Source IP dashboard The Traffic by Source IP dashboard (a.k.a. Top Talkers) monitors host which generate most traffic in your network. It is useful for real time or historical network utilization and bandwidth monitoring. The dashboard shows traffic speed and volume, as well as packet rate and connections generated by each host. NetFlow Analytics for Splunk App User Manual NetFlow Logic Confidential 13 Use the filtering options and time picker at the top of the dashboard to select the time interval and narrow down your search results. The Traffic by Source IP dashboard allows viewing talker traffic details – just click on the talker host IP or name, and drill down panel opens below showing all traffic destinations, including ports, network device interfaces, and traffic and packet rate details. Traffic by Destination IP dashboard The Traffic by Destination IP dashboard (a.k.a. Top Listeners) monitors host which receive most traffic in your network. As Traffic by Source IP, it is useful for real time or historical network utilization and bandwidth monitoring. The dashboard shows traffic speed and volume, as well as packet rate and connections received by each host. Use the filtering options and time picker at the top of the dashboard to select the time interval and narrow down your search results. NetFlow Analytics for Splunk App User Manual NetFlow Logic Confidential 14 The Traffic by Destination IP dashboard allows viewing listener traffic details – just click on the listener host IP or name, and drill down panel opens below showing all traffic sources, including ports, network device interfaces, and traffic and packet rate details. Traffic by Protocol and Port The Traffic by Protocol and Port dashboard monitors traffic in your network by Service Name and Transport Protocol Port Number (a.k.a Destination port). The App is packaged with services.csv lookup file, which is used to display the service name and protocol, according to IANA: (http://www.iana.org/assignments/service-names-port-numbers/service-names-port-numbers.xhtml). Traffic by Host Pairs dashboard The Traffic by Host Pairs dashboard shows consolidated bidirectional flows, sorted by traffic volume. You need to enable Module 10064: Top Pairs Monitor in order to see data in this dashboard. The Traffic by Host Pairs dashboard contains a timeline panel showing top 10 host pairs’ traffic by volume, and the table showing top 100 host pairs with details, such as traffic volume and speed, packet rate, and connections count. NetFlow Analytics for Splunk App User Manual NetFlow Logic Confidential 15 Reports Reports section contains dashboards built to be printed or exported to PDF. The following reports are available today: Top Talkers Top Listeners Top Host Pairs Traffic by Subnets dashboard The Traffic by Subnets dashboard monitors subnets specified in NFI Module 10011: Network Subnets Monitor configuration. Please refer to NetFlow Integrator User Guide for details. The Traffic by Subnets dashboard is useful for real time and historical monitoring of bandwidth utilization in specified subnets. The dashboard shows traffic In, Out, and in Both directions. Traffic for the top 10 by traffic volume monitored subnets is shown in timeline panels. The table below shows for each subnet such details as Source IP, Traffic speed and volume by direction, as well as packet rate information. NetFlow Analytics for Splunk App User Manual NetFlow Logic Confidential 16 Traffic by Protocol dashboard The Traffic by Protocol dashboard monitors traffic in your network by transport protocol, going through each of the network devices. It is useful for real time or historical monitoring of you traffic composition. The App is packaged with protocols.csv lookup file, which is used to display the protocol name and number, according to IANA: (http://www.iana.org/assignments/protocol-numbers/protocol-numbers.xhtml). Use the filtering options and time picker at the top of the dashboard to select the time interval and narrow down your search results. The Traffic by Protocol dashboard allows viewing traffic details for each protocol – just click on the protocol in the table below the graph, and drill down panel opens below showing all traffic details for the selected protocol, including source and destination hosts and port numbers, network device interfaces, and traffic speed and volume, packet rate, and connections. NetFlow Analytics for Splunk App User Manual NetFlow Logic Confidential 17 Connections dashboards Traffic dashboards described in the previous sections are based on NFI Modules that consolidated flow data and report top hosts by volume (Modules 10011, 10064, 10067 – default Module). Connections dashboards are based on NFI Module 10063, which reports top hosts by the number of connections regardless of traffic volume. There four dashboards to monitor host by connections. Connections by Source IP Connections by Destination IP Connections by Protocol and Port Connections by Protocol These dashboards contain graphs and table with traffic details similar to corresponding Traffic dashboards. Bandwidth by Network Devices In comparison to Host dashboards, which are host centric, the Network devices dashboards are device (routers, firewalls, VLAN’s) centric, tracking the ingress and egress traffic. Top Devices by Traffic dashboard The Top Devices by Traffic dashboard monitors network devices with most traffic in your network. It is useful for real time or historical network utilization and bandwidth monitoring. The dashboard shows traffic speed and volume, as well as packet rate traversing each network device. Use the filtering options and time picker at the top of the dashboard to select the time interval and narrow down your search results. The Top Devices by Traffic dashboard allows viewing network traffic details – just click on one of the devices, and drill down panel opens below showing traffic composition by each interface. Further th drilldown shows traffic speed statistics (Min, Max, Average, Standard Deviation, 95 Percentile), and hosts communicating over the selected interface. NetFlow Analytics for Splunk App User Manual NetFlow Logic Confidential 18 Top Devices by Packet Rate dashboard The Top Devices by Packet Rate dashboard is similar to Top Devices by Traffic dashboard, but the network devices are sorted by packet rate rather than traffic volume. You need to enable Module 10068: Top Packets Monitor in order to see data in this dashboard. Interfaces Utilization dashboard The Interfaces Utilization dashboard shows interfaces across your entire data center, with most loaded interfaces first. This dashboard works the best when the App is integrated with SNMP (see SNMP Integration on page 10). As in Top Devices dashboards, Interfaces Utilization allows drill down to examine traffic details going over the selected interface. Click on an interface, and panels below will show traffic speed statistics, and hosts communicating over the selected interface. Watched Interfaces Utilization dashboard The Watched Interfaces Utilization dashboard is very similar to Interface Utilization, but shows only the interfaces specified in watched-interfaces.csv lookup CSV file. Please see Watched Interfaces section at the bottom of App’s Settings > Configuration page for more details. NetFlow Analytics for Splunk App User Manual NetFlow Logic Confidential 19 Interface Groups dashboard This dashboard shows consolidated information for Interface Groups. Interface Groups are defined in interface-groups.csv lookup CSV file. Please see Interface Groups section at the bottom of App’s Settings > Configuration page for more details. Services Services dashboards enable users to monitor performance and traffic statistics of selected services in your datacenter. You need to enable corresponding NFI Modules in order to see data in these dashboards. Service Response Time dashboard To see data in this dashboard enable and configure Module 10017: Service Performance Monitor. Please refer to NetFlow Integrator User Guide for details. Use Watch List parameter in this Module to specify the services you want to monitor (Service Destination IP, Destination Port, and Transport protocol). Asset Access Monitor To see data in this dashboard enable and configure Module 10014: Asset Access Monitor. Please refer to NetFlow Integrator User Guide for details. This dashboard shows top services with most unauthorized connections - traffic from unauthorized users to services (IP address, destination port, protocol configured in the NFI Module 10014: Asset Access Monitor) and top peers with most unauthorized connections – traffic to peers (IP address and subnet mask also configurable in NFI Module 10014 section). NetFlow Analytics for Splunk App User Manual NetFlow Logic Confidential 20 Security Events Cyber Thread Statistics dashboard The Cyber Threat Statistics dashboard enables your organization to analyze and prioritize network security event traffic. Using this dashboard you will be able to see geo location of top hosts, network traffic to and from known suspicious hosts. Out of the box we support geo county database from MaxMind and threat intelligence from Emerging Threats and Alienvault. A corporation can also integrate its own watch-list. To see data in this dashboard enable Security Module Set: 10040, 10050, 10052, 10053 and install and setup the four utilities for each Module, create the required data sets and add them to the NetFlow Integrator Modules. NetFlow Analytics for Splunk App User Manual NetFlow Logic Confidential 21 DNS Security dashboard To see data in this dashboard enable Module 10004: DNS Monitor. Please refer to NetFlow Integrator User Guide for details. It is useful to monitor average response time of all DNS servers used in your network. The right panel also shows top DNS users. Supplemental Traffic Statistics TCP Health To see data in this dashboard enable and configure Module 10060: TCP Health. Please refer to NetFlow Integrator User Guide for details. The TCP Health dashboard monitors and detects top hosts with the most TCP Resets. Top hosts are defined by percent of TCP resets to the total number of Resets for definitive NetFlow exporter or by percent of TCP resets to the total number of host’s connections. The TCP Health dashboard shows top hosts with most count of failed TCP connections and top hosts with largest share of failed TCP connections. GEO IP Monitor dashboard The GEO IP dashboard shows geographical locations of Source IP for inbound traffic and Destination IP for outbound traffic. You need to enable Module 10040: Visitors by country. NetFlow Analytics for Splunk App User Manual NetFlow Logic Confidential 22 Traffic by Autonomous Systems dashboard The Traffic by Autonomous Systems (AS) dashboard monitors traffic by AS. To see data in this dashboard enable and configure Module 10066: Autonomous Systems Monitor. Use the filtering options and time picker at the top of the dashboard to select the time interval and narrow down your search results. Select if you want to see incoming or outgoing traffic by AS. Indicate if you want to see statistics for IPv4 or IPv6 or both. Traffic by CBQoS dashboard The Traffic by CBQoS dashboard enables your organization to analyze and prioritize network traffic by Quality of Service (QoS). Using this dashboard you will be able to see how QoS policy is applied in each of your network device where it is enabled and reported, and if necessary tweak Type of Service (TOS) settings. To see data in this dashboard enable Module 10066: CBQoS Monitor. Use the filtering options and time picker at the top of the dashboard to select the time interval and narrow down your search results. NetFlow Analytics for Splunk App User Manual NetFlow Logic Confidential 23 Search dashboard This screen opens a Search dashboard within the App, with search criteria set to macro `netflow_search_traffic_rules`. To see all output from NFI enter “index=flowintegrator” in search area. To filter search results to a specific NFI Module, please add the corresponding Module output ID to your search, for example: “index=flowintegrator nfc_id=20067” You can add additional filters or any other Splunk search commands to narrow your search results and / or see various statistics. You can also save your custom searches there. Cisco ASA Monitor Cisco ASA Monitor dashboards show the output from NetFlow Integrator Cisco ASA Module set, which in its turn designed to handle Cisco ASA NSEL. Cisco Overview The Cisco Overview dashboard aimed to provide a summary on traffic over the last 24 hours. The panels show Geo location of hosts on the map, Top Bandwidth Consumers, Top Destinations, Top Violators, and Top Connectors. Cisco Top Bandwidth Consumers This dashboard (a.k.a. Top Talkers) monitors host which generate most traffic in your network. It is useful for real time or historical network utilization and bandwidth monitoring. The dashboard shows traffic volume and connections count (created and denied) generated by each host. Use the filtering options and time picker at the top of the dashboard to select the time interval and narrow down your search results. NetFlow Analytics for Splunk App User Manual NetFlow Logic Confidential 24 Cisco Top Destinations This dashboard (a.k.a. Top Listeners) monitors host which receive most traffic. The top of the dashboard has a map showing geographical locations of top destinations of the traffic in your network. It is useful for real time or historical network utilization and bandwidth monitoring. The dashboard shows traffic volume and connections count (created and denied) received by each host. Use the filtering options and time picker at the top of the dashboard to select the time interval and narrow down your search results. Cisco Top Violators This dashboard show hosts with most traffic of denied flows. It could be useful to reinforce Cisco ASA firewall policies. Use the filtering options and time picker at the top of the dashboard to select the time interval and narrow down your search results. Cisco Top Connectors This dashboard monitors host which generate most connections in your network. It is useful for identifying hosts that make most connections, but could be omitted from top bandwidth consumers because of the small packets they send, e.g. port scanners. The dashboard shows connections created by each host. Use the filtering options and time picker at the top of the dashboard to select the time interval and narrow down your search results. Palo Alto Networks Palo Alto Networks dashboards show the output from NetFlow Integrator Palo Alto Networks Module set, which in its turn designed to handle Palo Alto Network proprietary NetFlow v9 fields. Palo Alto Networks Overview The Palo Alto Networks Overview dashboard aimed to provide a summary on traffic over selected period time. The panels show Top Bandwidth Consumers, Top Destinations, Top Violators, Top Connectors, Top Applications, and Top Applications and Users. Palo Alto Networks Top Bandwidth Consumers This dashboard (a.k.a. Top Talkers) monitors host which generate most traffic in your network. It is useful for real time or historical network utilization and bandwidth monitoring. The dashboard shows traffic volume and connections count (created and denied) generated by each host. Use the filtering options and time picker at the top of the dashboard to select the time interval and narrow down your search results. NetFlow Analytics for Splunk App User Manual NetFlow Logic Confidential 25 Palo Alto Networks Top Destinations This dashboard (a.k.a. Top Listeners) monitors host which receive most traffic. It is useful for real time or historical network utilization and bandwidth monitoring. The dashboard shows traffic volume and connections count (created and denied) received by each host. Use the filtering options and time picker at the top of the dashboard to select the time interval and narrow down your search results. Palo Alto Networks Top Violators This dashboard show hosts with most traffic of denied flows. It could be useful to reinforce Palo Alto Networks firewall policies. Use the filtering options and time picker at the top of the dashboard to select the time interval and narrow down your search results. Palo Alto Networks Top Connectors This dashboard monitors host which generate most connections in your network. It is useful for identifying hosts that make most connections, but could be omitted from top bandwidth consumers because of the small packets they send, e.g. port scanners. The dashboard shows connections generated by each host. Use the filtering options and time picker at the top of the dashboard to select the time interval and narrow down your search results. Top Applications This dashboard monitors traffic by Application as identified by Palo Alto Network devices. It is useful for real time or historical network utilization and bandwidth monitoring. The dashboard shows traffic volume and connections attributed to each application recognized by Palo Alto Networks devices. Use the filtering options and time picker at the top of the dashboard to select the time interval and narrow down your search results. Top Applications and Users This dashboard monitors traffic by Application and Users as identified by Palo Alto Network devices. It is useful for real time or historical network utilization and bandwidth monitoring. The dashboard shows traffic volume and connections attributed to each application recognized by Palo Alto Networks devices, and allows to drill down to see users of each reported application. Use the filtering options and time picker at the top of the dashboard to select the time interval and narrow down your search results. NetFlow Analytics for Splunk App User Manual NetFlow Logic Confidential 26 Resources FAQ What is the default UDP Data Input the app uses? Once the app is installed the default Data Input 10514 is created with the index=flowintegrator and the manual sourcetype=flowintegrator How do I setup the app to work with SNMP? This application is automatically integrated with SNMP. See SNMP Integration section on page 10. How do I change the default index where NetFlow data is stored? Once the app is installed the default index=flowintegrator is created, If you need to alter the index, please follow these steps: 1. Create directory $SPLUNK_ROOT/etc/apps/netflow/local/ if it doesn't exist 2. Create file $SPLUNK_ROOT/etc/apps/netflow/local/macros.conf with following lines: [netflow_index] definition = index=your_index sourcetype=flowintegrator Save $SPLUNK_ROOT/etc/apps/netflow/local/macros.conf and restart Splunk to changes take effect. Getting help NetFlow Logic provides many resources for help with the NetFlow Analytics for Splunk App. NetFlow Analytics for Splunk App download: https://apps.splunk.com/app/489/ Technology Add-on for NetFlow download: https://splunkbase.splunk.com/app/1838/ NetFlow Logic Support: https://www.netflowlogic.com/connect/support/ NetFlow Analytics for Splunk App User Manual NetFlow Logic Confidential 27