1
RUPRECHT-KARLS-UNIVERSITÄT HEIDELBERG
KIRCHHOFF-INSTITUT FÜR PHYSIK
Department of Physics and Astronomy
University of Heidelberg
Diploma thesis
in Physics
submitted by
Jochen Ulrich
born in Ludwigshafen am Rhein
2011
The Inventory Module
of the
SysMES Framework
This diploma thesis has been carried out by Jochen Ulrich
at the
Kirchhoff Institute for Physics
under the supervision of
Prof. Dr. Udo Kebschull
Das Inventarisierungsmodul des SysMES Frameworks:
Bei Fehlersuche, Umstrukturierung oder Verteilung von Aufgaben in heterogenen
Computerumgebungen wie dem ALICE HLT Cluster ist das Wissen über die Knotenkonfiguration (Hardware, Software und Netzwerkstruktur) ein entscheidender
Faktor. Das Sammeln dieser Informationen kann sehr zeitaufwändig sein. Dieser
Aufwand kann verringert werden indem diese Informationen in einer Inventardatenbank vorgehalten werden. Da ein manuell befülltes Inventar fehleranfällig und
schwer aktuell sowie konsistent zu halten ist, wird eine automatisch aktualisierendes Inventar benötigt um die Korrektheit der Daten sicher zu stellen und die
Daten dadurch für andere Komponenten wie z. B. externes Scheduling nutzbar
zu machen. Das Ziel dieser Arbeit ist es eine Inventarlösung bereit zu stellen, die
die Anforderungen eines Inventars eines heterogenen Computerclusters erfüllt. Zu
diesem Zweck wurde eine Lösung als Komponente des System Management Frameworks SysMES entwickelt. Sie verwendet ein objekt-orientiertes Modell welches
auf dem Common Information Model basiert und fähig ist heterogene Umgebungen mit all ihren Eigenheiten zu beschreiben. Die Daten werden durch SysMES
Monitore gesammelt und in einem RDBMS gespeichert wodurch sie anderen Anwendungen zur Verfügung stehen. Das Inventarisierungsmodul untersucht neue
Knoten vollständig, halt die Daten automatisch aktuell, visualisiert die Daten
in der SysMES Benutzeroberfläche und informiert über Veränderungen mit Hilfe
von SysMES Events.
The Inventory Module of the SysMES Framework:
When debugging, restructuring or distributing tasks in a heterogeneous computer
environment like the ALICE HLT cluster, knowing the configuration of the nodes
(hardware, software, network structure) is crucial. Gathering that information can
be very time consuming. That effort can be reduced by holding the information
in an inventory database. Since a manually filled inventory is error-prone and
hard to keep up to date and consistent, an automatically updated inventory is
needed to ensure the correctness of the data and thereby make the data usable
for other components like e. g. external scheduling. The goal of this thesis is
to provide an inventory solution that fulfills the requirements for an inventory of
heterogeneous computer clusters. For this purpose, a solution has been developed
as a component of the system management framework SysMES. It uses an objectoriented model which is based on the Common Information Model and is able to
describe heterogeneous environments with all their specifics. The data is gathered
using SysMES monitors and stored in a RDBMS making it available to other
applications. The inventory module scans new nodes completely, keeps the data
up to date automatically, visualizes the data in the SysMES GUI and informs
about changes using SysMES events.
Acknowledgments
Many people had a part in making this diploma thesis possible and therefore I would
like to thank them.
First of all, I want to thank Prof. Dr. Udo Kebschull for the opportunity to work in
his group and write this thesis. I also have to thank Prof. Dr. Michael Gertz who
agreed on short notice to review this thesis.
Next, I want to thank Camilo Lara for the great support he gave me during all
phases of this thesis, not least during the reviewing. He always had the right advices
when I was at a loss and he was never tired of standing up for the group. Further
thanks go to the other members of the SysMES group: Stefan Böttger for inspiring
discussions and for reviewing large parts of this thesis, Timo Breitner for reviewing
parts of this thesis and Falco Vennedey for keeping our development cluster up and
running. It is a pleasure to work with all of you.
I also wish to thank Marian Hermann and Øystein Haaland for the collaboration
and input during the time of my thesis.
Thanks to my fellow student Niels Kröger for reviewing parts of the thesis and being
my teammate in the spare time.
I am deeply grateful to my parents who supported me throughout my whole studies,
not least morally and financially.
Finally, I thank Lisa for her love and her patience. You always make me smile.
Jochen Ulrich
Heidelberg, May 2011
7
Contents
1 Introduction
1.1 The ALICE HLT Cluster . . . . . . .
1.2 The SysMES Framework . . . . . . .
1.3 Motivation . . . . . . . . . . . . . . .
1.4 Structure of this Thesis . . . . . . . .
1.4.1 Comment about the Notation
1.4.2 The terms Model and Object
.
.
.
.
.
.
.
.
.
.
.
.
.
.
.
.
.
.
.
.
.
.
.
.
.
.
.
.
.
.
.
.
.
.
.
.
2 Goals
2.1 Requirements for the Inventory . . . . . . . . .
2.2 Requirements for the Model and Data Interface
2.2.1 Requirements for the Model . . . . . . .
2.2.2 Requirements for the Data Interface . . .
.
.
.
.
.
.
.
.
.
.
.
.
.
.
.
.
.
.
.
.
.
.
.
.
.
.
.
.
.
.
.
.
.
.
.
.
.
.
.
.
.
.
.
.
.
.
.
.
.
.
.
.
.
.
.
.
.
.
.
.
.
.
.
.
.
.
.
.
.
.
.
.
.
.
.
.
.
.
.
.
.
.
.
.
.
.
.
.
.
.
.
.
.
.
.
.
.
.
.
.
.
.
.
.
.
.
.
.
.
.
3 Fundamentals
3.1 The Common Information Model and Web-Based Enterprise Management . . . . . . . . . . . . . . . . . . . . . . . . . . . . . . . . .
3.2 Configuration Management Database . . . . . . . . . . . . . . . . .
3.3 Object-Relational Mapping . . . . . . . . . . . . . . . . . . . . . . .
3.4 Java Platform, Enterprise Edition . . . . . . . . . . . . . . . . . . .
3.5 Cluster Management with the SysMES Framework . . . . . . . . .
4 State of the Art
4.1 Commercial Products . . . . . . . . . . . . . . . . . . . . .
4.1.1 Microsoft System Center Configuration Manager . .
4.1.2 HP Discovery and Dependency Mapping . . . . . .
4.1.3 IBM Tivoli Configuration Manager . . . . . . . . .
4.1.4 BMC Atrium Discovery and Dependency Mapping
4.1.5 easyCMDB . . . . . . . . . . . . . . . . . . . . . .
4.2 Research Projects . . . . . . . . . . . . . . . . . . . . . . .
4.3 Free Products . . . . . . . . . . . . . . . . . . . . . . . . .
4.3.1 Configuration Management Database Solutions . .
4.3.2 WBEM Solutions . . . . . . . . . . . . . . . . . . .
4.3.3 Other Inventory Solutions . . . . . . . . . . . . . .
4.4 Conclusion . . . . . . . . . . . . . . . . . . . . . . . . . . .
.
.
.
.
.
.
.
.
.
.
.
.
.
.
.
.
.
.
.
.
.
.
.
.
.
.
.
.
.
.
.
.
.
.
.
.
.
.
.
.
.
.
.
.
.
.
.
.
.
.
.
.
.
.
.
.
.
.
.
.
.
.
.
.
.
.
11
11
12
12
13
14
14
.
.
.
.
17
17
19
19
20
21
.
.
.
.
.
21
21
22
22
23
.
.
.
.
.
.
.
.
.
.
.
.
25
25
25
26
26
26
27
27
27
27
29
29
31
9
Contents
5 Conceptual Work
5.1 Conceptual Decisions . . . . . . . .
5.2 Workflow of the Inventory Module .
5.2.1 Configuration Workflow . .
5.2.2 Discovery . . . . . . . . . .
5.2.3 Updating . . . . . . . . . .
5.2.4 Use Cases . . . . . . . . . .
.
.
.
.
.
.
.
.
.
.
.
.
.
.
.
.
.
.
.
.
.
.
.
.
.
.
.
.
.
.
.
.
.
.
.
.
.
.
.
.
.
.
.
.
.
.
.
.
.
.
.
.
.
.
6 Implementation
6.1 Model and Data Storage . . . . . . . . . . . . . . .
6.2 Configuration and User Interface of the Inventory .
6.3 Discovery . . . . . . . . . . . . . . . . . . . . . . .
6.4 Updating . . . . . . . . . . . . . . . . . . . . . . .
6.5 Data Processing in the Inventory Module . . . . . .
6.6 Writing Discovery, Association and Update Scripts
7 Results
7.1 Description of the Test Environment . . . . . . .
7.2 Functionality: Inventory of the Test Environment
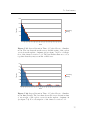
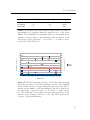
7.3 Performance . . . . . . . . . . . . . . . . . . . . .
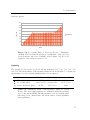
7.3.1 Server-Side . . . . . . . . . . . . . . . . .
7.3.2 Client-Side . . . . . . . . . . . . . . . . . .
7.3.3 Event Throughput . . . . . . . . . . . . .
7.4 Summary . . . . . . . . . . . . . . . . . . . . . .
.
.
.
.
.
.
.
.
.
.
.
.
.
.
.
.
.
.
.
.
.
.
.
.
.
.
.
.
.
.
.
.
.
.
.
.
.
.
.
.
.
.
.
.
.
.
.
.
.
.
.
.
.
.
.
.
.
.
.
.
.
.
.
.
.
.
.
.
.
.
.
.
.
.
.
.
.
.
.
.
.
.
.
.
.
.
.
.
.
.
.
.
.
.
.
.
.
.
.
.
.
.
.
.
.
.
.
.
.
.
.
.
.
.
.
.
.
.
.
.
.
.
.
.
.
.
.
.
.
.
.
.
.
.
.
.
.
.
.
.
.
.
.
.
.
.
.
.
.
.
.
.
.
.
.
.
.
.
.
.
.
.
.
.
.
.
.
.
.
.
.
.
.
.
.
.
.
.
.
.
.
.
.
.
33
33
37
38
39
40
40
.
.
.
.
.
.
43
43
43
49
53
53
55
.
.
.
.
.
.
.
59
59
61
65
66
76
78
79
8 Conclusion
81
9 Future Work
83
Appendices
A Lists
A.1 List
A.2 List
A.3 List
A.4 List
A.5 List
of
of
of
of
of
Figures . . . .
Tables . . . .
Listings . . .
Abbreviations
Terms . . . .
.
.
.
.
.
.
.
.
.
.
.
.
.
.
.
.
.
.
.
.
.
.
.
.
.
.
.
.
.
.
.
.
.
.
.
B References
C Erklärung (Statement of Authorship)
10
.
.
.
.
.
.
.
.
.
.
.
.
.
.
.
.
.
.
.
.
.
.
.
.
.
.
.
.
.
.
.
.
.
.
.
.
.
.
.
.
.
.
.
.
.
.
.
.
.
.
.
.
.
.
.
.
.
.
.
.
.
.
.
.
.
.
.
.
.
.
.
.
.
.
.
.
.
.
.
.
.
.
.
.
.
.
.
.
.
.
.
.
.
.
.
.
.
.
.
.
87
87
88
88
88
91
93
103
1 Introduction
A computer cluster is a set of computers which work together on a task and which
are usually connected by a network. Computer clusters are used to increase the availability of services (high-availability cluster), to handle heavy load (load-balancing
cluster) or to solve computationally intensive problems (high-performance computing cluster). Typically, computer clusters consist of several hundred computers (also
called nodes) which all can be equal regarding their hardware and software configuration (then the cluster is called homogeneous) or they differ (in which case the
cluster is called heterogeneous).
1.1 The ALICE HLT Cluster
A typical example of a computer cluster is the ALICE High-Level Trigger (HLT)
cluster. ALICE (A Large Ion Collider Experiment) is one of the experiments at
the Large Hadron Collider (LHC) at CERN (European Organization for Nuclear
Research) near Geneva, Switzerland. The objective of ALICE is to study the quarkgluon plasma which is produced by colliding heavy ions (protons or lead nuclei).
These collisions produce thousands of particles whose tracks and properties have to
be measured and the data output of the detectors can reach up to 25 GB s−1 [1].
Since this is more as what can be stored and since the physically relevant part of
the data is much smaller, there is the need to reduce the data to an amount that
can be stored, without losing the relevant information. This is the task of the HLT
application.
The HLT application is a distributed, hierarchical application which runs on the
HLT cluster. The HLT cluster consists of 25 infrastructure nodes and about 250
front-end processors (FEPs) and computing nodes (CNs). The FEPs are used to
receive the data from the detectors through custom hardware: the so-called HLT
Read-Out Receiver Card (H-RORC). The CNs on the other hand are used for analysis of the data. The hardware for the HLT cluster is bought in batches at the time it
is needed and due to the long duration of the ALICE experiment (over 10 years) the
new hardware significantly differs from the already existing hardware. Therefore, the
HLT cluster is heterogeneous and at the current state, there exist about 10 different
hardware configurations for the nodes. More details about the heterogeneity and the
architecture of the HLT cluster can be found in [65, chapter 1 and section 7.1.1].
11
1 Introduction
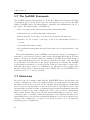
1.2 The SysMES Framework
The SysMES (System Management for Networked Embedded Systems and Clusters) framework [65] is the monitoring and management toolset used in the HLT
cluster. SysMES reduces the management complexity and administration effort of
the cluster. The main features of SysMES are:
• Error recognition through monitoring and event management
• Automated error solution through a rule system
• Event system for reporting of executed actions and monitoring data
• Interface for an overview of the state of the nodes and manual execution of
actions
• Scalability and fault tolerance
• Decentralized management through clients that can act independently of the
server
The system administrators use SysMES to automate the solving of recurring problems and to reduce the problem recognition time and manual intervention. For that
purpose, all the nodes in the cluster are running a SysMES client which monitors
the components that are known to produce problems. If a problem occurs, the client
recognizes that and either tries to fix the problem itself or it informs the SysMES
servers which in return try to fix the problem. If the problem cannot be fixed automatically, the system operator or administrator is informed via the graphical user
interface (GUI), email or short message service (SMS). More about SysMES can be
found in section 3.5 or in [65] and [102].
1.3 Motivation
In a heterogeneous computer cluster like the ALICE HLT cluster, the hardware and
software configuration of the nodes differ and there are many situations where this
information is needed for a given node. For example, when debugging problems which
may be related to the hardware resources it is necessary to know the resources of the
given machine. Or when deciding on structural questions like distributing tasks in the
cluster it is crucial to know the configuration of the nodes to be able to exhaust their
full potential. In minor heterogeneous environments this might be worked around by
conventions like, for example, different hostnames for the different machine types,
but in highly heterogeneous environments this might not be an option. In such cases,
whenever the configuration of a given node is needed, it has to be looked up since
in the first place it is unknown.
12
1.4 Structure of this Thesis
One method to get that information is to retrieve it manually from the node itself,
for example, by logging in and running appropriate commands. This method is fine
when needing information of few nodes with similar software configurations but it
is time-consuming and error-prone when needing information of many nodes. This
becomes even worse if the methods of retrieving the information differ on the nodes
due to different software configurations.
A better method to get the needed information is to read it from a database, i. e.
an inventory database. This method has several advantages:
• Uniform interface to retrieve the information (no need to remember the commands for each specific node)
• The information is available even if the node is shut down/offline
• The information of all nodes is available in one place
• Looking up the data of several nodes is fast (can be done in one database
query)
• Robust method for looking up data from within applications
On the other hand this method implies the challenge to keep the database up to
date because the data becomes obsolete as soon as the configuration in the cluster
changes. However, this can be compensated by updating the data in the database in
regular intervals. Since updating the data of hundreds of machines manually is errorprone and to ensure that the updates are done in regular intervals, it is required to
automate the updating.
After reviewing existing inventory solutions (see chapter 4) it turned out that none
of the existing solutions is suitable to be used as an inventory of a heterogeneous
computer cluster with custom hardware (see section 2.1). Since SysMES already
provides an infrastructure that fulfills the requirements partially, it is reasonable to
use this existing infrastructure to build an inventory solution which fulfills all of
the requirements. This is why a new inventory solution has been developed in this
diploma thesis and why it was integrated into SysMES.
1.4 Structure of this Thesis
Chapter 2 lists the requirements for an inventory and its datastorage which also
define the goals for this work. Chapter 3 introduces basic concepts and technologies
which can be used in conjunction with an inventory. In chapter 4 several existing
inventory solutions are reviewed and evaluated against the requirements of chapter 2. Chapter 5 describes the concepts of the SysMES inventory and chapter 6
describes its implementation. Chapter 7 presents the results of a functional test and
13
1 Introduction
a performance test of the implementation. Chapter 8 summarizes the results of this
work and chapter 9 gives a short outlook on future work that could be carried out
to extend the functionality of the current development state.
1.4.1 Comment about the Notation
In this thesis, different notations are used to emphasize special meanings. These
notations are:
• Objects or concepts with a special meaning in SysMES or the inventory module
are written in italics. On first occurrence these terms are additionally written
in bold face to highlight that the terms are explained at that position.
Examples: event, instance cache
• Terms which refer to objects, classes or properties of the application code are
written in italics and with (upper) camel case (see [12]). On first occurrence
these terms are also written in bold face to highlight that the terms are explained at that position.
Examples: EventBean, UpdatePeriod
• Source code within the text is written in teletype font.
Example: SysMES_echo
• Within source code listings, comments are written in italics and highlighted in
red, strings are written in teletype font and highlighted in green and keywords
are written in bold face and highlighted in blue. Line breaks which are not
contained in the source code but were inserted to make the source code fit
onto the page, are indicated by indented lines with gray arrows in front of
them (,→). Space characters within strings are indicated by “␣”.
Example:
# A comment
echo "A␣ string "
echo "A␣very ,␣very ,␣very␣long␣ string ␣that␣ exceeds ␣the␣size␣
,→
of␣a␣line."
1.4.2 The terms Model and Object
In this thesis the term “model” is used in the meaning of a data model which “is an
abstract model, that documents and organizes the business data [. . . ] and is used
as a plan for developing applications, specifically how data is stored and accessed”
[18].
14
1.4 Structure of this Thesis
Another term used throughout this thesis is “object” which is used in the meaning
of the object-oriented paradigm. In the object-oriented paradigm the aspects of a
system are modelled using objects having properties and associations between these
objects. For example, an object can be a physical device (like an Ethernet card) or a
software process or an abstract concept like a logical device (e. g. a network socket).
15
2 Goals
The overall goal of this work is to provide an automatic updating, flexible and integratable inventory solution that meets the requirements of a heterogeneous computer cluster with custom hardware (see below). An inventory solution that fulfills
this goal has to meet certain requirements which are described in this chapter. The
requirements are separated into requirements for the inventory solution itself and
requirements for its model and data interface.
2.1 Requirements for the Inventory
There are several requirements for an inventory solution of a heterogeneous computer
cluster with custom hardware. The three main reasons for the requirements are:
• Saving time and manpower for running the inventory
• Error prevention in the inventory data
• Providing reliable inventory data for the components of the cluster
The requirements originate from the experience of the daily work with a heterogeneous computer cluster (namely the ALICE HLT cluster). Descriptions of the
requirements and their justifications follow below. The requirements are:
• Functional:
– Automatic detection of objects
– Automatic updating of the data
– Providing uniform access to the data (to the user/administrato and to
other applications)
• Conceptual:
– Flexibility to support heterogeneity and custom hardware
– Scalability
– Integratable in or part of a system management solution
– Support for Linux 1 operating systems
1
Linux is a trademark of Linus Torvalds
17
2 Goals
Automatic detection of objects Automatic detection of objects (called discovery
in this thesis) means that the inventory solution must detect which objects are
installed in the nodes and it must recognize the appearance and disappearance of
objects. To achieve this, the inventory solution should execute a discovery in regular
intervals (called discovery intervals). Automated detection of objects is required
because it effects major time and manpower savings and prevents errors originating
from human intervention.
Automatic updating of the data The inventory solution has to ensure that
changes of object properties are reflected in the inventory. Such updates should
occur in periodic intervals (called update intervals). Updating prevents erroneous
data in the inventory and an automatic updating saves time and manpower.
Providing uniform access to the data The data of the inventory solution should
be accessible in a uniform manner which means that all of the data should be
accessible by the same method and at the same place. This requirement derives
from the fact that it is not feasible to connect to every node to get the required
information, for example when a list of all nodes which fulfill a certain condition is
needed.
Flexibility to support heterogeneity and custom hardware The inventory solution needs to be able to handle nodes with completely different hardware and software configurations. This implies that the methods used to collect the data must
be configurable for each node. This requirement arises from the fact that there are
systems (like for example Baseboard Management Controllers (BMCs) or switches)
where a limited set of software is installed and no other software can be installed.
Furthermore, the discovery and update interval should be adjustable for different
data because this allows to realize different actuality demands and avoids unnecessary discoveries and updates. Different actuality demands occur because some
information is more important or changes more often than other information. For
example, the exact total size of a hard disk typically changes only slightly over years
due to bad sectors2 and is less important than the IP address of a node which can
change on a scale of days if the Dynamic Host Configuration Protocol (DHCP) [23]
is used.
Additionally the inventory solution must be flexible enough to support custom
hardware that is special for the managed environment. This custom hardware often plays a central role in the application running on the cluster and hence, it is
important to have information about it available through the inventory.
2
L. N. Bairavasundaram et al. found an average of approximately 0.003 bad sectors/GB in
18 month (see [4]) which yields approximately 0.1 % of the total disk size per year.
18
2.2 Requirements for the Model and Data Interface
Scalability Computer clusters typically contain several hundreds up to several
thousands of nodes. Hence, the inventory solution must implement a scalability
strategy to be able to handle such an amount of information.
Integratable in or part of a system management solution Changes in the inventory might reflect hardware failures and this might lead to serious problems in
the operation of the managed environment. Hence, it is required that the system
administrators or operators are informed about such changes which is typically one
of the tasks of a system management (or monitoring) solution. Information included
in an inventory is typically not subject to monitoring (e. g. there is usually no monitoring of the total RAM size). Therefore, the inventory solution soultion should be
able to propagate changes in the environment to a system management solution.
Support for Linux operating systems The inventory solution needs to support
Linux operating systems since 91.80 % of the TOP500 3 supercomputers use Linux
(see [103]) which means that Linux is the dominant operating system for computer
clusters.
2.2 Requirements for the Model and Data Interface
Additionally to the requirements for the inventory solution, there are further requirements for the model used to organize the data of the inventory and for the
interface that provides the access to the data.
2.2.1 Requirements for the Model
Universality It must be possible to describe objects that are specific to the managed environment and which were therefore not included in the design of the model.
In detail this means that it must be possible to express at least the existence of those
objects. This is required because it is possible that new hardware is introduced in
the managed environment which was unknown at the time the model was designed.
In such situations, it should be possible to at least describe the existence of the
hardware without having to modify the model.
Flexibility to support heterogeneity It is required that the model is able to describe nodes with completely different hardware and software configurations in order
that the inventory solution can fulfill this requirement. The model should also be
able to describe associations between objects to satisfy the complexity of a heterogeneous environment.
3
TOP500 is a registered trademark of the TOP500.org
19
2 Goals
2.2.2 Requirements for the Data Interface
Transactional access The access to the data must be transactional to ensure consistency, isolation and durability. This is required to enable simultaneous access for
multiple users or applications.
Availability of data independent of the data source The data shall be available
independently of the status of the object the data refers to. This is required to access
object information even if the object itself is unavailable or not working correctly.
Reliability The data interface should implement a reliability strategy to ensure
that the inventory data is available when other applications need it.
20
3 Fundamentals
This chapter introduces basic technologies and concepts used in this thesis.
3.1 The Common Information Model and Web-Based
Enterprise Management
The Common Information Model (CIM) [13] is a standard maintained by the Distributed Management Task Force 1 (DMTF) [22]. Its purpose is to “provide a common definition of management information for systems, networks, applications and
services” [13]. It mainly consists of two parts: the CIM Infrastructure Specification
which describes the concepts of CIM and the CIM Schema which defines an objectoriented model which covers many aspects of an IT environment. According to a
CIM-based model, an IT environment is described by a set of objects and associations between these objects. Every object is an instance of a class from the model.
Instances are identified by the values of special properties, the so-called key properties. Every instance needs a unique combination of values for these key properties
to be created. One noteworthy aspect of the CIM Schema besides its exhaustive size
is its strict separation between logical and physical representation of components.
Web-Based Enterprise Management (WBEM) [106] is another standard maintained by the DMTF with the purpose “to unify the management of distributed
computing environments” [106]. The WBEM standard builds on the CIM standard
and defines mappings (like the representation of CIM in Extensible Markup Language (XML)), operations (like EnumerateInstances and GetProperty) and protocols (like CIM Operations over HTTP) to interact with a WBEM server / CIM
Object Manager (CIMOM) on a remote host.
3.2 Configuration Management Database
A Configuration Management Database (CMDB) is “a database that tracks and
records configuration items associated with the IT infrastructure and the relationships between them” [20] where a configuration item (CI) is any “Component that
needs to be managed in order to deliver an IT Service” [47]. The term CMDB origi1
DMTF is a registered trademark of the Distributed Management Task Force, Inc.
21
3 Fundamentals
nates from the IT Infrastructure Library 2 (ITIL) [48] which is a “set of Best Practice
guidance for IT Service Management” [47]. The CIs typically include, among other
things, the hardware and software components. Therefore, a CMDB typically includes at least a basic inventory.
3.3 Object-Relational Mapping
Object-relational mapping (ORM) [87] is a technique that simplifies the storage of
application objects in a relational database management system (RDBMS). With
an ORM it is possible to read and write whole objects from/to a persistent storage
without having to care about how or where the data is stored in the underlying
database every time the data is read/written. A very popular ORM solution for the
Java 3 [49] programming language is Hibernate [36].
3.4 Java Platform, Enterprise Edition
Java Platform, Enterprise Edition (Java EE)4 [50] is a programming standard based
on the Java programming language. It defines several application programming interfaces (APIs) to simplify the development of server and web applications. Java
EE applications run on an application server (AS) which implements the APIs. One
of these APIs is the Enterprise JavaBean (EJB) specification. In its current version
3.1 the EJB [51] specification defines two types of Enterprise JavaBeans: session
beans and message-driven beans. Session beans are typically used to perform operations requested by the client. Session beans may be stateless or stateful. A stateless
session bean equals all other session beans of the same class which makes them
interchangeable whereas a stateful session bean creates a kind of context for each
request and keeps this context as long as the session with the client continues. A
message-driven bean is the interface to the asynchronous communication provided
by the Java Message Service (JMS) [53], another API of Java EE. The JMS defines two mechanisms for delivering messages: topics and queues. A topic distributes
its messages to all subscribers of the topic whereas a queue delivers each message
to only one, randomly selected subscriber. A message-driven bean is instantiated
whenever a message arrives through the subscribed topic or queue.
The EJBs are running in the so-called EJB container which takes care of the
lifecycle, the access and optionally the transactionality of the EJBs. Another important API of Java EE is the Java Persistence API (JPA) [54]. The JPA provides
2
IT Infrastructure Library and ITIL are registered trademarks of the Office of Government
Commerce in the United Kingdom and other countries
3
Java is a registered trademark of Oracle and/or its affiliates
4
Java EE is a registered trademark of Oracle and/or its affiliates
22
3.5 Cluster Management with the SysMES Framework
the interface to store Java objects in a persistent storage, e. g. a database. The JPA
is typically implemented by an ORM framework. For web applications, Java EE
provides a so-called web container which runs Java servlets and JavaServer Pages
(JSPs). For more information about Java EE and its APIs see [50]. The SysMES
framework is a Java EE application and it is written for the JBoss application server
[56].
3.5 Cluster Management with the SysMES
Framework
The management capabilities of SysMES are realized by different management objects: monitoring is implemented by objects called monitors. Monitors are typically
associated with so-called binary actions which contain the actual logic used to
read the value of the monitored parameter. Furthermore, monitors may be associated with one or more event classes. Event classes are triggers which describe
when and what kind of events are created based on the value of the monitored
parameter. The generated events might then trigger rules which react to the event
by executing actions. There are different types of actions. For example, there is
an action to generate another event and an action to execute a task on the client.
Again there are different types of tasks. For example, there exists a task to deploy a
monitor on a client and a task to execute a binary action on a client. The information, on which clients a task shall be deployed, is stored in a so-called target mask
which is attached to the task.
The management objects provide several properties which can be used to customize their behavior. For example, a monitor has the property Period which defines
the interval in which the monitor is run, and the property Repeat which defines
how often the monitor is run (a fixed number or unlimited). More details about the
management objects and some use cases can be found in [65].
The management of a computer cluster with SysMES should follow reasoned management strategies. According to these strategies, the management objects (monitors, rules, tasks, etc.) should be developed and used. An example for such a strategy
can be found in [65, chapter 7.1.3].
23
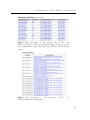
4 State of the Art
Several products exist that implement the functionality of an inventory. The products have been reviewed with respect to the requirements from chapter 2 and categorized into commercial products, research projects and free products. The results
of this review are presented in this chapter.
To avoid repetition in this chapter, some considerations in advance:
• The requirements for the data interface (see section 2.2.2) are fulfilled if the
data is stored using a database management system (DBMS) since such systems provide transactional access and are typically hosted on the server which
makes them independent of the client machines.
• Integration in a system management solution is only possible if the inventory
solution implements some kind of event system where the information about
the event can be extracted from.
4.1 Commercial Products
The information about the commercial products is mostly taken from the official
documentations.
There exist too many solutions to have a detailed look at all of them in this
thesis. Many of the dismissed solutions are designed for Windows 1 networks only (for
example [104], [72], [66], [70] and many more). Other solutions do not support custom
hardware (like [63], [64], [33]). There are also solutions which use data storages that
do not support transactional access (like [2] which uses files for data storage).
4.1.1 Microsoft System Center Configuration Manager
Microsoft 2 System Center Configuration Manager (SCCM) [68] is the configuration
management solution of the system management software series Microsoft System
Center [67]. SCCM uses a Microsoft SQL Server 3 database as data storage and with1
Windows is a registered trademark of Microsoft Corporation in the United States and other
countries
2
Microsoft is a registered trademark of Microsoft Corporation in the United States and other
countries
3
SQL Server is a registered trademark of Microsoft Corporation in the United States and other
countries
25
4 State of the Art
out extensions it supports only Windows operating systems [69]. Using the Quest 4
Management Xtensions - Configuration Manager [92] extension, SCCM supports
many different operating systems but the supported hardware information is limited to four manufacturers [93].
4.1.2 HP Discovery and Dependency Mapping
HP 5 Discovery and Dependency Mapping (DDM) [37] is the discovery solution of
the HP Universal Configuration Management Database (UCMDB) [39]. There exists
no publicly accessible complete feature list or concrete information about the system
requirements (like operating system or database) of DDM. However, the data sheet
[38] indicates that DDM does not support custom hardware.
4.1.3 IBM Tivoli Configuration Manager
IBM 6 Tivoli Configuration Manager (TCM) [43] is part of the Tivoli system and
service management tool set [46]. Since there exist several Tivoli products which
seem to implement similar functionality, it is hard to figure out which product fits
the needs best. Similar Tivoli products are [42], [40] and [41]. However, Tivoli Configuration Manager seems to meet the requirements of this work best. TCM uses
a Desktop Management Interface (DMI)-based model [21], a predecessor of CIM.
For the database it is possible to use different commercial products (see [45]). Although TCM supports custom information in the inventory, it is rather complicated
to implement them because it requires manual modification of the database [44].
Furthermore, N. Bezroukov states in [6] that Tivoli requires specially trained personnel and is expensive to maintain (Bezroukov states “half a million dollar in annual
maintenance for portfolio of products (say TMF, TEC, TPM, ITM and TWS) for
a medium size datacenter (let’s say less then 500 servers)”).
4.1.4 BMC Atrium Discovery and Dependency Mapping
BMC 7 Atrium Discovery and Dependency Mapping (ADDM) [7] is the discovery
solution of the BMC Atrium CMDB [10]. ADDM uses Java Database Connectivity
(JDBC) to connect to the database and therefore ADDM can be used with many
databases [8]. Since the focus of ADDM are business applications, the covered hardware information is very limited and it does not support custom hardware [9].
4
Quest is a registered trademark of Quest Software, Inc. in the United States and other countries
Hewlett-Packard and HP are registered trademarks of Hewlett-Packard Company
6
IBM and Tivoli are registered trademarks of IBM Corporation in the United States
7
BMC and BMC Atrium are registered trademarks of BMC Software, Inc., or its affiliates or
subsidiaries in the United States and/or other countries
5
26
4.2 Research Projects
4.1.5 easyCMDB
easyCMDB 8 [24] is a PHP [89] and Perl [88] based CMDB solution that runs in a
web server and uses a MySQL 9 database as storage back-end [26]. easyCMDB itself
does not provide automated discovery and update capabilities but it provides the
possibility to integrate with the network inventory solutions JDisc [57] or NEWT 10
Professional [71] to enable automated discovery and update [25]. However, JDisc
does not support custom hardware (the fixed list of discovered information is shown
in [58]) and NEWT Professional supports only Windows operating systems (see
[71]).
4.2 Research Projects
The search for scientific projects on this specific field gave only few results.
There are several publications about inventory solutions in the sector of financial
accounting and enterprise resource planning but those projects focus on the usage
of an inventory in the accounting which is a completely different usage.
K. Jähne [59] discusses and implements the WBEM standard (see section 3.1) in
his diploma thesis but the implementation is only a prototype.
Around CMDBs exist only few publications which describe concrete implementations and often the implementations are just prototypes (like in [62]). One of the
implementations is [3] but there is no clear description of the features. Another implementation is described in [30] but the focus of this implementation are application
servers and applications deployed on them and not creating an inventory of whole
computer systems.
4.3 Free Products
This section covers non-research products that are free of charge. This may be
freeware, software libre, freely redistributable software etc. (see [27] for a distinction
of these license types). The information about the free products are either taken
from the official documentation, from the source code or from the experience gained
during the installation and usage of the products.
4.3.1 Configuration Management Database Solutions
CMDB solutions implement a CMDB as described in section 3.2. There exist several
CMDB solutions and having a detailed look at each solution would go beyond the
8
easyCMDB is a trademark of Tech Inventions Limited
MySQL is a registered trademark of Oracle and/or its affiliates
10
NEWT is a registered trademark of Komodo Laboratories LLC
9
27
4 State of the Art
scope of this thesis.
Many of the CMDB solutions have been dismissed without having a further look at
them because they lack basic features required by this work. Three of these solutions
are:
• CMDBuild 11 [14]: No automated discovery and update of its own [15]
• OneCMDB 12 [78]: No automated discovery and update [79]
• RapidCMDB [94]: No data storage of its own (relies on other data sources)
[95]
Zenoss Core
Zenoss 13 Core [109] is the community (open source) edition of the system monitoring solution Zenoss Enterprise [117] and is written in Python 14 [90]. It provides a
monitoring and event system with management capabilities such as command execution, and a CMDB inventory [112]. Zenoss Core uses different data storages: The
events are stored in a MySQL database, the CMDB data (including the inventory
data) is stored in a Zope 15 Object Database (ZODB) [118], the performance monitoring information is stored in a RRD [96] database and Python pickle files [91]
are used for caching configuration information during the startup [111]. Access to
the data as well as the configuration of the application is realized through a web
interface. Extended functionality (like custom hardware) can be implemented using
a plugin system (called ZenPacks [115]). A disadvantage of the data storage is that
full access to the inventory data is only possible for Python applications because
ZODB supports only Python. The existing Extensible Markup Language Remote
Procedure Call (XML-RPC) API [113] cannot compensate this because it does not
give full control over the data. Further drawbacks arise from the lack of scalability
of Zenoss Core because it uses a centralized, agent-less design [110] and the updating of the inventory data is done for the whole inventory simultaneously [114]. For
the Enterprise edition there exists a ZenPack called “Distributed Collector” [116]
which allows to run multiple collector servers. The collector servers are responsible
for gathering the monitoring and inventory data from the devices and every collector server can be configured with its own collection interval. This method may
be used to compensate the weak scalability of the centralized design. On the other
hand, this method cannot be used to compensate the fact that the discovery and
11
CMDBuild is a registered trademark of Tecnoteca Srl and their partners Municipality of Udine
and Cogiket Srl
12
OneCMDB is a trademark of Lokomo Systems AB
13
Zenoss is a registered trademark of Zenoss, Inc.
14
Python is a trademark of the Python Software Foundation
15
Zope is a registered trademark of Zope Corporation
28
4.3 Free Products
update intervals cannot be defined for individual devices or properties because it is
not feasible to run a collector server for each desired interval.
4.3.2 WBEM Solutions
WBEM solutions implement the WBEM standard as described in section 3.1. The
typical WBEM architecture is to have a CIMOM on every system to be managed.
Therefore, the repository of the CIMOMs are mostly not databases but simple files
and the CIMOMs do not implement failover or scalability mechanisms. Another disadvantage of this architecture is that the information about a node is only available
when the node is available. Therefore, WBEM solutions are not suitable for this
work. A detailed review of the popular WBEM solutions can be found in [59].
OpenWBEM
OpenWBEM [86] is a C++ implementation of the WBEM standard. The CIMOM
uses a Berkeley DB 16 to store the data [86] which does not allow other applications
to access the data since Berkeley DB is an embedded database.
OpenPegasus
OpenPegasus [84] is another C++ implementation of the WBEM standard. The
CIMOM is able to use plain files or a SQLite 17 database as datastorage [85].
WBEMServices
WBEM Services [107] is a Java implementation of the WBEM standard. Looking
at the source code of WBEM Services [108] reveals that the CIMOM uses the class
java.io.RandomAccessFile to store its data which means that there is no transactional access to the data.
4.3.3 Other Inventory Solutions
Other inventory solutions which are not CMDBs nor based on CIM are listed here.
Again, there exist too many solutions to describe all of them here.
OCS Inventory NG
OCS Inventory NG [73] is an inventory solution combined with software deployment
capabilities. It is written in PHP and Perl, runs in an Apache HTTP Server 18 and
16
Berkeley DB is a trademark of Oracle and/or its affiliates
SQLite is a registered trademark of Hipp, Wyrick & Company, Inc.
18
Apache and Apache HTTP Server are trademarks of The Apache Software Foundation
17
29
4 State of the Art
the data is stored in a MySQL database [76]. OCS Inventory NG provides agents
(clients) for Windows, many Unix-like systems and Mac OS 19 [77]. Unfortunately
OCS Inventory NG has no possibility to automatically update data of custom hardware20 and has no event system (see the list of features [74]).
Open-AudIT
Open-AudIT [80] is an inventory solution based on the scripting languages PHP,
Bourne-again shell (bash) and Visual Basic 21 Script (VBScript) (see [81]). OpenAudIT runs in a web server, supports Linux and Windows operating systems and
uses a MySQL database to store the data [82]. The documentation of Open-AudIT
consists only of a Internet forum. As can be seen from the source code (available at
[83]) support for custom hardware is only possible through changing the application
code and there are no event reporting capabilities and therefore no possibility to
integrate Open-AudIT into a system management software.
Spiceworks
Spiceworks 22 [97] is a network management software. According to the documentation in the Spiceworks community [101], the Spiceworks server runs on Windows
only but it can manage Linux and Mac OS machines as well. The data is stored
in a SQLite database [100]. Spiceworks provides many features like monitoring, an
event system (called alerts), a help desk/ticketing system and many more but unfortunately it does not support automatic updates of custom hardware data (custom
attributes can only be updated manually, see [98]; a feature request for custom
hardware is still pending, see [99]).
GLPI
Gestionnaire libre de parc informatique (GLPI) [31] is a system management solution. According to the official documentation [32] GLPI is based on PHP, runs in a
web server, the data is stored in a MySQL database, it provides a “System of notifications on events” [32] but relies on either OCS Inventory NG (see section 4.3.3) or
FusionInventory [28] for automatic discovery and update. However, neither OCS Inventory NG20 nor FusionInventory (the fixed list of discovered information is shown
in [29]) supports automatically updated custom hardware.
19
Mac and Mac OS are trademarks of Apple Inc., registered in the U.S. and other countries
This refers to the state when the review was done, which was around May 2010. In the new
version 2.0 there is full support of custom hardware in the inventory, (see [75]).
21
Visual Basic and VBScript are registered trademarks of Microsoft Corporation in the United
States and other countries
22
SPICEWORKS is a trademark of Spiceworks in the U.S. and/or other countries
20
30
4.4 Conclusion
4.4 Conclusion
Although there exist many solutions which implement the functionality of an inventory, most of them do not fulfill the requirements of a heterogeneous computer
cluster with custom hardware. The products Zenoss Core, OCS Inventory NG and
Spiceworks nearly meet the requirements but still are missing features. Only IBM
Tivoli Configuration Manager provides all required features but disqualifies itself
due to its complexity and price.
Since none of the existing solutions achieve the goal of this thesis without modifications, a new inventory solution is developed which is fully integrated in SysMES
and therefore makes the most use of the SysMES features (see section 5.1).
31
5 Conceptual Work
This chapter describes the concepts and architecture of the SysMES inventory module. In the first part of this chapter, several conceptual questions are discussed and
in the second part, the architecture and workflow of the inventory is described.
5.1 Conceptual Decisions
To realize an inventory solution which fulfills the requirements from section 2.1,
there are some conceptual questions that need to be answered:
• Questions concerning the model and data storage:
– Which model shall be used?
– How is the data stored and accessed?
• Questions concerning the workflow of the inventory:
– How is the inventory data collected?
– How is the collected data transferred to the data storage?
– How are scalability and reliability ensured?
– How can the behavior of the inventory be configured?
The integration of the inventory module into SysMES has been taken into account
to answer this questions.
Which model shall be used?
The model used for the SysMES inventory module can be any model which complies with the CIM specification. There are two reason why the decision was made
to use CIM-based models. The first one is that CIM is a widespread, extendable and
maintained standard which increases the interoperability with other software and
the second one is that an object-oriented model satisfies the complexity of a heterogeneous IT environment. Although the inventory module can be used with any
CIM-conform model, it is shipped with a subset of the CIM Schema as the default
model. This selected subset should cover the most commonly used components of an
IT environment. However, if this default model is not sufficient it can be extended
or a new model can be written from scratch. In this way, custom hardware can be
included in the inventory.
33
5 Conceptual Work
How is the data stored and accessed?
As already mentioned in section 2.2, the data interface needs to provide transactional
access which makes it reasonable to use a DBMS as the data storage. Additionally,
the data shall be available independently of the data source which can be realized
using a central database. Since SysMES already uses a RDBMS, it is convenient
to use the existing RDBMS as the data storage. In this way, the RDBMS can be
used as the data interface by using structured query language (SQL) queries as
a standardized access method. The scalability of the centralized RDBMS can be
achieved by clustering the RDBMS.
However, CIM was not designed to be used together with a RDBMS. One approach
to use CIM with a RDBMS in spite of that, is to generate programming language
classes corresponding to the classes in CIM, and then to use ORM to store the
instances in the RDBMS. This approach, which is called CIM+ORM, was developed
by M. Hermann and Ø. S. Haaland and is described in detail in [34] and [35]. The
SysMES inventory module uses this approach to store CIM objects in a RDBMS.
How is the inventory data collected and how is it transferred to the data
storage?
The collection of the data is realized using two mechanisms: discovery and update.
While discovery detects which objects exist on a node, the update keeps the properties of the detected objects up to date. The reason why there are two separated
mechanisms is explained in the following:
Computer systems consist of many different objects with different properties.
Some of these objects and properties are typically more important than others and
the properties got different time frames in which they change their value. The example from section 2.1 shall be recovered to illustrate this: the total size of a hard disk
changes due to bad sector on a scale of years and its exact value is less important
than the IP address of a node which might change every few days if the DHCP
is used and configured accordingly. To reflect these differences in the inventory, it
is necessary to be able to update some properties more often than others (in the
example the hard disk size could be updated every month and the IP address every
day). This means that the update interval has to be configurable individually for
every property, i. e. the atomicity of the configuration of the update interval has to
be on property level. This is realized by updating each property separately of the
others. However, since there can be hundreds of properties in a complex model, it
is necessary to ensure that the units performing the update are deployed only on
those nodes where they are needed. That means that the updating units shall be
deployed only on those nodes where the corresponding objects exist and this is the
information gathered by the discovery.
The monitoring capabilities of SysMES provide the suitable infrastructure for
34
5.1 Conceptual Decisions
performing the discovery and update of the inventory data. The discoveries and
updates are realized in three steps: the data is collected using SysMES monitors
which run on the nodes, the data is transferred to the server using SysMES events
and the events are then passed to the SysMES inventory module to process them and
adjust the data in the database accordingly. The monitors performing the discovery
are called discovery monitors and the monitors used for the updating are called
update monitors respectively. The update monitors are generated and deployed
on the nodes where they are needed, depending on the information gained from the
discovery monitors. Both monitor types are run periodically on the nodes with a
given discovery respectively update interval to ensure the continuous discovering of
objects and updating of properties.
How are scalability and reliability ensured?
Scalability and reliability are ensured through the integration of the inventory module into the SysMES framework because the inventory module adopts the scalability
[65, section 4.3] and dependability [65, section 4.4] concepts of SysMES. In detail
this means that the scalability and reliability is achieved through clustering of server
functionality, relocation of processing, fault prevention and fault tolerance. All these
concepts are implemented and used by the SysMES framework and the inventory
module relies on this infrastructure.
Another advantage of the integration of the inventory into SysMES is that the
inventory can be used together with the rule system [65, section 5.4.2.4] to perform
actions in selected situations such as the disappearance of a device. This can be
realized either by directly triggering on the events generated by the update monitors, or by triggering on events which the inventory can generate when an object
appears, disappears or the value of a property changes. This allows the inventory to
be integrated into the automatic problem recognition and solution strategies of the
managed environment.
How can the behavior of the inventory be configured?
All settings which control the behavior of the inventory are stored in so-called inventory settings and inventory properties which are both stored in a database.
The inventory settings and inventory properties represent the mapping between the
data in the real world and the classes and properties in the model:
• Each inventory settings object describes the mapping of objects in the real
world to instances of one class of the model. This means that for each object
which is detected during the discovery, one instance of the corresponding model
class is created.
35
5 Conceptual Work
• An inventory settings object may contain several inventory properties which
describe the mapping of object data in the real world to properties of the
instances. This mean that for each object property covered by the update
mechanism, there exists one property of the corresponding instance.
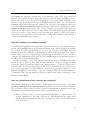
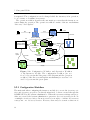
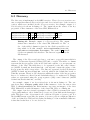
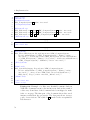
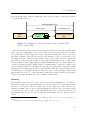
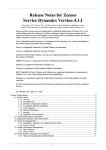
Figure 5.1 visualizes this mapping approach.
Real World
Object A
A.1 = 3
A.2 = 'dog'
Mapping
InventorySettings A
A.1
Object A'
A.1 = 10
A.2 = 'cat'
A.2
InventorySettings B
Model
Object B'
B.1 = 8
B.2 = 1.4
Class A
A.1 : int
A.2 : string
A
A.1 = 3
A.2 = 'dog'
A'
A.1 = 10
A.2 = 'cat'
B
B.1 = 17
B.2 =
B.1
Object B
B.1 = 17
B.2 = 0.3
Instances
Class B
B.1 : int
B.2 : float
B'
B.1 = 8
B.2 =
Figure 5.1: Modelling using Inventory Settings and Inventory
Properties. The diagram visualizes how modelling is realized in the
inventory module. The small boxes in the “Mapping” frame are
inventory properties. The empty values of property “B.2” in the instances of inventory settings B are the result of the fact that there
is no inventory property defined for this property.
An example for the modelling of the real world using inventory settings and inventory properties gives the modelling of hard disks. In the example, there shall be a
node with two different hard disks installed, called “sda” and “sdb”, and each hard
disk got a total size. Furthermore, the model shall contain a class called “HardDisk”
with the property “TotalSize”. Then, the modelling could be done as follows: One
inventory settings object would be created which maps hard disks of the real world
to instances of the class “HardDisk”. Additionally, one inventory property would be
created which is attached to the inventory settings object and maps the total size
in the real world to the model property “TotalSize”. During the discovery of that
36
5.2 Workflow of the Inventory Module
node, the inventory settings would create two instances of the class “HardDisk”,
one for “sda” and one for “sdb”. The updating mechanism then fills the property
“TotalSize” of these model instances with the total size of the real world hard disks
using the inventory property attached to the inventory settings object.
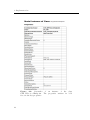
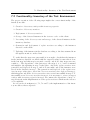
Table 5.1 lists the important settings of inventory settings and inventory properties
along with a short description. Both, inventory settings and inventory properties,
can be created and edited through the SysMES GUI.
Inventory Settings
InstanceID
ClassName
DiscoveryScript
AssociationScript
EventSeverity on
Instance Creation
EventSeverity on
Instance Deletion
Identifier of the inventory settings
Name of the mapped model class
Script or binary that detects the existence of objects
Script or binary that creates associations between the
found instances
Severity of the event that is created when a new object
is detected
Severity of the event that is created when a object disappeared
Inventory Property
PropertyName
UpdateScript
UpdatePeriod
UpdateTimeout
EventSeverity on
Value Change
Name of the mapped model property
Script or binary that reads out the value of the property
Period, the value of the property is updated with
Timeout which indicates that the UpdateScript crashed
Severity of the event that is created when the value of
the property changed
Table 5.1: Important settings of Inventory Settings and Inventory
Properties. For better readability the names of the settings have
been slightly changed from those used in the implementation.
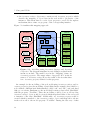
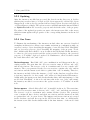
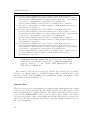
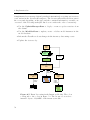
5.2 Workflow of the Inventory Module
The configuration workflow and the operation workflow of the SysMES inventory
module are shown in figure 5.2. The blue parts of the figure concern the configuration
workflow and are described in section 5.2.1. The green parts concern the operation
workflow and are described in sections 5.2.2 and 5.2.3.
The configuration workflow describes the steps which are performed to configure
the inventory module. These steps need to be performed before the inventory is
put into operation and can be repeated when an adjustment of the configuration
37
5 Conceptual Work
is requested. The configuration can be changed while the inventory is in operation,
i. e. no restart or downtime is necessary.
The operation workflow describes the automatic processes that the inventory executes during its operation. The operation workflow consists of the two mechanisms
“discovery” and “update”.
DB
GUI
Admin + GUI
store
Admin
generate
use
Inventory Settings
Discovery Monitor
Instance
Cache
Inventory Module
SysMES Server
store /
update
generate
deploy
Model Instances
and Data
Instance
Cache
Model Instances
and Data
Inventory
deploy
Model DB
Update Monitors
display
Figure 5.2: Configuration Workflow and Operation Workflow
of the Inventory Module. The configuration workflow (see section 5.2.1) concerns the blue parts of the diagram and the operation
workflow of the discovery and update mechanisms (see sections 5.2.2
and 5.2.3) concerns the green parts.
5.2.1 Configuration Workflow
The main task when configuring the inventory module is to create the inventory settings and inventory properties. As already mentioned, both are created through the
SysMES GUI by the system administrator. When the necessary settings and properties are created, the system administrator generates discovery monitors from one
or multiple inventory settings. In most cases it is enough to combine all inventory
settings into one discovery monitor. However, there may be scenarios where more
38
5.2 Workflow of the Inventory Module
discovery monitors are needed. For example, if there are nodes with different, binary incompatible operating systems in the environment (e. g. Linux and Microsoft
Windows), it may be necessary to create different scripts or binaries for each operating system and therefore create different discovery monitors. The created discovery
monitors are then deployed on every node that shall be included in the inventory.
This deployment starts the discovery mechanism on these nodes.
5.2.2 Discovery
As already explained, the discovery mechanism is responsible for detecting the objects on the node and associations between these objects. For that purpose, the
discovery monitor executes the so called DiscoveryScripts on every node it was
deployed on. The DiscoveryScript is part of each inventory settings and contains
the logic for the detection of the objects. For every object the DiscoveryScript detects, it returns the key properties needed to create the instance in the model (see
section 3.1). The discovery monitor sends these values to the inventory module on
the SysMES server for further processing and in addition, it saves the values in the
instance cache. The purpose of the instance cache will be described in the next
paragraph. Additionally the discovery monitor executes the AssociationScript
to create associations between the detected objects. On the server, the inventory
module uses the values of the key properties and the created associations to create
or delete instances and associations in the model database to reflect the existence
and relationships of the objects in the real world. The recognition of new and disappeared objects is realized by an internal bookkeeping called instance log. The
instance log stores which instances originate from which nodes.
The discovery monitors keep running on the nodes with the period defined in the
discovery monitor to detect appearance or disappearance of objects at a later time.
Instance Cache
The UpdateScripts need the key properties of the detected objects to be able to
assign the property values to the correct instance in the model database. Likewise,
the AssociationScripts need the key properties to create the associations between
the correct instances. To avoid that the scripts have to connect to the SysMES
server to get these values, or need to read out the key properties again, the instance
cache stores and provides the values of the key properties. In detail, it stores the
key property values of the instances which were detected during the last discovery
on the node, i. e. every discovery run overwrites the values of the previous discovery
run. This ensures that the instance cache is always up to date.
39
5 Conceptual Work
5.2.3 Updating
After the inventory module has processed the data from the discovery, it decides
which update monitors have to be deployed (if objects appeared) or deleted (if objects
disappeared) on the nodes. It generates the necessary update monitors and deploys
or deletes them accordingly. The update monitors will then run in the interval defined
as UpdatePeriod in the inventory property and check the value of the property.
The values of the updated properties are sent to the inventory module on the server
which in return updates the properties of the corresponding instances in the model
database.
5.2.4 Use Cases
To illustrate the mechanisms of the inventory module, three use cases are described
exemplary in this section. All use cases assume an inventory configuration with one
inventory settings object describing the mapping of a model class called “HardDisk”
and one inventory property object describing the mapping of the property “TotalSize”. Additionally there shall be one node that is already included in the inventory,
i. e. there is a discovery monitor and the update monitor belonging to the inventory
property of “TotalSize” deployed on the node. Furthermore, the node shall contain
two hard disk called “sda” and “sdb”.
Device disappears Hard disk “sdb” gets a malfunction and disappears in the operating system. The next time the discovery monitor runs, it detects only “sda”
and its associations. The instance cache is overwritten and does not contain “sdb”
anymore. The event generated by the discovery monitor contains only “sda” and its
associations and the inventory module recognizes that “sdb” is missing. Therefore,
the inventory module deletes the instance of “sdb” in the database as well as all associations connected to it. As a result, “sdb” will not be listed in the GUI anymore.
Additionally, the inventory module checks whether there still exist instances of the
model class “HardDisk” on the node and since this is the case (“sda” still exists),
the inventory module does not remove the update monitor of “TotalSize” from the
node.
Device appears A hard disk called “sdc” is installed in the node. The next time,
the discovery monitors runs, it detects “sda”, “sdb”, “sdc” and their associations.
The instance cache is overwritten and contains all three devices. The generated
event contains all three devices and their associations and the inventory module
recognizes that “sdc” is a new device. The instance and its associations are created
in the database and will show up in the GUI from that time on. Additionally,
the inventory module checks whether this is the first instance of the model class
40
5.2 Workflow of the Inventory Module
“HardDisk” on this node and since this is not the case, no update monitors have to
be deployed since they are already running on the node.
Device Property changes Hard disk “sda” gets damaged and some of the sectors
are not readable anymore, i. e. the total disk size is reduced. The next time, the
update monitors for the property “TotalSize” runs, it reads the instance cache to
get a list of the detected hard disks. For every detected hard disk, it reads out the
total size and generates an event. On the server, the inventory module writes the
values of the total size into the database if they have changed. After that, the GUI
will show the new total size of “sda”.
41
6 Implementation
The inventory module has been written using Java EE technologies to fully integrate
into SysMES. The processing components are thereby implemented as stateless session beans and the delivery of events from SysMES to the inventory module is
implemented using JMS and a message-driven bean. As stated in section 5.1, the
method CIM+ORM is used to persistently store and access the model instances.
The ORM solution used in the inventory module is Hibernate since it is the most
popular ORM solution for the Java programming language and is already included
in the JBoss AS.
The following sections describe the implementation of the concepts and mechanisms described in chapter 5.
6.1 Model and Data Storage
Since CIM-based models typically are provided as Managed Object Format (MOF)
files, the model has to be converted to Java classes in order to be used by an
ORM solution and the inventory module. This is the main task of the CIM+ORM
method and is accomplished by a tool called ChainReaction which is described in [34,
section 6.2] as the “Schema Management Tool”. Details about how ChainReaction
realizes the mapping of Java classes into the relational model, can be found in [34].
Additionally, ChainReaction generates the Hibernate mapping file as well as the
database schema definition used to store instances of the model in the database.
The schema definition is directly used by ChainReaction to create the schema in the
database. The Java classes and the Hibernate mapping file are packed into a Java
archive (JAR) and deployed along with the inventory module.
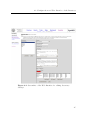
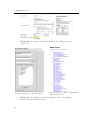
6.2 Configuration and User Interface of the Inventory
As stated in chapter 5 the GUI is used to configure the inventory module namely by
defining inventory settings and inventory properties. Screenshots of the GUI used
for editing each, are shown in figures 6.1 and 6.2.
Additionally to the properties listed in table 5.1, the screenshot in figure 6.1
shows the settings ParentSettingInstanceID and KeyPropertyOrder. The
ParentSettingInstanceID allows to declare a hierarchy of inventory settings by defining a parent for the inventory settings. If no instances of the parent inventory settings
43
6 Implementation
are found during the discovery, then the children are not even checked for instances.
This feature allows to optimize the discovery process by skipping unnecessary DiscoveryScripts. For example, it is not necessary to check for an IP interface if there are
no network cards installed. The KeyPropertyOrder is used to determine the order in
which the key properties of the instances are returned by the DiscoveryScript. The
screenshot in figure 6.2 shows the setting UpdateMethodDetails which is called
UpdateScript in table 5.1.
For creation of discovery monitors, the GUI provides a form which is shown in
figure 6.3a. The system administrator selects the inventory settings to be included in
the discovery monitor and enters a name, a period and a timeout for the discovery
monitor.
The inventory data can be viewed under the menu item model index which shows
a list of all instantiable classes of the model, as shown in figure 6.3b.
Clicking on one of the classes brings up a list of all instances of this class or its
derived classes, as shown in figure 6.4.
Clicking on one of the instances shows the model instance view. The model
instance view lists the values of the properties of the instance (figure 6.6) as well as
the objects which are associated with the instance (figure 6.5).
44
6.2 Configuration and User Interface of the Inventory
Figure 6.1: Screenshot of the Web Interface for editing Inventory
Settings
45
6 Implementation
Figure 6.2: Screenshot of the Web Interface for editing Inventory
Properties
(a) Discovery Monitor Creation Form
(b) Model Index: List of instantiable
classes in the model
Figure 6.3: Screenshots of the Web Interface: Discovery Monitor
Creation Form and Model Index
46
6.2 Configuration and User Interface of the Inventory
Figure 6.4: Screenshot of the instance list of the class
CIM_LogicalDevice. The table shows the values of the key properties of all instances of the class CIM_LogicalDevice and its derived
classes.
Figure 6.5: Screenshot of the associated objects of a
CIM_ComputerSystem instance
47
6 Implementation
Figure 6.6: Screenshot of an instance of the class
CIM_IPProtocolEndpoint. The properties written in bold
face are the key properties.
48
6.3 Discovery
6.3 Discovery
The discovery is implemented as SysMES monitors. These discovery monitors execute a script that runs all DiscoveryScripts and AssociationScripts of the inventory
settings which were included in the discovery monitor. An example output of a
DiscoveryScript is shown in listing 6.1. The output shows the values of the key
properties of three instances of the class CIM_EthernetPort.
CIM_EthernetPort
CIM_EthernetPort
CIM_EthernetPort
eth0 R S CI M_ Co mp ut er Sy st em R S pc123
R S eth1 R S CI M_ Co mp ut er Sy st em R S pc123
R S lo R S CI M_ Co mp ut er Sy st em R S pc123
RS
Listing 6.1: Example output of a DiscoveryScript. The output
defines three instances of the class CIM_EthernetPort. The order of the fields/columns is given by the KeyPropertyOrder setting which is in this example: CreationClassName,DeviceID,
SystemCreationClassName,SystemName. The symbol R S stands
for the non-printable RS character. The lines are separated by the
LF character.
The output of the DiscoveryScripts has to conform to a special format which is
similar to a Character Separated Values (CSV) file or a table. The fields or columns
represent the key properties of the model class and each line or row represents one
instance of the class. The fields have to be separated by the RS control character (ASCII: decimal 30, hexadecimal 1E, octal 36) and contain the values of the
key property the field corresponds to. The lines are separated by the LF character
(ASCII: decimal 10, hexadecimal 0A, octal 12) which is the default line break on
Unix-like systems. Therefore, LF characters within the values of the key properties
have to be written as a literal \n and backslashes have to be written as \\. Empty
values are represented using the group separator (GS) control character (ASCII
decimal 29, hexadecimal 1D, octal 35).
An example output of an AssociationScript is shown in listing 6.2. The output shows three instance paths which define instances of the association class
CIM_PortImplementsEndpoint. Each instance associates an instance of the class
CIM_EthernetPort with an instance of the class CIM_IPProtocolEndpoint.
The output of an AssociationScript must be a list of CIM object names (also called
object path) similar to those defined in [19, section 8.3] but without the namespace
path. This part of the object name is also called model path or instance path. For
the SysMES inventory module, the syntax of instance paths is a slight modification
of the one defined by CIM, and it is defined in listing 6.3. One remarkable difference
is that line breaks have to be encoded as \n.
49
6 Implementation
C I M _ P o r t I m p l e m e n t s E n d p o i n t . Antecedent =" CIM_EthernetPort .
,→
Crea tionC lassNa me =\" CIM_EthernetPort \" , DeviceID =\" eth0 \" ,
,→
S y s t e m C r e a t i o n C l a s s N a m e =\" CI M_ Co mp ut er Sy st em \" , SystemName
,→
=\" pc123 \"" , Dependent =" C I M _ I P P r o t o c o l E n d p o i n t .
,→
Crea tionC lassNa me =\" C I M _ I P P r o t o c o l E n d p o i n t \" , Name =\"
,→
IP_eth0 \" , S y s t e m C r e a t i o n C l a s s N a m e =\" CI M_ Co mp ut er Sy st em \" ,
,→
SystemName =\" pc123 \""
C I M _ P o r t I m p l e m e n t s E n d p o i n t . Antecedent =" CIM_EthernetPort .
,→
Crea tionC lassNa me =\" CIM_EthernetPort \" , DeviceID =\" eth1 \" ,
,→
S y s t e m C r e a t i o n C l a s s N a m e =\" CI M_ Co mp ut er Sy st em \" , SystemName
,→
=\" pc123 \"" , Dependent =" C I M _ I P P r o t o c o l E n d p o i n t .
,→
Crea tionC lassNa me =\" C I M _ I P P r o t o c o l E n d p o i n t \" , Name =\"
,→
IP_eth1 \" , S y s t e m C r e a t i o n C l a s s N a m e =\" CI M_ Co mp ut er Sy st em \" ,
,→
SystemName =\" pc123 \""
C I M _ P o r t I m p l e m e n t s E n d p o i n t . Antecedent =" CIM_EthernetPort .
,→
Crea tionC lassNa me =\" CIM_EthernetPort \" , DeviceID =\" lo \" ,
,→
S y s t e m C r e a t i o n C l a s s N a m e =\" CI M_ Co mp ut er Sy st em \" , SystemName
,→
=\" pc123 \"" , Dependent =" C I M _ I P P r o t o c o l E n d p o i n t .
,→
Crea tionC lassNa me =\" C I M _ I P P r o t o c o l E n d p o i n t \" , Name =\" IP_lo
,→
\" , S y s t e m C r e a t i o n C l a s s N a m e =\" CI M_ Co mp ute rS ys te m \" ,
,→
SystemName =\" pc123 \""
Listing 6.2: Example output of an AssociationScript. The output
defines three associations of type CIM_PortImplementsEndpoint
between instances of the classes CIM_EthernetPort and
CIM_IPProtocolEndpoint.
The output of both, the DiscoveryScripts and the AssociationScripts, is embedded into a document similar to an XML document. This document is sent to the
inventory module on the SysMES server for further processing. An example of such
a document is shown in listing 6.4.
Instance Cache
The DiscoveryScripts are encapsulated in a wrapper script which analyses the output
of the DiscoveryScript and saves the data in the instance cache. The instance cache
itself is implemented as a SQLite database. The names of the tables in the instance
cache are the InstanceIDs of the inventory settings. The columns of the tables
are the key properties of the corresponding model class. The tables are cleared each
time before the DiscoveryScript is executed to prevent orphaned instances in case
an object disappears.
50
6.3 Discovery
instancePath = className "." keyValuePairList
className = schemaName " _ " identifier
schemaName = ALPHA *( ALPHA / DIGIT )
identifier = ( ALPHA / " _ " ) *( ALPHA / " _ " / DIGIT )
keyValuePairList = keyValuePair *( " ," keyValuePair )
keyValuePair = ( propertyName "=" constantValue ) / (
,→
propertyName "=" instancePath )
propertyName = identifier
constantValue = integerValue / realValue / charValue /
,→
stringValue / booleanValue
integerValue = binaryValue / octalValue / decimalValue /
,→
hexValue
binaryValue = [ " -" ] 1* binaryDigit ( " b " / " B " )
binaryDigit = "0" / "1"
octalValue = [ " -" ] "0" 1* octalDigit
octalDigit = "0" / "1" / "2" / "3" / "4" / "5" / "6" / "7"
decimalValue = [ " -" ] ( p o s i t i v e D e c i m a l D i g i t * decimalDigit
,→
/ "0" )
decimalDigit = "0" / p o s i t i v e D e c i m a l D i g i t
positive D e c i m a l D i g i t = "1" / "2" / "3" / "4" / "5" / "6" /
,→
"7" / "8" / "9"
hexValue = [ " -" ] ( "0 x " / "0 X " ) 1* hexDigit
hexDigit = decimalDigit / " a " / " A " / " b " / " B " / " c " / " C "
,→
/ "d" / "D" / "e" / "E" / "f" / "F"
realValue = [ " -" ] * decimalDigit "." 1* decimalDigit [ ( " e "
,→
/ " E " ) [ "+" / " -" ] 1* decimalDigit ]
booleanValue = " true " / " false " ; this rule is
,→
case - insensitive
charValue = " ’" UCScharChar " ’"
stringValue = 1*( """ * stringChar """ )
stringChar = "\"" / "\\" / "\ n " / UCScharString
UCScharString is any UCS character , except U +0022 , U +005 c
,→
and U +000 A
UCScharChar is any UCS character , except U +0027
Listing 6.3: Syntax of an Instance Path in ABNF. The syntax is
a slight modification of the syntax defined in [19, Annex A]. ALHPA
and DIGIT are defined in the ABNF standard [16]. The Universal
Multiple-Octet Coded Character Set (UCS) [105] is virtually the
same as Unicode.
51
6 Implementation
1
2
3
4
5
6
7
8
9
10
11
<d i s c o v e r y>
<i n s t a n c e s>
<ComputerSystem>
CIM_ComputerSystem R S t i 0 7 6 . i n t e r n a l
</ ComputerSystem>
<E t h e r n e t P o r t>
CIM_EthernetPort R S e t h 0 R S CIM_ComputerSystem R S t i 0 7 6 . i n t e r n a l
CIM_EthernetPort R S e t h 1 R S CIM_ComputerSystem R S t i 0 7 6 . i n t e r n a l
CIM_EthernetPort R S l o R S CIM_ComputerSystem R S t i 0 7 6 . i n t e r n a l
</ E t h e r n e t P o r t>
[. . . ]
38 </ i n s t a n c e s>
39 <a s s o c i a t i o n s>
[. . . ]
63 <F i l e S y s t e m>
64 CIM_HostedFileSystem . GroupComponent=" CIM_ComputerSystem .
,→
CreationClassName=\" CIM_ComputerSystem\ " ,Name=\" t i 0 7 6 .
,→
i n t e r n a l \ " " , PartComponent=" CIM_FileSystem . CreationClassName
,→
=\" CIM_FileSystem \ " ,Name=\" / dev / sda2 \ " , CSCreationClassName=\
,→
" CIM_ComputerSystem\ " ,CSName=\" t i 0 7 6 . i n t e r n a l \ " "
65 </ F i l e S y s t e m>
66
67 <Mainboard>
68 CIM_SystemPackaging . Dependent=" CIM_ComputerSystem .
,→
CreationClassName=\" CIM_ComputerSystem\ " ,Name=\" t i 0 7 6 .
,→
i n t e r n a l \ " " , Antecedent="CIM_Card . CreationClassName=\"
,→
CIM_Card\ " , Tag=\" t i 0 7 6 . i n t e r n a l _ M a i n b o a r d \ " "
69 </ Mainboard>
70
71 </ a s s o c i a t i o n s>
72 </ d i s c o v e r y>
Listing 6.4: Example of a Discovery Result Document. Such an
XML-like document is sent to the inventory module as the result of
a discovery. Some lines of the document have been skipped to make
it fit on one page. The first part of the document shows discovered
instances with their key properties. The last part shows instance
paths of associations. The symbol R S stands for the non-printable
RS character.
52
6.4 Updating
6.4 Updating
The updating is implemented as a SysMES monitor which is generated automatically
by the inventory module if an instance of a model class is detected during the
discovery process. The information needed to generate the update monitor is taken
from the inventory properties. If the last instance of the given model class disappears
from the node, then all concerning update monitors are removed from the client. In
this way, only the necessary update monitors exist on the client. An example output
of an UpdateScript is shown in listing 6.5.
CIM_EthernetPort
CIM_EthernetPort
CIM_EthernetPort
eth0 R S CI M_ Co mp ut er Sy st em R S gateway R S 2 U S 3
R S eth1 R S CI M_ Co mp ut er Sy st em R S gateway R S 2 U S 3
R S lo R S CI M_ Co mp ut er Sy st em R S gateway R S 0
RS
Listing 6.5: Example output of an UpdateScript. The property
updated by this UpdateScript is CIM_EthernetPort.Capabilities.
The values (0, 2 and 3) for the property are defined by CIM
and are aliases for the capabilities “Unknown”, “AlertOnLan” and
“WakeOnLan”. The symbol R S stands for the non-printable RS
character and the symbol U S stands for the non-printable US character. The lines are separated by the LF character.
The output of an UpdateScript has to be formatted in the same way as a DiscoveryScript (see section 6.3) whereby the first fields are the values of the key properties
as defined by the KeyPropertyOrder setting and the last field is the value of the property the UpdateScript refers to. Since the non-key properties can be of an array-type,
a convention is needed to distinguish the array entries. This is done by separating
the array entries using the US control character (ASCII: decimal 31, hexadecimal
1F, octal 37).
6.5 Data Processing in the Inventory Module
As mentioned in section 5.1, the output of discovery monitors and update monitors is
transferred using SysMES events. The events of these monitors are called discovery
events and update events, or generally inventory events. An overview of the
processing of inventory events in the inventory module is shown in figure 6.7. In
SysMES all events are processed by the EventBean which cares about storing the
events in a database where necessary, and dispatching the events to the rules system
or the inventory module. In case of inventory events, the EventBean sends the events
to the InventoryEventQueue which is a JMS queue. The central interface for the
processing of inventory events is the class InventoryEventHandlerBean which
53
6 Implementation
is implemented as a message-driven bean that is instantiated every time an inventory
event arrives in the InventoryEventQueue. The InventoryEventHandlerBean parses
the event and depending on the type and the contained information, executes one
or several of the following tasks (the list does not reflect the order of execution):
• Use the UpdateManagerBean to deploy or remove update monitors from
the clients.
• Use the ModellerBean to update, create or delete model instances in the
model database.
• Inform the EventBean about changes in the inventory data using events.
• Update the instance log.
Event
Bean
InventoryEvent
Queue
Events
InventoryEvent
InventoryEventHandler
Bean
bookkeeping
UpdateManager
Bean
deploy /
remove
InstanceLog
Modeller
Bean
create /
update
Instances
Model DB
Update Monitors
Figure 6.7: Event Processing in the Inventory Module. The colors
correspond to the colors in figure 5.2. The brown colors refer to
internal objects of SysMES or the inventory module.
54
6.6 Writing Discovery, Association and Update Scripts
6.6 Writing Discovery, Association and Update
Scripts
The preferred way of implementing DiscoveryScripts, AssociationScripts and UpdateScripts is using scripting languages. Thereby it does not matter which scripting
language is used as long as the interpreter for the language is installed on the nodes
and the right interpreter is selected by the operating system when the script is executed. The last point is on Unix-like systems typically realized using a sha-bang (#!)
followed by the location of the interpreter as the first line of the script. On other
operating systems this might be realized using associations of filename extensions.
Nevertheless, it is also possible to use compiled programming languages by encoding
the binary using Base64 [60] encoding and insert the encoded binary as the script
in the GUI.
If the scripts are implemented using bash, the inventory module provides three
bash functions which simplify the development of the scripts. These three functions
are called SysMES_echo, SysMES_array and SysMESInv_InstanceCache, and will
be described in the following sections.
SysMES_echo
The function SysMES_echo cares about the correct formatting of the output. In principle it works like the bash built-in echo except that in the output, the parameters
are not separated by spaces but by the RS character. In this way, the output of the
scripts can easily be formatted by calling SysMES_echo once for every instance of
the model class and providing the values of the properties as parameters (respecting
the KeyPropertyOrder).
Synopsis: SysMES_echo [-e] FIELDVALUE...
FIELDVALUE is a value that shall be formatted as the value of a model property.
The parameter -e enables interpretation of backslash escapes in the same way the
echo built-in does (see the manpage of echo for further details).
Listing 6.6 shows how SysMES_echo can be used to format the output of a DiscoveryScript.
SysMES_array
The function SysMES_array is used to format array properties. The parameters of
this function are the entries of the array to be formatted. The output consists of the
array entries formatted according to the description in section 6.4. This means that
the output can be used directly as the value for the property.
55
6 Implementation
#!/ b i n / bash
e t h P o r t I D s=$ ( i f c o n f i g | grep "^\\w" | awk ’{ print ␣$1}’ )
i f [ −n " $ethPortIDs " ]
then
systemKeys=$ ( SysMESInv_InstanceCache
,→
" ComputerSystem . CreationClassName "
,→
" ComputerSystem .Name" )
fo r d e v i c e I D in $ e t h P o r t I D s
do
SysMES_echo " CIM_EthernetPort " " $deviceID " " $systemKeys "
done
fi
Listing
6.6:
Example
CIM_EthernetPort
DiscoveryScript
for
the
class
Synopsis: SysMES_array ARRAYENTRY...
ARRAYENTRY is a value that shall be formatted as an entry of an array property.
The output of SysMES_array can directly be used as input to SysMES_echo. Listing 6.9 shows how SysMES_array can be used to format array properties. When using
SysMES_array to build the array incrementally like in that example, one has to be
careful with empty strings since they are encoded as empty values by SysMES_array.
The secure approach to build an array incrementally is to use an if-then-else statement as shown in listing 6.7.
SysMESInv_InstanceCache
The function SysMESInv_InstanceCache returns key property values of the instances in the instance cache.
Synopsis: SysMESInv_InstanceCache COLUMNDEFINITION...
A COLUMNDEFINITION consists of an InstanceID of an inventory settings followed
by a period (“.”) followed by the name of a property of the corresponding model
class. An example for this is IPInterface.IPv4Address. It is also possible to return all properties of an instance using the asterisk (“*”) instead of a property
56
6.6 Writing Discovery, Association and Update Scripts
# . . . Commands t h a t a l r e a d y u s e t h e a r r a y
i f [ −z " $array " ]
then
a r r a y=$ ( SysMES_array " new_entry1 " " new_entry2 " )
else
a r r a y=$ ( SysMES_array " $array " " new_entry1 " " new_entry2 " )
fi
Listing 6.7: Secure Method to build an Array incrementally using
SysMES_array. If the statement in the “else” branch is used instead
of the statement in the “then” branch when the variable array is
empty then a null value would be added in front of the array.
name, for example: IPInterface.* but one has to beware of file name globbing
which tries to expand the asterisk. To avoid this, one has to use quotes around each
COLUMNDEFINITION or use set -f which disables the globbing (see listing 6.8 and
the manpage of the set command for further details).
If multiple COLUMNDEFINITIONs are provided or if the asterisk is used, then the
output of SysMESInv_InstanceCache has the same format as the expected output of the DiscoveryScripts, i. e. the fields are separated by the RS character and
the lines are separated by the LF character. This allows to use the output of
SysMESInv_InstanceCache directly as the output of the DiscoveryScript as shown
in listing 6.8.
#!/ b i n / bash
set −f
# D i s a b l e f i l e name g l o b b i n g
# t o a v o i d t h e e x p a n s i o n o f " Mainboard . ∗ "
k e y s=$ ( SysMESInv_InstanceCache " Mainboard .*" )
set +f # Enable f i l e name g l o b b i n g
SysMES_echo " $keys " "true"
Listing 6.8: Example
CIM_Card.HostingBoard
UpdateScript
for
the
property
57
6 Implementation
#!/ b i n / bash
set −f
d e v i c e s=$ ( SysMESInv_InstanceCache " EthernetCards .*" )
set +f
RS=$ ’\036 ’ # RS c h a r a c t e r
IFS=$ ’\n’
# S p l i t $ d e v i c e s a t t h e LF c h a r a c t e r
for d e v i c e in $ d e v i c e s
do
d e v i c e I D=$ ( echo " $device " | awk −F "$RS" ’{ print ␣$2}’ )
wakeOnLAN=$ ( sudo e t h t o o l " $deviceID " | grep − i −E
,→
"Wake -? on" )
alertOnLAN=$ ( sudo e t h t o o l " $deviceID " | grep − i −E
,→
"Alert -? on" )
# Warning : The code t o r e t r i e v e " alertOnLAN " i s i m a g i n a r y .
,→
I t s h a l l j u s t d e m o n s t r a t e t h e u s e o f SysMES_array .
c a p a b i l i t i e s=""
i f [ −n " $wakeOnLAN " ]
then
wakeOnLAN="3"
# 3 i s t h e ID f o r "Wake−on−LAN"
c a p a b i l i t i e s=$ ( SysMES_array $ c a p a b i l i t i e s " $wakeOnLAN " )
fi
i f [ −n " $alertOnLAN " ]
then
alertOnLAN="2" # 2 i s t h e ID f o r " A l e r t −On−LAN"
c a p a b i l i t i e s=$ ( SysMES_array $ c a p a b i l i t i e s " $alertOnLAN " )
fi
i f [ −z " $capabilities " ]
then
c a p a b i l i t i e s="0"
fi
SysMES_echo " $device " " $capabilities "
done
Listing 6.9: Example UpdateScript for the property
CIM_EthernetPort.Capabilities. The example script uses
SysMES_array to incrementally build the array.
58
7 Results
To demonstrate that the concept and implementation of the inventory module
achieve the goals of chapter 2, tests of the implementation have been performed.
The tests are designed to cover two aspects: the correct functionality and the performance of the inventory module. Aspects like scalability, reliability and fault-tolerance
of the server side are not tested because these concepts are provided by the SysMES
framework and were tested extensively in [65, chapter 7].
7.1 Description of the Test Environment
The tests of the SysMES inventory module were carried out in a cluster of 60 nodes
connected with a Gigabit Ethernet network. The nodes are equipped with two AMD
Opteron Processors 250 with a clock speed of 2.2 GHz or 2.4 GHz each, and 2 or
4 GB of RAM. The SysMES server and the inventory database were installed on
similar computers. The inventory database was provided by an Oracle 1 10g Express
Edition RDBMS. All nodes except the node which runs the database, are running
Gentoo 2 as operating system (Linux kernel 2.6.31). The database node runs CentOS
(Linux kernel 2.6.18).
The classes and properties from the CIM model that were included in the tests,
are listed in table 7.1.
The tests could not be carried out in the ALICE HLT cluster because there was a
long maintenance phase in which the cluster was closed for the users. Unfortunately,
the tests had to be carried out during this maintenance phase due to the deadline
for the thesis.
1
2
Oracle is a registered trademark of Oracle and/or its affiliates
Gentoo is a trademark of the Gentoo Foundation, Inc.
59
7 Results
CIM_ComputerSystem
Name
The hostname of the node
Caption
User friendly name of the node
CIM_Processor
DeviceID
Identifier of the processor
CurrentClockSpeed Speed of the processor in MHz
Family
Type of the processor
Description
Exact type name of the processor
Stepping
Revision of the processor
AddressWidth
Address width of the processor (32 or 64 bits)
CIM_Card
HostingBoard
Indicates that the card is the motherboard
Tag
Identifier of the card
Model
Mainboard model
Manufacturer
Mainboard manufacturer
CIM_PhysicalMemory
Capacity
Size of the memory in bytes
MemoryType
Type of the memory (DDR, DDR-2, DDR-3, etc.)
FormFactor
Type of the module (DIMM, SODIMM, etc.)
CIM_FileSystem
Name
Name of the file system (e. g. /dev/sda1)
FileSystemType
Type of the file system (NTFS, ext3, etc.)
FileSystemSize
The total size of the file system in bytes
CIM_EthernetPort
DeviceID
Identifier of the port (e. g. eth0)
NetworkAddresses
The MAC address of the port
PortType
Type of the port (10BaseT, 100BaseT or 1000BaseT)
FullDuplex
Indicates if operating in full duplex mode
Speed
Current bandwidth in bits per second
CIM_IPProtocolEndpoint
Name
Identifier of the endpoint (e. g. IP_eth0)
IPv4Address
IPv4 address of the endpoint
IPv6Address
IPv6 address of the endpoint
ProtocolIFType
Indicates which versions of the IP protocol are supported
SubnetMask
The subnet mask of the IPv4 address
Table 7.1: Model Properties included in the Tests. The class names
are written in bold face. The included properties are listed below
their class together with a short description. Common properties
like “CreationClassName”, “SystemName” and “SystemCreationClassName” have been omitted.
60
7.2 Functionality: Inventory of the Test Environment
7.2 Functionality: Inventory of the Test Environment
The proper execution of the following steps implies the correct functionality of the
inventory module:
1. Creation of inventory settings with inventory properties
2. Creation of discovery monitors
3. Deployment of discovery monitors
4. Storage of the detected instances in the instance cache on the client
5. Processing of the discovery event and storage of the detected instances in the
inventory database
6. Generation and deployment of update monitors according to the instances
detected on the client
7. Updating of the instances in the database according to the data returned from
the update monitors on the client
To verify that the steps were successful, it is enough to check that the instances
in the inventory database are filled with the expected values because this is done
in the last step and this step is executed correctly only if all other steps were successful, too. The dependence of the last step to the steps 1, 2, 3, 5 and 6 is natural
and implicit: the updating in step 7 takes place only if the update monitors were
generated and deployed in step 6, and it is successful only if the instances were
stored in the database in step 5. The generation and deployed of the update monitors in step 6 takes place only if the discovery monitors were deployed in step 3,
which happens only if the discovery monitors were created successfully in step 2. To
successfully create discovery monitors in step 2, it is necessary to create inventory
settings with inventory properties in step 1. In contrast, the dependence of step 7 to
step 4 arises from the implementation of the update monitors which use the instance
cache explicitly.
As one can see from figures 6.6, 7.1, 7.2 and 7.3, the implementation of the inventory module works as expected.
61
7 Results
Figure 7.1: Screenshot of an instance of the class CIM_Processor
62
7.2 Functionality: Inventory of the Test Environment
(a) Instance of CIM_ComputerSystem
(b) Instance of CIM_EthernetPort
Figure 7.2: Screenshots of instances of
CIM_ComputerSystem and CIM_EthernetPort
the
classes
63
7 Results
(a) Instance of CIM_FileSystem
(b) Instance of CIM_PhysicalMemory
Figure 7.3: Screenshots of instances
CIM_FileSystem and CIM_PhysicalMemory
64
of
the
classes
7.3 Performance
7.3 Performance
The performance tests of the inventory module concern four aspects: the time needed
to process discovery and update events on the server, and the load produced on the
client when running discovery monitors and update monitors. To measure these
quantities, two test runs were performed. Both test runs lead to identical results
which is why only the results of one run are presented.
On every node, one discovery monitor is deployed. Every discovery monitor generates one event per discovery run. This gives a total of 60 discovery events per
discovery run. The number of update monitors deployed on every node is 23 which
is equal to the number of non-key properties included in the test. There are model
classes where multiple corresponding objects exist on the node (like multiple Ethernet interfaces or RAM modules). Since the update monitors produce one event per
object, the number of update events received from the nodes differs depending on
the objects found on the node (e. g. there are nodes with 4 RAM modules and nodes
with 8 RAM modules). The total number of update events received per update run
is 3528.
To ensure equal conditions for every test run, all databases were cleared before
each test run. That means that the inventory database contained no instances, no
events were in the SysMES database and the instance log was empty. Then, the
discovery monitors were deployed on the nodes. Monitors are executed the first
time immediately after they are deployed. The discovery events generated during
the first execution are sent to the server, the instances are created and saved in
the database, and the update monitors are generated and deployed. The generated
update events are sent to server and the instances are updated accordingly. This first
discovery and update run is called rollout. The deployed monitors keep running
on the nodes in the specified discovery respectively update interval. In the discovery
runs after the rollout, the server processes only the instance information and does
not generate update monitors because no new objects appear on the nodes in the
test scenario. After a defined time, the test is stopped by killing the SysMES clients
on the nodes. The test time has been chosen long enough to ensure that all events
of the last update run are recorded.
The timing of the discovery and update runs in the performance tests is shown
in figure 7.4. There are situations where the discovery and the update run simultaneously (at the rollout and at minute 24) and situations where each process is
executed separately (e. g. at minute 8 and minute 12). This produces three different
situations: the rollout, one process alone (either discovery or update) and both processes simultaneously. In each of these situations, the four aspects mentioned above
have to be examined.
The period of the update monitors is 8 min (see figure 7.4) for all model properties
and nodes. This way all update monitors are running simultaneously which simulates
load on the server and clients. In a productive setting, this scenario should be avoided
65
7 Results
min 0
4
8
12 16 20 24 28 32 36 40 44 47
Discovery
0
12
24
36
Update
0
8
16
24
32
40
Figure 7.4: Timing Diagram of the Performance Test. Each triangle represent one execution of the corresponding mechanism.
(e. g. by deploying the discovery monitor delayed on arbitrary groups of nodes). The
same applies to the discovery monitors which are all running with a period of 12 min
(se figure 7.4).
7.3.1 Server-Side
The performance of the server-side is indicated by the amount of events the server
can put through in a given time. While this is the quantity to measure the performance, it does not give the best insight of the behavior of the event processing
because it does not contain information about single events. A quantity which gives
a better insight is the time a single event takes to go through the inventory module.
Therefore, in the first place this time is investigated and at the end of this section,
the event throughput is inspected.
The time the events take to go through the inventory module is called server detention time (see figure 7.5). The server detention time starts with the handing over
of the event from the EventBean to the InventoryEventQueue. The server detention
time is composed of the time the event remains in the InventoryEventQueue which
is called the waiting time, and the time the event is processed by the InventoryEventHandlerBean which is called the processing time (see figure 7.5). The processing
time includes all the tasks described in section 6.5.
The server detention time excludes the time the event needs to travel through the
network, i. e. from the client to the server. This was an explicit decision to make
the results independent of the used network. The measured times also exclude the
time the event spends in the SysMES event management classes. However, since
the dispatching of the inventory events into the inventory module is one of the first
things that happen within the event management, this overhead is negligible in the
tests.
In addition to the above times, the duration of the rollout is measured. It is mea-
66
7.3 Performance
sured from the start of the test until the end of the processing of the last inventory
event from the rollout.
Server Detention Time
Waiting Time
Event
Bean
InventoryEvent
Queue
Processing Time
InventoryEventHandler
Bean
Figure 7.5: Definition of Server Detention Time, Waiting Time
and Processing Time
The bar charts in this section show the server detention time, the waiting time
and/or the processing time of the events. The red part of the bars is the contained
processing time and the blue part is the contained waiting time. The y-axes show
the time in milliseconds. The x-axes show the number of the events in the corresponding test run, ordered by the arrival on the server. Error bars are omitted in
the charts because the uncertainty for the time measurement is ∆t = 1 ms (using
the Java method java.lang.System.currentTimeMillis() on a Linux Kernel 2.6
or later operating system3 ) which leads to an uncertainty of ∆tdiff ≈ 1.4 ms for the
server detention time, the waiting time and the processing time. This uncertainty
results from a Gaussian propagation of uncertainty4 since the desired durations are
all differences of measured points in time. For most of the measured values, this
uncertainty is below 1 % of the measured value and is barely visible in the charts.
Therefore the uncertainties have been omitted in the charts.
Discovery
The results for the discovery events of the tests are shown in figures 7.6, 7.7 and 7.8.
The mean values of the measured times are shown in table 7.2. The mean values
in table 7.2, except for the processing time of the “Discovery only” and the “Simultaneous Run”, refer to non-constant quantities. In those cases, the mean values
are presented to give an idea of the magnitude since the exact mean value is not
meaningful. This is also the reason why the uncertainties are not given for those
values.
3
The resolution of 1 ms has been stated in different sources. See [55], [11], [52] and [61, section 2.3].
4
For details about uncertainties and their propagation see [17] or [5]
67
7 Results
P
Rollout
Discovery only
Simultaneous Run
Waiting (ms)
Processing (ms)
49 261
34 605
9927
8704 ± 49
9502
9037 ± 36
Server Detention (ms)
83 867
17 743
17 879
Table 7.2: Arithmetic Mean of the measured Times for Discovery
Events. The stated uncertainties are estimated using the standard
error of the mean (SEM). The uncertainties for non-constant quantities have been omitted since the mean values of that quantities
lack significance. The mean values of the processing time during the
non-rollout runs include only the constant processing times (compare figure 7.9).
180000
160000
140000
Time / ms
120000
100000
Processing
Waiting
80000
60000
40000
20000
0
1
4
7
10
13
16
19
22
25
28
31
34
37
40
43
46
49
52
55
58
Event
Figure 7.6: Server Detention Time of Discovery Events – Rollout. The bar chart shows the server detention time of the discovery events from the rollout. For a description of the chart see section 7.3.1.
68
7.3 Performance
40000
35000
30000
Time / ms
25000
Processing
Waiting
20000
15000
10000
5000
0
1
4
7
10
13
16
19
22
25
28
31
34
37
40
43
46
49
52
55
58
Event
Figure 7.7: Server Detention Time of Discovery Events – Discovery only. The bar chart shows the server detention time of the
discovery events from the discovery of minute 12 (see figure 7.4).
For a description of the chart see section 7.3.1.
45000
40000
35000
Time / ms
30000
25000
Processing
Waiting
20000
15000
10000
5000
0
1
4
7
10
13
16
19
22
25
28
31
34
37
40
43
46
49
52
55
58
Event
Figure 7.8: Server Detention Time of Discovery Events – Simultaneous Run. The bar chart shows the server detention time of the
discovery events from the discovery of minute 24 (see figure 7.4).
For a description of the chart see section 7.3.1.
69
7 Results
Figure 7.6 shows that the processing time, the waiting time and the server detention time vary strongly during the rollout. The behavior of the discovery event
processing during the rollout is discontinuously because there are several tasks executed at the same time: processing of discovery events, processing of update events,
deployment of discovery monitors and deployment of update monitors. Since the
scheduling of the different Java beans is unpredictable, it is not possible to interpret
this behavior in detail. The only significant information obtained from this measurement is that the processing of events during the rollout is about a factor of 4 – 5
slower compared to the other discovery runs.
The successive discovery runs on the other hand show a predictable behavior. The
“Discovery only” run (figure 7.7) shows a linear growth of the server detention time.
A linear regression gave a slope5 of about (553 ± 11) ms/Event with a coefficient
of determination of R2 ≈ 0.97. This behavior can be explained by looking at the
configuration of the InventoryEventHandlerBean: the maximum number of JMS
sessions allowed is 15. That means that for every discovery event a new instance
of the InventoryEventHandlerBean is created until the maximum of 15 is reached.
The parallel execution of the InventoryEventHandlerBeans produces load on the
server and the database, which causes the linear increase of the processing time
at the beginning. The processing of the first two discovery events is thereby faster
(tprocess ≈ (561 ± 25) ms) because the server system contains two CPUs which allow
true parallel execution. Starting with the 16th discovery event, the events have
to wait in the InventoryEventQueue until the processing of a previous discovery
event is completed. Therefore, the waiting time increases linearly with a slope of
approximately (544 ± 19) ms/Event (R2 ≈ 0.95) while the processing time stays
nearly constant due to the constant parallel processing of 15 discovery events.
During the “Simultaneous Run” (figure 7.8) the characteristics are identical to
those during the “Discovery only” run except that the processing times start increasing again for the last discovery events as can be seen in figure 7.9. This can be
explained by the fact that the last 14 discovery events are processed in parallel to
the update events as figure 7.10 shows. This produces additional load on the database and since the processing of discovery events depends on data retrieved from the
database, this additional load slows down the processing of the discovery events.
The rather slow processing of discovery events on the server results on the one
hand from the inefficient equipment of the machines used in the tests as SysMES
server and database server (see section 7.1). This can be seen from the fact that
the first two events which are truly processed in parallel, are processed very fast in
comparison to the subsequent events. On the other hand, there are still possibilities
to speed up the processing of discovery events by optimizing the number of executed
5
Specifying the slope as server detention time per event instead of server detention time per
arrival time allows to abstract from the arrival rate of the events. This is justified because the
arrival rate (respectively the time between the arrival of two events) is approximately constant.
70
7.3 Performance
database queries.
16000
14000
12000
Time / ms
10000
8000
Processing
6000
4000
2000
0
1
4
7
10
13
16
19
22
25
28
31
34
37
40
43
46
49
52
55
58
Event
Figure 7.9: Processing Time of Discovery Events – Simultaneous Run. The bar chart shows the processing time of the discovery
events from the discovery of minute 24 (see figure 7.4). For a description of the chart see section 7.3.1.
Updating
The results for the update events are shown in figures 7.11, 7.12, 7.13, 7.14, 7.15
and 7.16. The mean values of the measured times are shown in table 7.3. Again, the
uncertainties for non-constant quantities have been omitted.
Waiting (ms)
Processing (ms)
P
Server Detention (ms)
Rollout
Update only
Simultaneous Run
91 705
80.67 ± 0.78
79.89 ± 0.73
39.84 ± 0.49
2190
39.79 ± 0.56
91 786
119.7 ± 1.0
2230
Table 7.3: Arithmetic Mean of the measured Times for Update
Events. The stated uncertainties are estimated using the standard
error of the mean (SEM). The uncertainties for non-constant quantities have been omitted since the mean values of that quantities
lack significance.
71
Event
7 Results
44
45
46
47
48
49
50
51
52
53
54
55
56
57
58
59
60
Start of
update event
processing
0 1 2 3 4 5 6 7 8 9 10 11 12 13 14 15 16 17 18 19 20 21 22 23 24 25
Time / s
Figure 7.10: Timing Diagram for the Processing of Discovery
Events – Simultaneous Run. The diagram shows the processing time
of the last discovery events from the discovery of minute 24 (see figure 7.4). The time on the x-axis is the time elapsed since the start of
the processing of discovery event number 44 in this discovery run.
The processing of update events starts right after the processing of
discovery event number 46 (yellow line).
Figure 7.11 shows the server detention time, the waiting time and the processing
time of the update events during the rollout. The processing time is not visible in this
figure because it is too small compared to the waiting time. Therefore, figure 7.12
shows an excerpt of figure 7.11 containing the update events from number 1800
to number 1900. The high waiting time means that the update events waited the
most of the server detention time for the processing of the discovery events and the
previous update events to be completed. From the overview figure, it can be seen
that the waiting time increases initially. This increase is caused by the accumulation
of the update events in the InventoryEventQueue as long as there are still discovery
events to be processed. Afterwards, the waiting time decreases linearly with a slope
of (−28.879 ± 0.017) ms/Event (R2 ≈ 0.999). This is the effect of the decreasing
number of update events in the InventoryEventQueue which is caused by the fact
that the update events are processed slightly faster as they arrive at the server. The
average time between the arrival of two update events is approximately 47 ms. In this
time, the processing of 3 update events is finished on average. The processing time
for a single update events is scattered around the constant value of (80.67 ± 0.78) ms.
The parallel processing effects that more than one event per 80 ms can be processed.
72
7.3 Performance
140000
120000
Time / ms
100000
80000
Processing
Waiting
60000
40000
20000
0
8
22
4
44
0
65
6
87
2
10
8
8
13
04
15
20
17
36
19
5
2
21
6
23
84
8
26
00
28
1
6
30
3
2
32
48
34
64
Event
Figure 7.11: Server Detention Time of Update Events – Rollout.
The bar chart shows the server detention time of the update events
from the rollout. For a description of the chart see section 7.3.1.
The processing time is so small compared to the waiting time that
it is not visible in this diagram. The bars in this chart are so close
together that they may seem like a filled area.
94500
94000
93500
Time / ms
93000
92500
Processing
Waiting
92000
91500
91000
90500
18
00
18
0
7
18
1
4
18
21
18
28
18
3
5
18
4
2
18
49
18
56
18
6
3
18
70
18
77
18
8
4
18
9
1
18
98
Event
Figure 7.12: Server Detention Time of Update Events – Rollout
(Detail). The bar chart shows the server detention time of an excerpt of the update events from the rollout. For a description of the
chart see section 7.3.1.
73
7 Results
900
800
700
Time / ms
600
500
Processing
Waiting
400
300
200
100
0
8
21
6
42
4
63
2
10
4
84
0
8
12
5
6
14
64
16
72
18
8
0
20
88
22
96
25
0
4
27
12
29
20
31
2
8
33
3
6
Event
Figure 7.13: Server Detention Time of Update Events – Update
only. The bar chart shows the server detention time of the update
events from the update of minute 8 (see figure 7.4). For a description
of the chart see section 7.3.1. The bars in this chart are so close
together that they may seem like a filled area.
250
200
Time / ms
150
Processing
Waiting
100
50
0
17
72
17
7
8
17
8
4
17
90
17
9
6
18
02
18
08
18
1
4
18
20
18
26
18
3
2
18
38
18
44
18
5
0
18
56
18
62
18
6
8
Event
Figure 7.14: Server Detention Time of Update Events – Update
only (Detail). The bar chart shows the server detention time of
an excerpt of the update events from the update of minute 8 (see
figure 7.4). For a description of the chart see section 7.3.1.
74
7.3 Performance
25000
20000
Time / ms
15000
Processing
Waiting
10000
5000
0
8
22
4
44
0
65
6
87
2
10
88
13
0
4
15
20
17
3
6
19
52
21
6
8
23
84
26
00
28
1
30
32
6
32
4
8
34
64
Event
Figure 7.15: Server Detention Time of Update Events – Simultaneous. The bar chart shows the server detention time of the update
events from the update of minute 24 (see figure 7.4). For a description of the chart see section 7.3.1. The bars in this chart are so close
together that they may seem like a filled area.
3500
3000
Time / ms
2500
2000
Processing
Waiting
1500
1000
500
0
67
0
68
3
69
6
70
9
72
2
73
5
74
8
76
1
77
4
78
7
80
0
81
3
82
6
83
9
85
2
86
5
87
8
89
1
90
4
91
7
Event
Figure 7.16: Server Detention Time of Update Events – Simultaneous Run (Detail). The bar chart shows the server detention time
of an excerpt of the update events from the update of minute 24
(see figure 7.4). For a description of the chart see section 7.3.1.
75
7 Results
The processing becomes slightly faster (on average tprocess ≈ (76.8 ± 1.6) ms) for the
last few hundred update events because the deployment of the update monitors is
finished at this time, which allows faster processing of the events.
The “Update only” run shows the simplest behavior: the waiting time and the
processing time are scattered around the constant values given in table 7.3 as their
mean values. Compared to the rollout the waiting time is magnitudes smaller while
the processing time is about a factor 2 smaller.
The simultaneous run is a combination of the characteristics of the rollout and
the “Update only” run: At the beginning the update events are accumulated in the
InventoryEventQueue. The waiting time increases slightly for the first few events
(which is barely visible in the figure). Afterwards the waiting time decreases until it
reaches the level of the waiting time during the “Update only” run. The rest of the
update events show times similar to those during the “Update only” run.
Rollout
As already mentioned, the duration of the rollout was measured. Since the measurement of the rollout duration of a single test run is little significant, three additional
test runs have been performed in which the rollout duration was measured exclusively. The average over these five test runs with 60 cluster nodes gave a rollout
duration of (238 ± 35) s. This is nearly the sum of a non-rollout discovery run which
takes around 40 s and a non-rollout update run which takes around 170 s (both for
60 nodes).
7.3.2 Client-Side
The performance of the client-side is denoted by the load in terms of CPU and
memory usage. In the tests, both were measured on one client using the Linux
command line tool “top” in intervals of half a second.
Since the load on the client heavily depends on the implementation of the DiscoveryScripts and UpdateScripts, the results shown here apply first and foremost to
the scripts used in these tests. However, in most cases, the used scripts will look
very similar to those used in these tests and therefore the results can be used as a
suitable estimate.
As figure 7.17 shows, the memory and CPU usage are constant except for ten
peaks. The mean values are shown in table 7.4. That there are less peaks than
executions of DiscoveryScripts and UpdateScripts means that most of the executions
were shorter than the 0.5 s interval of the measurements. On the one hand, the
measurement interval could be decreased to see more executions, but on the other
hand, scripts whose run time is below 0.5 s, typically do not influence other processes
in an unacceptable manner (for the ALICE HLT application, even a run time of
several seconds would be acceptable). Therefore, it is not necessary to reduce the
76
7.3 Performance
CPU (%)
Arithmetic Mean
Maximum
Minimum
0.54 ± 0.15
156
0
Memory (%)
Memory (kB)
0.300 51 ± 0.000 36
0.9
0
6458.9 ± 5.4
14 412
2916
180
1
160
0.9
0.8
140
0.7
120
0.6
100
0.5
80
0.4
60
0.3
40
0.2
20
0
Percentage of Memory / %
Percentage of one CPU / %
Table 7.4: Measured CPU and Memory Usage Values. The stated
uncertainties are estimated using the standard error of the mean
(SEM). The minimum and maximum values are the minimal and
maximal observed values of the quantities. The percentage of the
CPU usage is the percentage of one CPU, i. e. a value of 200 %
means two CPUs fully used.
%CPU
%MEM
0.1
6
16
8
33
0
49
2
65
4
81
6
97
8
11
4
0
13
02
14
64
16
2
6
17
8
8
19
50
21
12
22
7
4
24
3
6
25
98
0
Measurement
Figure 7.17: CPU and Memory Usage on the Client. The diagram
shows the percentage of the CPU and memory usage of the SysMES
client and the inventory scripts during the whole test run. The xaxis shows the number of the measurement. The left y-axis shows
the percentage of the CPU usage of one CPU, i. e. 200 % means
two CPUs fully used. The right y-axis shows the percentage of the
memory usage (ranging from 0 % to 1 %). The CPU usage was 0
for most of the measurements.
77
7 Results
measurement interval to see the impact of inventory scripts on the client node.
7.3.3 Event Throughput
The previous sections described and explained the behavior of the event processing
of the inventory module in detail. To see the overall performance of the inventory, the
mean values of the event throughput are given in table 7.5. The event throughput is
calculated by creating a histogram of the points in time when the processing of each
event was finished (using an interval of 1 s for the size of the bins). The arithmetic
mean of the event count in the 1 s intervals is the event throughput.
Assuming the processing of a single event at a time, the server detention times
of the “Discovery only” respectively “Update only” runs (tables 7.2 and 7.3) yield
an event throughput of about 3 discovery events per minute respectively 8 update
events per second. As can be seen from table 7.5, the actual event throughput is with
about 1.6 discovery events per second and 21 update events per second significantly
higher. This is the effect of the parallel processing of events.
The event throughput of the update events during the “Update only” and the “Simultaneous” run does not represent the maximum event throughput of the inventory
module because the events arrive slower than they are processed. As already stated,
the average time between the arrival of two update events is 47 ms. This yields an
arrival rate of about 21 Events/s which shows that the event throughput in these
runs is limited by this rate. The value of this rate is determined mainly by the rate
in which the update monitors were deployed. The maximum throughput of the inventory module is (71.0 ± 1.5) Events/s (see table 7.5) and can be observed during
the rollout. The reason for this is, that during the rollout, the update events are
accumulated in the InventoryEventQueue. As soon as the processing of discovery
events is completed, the gathered update events can be processed at the maximum
throughput.
Event Type
Discovery (Events/s)
Update (Events/s)
Rollout
Discovery/
Update only
Simultaneous Run
0.405 ± 0.047
1.579 ± 0.097
1.364 ± 0.087
16.0 ± 1.1*
71.0 ± 1.5*
21.13 ± 0.73
23.8 ± 1.0
Table 7.5: Arithmetic Mean of the Event Throughput. The stated
uncertainties are estimated using the standard error of the mean
(SEM). *The two values for the event throughput of the update
events during the rollout represent the event throughput while there
are still discovery events being processed (the first value) and after
all discovery events have been processed (the second value).
78
7.4 Summary
7.4 Summary
The functionality test has shown that the discovery and update mechanisms of the
inventory module are working correctly and that it is possible to automatically
build an inventory of a heterogeneous computer cluster using the SysMES inventory
module.
To summarize the results of the performance tests, it can be said that under
heavy load like it was simulated in the tests, the inventory module is able to process
between 0.4 and 1.5 discovery events per second and between 16 and 71 update
events per second. In the tests, this resulted in a rollout duration of about 238 s
which is the time needed to process 3588 events (60 discovery events and 3528 update
events) as a result of including 23 model properties of 60 nodes in the inventory.
Although this is quite long, it is acceptable because the rollout is executed only
once for one configuration of the inventory and the load affects only the server and
the database. The processing of events after the rollout is significantly faster. As
example, the updating of 20 model properties on 100 nodes simultaneously takes
3528
≈ 2.56 events per
approximately 72 s (assuming 71 Events/s throughput and 23·60
property and node). Additionally, the processing can be accelerated by using multicore server hardware and future improvements (see chapter 9) may further accelerate
the processing.
79
8 Conclusion
As shown in chapter 4, the existing inventory solutions are not suitable to be used as
an inventory of a heterogeneous computer cluster with custom hardware as described
in chapter 2. Therefore, a new inventory solution has been developed during this
thesis which meets all the requirements and goals of chapter 2:
• Objects installed in computer systems are discovered automatically. The inventory module realizes the continuous detection of appearance or disappearance
of objects using discovery monitors which run in regular intervals on the nodes.
• The data is stored in a persistent storage and kept up to date automatically.
Update monitors ensure the continuous updating of the object properties in
the inventory data.
• Access to the data is provided using either the web interface, plain SQL or
CIM+ORM (see chapter 5). While CIM+ORM represents the convenient way
to access the data from within applications, SQL ensures the accessibility for
all applications, and the web interface is the preferred way for human access.
• Heterogeneity is supported through adaptable data gathering methods and
the possibility to fully customize the model. The system administrator defines
the gathering methods by writing appropriate monitor scripts. The gathering
intervals can be adjusted for each object property of every node separately, if
necessary. To reflect the managed environment in all its details, the shipped
default model can be extended or a complete new model can be written from
scratch.
• Full integration into SysMES allows reporting of changes in the environment,
provides the possibility to automatically handle problems and ensures the scalability through clustering. The inventory module creates SysMES events which
inform the system administrator about changes in the environment and which
can be used to trigger the rule system of SysMES. To ensure scalability and
reliability, the inventory module makes use of the SysMES scalability and dependability concepts.
• Universal and flexible modelling is ensured by using the CIM. The objectoriented model simplifies the mapping of complex heterogeneous environments
in the inventory.
81
8 Conclusion
• Transactional access as well as data availability and reliability are ensured
through a RDBMS back-end. If necessary, the RDBMS can be clustered to
provide high availability and improved scalability.
• The Java EE technology allows the server to run on nearly every operating
system and a client implementation for Linux exists.
These features contribute to save time and manpower and prevent errors in the inventory data. The tests of the developed solution demonstrated the correct functionality. The performance is satisfying although there are still needs for optimization
in the discovery mechanism.
All in all, the SysMES inventory module provides the most customizable inventory
solution available and therefore it masters the complexity of heterogeneous computer
clusters with custom hardware.
82
9 Future Work
The results of this work leave some improvements open for future work:
Implementation of a Target State
Additionally to the plain image of the actual state of the managed environment, the
SysMES inventory module could be extended to hold a target state of the managed
environment. The target state represents a zero-defect state of the nodes which
allows to detect undesired states by comparing the actual state with the target
state.
The target state can be implemented by building an object hierarchy with the
same model used for the actual state. Differences between the actual and the target
state can then be detected by comparing both object hierarchies. The differences may
be of two different types: structural differences, i. e. differences in the hierarchy itself
like missing objects or missing associations, and value differences, i. e. differences in
the property values of corresponding objects. While structural differences can only
change during a discovery, value differences can only change during updates.
However, not all differences between the actual state and the target state denote
an undesired state. In cases of desired changes (for example replacement of defect
hardware) it is necessary to adjust the target state to reflect such intended changes
in the environment. Therefore, a method to display and edit the target state is
needed.
Optimization of discovery event processing
The processing of discovery events involves several database transactions. For example, it is necessary to retrieve the inventory settings of all objects which were
detected during the discovery. At the current state most of this transactions run
isolated. Combining those transactions would reduce the database communications
and therefore improve the throughput of the discovery event processing.
Installation of the inventory in the HLT productive cluster
Another task to be done is the installation of the inventory module in the productive
partition of the HLT cluster. This task implies thorough testing of the module in
the development partition to ensure that the module does not influence the HLT
application.
83
9 Future Work
Automated inclusion of SysMES clients in the inventory through a rule
deploying a default discovery monitor
An improvement that would simplify the rollout and the replacement of nodes, would
be a rule which automatically deploys a discovery monitor to every or selected
nodes if they show up the first time. This can be implemented by triggering on
AliveEvents with TaskID 0 (for more information about the rule system see
[65]).
Automated network discovery, creation of target masks and installation of the
SysMES client to get an actual state of the whole network
In the current state the SysMES clients have to be installed on the nodes explicitly.
The installation process is automated and can be executed using the SysMES GUI
but it relies on some prerequisites like, for example, the passwordless access of the
sysmes operating system user to the node. Additionally, a target mask has to be
created for every node which requires the knowledge of all existing nodes. This might
be less of a problem in a computer cluster where all nodes are known and where
typically a rollout mechanism for the operating system exists that can ensure such
requirements. However, in other heterogeneous environments this might be different
and in such cases it can be very useful to have the SysMES client installed automatically an all existing nodes by just providing the root password of the machines.
This can be implemented by executing a network discovery which detects all nodes,
creating target masks for the nodes, logging in to the nodes using the root password, setting up all the requirements for the SysMES client installation and finally
installing the SysMES clients.
Network topology visualization (i. e. network map)
Another very useful feature especially for large environments would be the visualization of the network topology. Such a network map can help detecting bottlenecks
in the network and localizing nodes. The prerequisite for a network map is that
the inventory contains the necessary information, i. e. information about the network infrastructure (switches, gateways, etc.) and the connection of the nodes to
the infrastructure.
84
Appendices
85
Appendix A
Lists
A.1 List of Figures
5.1
5.2
Modelling using Inventory Settings and Inventory Properties . . . . . 36
Configuration Workflow and Operation Workflow of the Inventory
Module . . . . . . . . . . . . . . . . . . . . . . . . . . . . . . . . . . . 38
6.1
6.2
6.3
Screenshot of the Web Interface for editing Inventory Settings . . .
Screenshot of the Web Interface for editing Inventory Properties . .
Screenshots of the Web Interface: Discovery Monitor Creation Form
and Model Index . . . . . . . . . . . . . . . . . . . . . . . . . . . .
Screenshot of the instance list of the class CIM_LogicalDevice . . .
Screenshot of the associated objects of a CIM_ComputerSystem instance . . . . . . . . . . . . . . . . . . . . . . . . . . . . . . . . . .
Screenshot of an instance of the class CIM_IPProtocolEndpoint . .
Event Processing in the Inventory Module . . . . . . . . . . . . . .
. 45
. 46
Screenshot of an instance of the class CIM_Processor . . . . . . . .
Screenshots of instances of the classes CIM_ComputerSystem and
CIM_EthernetPort . . . . . . . . . . . . . . . . . . . . . . . . . . .
Screenshots of instances of the classes CIM_FileSystem and
CIM_PhysicalMemory . . . . . . . . . . . . . . . . . . . . . . . . .
Timing Diagram of the Performance Test . . . . . . . . . . . . . . .
Definition of Server Detention Time, Waiting Time and Processing
Time . . . . . . . . . . . . . . . . . . . . . . . . . . . . . . . . . . .
Server Detention Time of Discovery Events – Rollout . . . . . . . .
Server Detention Time of Discovery Events – Discovery only . . . .
Server Detention Time of Discovery Events – Simultaneous Run . .
Processing Time of Discovery Events – Simultaneous Run . . . . . .
Timing Diagram for the Processing of Discovery Events – Simultaneous Run . . . . . . . . . . . . . . . . . . . . . . . . . . . . . . . . .
Server Detention Time of Update Events – Rollout . . . . . . . . .
Server Detention Time of Update Events – Rollout (Detail) . . . . .
Server Detention Time of Update Events – Update only . . . . . . .
. 62
6.4
6.5
6.6
6.7
7.1
7.2
7.3
7.4
7.5
7.6
7.7
7.8
7.9
7.10
7.11
7.12
7.13
. 46
. 47
. 47
. 48
. 54
. 63
. 64
. 66
.
.
.
.
.
67
68
69
69
71
.
.
.
.
72
73
73
74
87
Appendix A Lists
7.14
7.15
7.16
7.17
Server Detention Time of Update Events – Update only (Detail) . . .
Server Detention Time of Update Events – Simultaneous Run . . . .
Server Detention Time of Update Events – Simultaneous Run (Detail)
CPU and Memory Usage on the Client . . . . . . . . . . . . . . . . .
74
75
75
77
A.2 List of Tables
5.1
Important settings of Inventory Settings and Inventory Properties . . 37
7.1
7.2
7.3
7.4
7.5
Model Properties included in the Tests . . . . . . . . . . . . .
Arithmetic Mean of the measured Times for Discovery Events
Arithmetic Mean of the measured Times for Update Events .
Measured CPU and Memory Usage Values . . . . . . . . . . .
Arithmetic Mean of the Event Throughput . . . . . . . . . . .
.
.
.
.
.
.
.
.
.
.
.
.
.
.
.
.
.
.
.
.
60
68
71
77
78
Example output of a DiscoveryScript . . . . . . . . . . . . . . . . . .
Example output of an AssociationScript . . . . . . . . . . . . . . . .
Syntax of an Instance Path in ABNF . . . . . . . . . . . . . . . . . .
Example of a Discovery Result Document . . . . . . . . . . . . . . .
Example output of an UpdateScript . . . . . . . . . . . . . . . . . . .
Example DiscoveryScript for the class CIM_EthernetPort . . . . . .
Secure Method to build an Array incrementally using SysMES_array
Example UpdateScript for the property CIM_Card.HostingBoard . .
Example UpdateScript for the property CIM_EthernetPort.Capabilities . . . . . . . . . . . . . . . . . . . . . . . . . . . . . . . . . . . .
49
50
51
52
53
56
57
57
A.3 List of Listings
6.1
6.2
6.3
6.4
6.5
6.6
6.7
6.8
6.9
A.4 List of Abbreviations
ABNF Augmented Backus-Naur Form.
ADDM Atrium Discovery and Dependency Mapping.
ALICE A Large Ion Collider Experiment.
API application programming interface.
AS application server.
88
58
A.4 List of Abbreviations
ASCII American Standard Code for Information Interchange.
bash Bourne-again shell.
BMC Baseboard Management Controller.
CERN European Organization for Nuclear Research.
CI configuration item.
CIM Common Information Model.
CIMOM CIM Object Manager.
CMDB Configuration Management Database.
CN computing node.
CPU central processing unit.
CSV Character Separated Values.
DBMS database management system.
DDM Discovery and Dependency Mapping.
DHCP Dynamic Host Configuration Protocol.
DMI Desktop Management Interface.
DMTF Distributed Management Task Force.
EJB Enterprise JavaBean.
FEP front-end processor.
GLPI Gestionnaire libre de parc informatique.
GS group separator.
GUI graphical user interface.
H-RORC HLT Read-Out Receiver Card.
HLT High-Level Trigger.
HTTP Hypertext Transfer Protocol.
89
Appendix A Lists
IP Internet Protocol.
IT information technology.
ITIL IT Infrastructure Library.
JAR Java archive.
Java EE Java Platform, Enterprise Edition.
JDBC Java Database Connectivity.
JMS Java Message Service.
JPA Java Persistence API.
JSP JavaServer Pages.
LF line feed.
LHC Large Hadron Collider.
MOF Managed Object Format.
ORM object-relational mapping.
PHP PHP: Hypertext Preprocessor.
RAM random access memory.
RDBMS relational database management system.
RS record separator.
SCCM System Center Configuration Manager.
SEM standard error of the mean.
SMS short message service.
SQL structured query language.
SysMES System Management for Networked Embedded Systems and Clusters.
TCM Tivoli Configuration Manager.
90
A.5 List of Terms
UCMDB Universal Configuration Management Database.
UCS Universal Multiple-Octet Coded Character Set.
US unit separator.
VBScript Visual Basic Script.
WBEM Web-Based Enterprise Management.
XML Extensible Markup Language.
XML-RPC Extensible Markup Language Remote Procedure Call.
ZODB Zope Object Database.
A.5 List of Terms
action 20
AliveEvent 76
AssociationScript 34, 42, 43, 48
binary action 20, 43
discovery event 46, 58, 60–65, 71, 72, 75
discovery monitor 30, 33–35, 37, 39, 42, 43, 46, 54, 58, 59, 63, 73, 76
DiscoveryScript 34, 36, 37, 42, 43, 46, 48–50, 69
event 20, 30, 35, 36, 46, 47, 58–60, 63, 65, 69, 71–73
event class 20
EventBean 46, 47, 59
instance cache 34, 35, 43, 49, 54
instance log 34, 47, 58
instance path 42, 44, 45
91
Appendix A Lists
InstanceID 43, 49
inventory event 46, 47, 59
inventory property 30–33, 35, 36, 39, 46, 54
inventory settings 30–38, 42, 43, 49, 54, 75
InventoryEventHandlerBean 46, 47, 59, 63
InventoryEventQueue 46, 47, 59, 63, 65, 69, 71
KeyPropertyOrder 36, 37, 42, 46, 48
model index 37, 39
model instance 37
ModellerBean 47
monitor 20, 30, 42, 46, 58, 73
ParentSettingInstanceID 36
Period 20
Repeat 20
rollout 58–61, 63, 64, 66, 69, 71, 72, 76
rule 20, 76
target mask 20, 76
task 20
TaskID 76
update event 46, 58, 63–69, 71, 72
update monitor 30, 34, 35, 46, 47, 54, 58, 63, 65, 71, 73
UpdateManagerBean 47
UpdateMethodDetails 37
UpdatePeriod 35
UpdateScript 32, 34, 37, 46, 48, 50, 51, 69
92
Appendix B
References
[1] ALICE Collaboration, The: The ALICE experiment at the CERN LHC.
In: Journal of Instrumentation Volume 3 (2008), August. – DOI 10.1088/1748–
0221/3/08/S08002
[2] Alloy Discovery.
2011/05/10
http://www.alloy-software.com/discovery, Cited:
[3] Ayat, Masarat: Implementing ITIL - service support in the infrastructure and
service unit of CICT, UTM, Faculty of Computer Science and Information
System, Universiti Teknologi Malaysia, Malaysia, Master’s Thesis, November
2008
[4] Bairavasundaram, Lakshmi N. ; Goodson, Garth R. ; Pasupathy,
Shankar ; Schindler, Jiri: An analysis of latent sector errors in disk drives.
In: Proceedings of the 2007 ACM SIGMETRICS international conference on
Measurement and modeling of computer systems. New York, NY, USA : ACM,
2007 (SIGMETRICS ’07). – ISBN 978–1–59593–639–4, p. 289–300
[5] Bevington, Philip R.: Data Reduction and Error Analysis for the Physical
Sciences. 3rd edition. Mcgraw Hill Higher Education, August 2002. – ISBN
978–0–07–119926–8
[6] Bezroukov, Nikolai: Tivoli Alternatives. http://www.softpanorama.org/
Admin/Tivoli/tivoli_alternatives.shtml, Cited: 2011/05/15
[7] BMC Atrium Discovery Solution. http://www.bmc.com/products/productlisting/BMC-Atrium-Discovery-and-Dependency-Mapping.html, Cited:
2011/05/13
[8] BMC Atrium Discovery Community | ADDM 8.1 | Adding New JDBC Drivers.
http://discovery.bmc.com/confluence/display/81/Adding+New+
JDBC+Drivers, Cited: 2011/05/14
[9] BMC Atrium Discovery Community | ADDM 8.1 | Hardware Reference Data Page. http://discovery.bmc.com/confluence/display/81/
Hardware+Reference+Data+Page, Cited: 2011/05/13
93
Appendix B References
[10] BMC Atrium CMDB. http://www.bmc.com/products/product-listing/
atrium-cmdb.html, Cited: 2011/05/13
[11] Boyer, Brent:
Robust Java Benchmarking, Part 1: Issues.
June
2008.
http://www.ibm.com/developerworks/java/library/jbenchmark1/index.html, Cited: 2011/04/08
[12] Upper Camel Case.
2011/05/10
http://c2.com/cgi/wiki?UpperCamelCase, Cited:
[13] CIM Website. http://www.dmtf.org/standards/cim, Cited: 2011/02/14
[14] CMDBuild. http://www.cmdbuild.org, Cited: 2011/05/06
[15] Inventory - CMDBuild.
http://www.cmdbuild.org/the-project-1/
details/inventory, Cited: 2011/05/06
[16] Crocker, D. ; Overell, P.: Augmented BNF for Syntax Specifications:
ABNF / Internet Engineering Task Force. January 2008. http://tools.
ietf.org/html/rfc5234. – RFC Standard 5234
[17] Appendix V.Uncertainties and Error Propagation. http://physicslabs.
phys.cwru.edu/MECH/Manual/Appendix_V_Error%20Prop.pdf,
Cited:
2011/05/20. – Appendix to the Lab Manual of the Physics Mechanics Labs,
Case Western Reserve University
[18] Data model - Wikipedia, the free encyclopedia. http://en.wikipedia.org/
wiki/Data_model, Cited: 2011/05/17
[19] Distributed Management Task Force (publ.):
CIM Infrastructure Specification. Version 2.5.0. Distributed Management Task Force,
http://www.dmtf.org/sites/default/files/standards/documents/
DSP0004_2.5.0.pdf
[20] Distributed Management Task Force (publ.): CMDBf Specification.
Version 1.0.1. Distributed Management Task Force, http://www.dmtf.org/
sites/default/files/standards/documents/DSP0252_1.0.1_0.pdf
[21] DMI Website. http://www.dmtf.org/standards/dmi, Cited: 2011/05/14
[22] Home | DMTF. http://www.dmtf.org, Cited: 2011/05/16
[23] Droms, P.: Dynamic Host Configuration Protocol / Internet Engineering Task
Force. March 1997. http://tools.ietf.org/html/rfc2131. – RFC Draft
Standard 2131
94
Appendix B References
[24] easyCMDB Home. http://www.easycmdb.co.nz, Cited: 2011/05/10
[25] easyCMDB - Database Federator. http://www.easycmdb.co.nz/Federator.
php, Cited: 2011/05/10
[26] easyCMDB - Frequently Asked Questions. http://www.easycmdb.co.nz/
FAQ.php, Cited: 2011/05/10
[27] Free software (disambiguation). http://en.wikipedia.org/wiki/Free_
software_(disambiguation), Cited: 2011/05/16
[28] FusionInventory. http://fusioninventory.org, Cited: 2011/05/10
[29] FusionInventory Features. http://forge.fusioninventory.org/projects/
fusioninventory/wiki/FusionInventory_Features, Cited: 2011/05/10
[30] Giese, Holger ; Seibel, Andreas ; Vogel, Thomas: A Model-Driven Configuration Management System for Advanced IT Service Management. In:
Bencomo, Nelly (publ.) ; Blair, Gordon (publ.) ; France, Robert (publ.)
; Jeanneret, Cedric (publ.) ; Munoz, Freddy (publ.): Proceedings of the
4th International Workshop on [email protected] at the 12th IEEE/ACM International Conference on Model Driven Engineering Languages and Systems
(MoDELS 2009), Denver, Colorado, USA Vol. 509, CEUR-WS.org, October
2009 (CEUR Workshop Proceedings). – ISSN 1613–0073, p. 61–70
[31] GLPI - Gestionnaire libre de parc informatique. http://www.glpi-project.
org/spip.php?lang=en, Cited: 2011/05/10
[32] Features List of GLPI.
http://www.glpi-project.org/spip.php?
article53, Cited: 2011/05/10
[33] HealthMonitor official website.
2011/05/10
http://www.health-monitor.com, Cited:
[34] Hermann, Marian: Object-Relational Mapping for the Common Information Model, Kirchhoff Institute for Physics, Heidelberg University, Germany,
Diploma Thesis, 2010
[35] Hermann, Marian ; Haaland, Øystein S. ; Lara, Camilo ; Ulrich, Jochen
; Röhrich, Dieter ; Kebschull, Udo: Object-Relational Mapping for the
Common Information Model. – Submitted to the DMTF workshop Systems
and Virtualization Management 2011, http://www.dmtf.org/svm11
[36] Hibernate - JBoss Community.
2011/05/16
http://www.hibernate.org, Cited:
95
Appendix B References
[37] HP Discovery and Dependency Mapping software. https://h10078.www1.
hp.com/cda/hpms/display/main/hpms_content.jsp?zn=bto&cp=1-11-1525^767_4000_100__, Cited: 2011/05/15
[38] HP Universal CMDB software. https://h10078.www1.hp.com/cda/hpdc/
display/main/download_pdf_unprotected.jsp?zn=bto&cp=54_4000_100,
Cited: 2011/05/15
[39] HP Universal CMDB software.
https://h10078.www1.hp.com/
cda/hpms/display/main/hpms_content.jsp?zn=bto&cp=1-11-1525^1059_4000_100__, Cited: 2011/05/15
[40] IBM - Tivoli Asset Discovery for Distributed - Software. http://www.ibm.
com/software/tivoli/products/asset-discovery-distributed, Cited:
2011/05/14
[41] IBM Tivoli Application Dependency Discovery Manager. http://www-01.
ibm.com/software/tivoli/products/taddm, Cited: 2011/05/13
[42] IBM - IT Asset Management software - Tivoli Asset Management for IT. http:
//www.ibm.com/software/tivoli/products/asset-management-it, Cited:
2011/05/14
[43] IBM - Tivoli Configuration Manager. http://www-01.ibm.com/software/
tivoli/products/config-mgr, Cited: 2011/05/14
[44] IBM Tivoli Configuration Manager - User’s Guide for Inventory - Collecting
custom information with Inventory. http://publib.boulder.ibm.com/
infocenter/tivihelp/v3r1/index.jsp?topic=/com.ibm.tivoli.itcm.
doc/invug79.htm, Cited: 2011/05/14
[45] IBM Tivoli Configuration Manager - Release Notes - Supported databases.
http://publib.boulder.ibm.com/infocenter/tivihelp/v3r1/
index.jsp?topic=/com.ibm.tivoli.itcm.doc/rn422mst32.htm,
Cited:
2011/05/14
[46] IBM - Integrated Service Management software, IBM Tivoli. http://www.
ibm.com/software/tivoli, Cited: 2011/05/14
[47] IT Service Management Forum (publ.): ITIL Version 3 Glossary
of Terms and Definitions. v01, 30 May 2007. IT Service Management
Forum, http://www.itil-officialsite.com/nmsruntime/saveasdialog.
aspx?lID=910&sID=242
[48] ITIL Home. http://www.itil-officialsite.com, Cited: 2011/05/16
96
Appendix B References
[49] Oracle and Java | Technologies. http://www.oracle.com/us/technologies/
java, Cited: 2011/05/18
[50] Java EE at a Glance. http://www.oracle.com/technetwork/java/javaee,
Cited: 2011/03/11
[51] Enterprise JavaBeans Technology. http://www.oracle.com/technetwork/
java/javaee/ejb, Cited: 2011/05/18
[52] time : Java Glossary. http://mindprod.com/jgloss/time.html#ACCURACY,
Cited: 2011/04/08
[53] The Java Message Service API - The Java EE 5 Tutorial. http://download.
oracle.com/javaee/5/tutorial/doc/bncdq.html, Cited: 2011/05/18
[54] Introduction to the Java Persistence API - The Java EE 5 Tutorial. http://download.oracle.com/javaee/5/tutorial/doc/bnbpz.html,
Cited: 2011/05/18
[55] Java Sound Resources: FAQ: Performance Issues. http://www.jsresources.
org/faq_performance.html#currenttimemillis, Cited: 2011/04/08
[56] JBoss AS - JBoss Community.
2011/05/18
http://www.jboss.org/jbossas, Cited:
[57] JDisc. http://www.jdisc.com, Cited: 2011/05/10
[58] JDisc FAQ.
http://www.jdisc.com/support/faq#DeviceInformation,
Cited: 2011/05/10
[59] Jähne, Klaus: Management verteilter Systeme und Anwendungen mit dem
Common Information Model, Heidelberg University / Heilbronn University, Germany, Diploma Thesis, February 2003. http://klaus.jaehne.de/
papers/cim-pro.pdf
[60] Joseffson, S.: The Base16, Base32, and Base64 Data Encodings / Internet Engineering Task Force. March 2006. http://tools.ietf.org/html/
rfc4648. – RFC Proposed Standard 4648
[61] Kubiak, Sven: Antwort- und Laufzeitmessungen: Prinzip, Implementierung
und Experimente. GRIN Verlag, August 2007. – ISBN 978–3–638–73207–9
[62] Langthaler, Jürgen: ITIL Configuration Management, Requirements analysis and prototype implementation, Information Systems Institute, Technical
University of Vienna, Austria, Diploma Thesis, September 2007
97
Appendix B References
[63] LANsurveyor. http://www.solarwinds.com/products/LANsurveyor, Cited:
2011/05/10
[64] Lansweeper. http://www.lansweeper.com, Cited: 2011/05/10
[65] Lara Martinez, Camilo E.: The SysMES Framework: System Management
for Networked Embedded Systems and Clusters, Kirchhoff Institute for Physics,
Heidelberg University, Germany, Ph.D. Thesis, May 2011
[66] LicenseMetrics. http://www.licensemetrics.com, Cited: 2011/05/10
[67] Microsoft System Center IT Infrastructure Server Management Solutions.
http://www.microsoft.com/systemcenter/en/us/default.aspx,
Cited: 2011/05/15
[68] System Center Configuration Manager 2007 - Server Management.
http://www.microsoft.com/systemcenter/en/us/configurationmanager.aspx, Cited: 2011/05/15
[69] Configuration Manager 2007 SP2 Supported Configurations.
//technet.microsoft.com/en-us/library/ee344146.aspx,
2011/05/15
http:
Cited:
[70] Network Asset Tracker Pro.
http://www.misutilities.com/networkasset-tracker-pro/index.html, Cited: 2011/05/10
[71] NEWT Professional. http://www.komodolabs.com, Cited: 2011/05/10
[72] Axence nVision.
http://www.axencesoftware.com/index.php?action=
nVision, Cited: 2011/05/10
[73] OCS Inventory NG Web Site. http://www.ocsinventory-ng.org, Cited:
2011/05/06
[74] OCS Inventory NG | Features. http://www.ocsinventory-ng.org/en/
about/features, Cited: 2011/05/06
[75] Plugins:Main - OCS Inventory NG. http://wiki.ocsinventory-ng.org/
index.php/Plugins:Main, Cited: 2011/05/06
[76] Documentation:Server
Requirements
OCS
Inventory
http://wiki.ocsinventory-ng.org/index.php/Documentation:
Server#Requirements., Cited: 2011/05/06
NG.
[77] OCS Inventory NG | Supported OS. http://www.ocsinventory-ng.org/en/
about/features/supported-os.html, Cited: 2011/05/06
98
Appendix B References
[78] OneCMDB. http://www.onecmdb.org, Cited: 2011/05/06
[79] User’s manual V2.0 - MDR - OneCMDB. http://www.onecmdb.org/wiki/
index.php?title=User%27s_manual_V2.0#MDR, Cited: 2011/05/06
[80] Open-AudIT. http://www.open-audit.org, Cited: 2011/05/01
[81] Open-AudIT Features.
2011/05/01
[82] Open-AudIT Server.
2011/05/01
http://www.open-audit.org/about.php, Cited:
http://www.open-audit.org/server.php, Cited:
[83] Open-AudIT Source Code. http://www.open-audit.org/downloads.php,
Cited: 2011/05/01
[84] OpenPegasus. http://www.openpegasus.org, Cited: 2011/05/16
[85] OpenPegasus - Features Status. http://www.openpegasus.org/page.tpl?
CALLER=index.tpl&ggid=799, Cited: 2011/05/16
[86] OpenWBEM Home Page. http://www.openwbem.org, Cited: 2011/05/04
[87] What is Object/Relational Mapping? - JBoss Community.
hibernate.org/about/orm, Cited: 2011/05/16
http://www.
[88] The Perl Programming Language. http://www.perl.org, Cited: 2011/05/18
[89] PHP: Hypertext Preprocessor. http://www.php.net, Cited: 2011/05/18
[90] Python Programming Language - Official Website. http://www.python.org,
Cited: 2011/05/13
[91] 11.1. pickle - Python object serialization.
library/pickle.html, Cited: 2011/05/13
http://docs.python.org/
[92] Quest Management Xtensions - Configuration Manager.
http://www.
quest.com/quest-management-xtensions-device-management-CM, Cited:
2011/05/15
[93] QMX - Configuration Manager - Supported Platforms.
http:
//www.quest.com/quest-management-xtensions-device-managementCM/supported-platforms.aspx, Cited: 2011/05/15
[94] RapidCMDB Home. http://www.ifountain.org/confluence/display/
ifcomm/RapidCMDB+Home, Cited: 2011/05/10
99
Appendix B References
[95] RapidCMDB Solution Architecture.
http://www.ifountain.org/
confluence/display/DOC05/RapidCMDB+Solution+Architecture, Cited:
2011/05/24
[96] RRDtool. http://www.mrtg.org/rrdtool, Cited: 2011/05/13
[97] Spiceworks. http://www.spiceworks.com, Cited: 2011/05/10
[98] Managing Custom Attributes - Spiceworks Community. http://community.
spiceworks.com/help/Managing_Custom_Attributes, Cited: 2011/05/10
[99] Hardware discovery. - Spiceworks Community.
http://community.
spiceworks.com/feature_request/show/Inventory/43?page=1,
Cited:
2011/05/10
[100] Reports Overview - Spiceworks Community.
http://community.
spiceworks.com/help/Sharing_Report_Definitions#SQL,
Cited:
2011/05/10
[101] Spiceworks Requirements - Spiceworks Community. http://community.
spiceworks.com/help/Spiceworks_Requirements, Cited: 2011/05/10
[102] SysMES Website. http://wiki.kip.uni-heidelberg.de/ti/SysMES, Cited:
2011/02/10
[103] Operating system Family share for 11/2010 | TOP500 Supercomputing Sites.
http://www.top500.org/stats/list/36/osfam, Cited: 2011/05/10
[104] Total Network Inventory.
http://www.softinventive.com/products/
total-network-inventory, Cited: 2011/05/10
[105] ISO/IEC JTC1/SC2/WG2 - ISO/IEC 10646 - UCS. http://std.dkuug.dk/
JTC1/SC2/WG2, Cited: 2011/05/20
[106] WBEM | DMTF.
2011/05/04
[107] WBEM Services.
2011/05/16
http://www.dmtf.org/standards/wbem,
Cited:
http://wbemservices.sourceforge.net,
Cited:
[108] WBEM Services Source Code.
http://sourceforge.net/scm/?type=
cvs&group_id=26421, Cited: 2011/05/16
[109] Zenoss Community. http://community.zenoss.org, Cited: 2011/05/05
[110] Advantages of Zenoss.
Cited: 2011/05/05
100
http://community.zenoss.org/docs/DOC-5885,
Appendix B References
[111] Zenoss Data Stores. http://community.zenoss.org/docs/DOC-3788, Cited:
2011/05/05
[112] Zenoss Core - Open Source IT Management. http://community.zenoss.
org/docs/DOC-2614, Cited: 2011/05/05
[113] Zenoss Developer’s Guide - 8.1 Device Management. http://community.
zenoss.org/docs/DOC-3804, Cited: 2011/05/05
[114] Zenoss Administration - 3.1 How Does Zenoss Model Devices?
community.zenoss.org/docs/DOC-4808, Cited: 2011/05/05
http://
[115] Zenoss Community: ZenPacks. http://community.zenoss.org/community/
zenpacks, Cited: 2011/05/05
[116] Zenoss Extended Monitoring - 30.1 Distributed Collector.
community.zenoss.org/docs/DOC-8199, Cited: 2011/05/05
http://
[117] Zenoss Enterprise. http://www.zenoss.com/product/zenoss_enterprise,
Cited: 2011/05/05
[118] ZODB - a native object database for Python. http://www.zodb.org, Cited:
2011/05/13
101
Appendix C
Erklärung (Statement of Authorship)
Erklärung:
Ich versichere, dass ich diese Arbeit selbstständig verfasst habe und keine anderen
als die angegebenen Quellen und Hilfsmittel benutzt habe.
Heidelberg, den 24. Mai 2011
....................................
Jochen Ulrich
103